Article

Automation System for the Flexible Sample Preparation for Quantification of Δ9-THC-D3, THC-OH and THC-COOH from Serum, Saliva and Urine

1
Institute of Automation, Faculty of Computer Science and Electrical Engineering, University of Rostock, 18119 Rostock, Germany
2
Beckman Coulter Life Sciences, Indianapolis, IN 46268, USA
3
Center for Life Science Automation, University of Rostock, 18119 Rostock, Germany
*
Author to whom correspondence should be addressed.
Appl. Sci. 2022, 12(6), 2838; https://doi.org/10.3390/app12062838
Submission received: 14 February 2022 / Revised: 8 March 2022 / Accepted: 9 March 2022 / Published: 10 March 2022
(This article belongs to the Special Issue Robotics in Life Science Automation)

Abstract

:
In the life sciences, automation solutions are primarily established in the field of drug discovery. However, there is also an increasing need for automated solutions in the field of medical diagnostics, e.g., for the determination of vitamins, medication or drug abuse. While the actual metrological determination is highly automated today, the necessary sample preparation processes are still mainly carried out manually. In the laboratory, flexible solutions are required that can be used to determine different target substances in different matrices. A suitable system based on an automated liquid handler was implemented. It has been tested and validated for the determination of three cannabinoid metabolites in blood, urine and saliva. To extract Δ9-tetrahydrocannabinol-D3 (Δ9-THC-D3), 11-hydroxy-Δ9-tetrahydrocannabinol (THC-OH) and 11-nor-9-carboxy-Δ9-tetrahydrocannabinol (THC-COOH) from serum, urine and saliva both rapidly and cost-effectively, three sample preparation methods automated with a liquid handling robot are presented in this article, the basic framework of which is an identical SPE method so that they can be quickly exchanged against each other when the matrix is changed. If necessary, the three matrices could also be prepared in parallel. For the sensitive detection of analytes, protein precipitation is used when preparing serum before SPE and basic hydrolysis is used for urine to cleave the glucuronide conjugate. Recoveries of developed methods are >77%. Coefficients of variation are <4%. LODs are below 1 ng/mL and a comparison with the manual process shows a significant cost reduction.

1. Introduction

In contrast to industrial applications, automation solutions in life science applications are not yet widespread. The development of automated systems has long been driven by the pharmaceutical industry’s need for faster and more efficient drug discovery. A large proportion of fully automated systems are already in use here. In contrast, the automation of classic laboratory processes is still in its infancy. Metrological processes are usually highly automated. Extensive sample preparation processes are often used to ensure optimal separation of the target substances from the surrounding matrices and to protect the analytical devices used from contamination. These sample preparation methods include extractions, centrifugations, purifications, changing the composition of solvents or derivatizations. If compounds are to be determined in biological matrices, additional methods, e.g., for the separation of proteins, may be required. The preparation and processing of samples are still usually performed manually today. On the one hand, this limits the number of samples that can be processed, but on the other hand, personnel is also brought into contact with sometimes dangerous or infectious materials. Due to the repetitive activities, there are also problems regarding work ergonomic issues.
The applications that are becoming increasingly important include the determination of Δ9-tetrahydrocannabinol (THC) and its metabolites in different biological matrices. THC is the most commonly used drug of abuse [1], and the increasing use of (synthetic) cannabinoids as therapeutic agents, for example, in cancer and pain therapy [2,3], as well as the trend of using cannabinoids in cosmetics and food lead to an increased need for suitable detection methods [4].
Depending on the aim of the investigation, different matrices, such as blood, serum or plasma, urine, saliva and hair can be used for the quantitative determination of cannabis metabolites. The choice of the matrix depends on the type of possible sampling (invasive/non-invasive) and the detectability/half-life of the analytes in the respective matrix, which is primarily determined by the metabolism of THC. The three primary metabolites are Δ9-tetrahydrocannabinol (THC), 11-hydroxy-Δ9-tetrahydrocannabinol (THC-OH) and 11-nor-9-carboxy-Δ9-tetrahydrocannabinol (THC-COOH).
Δ9-tetrahydrocannabinol acid A (THCA-A), which occurs naturally in hemp, is converted to Δ9-tetrahydrocannabinol by decarboxylation when smoked and is absorbed by the body, where it exerts its intoxicating effects. THC is metabolized in the liver by cytochrome P-450 enzymes into 11-hydroxy-Δ9-tetrahydrocannabinol, which is also psychoactive [5,6]. Oxidation produces the third metabolite commonly used to detect cannabis use, 11-nor-9-carboxy-Δ9-tetrahydrocannabinol. THC-COOH is not psychoactive and is glucuronidated and excreted by a phase 2 metabolism in the kidneys [7,8].
According to this metabolic pathway, saliva is mainly used for the detection of Δ9-THC, since the metabolites THC-OH and THC-COOH enter saliva through the mucous membranes only in low concentrations (<0.5 ng/mL) [9,10] whereas the THC concentration in saliva shortly after inhalation of a cannabis cigarette can be up to 1000 ng/mL [11]. Therefore, saliva is mainly suitable for detecting the just preceding cannabis consumption [12,13]. Besides THC, mainly THC-COOH is detectable in plasma. Both metabolites are bound to plasma proteins. The high lipophilicity of THC and THC-OH causes the high tissue mobility and subsequent storage of the analytes in the adipose tissue, and at the same time lowers the concentration of the metabolites in the body fluids and enables the long detectability of previous cannabis use due to the gradual release of the stored cannabinoids from the adipose tissue [14,15,16].
However, most ingested THC, approximately 80–90%, is excreted within the first 5 days, in the form of its metabolites THC-OH and THC-COOH [17]; 65% is excreted in the feces (mainly THC-OH) and 20% (mainly THC-COOH) is excreted in the urine [15,18]. To facilitate excretion, some of the metabolites are glucuronidated, which leads to an increase in the lipophilic metabolites’ water solubility [16].
Accordingly, urine and feces are also suitable for detecting THC consumption, as they contain the metabolites of THC. A disadvantage of urine compared to saliva is that urine sampling is usually not performed under visual control to maintain privacy, so there is a risk of sample falsification, for example, by exchanging samples or diluting the sample [19]. This problem does not exist when saliva is used. Specimen delivery can be performed directly under the supervision of the specimen collector [20]. A significant advantage of urine and saliva is the non-invasiveness of sample collection, which is not present when using blood, plasma, or serum.
Quantification of THC and metabolites is currently predominantly performed by liquid chromatography mass spectrometry (LC-MS) [21] or liquid chromatography tandem mass spectrometry (LC-MS/MS) [22,23,24,25,26,27,28,29,30], as analysis times are short and no derivatization is required compared to the previously used gas chromatography mass spectrometry (GC-MS) [5] or gas chromatography tandem mass spectrometry (GC-MS/MS) [31,32,33].
However, the quicker analysis time for quantification also implies that sample preparation is increasingly becoming the limiting factor in reducing overall analysis time. Consequently, there is great interest in performing sample preparation methods in an automated manner to increase efficiency. Automation increases throughput, staff availability in times of skill shortages due to hands-off times and reduces errors due to manual sample handling [19].

1.1. Serum, Plasma, Whole Blood

For the purification of serum, plasma, and whole blood samples for the quantification of THC and metabolites, the most commonly used methods are protein precipitation (PPT) [22], solid-phase extraction (SPE) [24], the combination of PPT + SPE [8,21,27,29,32], liquid-liquid extraction (LLE) [25,28,30,31] and online solid-phase extraction [26] are used. Sample preparation can be performed manually [8,27,29,33], partially automated or fully automated.
Toennes et al. manually diluted serum samples and added the internal standard [24]. The subsequent SPE was automated using the GX-274 ASPEC from Gilson Inc. (Middleton, WI, USA). Jagerdeo et al. also automated the extraction step in the form of an online SPE [26]. The preparatory protein precipitation, including centrifugation, concentration, pH adjustment and recentrifugation are performed manually. Full automation of all sample preparation steps, including protein precipitation with centrifugation and final evaporation, was presented by Andersen et al. using a Tecan EVO 200 [21]. Another fully automated method using the Tecan EVO 200 was proposed by Kristoffersen et al. [28]. In the presented method, whole blood samples are automatically prepared by supported liquid extraction (SLE).

1.2. Urine

SPE [10,34,35,36,37,38], LLE [39,40] and SLE [35,41,42] are used most frequently for urine purification in cannabinoid determination. A general increase in sensitivity is achieved in many methods by a concentration step using evaporation [10,36,37,41,42,43,44], while to specifically increase sensitivity for THC-COOH, electrospray ionization is performed in negative mode [45], or by a combination of surface-activated chemical ionization and electrospray ionization [46]. A specific goal in urine sample preparation is to break the bond between glucuronide conjugate and compound, which can be performed by enzymatic hydrolysis with beta-glucuronidase [40] or basic hydrolysis, e.g., with NaOH or KOH, before extraction [10,16,38,47,48,49,50]. For optimal cleavage of the glucuronide conjugate of THC, THC-OH and THC-COOH, tandem hydrolysis (alkaline and enzymatic) has been proposed [3,34,45]. In addition to the numerous manual sample preparation methods [10,37,38,42,47,51], there are only a few fully automated methods. Similar to serum sample preparation, semi-automated methods are already more established, where the extraction step after hydrolysis is taken over by a liquid handler [36,40,52] or replaced by online extraction [48,49]. Examples of full automation include the Prep and Shoot approach proposed by Cabrices et al. in which enzymatic hydrolysis and dilution were performed using the Gerstel MultiPurpose Sampler [53], or the methods of Gundersen et al. and the applications of Biotage and Tecan [41,43] in which the sample preparation steps of hydrolysis, SLE or SPE, and evaporation are performed using the Tecan Freedom Evo 100 liquid handling system.

1.3. Saliva

For the extraction of THC and metabolites from saliva, SPE [10,54,55,56], LLE [57,58], SLE [19,59] or MEPS (Microextraction by packed sorbents), which are immobilized in a syringe [60] are used. In some methods, a PPT with centrifugation is additionally performed before the extraction [60,61,62] or a dilution is performed [54]. Coulter et al. also performed basic hydrolysis prior to the SPE to cleave off the glucuronide conjugate [56]. Sample preparation is mostly performed manually [10,56,57,58,60,61,62,63]. Choi, Badawi and Choncheiro et al. use automated extractions with the Gilson AspecXL or the Zymark Rapid Trace. The subsequent evaporation step is again performed manually [54,55,64]. Only in the sample preparation method presented by Valen et al. both, SLE and the subsequent evaporation are fully automated on the Tecan Freedom EVO 200 [19].
Due to the increasing demand for the determination of THC and its metabolites, there is a need to develop suitable systems that allow fully automated sample preparation. The goal is primarily to develop flexible concepts that allow adaptation to different matrices and ideally also to different applications and target substances to be detected without major changes to the overall system. Minor adaptations of the required methods (e.g., labware, pre-connection of a PPT) are unavoidable due to the different and complex composition of matrices for sensitive detection of analytes but should be considered in the system concept. Solid-phase extraction-based methods are becoming increasingly important in sample preparation. The procedures can be easily automated. By choosing suitable solid phase materials, adaptation to different target substances is easily possible. Thus, we describe the development and validation of a flexible system based on a Biomek i7 liquid handling platform.

2. Materials and Methods

2.1. Chemicals and Reagents

The following compounds were purchased from Merck KGaA (Darmstadt, Germany): 11-nor-9-carboxy-Δ9-THC-D3, 11-hydroxy-Δ9-THC-D3, Δ9-THC-D3, 11-nor-9-carboxy-Δ9-THC, 11-hydroxy-Δ9-THC, 11-nor-Δ9-THC-9-carboxylic acid glucuronide solution, zinc sulfate solution, Artificial Saliva for Pharmaceutical Research, and Sigmatrix Urine Diluent. We used porcine serum samples obtained from the State Office for Agriculture, Food Safety and Fishing (LALLF, Rostock, Germany) as serum samples. Methanol and formic acid in LC-MS grade, acetonitrile in gradient grade quality, and acetic acid 100% were obtained from Carl Roth GmbH (Karlsruhe, Germany). Ammonium formate solution was purchased from Agilent Technologies (Santa Clara, CA, USA). High purity water was obtained using a Milli-Q system (Merck Millipore, Darmstadt, Germany).
For the preparation of the internal standard, a stock solution containing 10 mg/mL of 11-nor-9-carboxy-Δ9-THC-D3 and 11-hydroxy-Δ9-THC-D3 in acetonitrile and a 10 mg/mL analyte stock solution consisting of Δ9-THC-D3, 11-nor-9-carboxy-Δ9-THC, and 11-hydroxy-Δ9-THC was first prepared. For validation of the urine sample preparation method, an additional 10 mg/mL of 11-nor-Δ9-THC-9-carboxylic acid glucuronide was added to the analyte solution. The stock solutions were used to prepare the internal standard solution according to the dilution factor of each method. Stock solutions were stored in glass vials at −15 °C. The internal standard solution was prepared daily from stock solutions. According to the manufacturer, the analytes are stable for up to 4 weeks at different temperatures in the range of −15 °C to 40 °C [65].

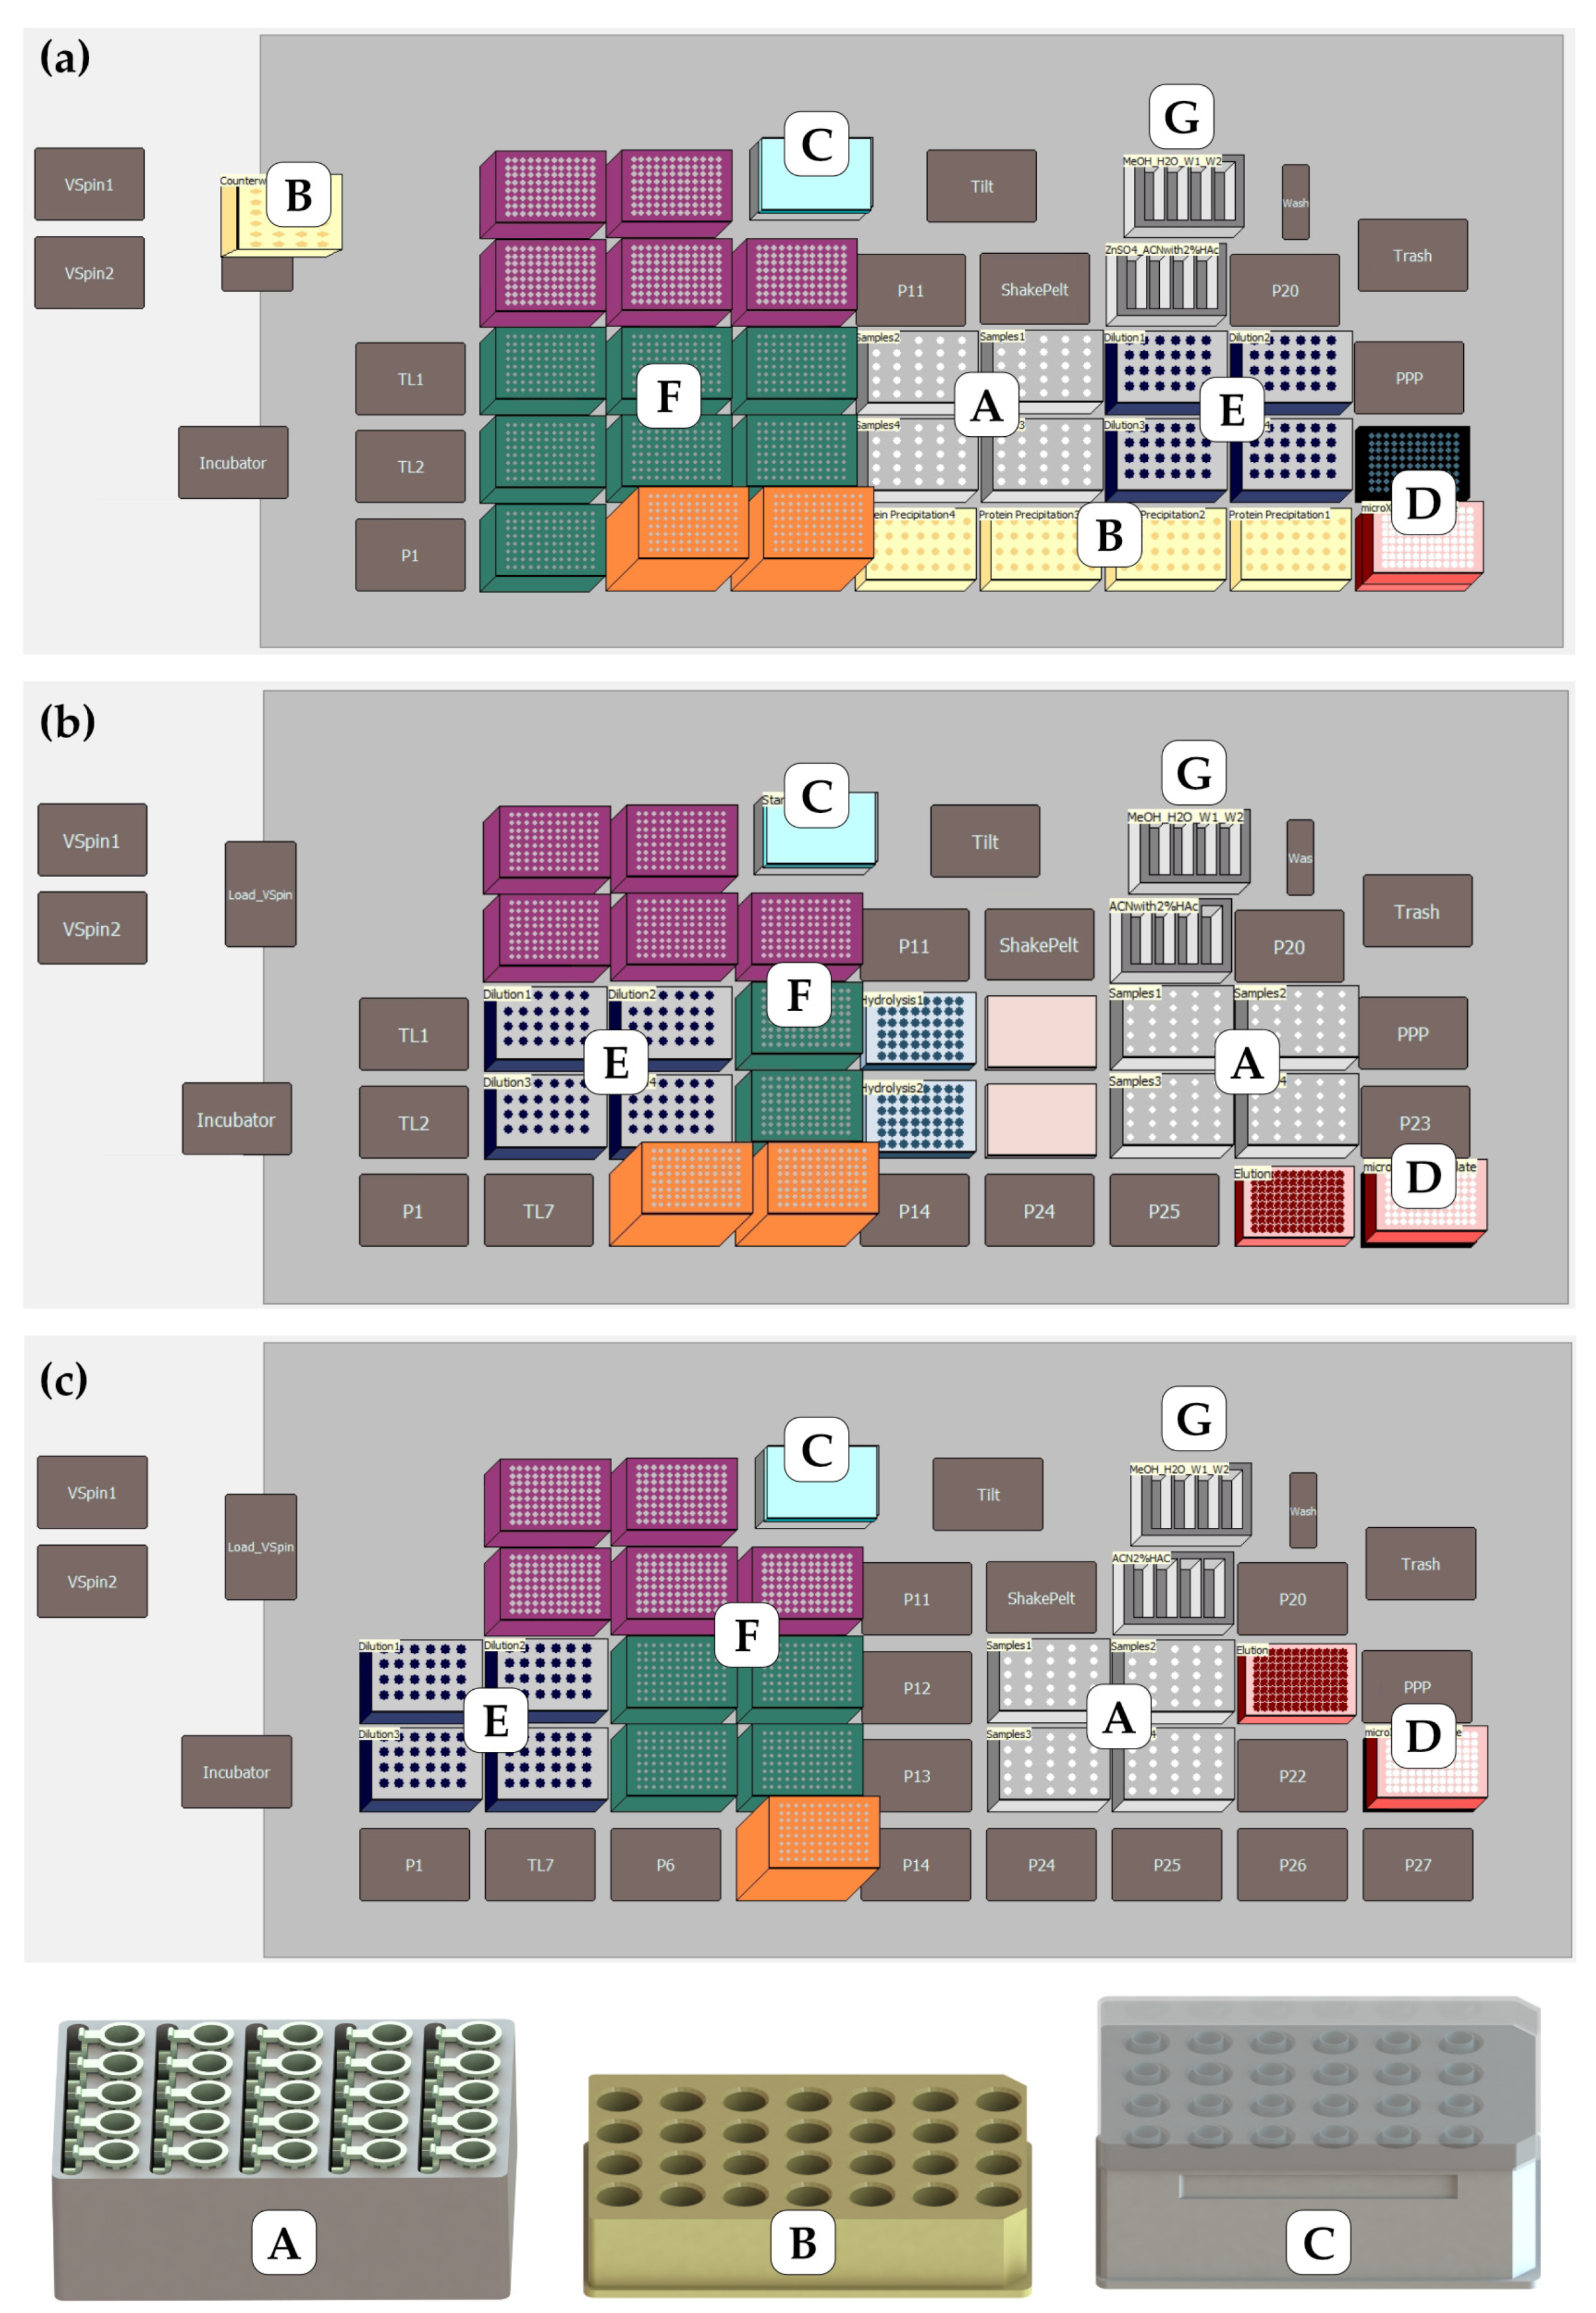
2.2. Instrumentation for Automatic Sample Preparation

A Biomek i7 workstation (Beckman Coulter Life Sciences, Indianapolis, IN, USA) was used for sample preparation. For optimal preparation of serum, urine and saliva samples, the workstation was complemented by a VSpin centrifuge (Agilent Technologies, Santa Clara, CA, USA), an Incubator Shaker, a Static and Shaking Peltier for Biomek 4000 Fx Nx (all INHECO Industrial Heating & Cooling GmbH, Martinsried, Germany), a Positive Pressure Unit V4, a Self Refilling Quarter Reservoir and a 3D Tilting ALP (all amplius GmbH, Rostock, Germany, see Figure 1).
The integrated devices are accessible from at least one of the two gripper arms of the Biomek i7 workstation (Beckman Coulter Life Sciences, Indianapolis, IN, USA), enabling a fully automated sample preparation process. Serum, urine, or saliva samples were provided in 1.5 mL vials (Eppendorf AG, Hamburg, Germany) in a custom designed adapter (amplius GmbH, Rostock, Germany) provided with a fixation for the lids on the deck. The standards were stored in 1.5 mL glass vials (Agilent Technologies, Santa Clara, CA, USA) in a special aluminum adapter (amplius GmbH, Rostock, Germany) for cooling and reduction of evaporation on the Static Peltier ALP and closed with a lid. The glacial acetic acid required for the urine method was also stored in this adapter. 1.5 mL vials were also used for protein precipitation and held in place in a centrifugable adapter (amplius GmbH, Rostock, Germany). The choice of labware for hydrolysis was subject to the height restriction of the incubator (max. 23 mm), the relatively high sample volume of 870 µL and the goal of being able to process as many samples as possible simultaneously. The 48-well CellCulture Plate (Nunc/ThermoFisher, Waltham, MA, USA) was chosen as the best solution to satisfy these three requirements. The Strata X-C µElution 96-well SPE plate was used for the extraction. The eluate was collected in a 96-well Collection Plate (350 µL; conical) (both plates Phenomenex, Torrance, CA, USA). Purified samples were provided in the autosampler in 1.5 mL glass vials (Agilent Technologies, Santa Clara, CA, USA). Pipette tips of 90, 230 and 1070 µL (Beckman Coulter Life Sciences, Indianapolis, IN, USA) were used for liquid transfer.

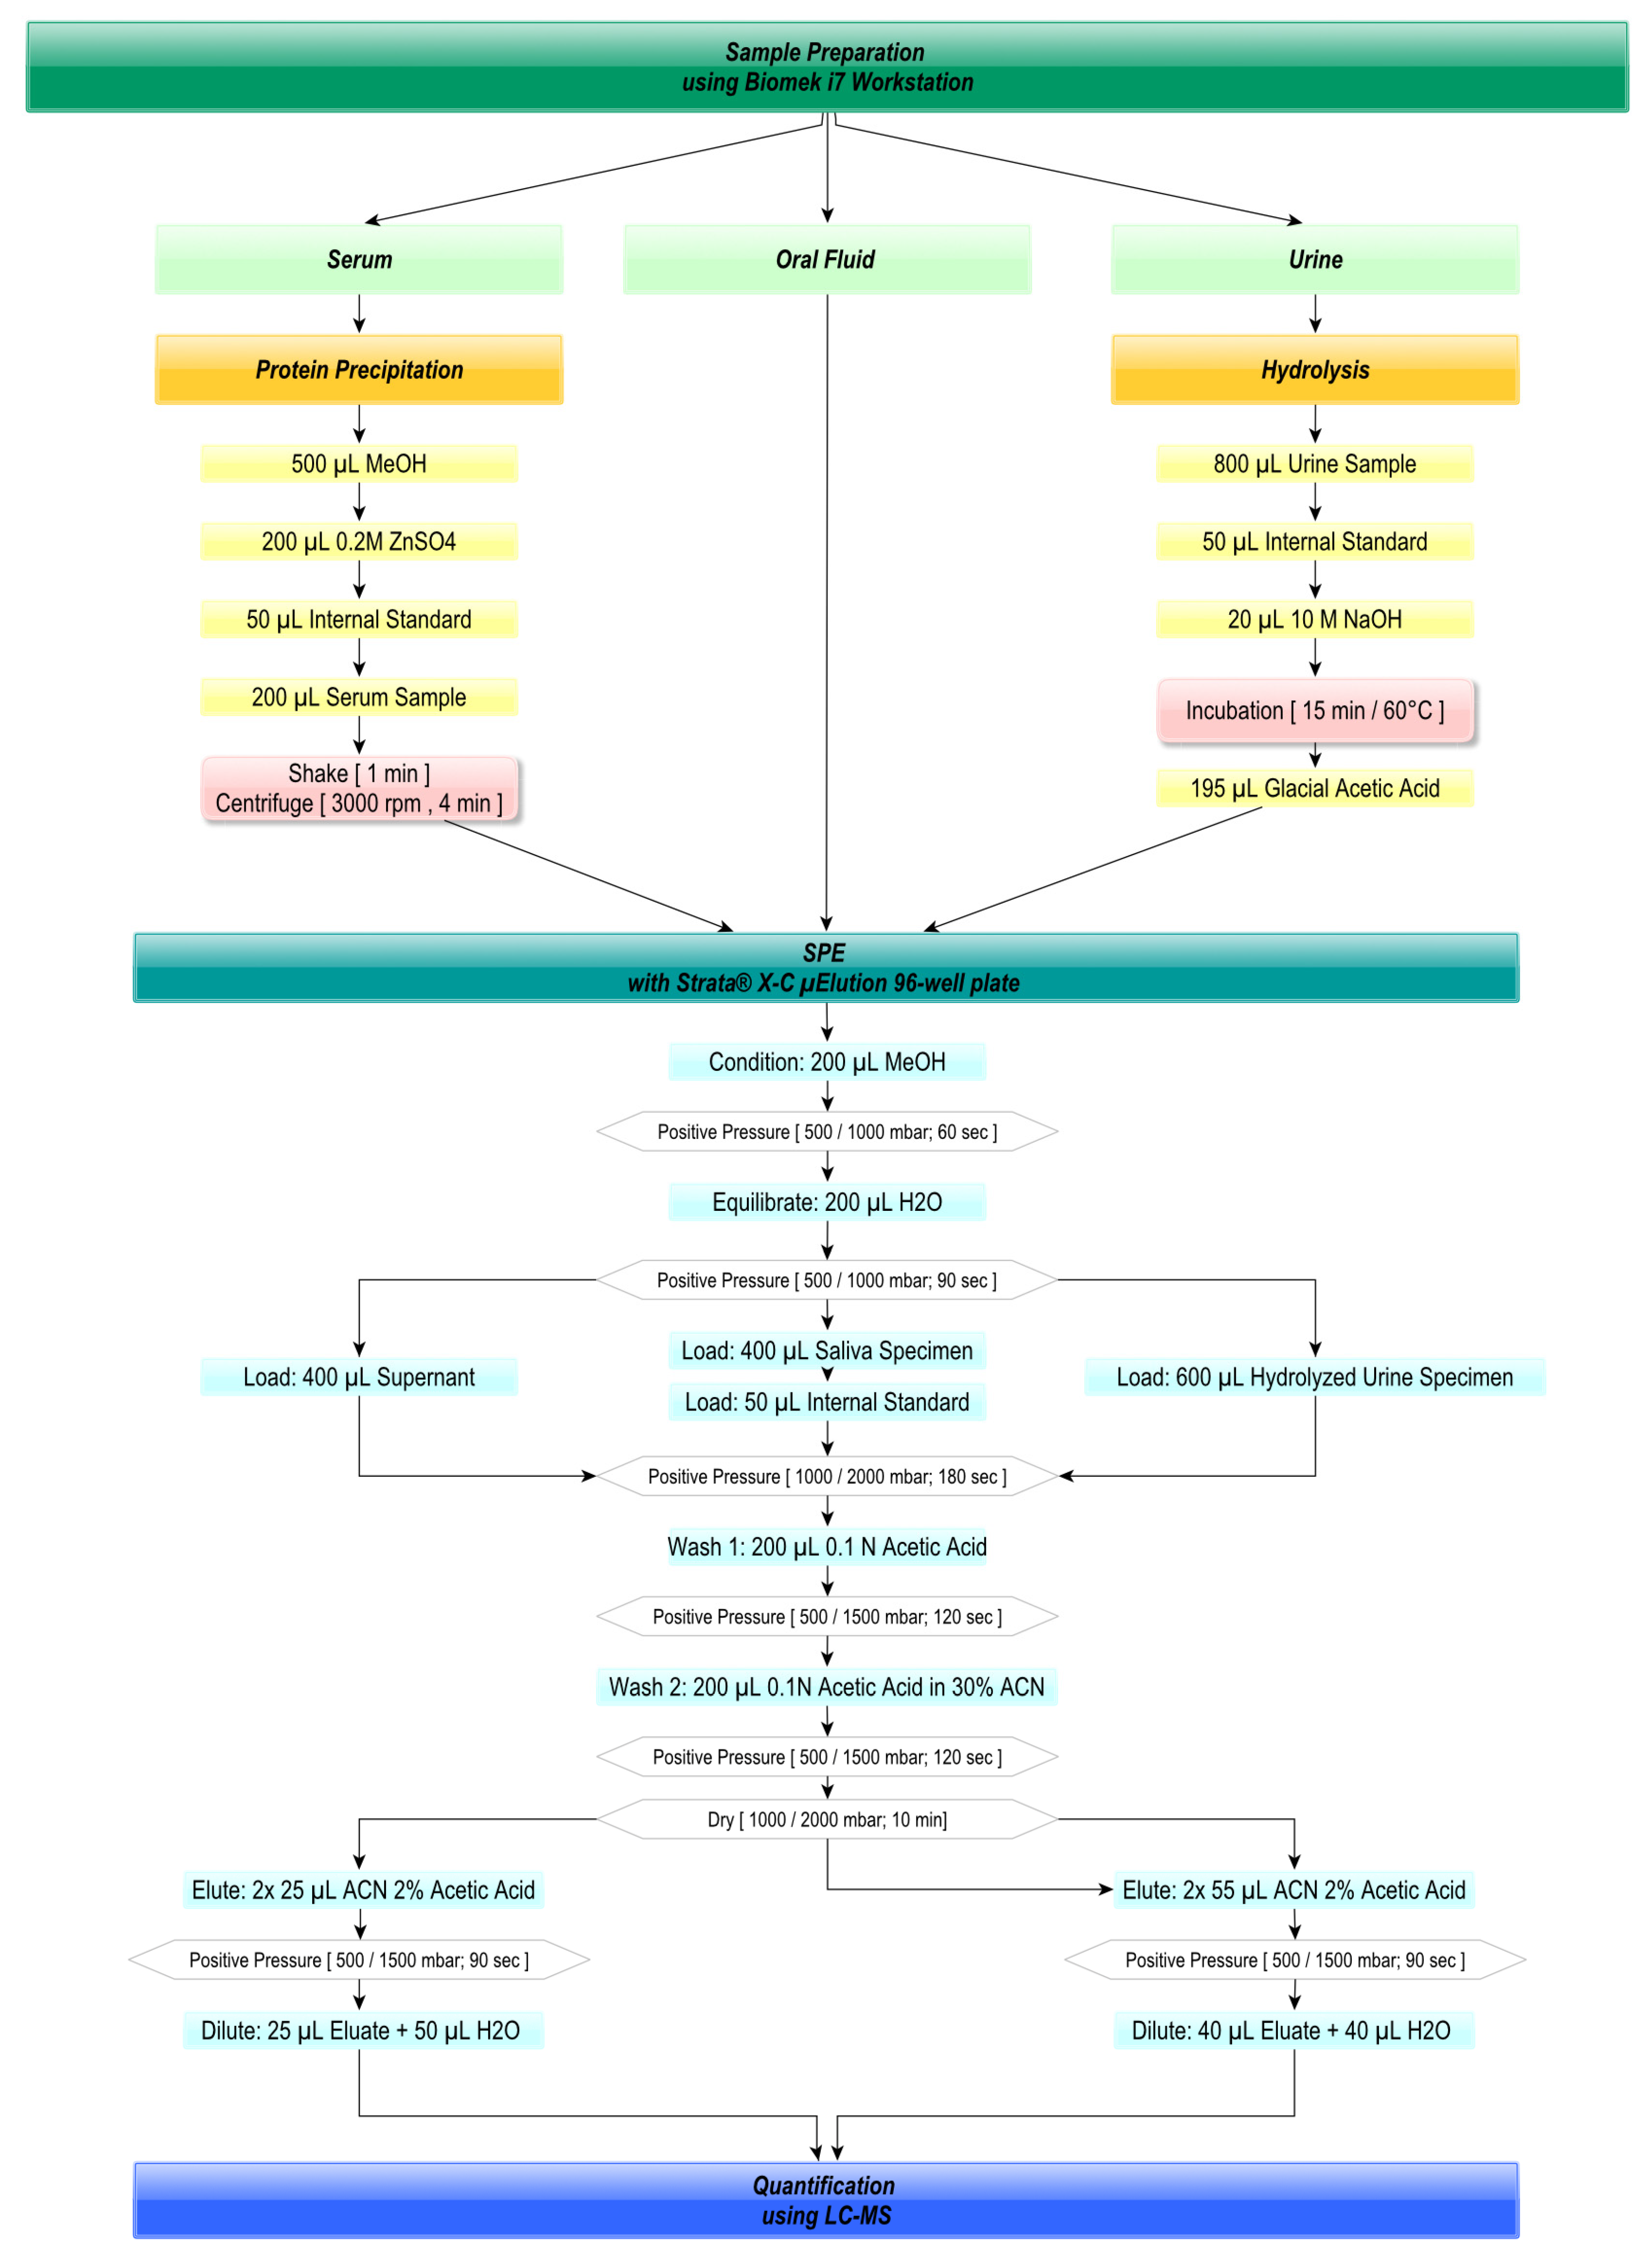
2.3. Automated Sample Preparation

All sample preparation steps were performed using the Biomek i7 Workstation. The work steps for the serum, saliva and urine matrices are summarized in Figure 2. A separate method was created for each matrix, but the basis of the three methods is a solid-phase extraction using the Strata X-C µElution Plate (Phenomenex, Torrance, CA, USA).
Saliva samples were loaded directly onto the SPE plate without further sample preparation methods. For the purification of urine samples, additional hydrolysis was performed prior to SPE to cleave off the glucuronide conjugate, whereas, for serum samples, protein precipitation was performed to precipitate the proteins present in the serum.
For protein precipitation, 500 µL MeOH from the Self Refilling Quarter Reservoir (see Figure 1) and 200 µL 0.2 M ZnSO4 to improve protein aggregation from an additional 40 mL reservoir are pipetted with the Span-8 Pipetting Head into 1.5 mL glass vials provided for protein precipitation (see Figure 2). Subsequently, the aluminum adapter was transported from the Static Peltier ALP to the 3D Tilting ALP, which was tilted 10° and the standard was aspirated. The aim of tilting was to enable the robot to empty vials with valuable liquids as completely as possible. An alternative was 1.5 mL High Recovery Vials (Agilent Technologies, Santa Clara, CA, USA), which were used in the urine and saliva method to expedite the pipetting process but are only suitable to provide small sample volumes (in our case 50 µL internal standard). The serum sample was added last, to allow rapid in-pipette mixing during the previous transfer steps without clogging. For optimal mixing and dissolution of plasma protein-bound analytes, the vials are shaken on the Shake Peltier ALP for 1 min at 1500 rpm orbital rotation; then transported to the centrifuge and centrifuged for 4 min at 3000 rpm. At the same time, the solid phase extraction cycle starts with the conditioning and equilibration of the sorbent bed, so that after centrifugation the supernatant can be removed directly and transferred to the SPE plates. A similar procedure was used for basic hydrolysis in the preparation of urine samples. After adding 800 µL urine, 50 µL internal standard and 20 µL NaOH and loading the incubator with the hydrolytic sample filled Greiner 48 well plate, the SPE process starts during the 15-min incubation time. At the end of the incubation at 60 °C, the 48 well Greiner plate was removed by the second gripper arm of the Biomek i7 workstation and the basic hydrolysate was neutralized by the addition of 195 µL of glacial acetic acid, which was stored in the refrigerated aluminum adapter on the Static Peltier ALP, as were the standards. For saliva, 50 µL of internal standard was added directly to the already applied 400 µL saliva sample in the wells of the Strata X-C µElution Plate.
After the Load step, the sorbent was washed in two steps each with 200 µL of 0.1 N Acetic Acid in H2O and 200 µL of 0.1 N Acetic Acid in acetonitrile. The purified analytes in the sorbent bed were eluted by a 2-fold transfer of 2% Acetic Acid in acetonitrile with 25 µL each for serum samples and 55 µL for saliva and urine samples to increase recovery.
Between all liquid transfers, positive pressure is applied to the Strata X-C µElution plate using the Positive Pressure Unit V4.
In preparation for injection with the LC-MS autosampler, samples eluted into an MTP plate were transferred to 1.5 mL glass vials with micro vial inserts to complete sample preparation, containing either 25 µL (serum) or 40 µL (saliva; urine) eluate. Finally, water was added to the eluate to correspond with the mobile phase. The deck layouts created with the Biomek software for the preparation of 96 serum, urine and saliva samples are shown in Figure 3.
The pipetting and transport parameters of the Biomek i7 Workstation were carefully optimized for each transfer step to achieve the highest possible reproducibility and accuracy of results and to ensure the highest possible process reliability. An example of this optimization is the greatly reduced aspiration speed for gentle removal of supernatant after centrifugation of serum samples or when pipetting viscous samples.
In this context, the calibration required for the quantification of the samples was also pipetted by the Biomek i7 Workstation in order to exclude possible deviations in the pipetting volume, for example, due to deviating handling of slightly running or viscous liquids and a deviating transferred liquid volume from the beginning.
Achieving the highest possible overall concentration factor was the objective when choosing method parameters but especially the volume parameters (see Figure 2) were subject to several restrictions.
In protein precipitation, the maximum possible volume was limited to 1.5 mL (due to the 1.5 mL vials suitable for centrifugation). A higher ratio of organic solvent to sample results in more stable protein aggregation. This has a direct impact on the removal of the supernatant. To ensure a high concentration rate, a maximum sample volume should be transferred to the sorbent bed without any protein aggregate contaminations. A total volume of 950 µL including a 200 µL serum sample was found to be most suitable (as previously shown in [66]). Volumes used for hydrolysis were determined based on very similar constraints.
For the saliva method, the final 400 µL load volume was found to be the best option between maximizing the load volume and not overloading the sorbent bed. Again, elution was performed using the smallest volume possible. For serum, a total elution volume of 50 µL acetonitrile was sufficient for complete elution of analytes, whereas in the saliva and urine method the double addition of 55 µL acetonitrile was necessary. The final mixing step of eluate and water was identified as a trade-off between the maximum volume withdrawable from the plate and the minimum filling level of 1.5 mL vials required in the autosampler. Since a higher volume was used for eluting urine and saliva samples, this was also used and transferred (e.g., for multiple injections).

2.4. Liquid Chromatography Conditions

The chromatographic system consisted of a 1260 Binary Pump, a 1290 Multisampler and a TCC SL column oven from Agilent Technologies (Santa Clara, CA, USA). The column used was the Zorbax Extend C18, Rapid Resolution HAT, 2.1 × 50 mm, 1.8-micron, 600 bar from Agilent Technologies (Santa Clara, CA, USA). The column temperature was 50 °C at a constant flow of 0.4 mL/min. Mobile phase A consisted of 5 mM ammonium formate in water containing 0.1% formic acid and mobile phase B consisted of 5 mM ammonium formate in methanol containing 0.1% formic acid. A gradient elution with the following composition was used: 0–0.1 min 65% B, 0.1–5.5 min 65–95% B, 6–6.5 min 95% B, and 6.5–10 min 95–65% B to ensure column re-equilibration. The injection volume was 10 µL.

2.5. Mass Spectrometry

Mass spectrometry was performed using a Q-TOF G6540A (Agilent Technologies, Santa Clara, CA, USA). Ionization was performed using an Agilent Jetstream electrospray ion source in positive mode. The following optimized ionization parameters were used: desolvation gas temperature was 350 °C, drying gas flow was 13 L/min, sheath gas temperature was 325 °C, and sheath gas flow was 11 L/min. The Capillary Voltage, Nozzle Voltage and the two applied Fragmentor Voltages were 4500 V, 500 V and 120/150 V, respectively. For the Reference Mass Correction, m/z 121 and 922 were used. Agilent MassHunter Data Acquisition and Quantitative Analysis software were used to perform and analyze the measurements.

2.6. Method Validation

The methods were validated using the parameters of linearity, stability, recovery, within-laboratory precision, measurement precision, limit of detection and limit of quantification [67,68].
Short-term temperature stability was checked for a period of 24 h by multiple injections of a prepared analyte solution stored in glass vials at room temperature. To determine recovery, 25 samples were processed and analyzed according to the sample preparation method. Within-laboratory precision was investigated by preparing 10 samples each on 5 different days. To determine the measurement precision, a sample was measured 25 times. Since the elution volume of 50/110 µL is not sufficient for injecting the sample 25 times, the sample was pooled from 25 samples.
For the determination of the limit of detection and limit of quantification, 10 samples were prepared in which the sample matrix was replaced by water and only the internal standard was added during sample preparation. The analytical limit of detection and limit of quantification was calculated from the mean of the blank value added to three and ten times the standard deviation, respectively. The method detection limit was calculated from the analytical detection limit by dividing by the dilution or concentration factor of the sample preparation method and describes the real detectable concentration in a sample. In analogy, the method quantification limit is calculated by dividing the analytical limit of quantification by the dilution or concentration factor. The dilution factor was 0.56 for the serum sample preparation method, concentration factors were 2.05 for the urine sample preparation method and 1.82 for the saliva sample preparation method.

2.7. Evaluation under Economic Criteria

In order to be able to provide a statement about the economic efficiency of the methods, the costs per sample were calculated and compared with the costs for the manual execution of the sample preparation. For this purpose, the investment costs for the purchase of the equipment, the operating costs and the time required to perform the methods were determined. A more detailed description of the calculation method can be found in [66].

3. Results

3.1. Validation Results

The results of the automated pipetted calibration are shown in Figure 4. The calibration curves are linear and show coefficients of determination of R2 > 0.999. In addition, chromatograms and spectra for the analytes under the respective calibration curve are shown as examples in Figure 4. Samples are stable for the 24 h period required for sample preparation and analysis. Peak area size is not undergoing significant changes in accordance with the manufacturer’s specifications. According to Christophersen and Kneisel et al., the material of the container, plastic and polypropylene or glass is more crucial for the recovery of the analytes, as they are lipophilic and adhere to the walls of polypropylene and plastic containers [69,70].
The results of the validation are shown in Table 1, Table 2 and Table 3. The recoveries for Δ9-THC-D3, THC-OH and THC-COOH from serum range from 94.28% to 104.15% with coefficients of variation between 0.44% and 3.11%. The methodological limits of detection and quantification are 0.156 ng/mL and 0.176 ng/mL for Δ9-THC-D3 from serum, 0.349 ng/mL and 0.384 ng/mL for THC-OH and 0.896 ng/mL and 0.987 ng/mL for THC-COOH, respectively, and are thus higher than the analytical limits of detection and quantification because dilution occurs during sample preparation and is not compensated during SPE. The coefficient of variation of the measurement precision is less than 0.53%.
The recoveries for Δ9-THC-D3, THC-OH and THC-COOH from urine range from 77.54% to 99.64% with coefficients of variation between 1.03% and 3.89%. The method detection and quantification limits are 0.04 ng/mL and 0.111 ng/mL for Δ9-THC-D3 from urine, 0.113 ng/mL and 0.279 ng/mL for THC-OH, and 0.235 ng/mL and 0.531 ng/mL for THC-COOH, which are lower than the detection and quantification limits from serum due to the concentration factor of the urine method. The coefficients of variation of the measurement precision are 0.83% for THC-OH, 1.59% for THC-COOH and 1.22% for Δ9-THC-D3, indicating a slight impairment of the measurement by matrix components still originating from urine or substances introduced during hydrolysis. This is also supported by the slightly lower recoveries from urine, as the recoveries of Δ9-THC-D3, THC-OH and THC-COOH from saliva are also higher than from urine with a range of 89.62% and 108.62% and coefficients of variation between 1.36% and 3.97%. Overall, recoveries from saliva are the highest, indicating slight analyte losses due to previous protein precipitation or hydrolysis. However, these are not serious, stating a satisfactory performance of protein precipitation and bond breakage of THC-COOH and its glucuronide conjugate by basic hydrolysis. The coefficient of variation of the measurement precision of Δ9-THC-D3, THC-OH and THC-COOH from saliva is less than 0.78%. The methodological limits of detection and quantification are 0.037 ng/mL and 0.082 ng/mL for Δ9-THC-D3 from saliva; 0.328 ng/mL and 0.773 ng/mL for THC-OH; and 0.942 ng/mL and 2.247 ng/mL for THC-COOH, and are thus the highest limits of detection and quantification for THC-OH and THC-COOH, despite the concentration factor, indicating increased baseline noise, which may be due to the lack of an additional sample preparation method before SPE.
Overall, the high recoveries demonstrate that automated extraction of Δ9-THC-D3, THC-OH and THC-COOH from the three matrices works well using a similar SPE method. The low limits of detection and quantification indicate that the use of specialized break-up and preparation techniques for the more complex matrices enables the sensitive detection of analytes. The effect of optimizing the method and pipetting parameters of the liquid handling workstation is demonstrated by the low coefficients of variation < 4%.

3.2. Results of Economic Evaluation

With the developed automated sample preparation methods, up to 96 samples (serum, saliva, urine) can be processed in parallel per run and deck. Depending on the cycle time of the method, this results in a maximum number of samples that can be processed per year, which is 72 T samples/year for serum and urine and 192 T samples/year for saliva (see Table 4). Depending on the level of operating and investment costs, the costs per sample are calculated. Costs for automated determination of Δ9-THC-D3 and metabolites from serum are 7.59 €/sample, from urine 6.65 €/sample for urine and 5.93 €/sample for saliva.
For comparison purposes, the number of samples per year obtained with manual methods is calculated. Findings indicate that a laboratory technician can prepare more serum or urine samples per year than the automated setup (serum manual/automated: 100.8 T/72 T; urine manual/automated: 96 T/72 T).
For Saliva, the Biomek i7 can process more samples/year than a lab technician (192 T/115.2 T). Decreased costs per sample for automation (5.93 €/9.58 €) are a direct result of it.
For serum and urine, costs per sample in the automated method (7.59 € and 6.65 €) are less expensive than with the manual method (10.87 € and 11.02 €), despite the lower number of units. This is due to the higher total costs of the manual methods per year (serum m/a: 1.095 T/546 T and urine m/a: 1.058 T/478 T), where the cost driver is the operating costs and in these the high staff costs.
The NPV of automation is with 1.533 T for THC from serum, 2.167 T from urine and 8.920 T from saliva significantly higher than with the manual method with 166 T from serum and 1.247 T from saliva. For manual urine sample preparation, the NPV is even negative at −16 T, which means that a progressive loss is made with the method and this method should not be performed manually. For saliva and serum, the NPV is also comparatively low and close to the level of break-even. The highest automated NPV is reached with the Saliva sample preparation method. In cases of an irrelevant matrix, THC should be determined from saliva rather than from urine or serum.

4. Discussions

In the sample preparation methods presented previously for the serum, urine and saliva matrices, numerous semi-automated methods exist. The hurdle to complete automation is in many cases the subsequent evaporation step. We present a flexible system for fully automated sample preparation in the determination of THC and its metabolites. The system can easily be used for the determination in different matrices, such as serum, urine or saliva. Due to the use of solid-phase extraction, we can avoid time-consuming and error-prone evaporation steps.
Limits of detection and quantification for serum sample preparation methods using LC-MS/MS ranges from 0.05–1.8 ng/mL for Δ9-THC, 0.18–3.2 ng/mL for THC-OH, and 0.05–2.8 ng/mL for THC-COOH [8,22,24,26,27,28,29,30]. The limit of detection and quantification determined by Andersen et al. for Δ9-THC is 0.2 ng/mL and 0.5 ng/mL using LC-MS, which is within the limits determined using LC-MS/MS [21]. The methodological limits of detection and quantification obtained with our sample preparation method for serum are 0.156 ng/mL and 0.176 ng/mL for Δ9-THC-D3, 0.349 ng/mL and 0.384 ng/mL for THC-OH, and 0.896 ng/mL and 0.987 ng/mL for THC-COOH and are, therefore, comparable to the results reported in the literature.
The limits of detection and quantification for THC from urine reported in the literature and previously introduced range from 0.1–22 ng/mL, for THC-OH from 0.2–25 ng/mL, and for THC-COOH from 0.2–7.8 ng/mL [10,34,37,71,72]. With the urine sample preparation method presented here, method detection and quantification limits are 0.04 ng/mL and 0.111 ng/mL for Δ9-THC-D3, 0.113 ng/mL and 0.279 ng/mL for THC-OH, and 0.235 ng/mL and 0.531 ng/mL for THC-COOH and are, thus, likewise within the range reported in the literature.
An exception is THC-OH from saliva, for which the limit of detection we achieved is 0.328 ng/mL, and the limit of quantification is 0.773 ng/mL, which is higher than the limits of detection and quantification reported by Sergi et al. using MEPS with 0.12 ng/mL and 0.4 ng/mL due to a higher concentration factor (2.5 compared to 2.05). The Substance Abuse and Mental Health Services Administration (SAMSHA) recommend cutoff limits of 1 and 2 ng/mL for driving under the influence of drugs, alcohol, and medicines (DRUID). The values can be reached by our automated method [61]. The same applies for the analytes Δ9-THC-D3 and THC-COOH, which are within the values reported in the literature of 0.005–5 ng/mL for Δ9-THC and 0.002–3.5 ng/mL for THC-COOH with methodological LODs and LOQs of 0.037 ng/mL and 0.082 ng/mL and 0.942 ng/mL and 2.247 ng/mL, respectively [10,62,63]. Therefore, we demonstrated that sensitive detection of the analytes Δ9-THC-D3, THC-OH, and THC-COOH is possible even without a final evaporation step using the presented automated sample preparation methods for the matrices’ serum, urine and saliva.
The specific use of SPE for concentration is achieved by using SPE plates with a very low sorbent bed volume of 2 mg, which also requires a very small elution volume (at least 25 µL) for the elution of the retained analytes, thus avoiding additional dilution and then, necessary evaporation and reconstitution. Furthermore, another advantage of reducing the solvent volume is the reduction of toxic waste and solvent vapors, contributing to a greener and healthier laboratory of the future.
The few fully automated methods use either SLE or SPE to prepare whole blood, urine or saliva samples. The SLE technique is very fast with an average of 1.5 h sample preparation time for 96 samples but shows low recovery values (23–51%) for THC [19,28,35]. In the SPE with previous PPT or hydrolysis, the recovery rates are higher (66–75%) [21,35] but also the time required is significantly higher, e.g., 2 h 50 min for 15 samples [21].

5. Conclusions

The SPE method we used yields recoveries for Δ9-THC-D3 from serum, urine and saliva ranging from 77.54% to 107.08% and the comparison of manual and automated methods showed that performing purification methods prior to SPE on the liquid handling robot results in the ability of the manual method to prepare more samples per year. Nevertheless, the lower costs per sample for the automated system have shown that automation is advantageous due to lower operating costs. The results of the validation with, for example, the low coefficients of variation, also indicate a high quality of the sample preparation, which further reinforces the benefits of automation. Consequently, one goal for future applications might be the acceleration of processes on the robot to improve the methods’ efficiency.
An alternative potential of our methods is the possibility of automated, parallel processing of different types of matrices, as the same SPE process was always used for sample preparation, which could be of great importance, for example, in forensic cases.

Author Contributions

Concept and methodology were developed by A.B., K.T. and B.W. Validation of methods was performed by A.B. and H.F. The original draft was written by A.B., K.T. and H.F. The project was managed and supervised by K.T. and H.F. Funding was obtained by K.T. All authors have read and agreed to the published version of the manuscript.

Funding

This work is based on a bilateral cooperation contract between the Center for Life Science Automation/University Rostock (Germany) and Beckman Coulter Life Sciences (Indianapolis, IN, USA).

Institutional Review Board Statement

Not applicable.

Informed Consent Statement

Not applicable.

Data Availability Statement

Additional data are available from the authors on request.

Acknowledgments

The authors wish to thank Thomas Roddelkopf, Lars Woinar, Heiko Engelhardt, Jan Hinnerichs, Sybille Horn, and Anne Reichelt for valuable input, discussions, and technical support.

Conflicts of Interest

The authors declare no conflict of interest.

References

  1. Europäischer Drogenbericht 2021: Trends und Entwicklungen; Europäische Beobachtungsstelle für Drogen und Drogensucht, Amt für Veröffentlichungen der Europäischen Union: Luxembourg, 2021.
  2. Pellati, F.; Borgonetti, V.; Brighenti, V.; Biagi, M.; Benvenuti, S.; Corsi, L. Cannabis sativa L. and Nonpsychoactive Cannabinoids: Their Chemistry and Role against Oxidative Stress, Inflammation, and Cancer. BioMed Res. Int. 2018, 2018, 1691428. [Google Scholar] [CrossRef] [PubMed] [Green Version]
  3. Abraham, T.T.; Lowe, R.H.; Pirnay, S.O.; Darwin, W.D.; Huestis, M.A. Simultaneous GC-EI-MS determination of Delta9-tetrahydrocannabinol, 11-hydroxy-Delta9-tetrahydrocannabinol, and 11-nor-9-carboxy-Delta9-tetrahydrocannabinol in human urine following tandem enzyme-alkaline hydrolysis. J. Anal. Toxicol. 2007, 31, 477–485. [Google Scholar] [CrossRef] [PubMed] [Green Version]
  4. Meng, Q.; Buchanan, B.; Zuccolo, J.; Poulin, M.M.; Gabriele, J.; Baranowski, D.C. A reliable and validated LC-MS/MS method for the simultaneous quantification of 4 cannabinoids in 40 consumer products. PLoS ONE 2018, 13, e0196396. [Google Scholar] [CrossRef] [PubMed]
  5. Gustafson, R.A.; Moolchan, E.T.; Barnes, A.; Levine, B.; Huestis, M.A. Validated method for the simultaneous determination of Delta 9-tetrahydrocannabinol (THC), 11-hydroxy-THC and 11-nor-9-carboxy-THC in human plasma using solid phase extraction and gas chromatography-mass spectrometry with positive chemical ionization. J. Chromatogr. B Anal. Technol. Biomed. Life Sci. 2003, 798, 145–154. [Google Scholar] [CrossRef] [PubMed]
  6. Watanabe, K.; Yamaori, S.; Funahashi, T.; Kimura, T.; Yamamoto, I. Cytochrome P450 enzymes involved in the metabolism of tetrahydrocannabinols and cannabinol by human hepatic microsomes. Life Sci. 2007, 80, 1415–1419. [Google Scholar] [CrossRef] [PubMed]
  7. Sørensen, L.K.; Hasselstrøm, J.B. Sensitive Determination of Cannabinoids in Whole Blood by LC-MS-MS After Rapid Removal of Phospholipids by Filtration. J. Anal. Toxicol. 2017, 41, 382–391. [Google Scholar] [CrossRef]
  8. Ferreirós, N.; Labocha, S.; Walter, C.; Lötsch, J.; Geisslinger, G. Simultaneous and sensitive LC-MS/MS determination of tetrahydrocannabinol and metabolites in human plasma. Anal. Bioanal. Chem. 2013, 405, 1399–1406. [Google Scholar] [CrossRef]
  9. Huestis, M.A.; Cone, E.J. Differentiating new marijuana use from residual drug excretion in occasional marijuana users. J. Anal. Toxicol. 1998, 22, 445–454. [Google Scholar] [CrossRef] [Green Version]
  10. Teixeira, H.; Verstraete, A.; Proença, P.; Corte-Real, F.; Monsanto, P.; Vieira, D.N. Validated method for the simultaneous determination of Delta9-THC and Delta9-THC-COOH in oral fluid, urine and whole blood using solid-phase extraction and liquid chromatography-mass spectrometry with electrospray ionization. Forensic Sci. Int. 2007, 170, 148–155. [Google Scholar] [CrossRef]
  11. Lee, D.; Huestis, M.A. Current knowledge on cannabinoids in oral fluid. Drug Test. Anal. 2014, 6, 88–111. [Google Scholar] [CrossRef] [Green Version]
  12. Soares Nunes, L.A.; Mussavira, S.; Sukumaran Bindhu, O. Clinical and diagnostic utility of saliva as a non-invasive diagnostic fluid: A systematic review. Biochem. Med. 2015, 25, 177–192. [Google Scholar] [CrossRef] [PubMed]
  13. Aps, J.K.; Martens, L.C. Review: The physiology of saliva and transfer of drugs into saliva. Forensic Sci. Int. 2005, 150, 119–131. [Google Scholar] [CrossRef] [PubMed]
  14. Lemberger, L.; Silberstein, S.D.; Axelrod, J.; Kopin, I.J. Marihuana: Studies on the disposition and metabolism of delta-9-tetrahydrocannabinol in man. Science 1970, 170, 1320–1322. [Google Scholar] [CrossRef] [PubMed]
  15. Wall, M.E.; Sadler, B.M.; Brine, D.; Taylor, H.; Perez-Reyes, M. Metabolism, disposition, and kinetics of delta-9-tetrahydrocannabinol in men and women. Clin. Pharmacol. Ther. 1983, 34, 352–363. [Google Scholar] [CrossRef] [PubMed]
  16. Kemp, P.M.; Abukhalaf, I.K.; Manno, J.E.; Manno, B.R.; Alford, D.D.; Mcwilliams, M.E.; Nixon, F.E.; Fitzgerald, M.J.; Reeves, R.R.; Wood, M.J. Cannabinoids in humans. II. The influence of three methods of hydrolysis on the concentration of THC and two metabolites in urine. J. Anal. Toxicol. 1995, 19, 292–298. [Google Scholar] [CrossRef] [PubMed]
  17. Milman, G.; Barnes, A.J.; Schwope, D.M.; Schwilke, E.W.; Darwin, W.D.; Goodwin, R.S.; Kelly, D.L.; Gorelick, D.A.; Huestis, M.A. Disposition of Cannabinoids in Oral Fluid after Controlled Around-the-Clock Oral THC Administration. Clin. Chem. 2010, 56, 1261–1269. [Google Scholar] [CrossRef] [PubMed] [Green Version]
  18. Williams, P.L.; Moffat, A.C. Identification in human urine of Δ9-tetrahydrocannabinol-11-oic acid glucuronide: A tetrahydrocannabinol metabolite. J. Pharm. Pharmacol. 2011, 32, 445–448. [Google Scholar] [CrossRef] [PubMed]
  19. Valen, A.; Leere Øiestad, Å.M.; Strand, D.H.; Skari, R.; Berg, T. Determination of 21 drugs in oral fluid using fully automated supported liquid extraction and UHPLC-MS/MS. Drug Test. Anal. 2017, 9, 808–823. [Google Scholar] [CrossRef] [PubMed]
  20. Caplan, Y.H.; Goldberger, B.A. Alternative specimens for workplace drug testing. J. Anal. Toxicol. 2001, 25, 396–399. [Google Scholar] [CrossRef] [Green Version]
  21. Andersen, D.; Rasmussen, B.; Linnet, K. Validation of a fully automated robotic setup for preparation of whole blood samples for LC-MS toxicology analysis. J. Anal. Toxicol. 2012, 36, 280–287. [Google Scholar] [CrossRef] [PubMed] [Green Version]
  22. Dziadosz, M.; Klintschar, M.; Teske, J. Simple protein precipitation-based analysis of Δ9-tetrahydrocannabinol and its metabolites in human serum by liquid chromatography–tandem mass spectrometry. Forensic Toxicol. 2017, 35, 190–194. [Google Scholar] [CrossRef]
  23. Hädener, M.; König, S.; Fabritius, M.M.; Weinmann, W. Using THC-COOH cut-off concentrations for assessing cannabis consumption frequency: A recently detected THC-COOH isomer poses an important analytical problem. Toxichem. Krimtech. 2017, 84, 168. [Google Scholar]
  24. Toennes, S.W.; Hanisch, S.; Pogoda, W.; Wunder, C.; Paulke, A. Pitfall in cannabinoid analysis—Detection of a previously unrecognized interfering compound in human serum. Anal. Bioanal. Chem. 2015, 407, 463–470. [Google Scholar] [CrossRef] [PubMed]
  25. Kneisel, S.; Auwärter, V. Analysis of 30 synthetic cannabinoids in serum by liquid chromatography-electrospray ionization tandem mass spectrometry after liquid-liquid extraction. J. Mass Spectrom. 2012, 47, 825–835. [Google Scholar] [CrossRef] [PubMed]
  26. Jagerdeo, E.; Schaff, J.E.; Montgomery, M.A.; Lebeau, M.A. A semi-automated solid-phase extraction liquid chromatography/tandem mass spectrometry method for the analysis of tetrahydrocannabinol and metabolites in whole blood. Rapid Commun. Mass Spectrom. 2009, 23, 2697–2705. [Google Scholar] [CrossRef] [PubMed]
  27. Schwope, D.M.; Scheidweiler, K.B.; Huestis, M.A. Direct quantification of cannabinoids and cannabinoid glucuronides in whole blood by liquid chromatography-tandem mass spectrometry. Anal. Bioanal. Chem. 2011, 401, 1273–1283. [Google Scholar] [CrossRef] [PubMed] [Green Version]
  28. Kristoffersen, L.; Langødegård, M.; Gaare, K.I.; Amundsen, I.; Terland, M.N.; Strand, D.H. Determination of 12 commonly found compounds in DUID cases in whole blood using fully automated supported liquid extraction and UHPLC-MS/MS. J. Chromatogr. B Anal. Technol. Biomed. Life Sci. 2018, 1093, 8–23. [Google Scholar] [CrossRef] [PubMed]
  29. Hubbard, J.A.; Smith, B.E.; Sobolesky, P.M.; Kim, S.; Hoffman, M.A.; Stone, J.; Huestis, M.A.; Grelotti, D.J.; Grant, I.; Marcotte, T.D.; et al. Validation of a liquid chromatography tandem mass spectrometry (LC-MS/MS) method to detect cannabinoids in whole blood and breath. Clin. Chem. Lab. Med. 2020, 58, 673–681. [Google Scholar] [CrossRef] [PubMed]
  30. Tiscione, N.B.; Miller, R.; Shan, X.; Sprague, J.; Yeatman, D.T. An Efficient, Robust Method for the Determination of Cannabinoids in Whole Blood by LC-MS-MS. J. Anal. Toxicol. 2016, 40, 639–648. [Google Scholar] [CrossRef] [PubMed]
  31. Purschke, K.; Heinl, S.; Lerch, O.; Erdmann, F.; Veit, F. Development and validation of an automated liquid-liquid extraction GC/MS method for the determination of THC, 11-OH-THC, and free THC-carboxylic acid (THC-COOH) from blood serum. Anal. Bioanal. Chem. 2016, 408, 4379–4388. [Google Scholar] [CrossRef] [Green Version]
  32. Giroud, C.; Ménétrey, A.; Augsburger, M.; Buclin, T.; Sanchez-Mazas, P.; Mangin, P. Delta(9)-THC, 11-OH-Delta(9)-THC and Delta(9)-THCCOOH plasma or serum to whole blood concentrations distribution ratios in blood samples taken from living and dead people. Forensic Sci. Int. 2001, 123, 159–164. [Google Scholar] [CrossRef]
  33. Weller, J.P.; Wolf, M.; Szidat, S. Enhanced selectivity in the determination of delta9-tetrahydrocannabinol and two major metabolites in serum using ion-trap GC-MS-MS. J. Anal. Toxicol. 2000, 24, 359–364. [Google Scholar] [CrossRef] [PubMed] [Green Version]
  34. Aizpurua-Olaizola, O.; Zarandona, I.; Ortiz, L.; Navarro, P.; Etxebarria, N.; Usobiaga, A. Simultaneous quantification of major cannabinoids and metabolites in human urine and plasma by HPLC-MS/MS and enzyme-alkaline hydrolysis. Drug Test. Anal. 2017, 9, 626–633. [Google Scholar] [CrossRef] [PubMed]
  35. Gundersen, P.O.M.; Spigset, O.; Josefsson, M. Screening, quantification, and confirmation of synthetic cannabinoid metabolites in urine by UHPLC-QTOF-MS. Drug Test. Anal. 2019, 11, 51–67. [Google Scholar] [CrossRef] [PubMed] [Green Version]
  36. Jang, M.; Shin, I.; Kim, J.; Yang, W. Simultaneous quantification of 37 synthetic cannabinoid metabolites in human urine by liquid chromatography-tandem mass spectrometry. Forensic Toxicol. 2015, 33, 221–234. [Google Scholar] [CrossRef]
  37. Kleis, J.N.; Hess, C.; Germerott, T.; Roehrich, J. Sensitive screening of synthetic cannabinoids using liquid chromatography quadrupole time-of-flight mass spectrometry after solid phase extraction. Drug Test. Anal. 2021, 13, 1535–1551. [Google Scholar] [CrossRef] [PubMed]
  38. Breindahl, T.; Andreasen, K. Determination of 11-nor-delta9-tetrahydrocannabinol-9-carboxylic acid in urine using high-performance liquid chromatography and electrospray ionization mass spectrometry. J. Chromatogr. B Biomed. Sci. Appl. 1999, 732, 155–164. [Google Scholar] [CrossRef]
  39. Freijo, T.D.; Harris, S.E.; Kala, S.V. A rapid quantitative method for the analysis of synthetic cannabinoids by liquid chromatography-tandem mass spectrometry. J. Anal. Toxicol. 2014, 38, 466–478. [Google Scholar] [CrossRef] [Green Version]
  40. Sempio, C.; Scheidweiler, K.B.; Barnes, A.J.; Huestis, M.A. Optimization of recombinant β-glucuronidase hydrolysis and quantification of eight urinary cannabinoids and metabolites by liquid chromatography tandem mass spectrometry. Drug Test. Anal. 2018, 10, 518–529. [Google Scholar] [CrossRef]
  41. Automated Extraction of Synthetic Cannabinoids (SPICE) from Urine Using ISOLUTE® SLE + Prior to LC-MS/MS; AN793; Biotage: Uppsala, Sweden, 2013.
  42. Scheidweiler, K.B.; Desrosiers, N.A.; Huestis, M.A. Simultaneous quantification of free and glucuronidated cannabinoids in human urine by liquid chromatography tandem mass spectrometry. Clin. Chim. Acta 2012, 413, 1839–1847. [Google Scholar] [CrossRef] [Green Version]
  43. Sample Preparation with the AC Extraction Plate: Extraction of Urinary THC Metabolites for LC-MSMS Quantification; Tecan Trading AG: Männedorf, Switzerland, 2014.
  44. Weinmann, W.; Goerner, M.; Vogt, S.; Goerke, R.; Pollak, S. Fast confirmation of 11-nor-9-carboxy-Delta(9)-tetrahydrocannabinol (THC-COOH) in urine by LC/MS/MS using negative atmospheric-pressure chemical ionisation (APCI). Forensic Sci. Int. 2001, 121, 103–107. [Google Scholar] [CrossRef]
  45. Montesano, C.; Sergi, M.; Odoardi, S.; Simeoni, M.C.; Compagnone, D.; Curini, R. A μ-SPE procedure for the determination of cannabinoids and their metabolites in urine by LC-MS/MS. J. Pharm. Biomed. Anal. 2014, 91, 169–175. [Google Scholar] [CrossRef] [PubMed]
  46. Conti, M.; Tazzari, V.; Bertona, M.; Brambilla, M.; Brambilla, P. Surface-activated chemical ionization combined with electrospray ionization and mass spectrometry for the analysis of cannabinoids in biological samples. Part I: Analysis of 11-nor-9-carboxytetrahydro-cannabinol. Rapid Commun. Mass Spectrom. 2011, 25, 1552–1558. [Google Scholar] [CrossRef] [PubMed]
  47. Rumpler, M.J. Quantitative analysis of 11-nor-9-carboxy-tetrahydrocannbinol (THC–COOH) in urine by LC–MS/MS following a simple filtration. J. Chromatogr. B Anal. Technol. Biomed. Life Sci. 2014, 957, 77–83. [Google Scholar] [CrossRef] [PubMed]
  48. Robandt, P.V.; Klette, K.L.; Sibum, M. Automated solid-phase extraction-liquid chromatography-tandem mass spectrometry analysis of 11-nor-Delta9-tetrahydrocannabinol-9-carboxylic acid in human urine specimens: Application to a high-throughput urine analysis laboratory. J. Anal. Toxicol. 2009, 33, 456–460. [Google Scholar] [CrossRef] [Green Version]
  49. Jagerdeo, E.; Montgomery, M.A.; Karas, R.P.; Sibum, M. A fast method for screening and/or quantitation of tetrahydrocannabinol and metabolites in urine by automated SPE/LC/MS/MS. Anal. Bioanal. Chem. 2010, 398, 329–338. [Google Scholar] [CrossRef]
  50. Huq, S.; Dixon, A.; Kelly, K.; Kallury, K.M. Novel solid-phase extraction protocol for 11-nor-9-carboxy-delta9-tetrahydrocannabinol from urine samples employing a polymeric mixed-mode cation-exchange resin, Strata-X-C, suitable for gas chromatography-mass spectrometry or liquid chromatography-mass spectrometry analysis. J. Chromatogr. A 2005, 1073, 355–361. [Google Scholar] [CrossRef] [PubMed]
  51. Pope, J.D.; Black, M.J.; Drummer, O.H.; Schneider, H.G. Urine toxicology screening by liquid chromatography time-of-flight mass spectrometry in a quaternary hospital setting. Clin. Biochem. 2021, 95, 66–72. [Google Scholar] [CrossRef]
  52. Kronstrand, R.; Brinkhagen, L.; Birath-Karlsson, C.; Roman, M.; Josefsson, M. LC-QTOF-MS as a superior strategy to immunoassay for the comprehensive analysis of synthetic cannabinoids in urine. Anal. Bioanal. Chem. 2014, 406, 3599–3609. [Google Scholar] [CrossRef] [PubMed]
  53. Cabrices, O.G.; Foster, F.D.; Taylor, A.M.; Lee, L.A. “Prep-and-Shoot”: The Completely Automated Workflow for the Hydrolysis and Analysis of Urine Samples by LC/MS/MS; Gerstel: Linthicum, MD, USA, 2014. [Google Scholar]
  54. Badawi, N.; Simonsen, K.W.; Steentoft, A.; Bernhoft, I.M.; Linnet, K. Simultaneous screening and quantification of 29 drugs of abuse in oral fluid by solid-phase extraction and ultraperformance LC-MS/MS. Clin. Chem. 2009, 55, 2004–2018. [Google Scholar] [CrossRef] [Green Version]
  55. Concheiro, M.; De Castro, A.; Quintela, Ó.; Cruz, A.; López-Rivadulla, M. Determination of illicit and medicinal drugs and their metabolites in oral fluid and preserved oral fluid by liquid chromatography–tandem mass spectrometry. Anal. Bioanal. Chem. 2008, 391, 2329–2338. [Google Scholar] [CrossRef] [PubMed]
  56. Coulter, C.; Garnier, M.; Moore, C. Analysis of Tetrahydrocannabinol and its Metabolite, 11-Nor-Δ9-Tetrahydrocannabinol-9-Carboxylic Acid, in Oral Fluid using Liquid Chromatography with Tandem Mass Spectrometry. J. Anal. Toxicol. 2012, 36, 413–417. [Google Scholar] [CrossRef] [PubMed]
  57. Quintela, O.; Andrenyak, D.M.; Hoggan, A.M.; Crouch, D.J. A validated method for the detection of Delta 9-tetrahydrocannabinol and 11-nor-9-carboxy-Delta 9-tetrahydrocannabinol in oral fluid samples by liquid chromatography coupled with quadrupole-time-of-flight mass spectrometry. J. Anal. Toxicol. 2007, 31, 157–164. [Google Scholar] [CrossRef] [PubMed] [Green Version]
  58. Lund, H.M.E.; Øiestad, E.L.; Gjerde, H.; Christophersen, A.S. Drugs of abuse in oral fluid collected by two different sample kits—Stability testing and validation using ultra performance tandem mass spectrometry analysis. J. Chromatogr. B Anal. Technol. Biomed. Life Sci. 2011, 879, 3367–3377. [Google Scholar] [CrossRef] [PubMed]
  59. Bakke, E.; Høiseth, G.; Furuhaugen, H.; Berg, T.; Arnestad, M.; Gjerde, H. Oral Fluid to Blood Concentration Ratios of Different Psychoactive Drugs in Samples from Suspected Drugged Drivers. Ther. Drug Monit. 2020, 42, 795–800. [Google Scholar] [CrossRef] [PubMed]
  60. Sergi, M.; Montesano, C.; Odoardi, S.; Mainero Rocca, L.; Fabrizi, G.; Compagnone, D.; Curini, R. Micro extraction by packed sorbent coupled to liquid chromatography tandem mass spectrometry for the rapid and sensitive determination of cannabinoids in oral fluids. J. Chromatogr. A 2013, 1301, 139–146. [Google Scholar] [CrossRef] [PubMed]
  61. Milman, G.; Barnes, A.J.; Schwope, D.M.; Schwilke, E.W.; Goodwin, R.S.; Kelly, D.L.; Gorelick, D.A.; Huestis, M.A. Cannabinoids and metabolites in expectorated oral fluid after 8 days of controlled around-the-clock oral THC administration. Anal. Bioanal. Chem. 2011, 401, 599–607. [Google Scholar] [CrossRef] [PubMed] [Green Version]
  62. Lee, P.D.; Chang, Y.J.; Lin, K.L.; Chang, Y.Z. Simultaneous determination of Δ9-tetrahydrocannabinol and 11-nor-9-carboxy-Δ9-tetrahydrocannabinol in oral fluid using isotope dilution liquid chromatography tandem mass spectrometry. Anal. Bioanal. Chem. 2012, 402, 851–859. [Google Scholar] [CrossRef]
  63. Sergi, M.; Bafile, E.; Compagnone, D.; Curini, R.; D’ascenzo, G.; Romolo, F.S. Multiclass analysis of illicit drugs in plasma and oral fluids by LC-MS/MS. Anal. Bioanal. Chem. 2009, 393, 709–718. [Google Scholar] [CrossRef]
  64. Choi, H.; Baeck, S.; Kim, E.; Lee, S.; Jang, M.; Lee, J.; Choi, H.; Chung, H. Analysis of cannabis in oral fluid specimens by GC-MS with automatic SPE. Sci. Justice 2009, 49, 242–246. [Google Scholar] [CrossRef]
  65. Cerillant Corporation Certificate of Analysis (COA). Available online: https://www.cerilliant.com/products/searchCOA.aspx (accessed on 8 March 2022).
  66. Bach, A.; Fleischer, H.; Wijayawardena, B.; Thurow, K. Optimization of Automated Sample Preparation for Vitamin D Determination on a Biomek i7 Workstation. SLAS Technol. 2021, 26, 615–629. [Google Scholar] [CrossRef] [PubMed]
  67. Fleischer, H.; Thurow, K. Automation Solutions for Analytical Measurements; Wiley-VCH: Weinheim, Germany, 2017; p. 272. [Google Scholar]
  68. Otto, M. Analytische Chemie; Wiley-VCH: Weinheim, Germany, 2019; p. 552. [Google Scholar]
  69. Christophersen, A.S. Tetrahydrocannabinol stability in whole blood: Plastic versus glass containers. J. Anal. Toxicol. 1986, 10, 129–131. [Google Scholar] [CrossRef] [PubMed]
  70. Kneisel, S.; Speck, M.; Moosmann, B.; Auwärter, V. Stability of 11 prevalent synthetic cannabinoids in authentic neat oral fluid samples: Glass versus polypropylene containers at different temperatures. Drug Test. Anal. 2013, 5, 602–606. [Google Scholar] [CrossRef] [PubMed]
  71. Sanli, S.; Ghorbani-Zamani, F.; Moulahoum, H.; Gumus, Z.P.; Coskunol, H.; Odaci Demirkol, D.; Timur, S. Application of Biofunctionalized Magnetic Nanoparticles Based-Sensing in Abused Drugs Diagnostics. Anal. Chem. 2020, 92, 1033–1040. [Google Scholar] [CrossRef] [PubMed]
  72. Scurati, S.; Brambilla, M.; D’Amato, L.; Brambilla, P. THC-COOH Quantification in Urine Using Dilute and Shoot LC-MS/MS Method for Forensic Toxicology; Thermo Fisher Scientific: Rodano, Italy, 2011; p. 548. [Google Scholar]
Figure 1. Integrated devices (a) Biomek i7 workstation (Beckman Coulter Life Sciences, Indianapolis, IN, USA) with incubator (in front, white arrow; INHECO Industrial Heating & Cooling GmbH, Martinsried, Germany) and centrifuge (back, black arrow; Agilent Technologies, Santa Clara, CA, USA) (b) Positive Pressure Unit V4 (amplius GmbH, Rostock, Germany) (c) Self Refilling Quarter Reservoir (amplius GmbH, Rostock, Germany) (d) Static Peltier ALP (INHECO Industrial Heating & Cooling GmbH, Martinsried, Germany) (e) 3D Tilting ALP (amplius GmbH, Rostock, Germany).
Applsci 12 02838 g001
Figure 2. Sample Preparation Process.
Applsci 12 02838 g002
Figure 3. (a) Deck layout serum (b) Deck layout urine (c) Deck layout saliva (A) Adapter for Eppendorf Vials (B) Adapter for Protein Precipitation (C) Aluminum Adapter for Internal Standards (D) Strata X-C µElution 96-well SPE plate and 96-well elution plate (E) Aluminum adapter with 1.5 mL vials for dilution (F) Tip boxes (G) Reservoirs.
Applsci 12 02838 g003
Figure 4. Calibration curves with calibration curve equation y and coefficient of determination R2, chromatograms and mass spectra for (a) Δ9-THC-D3 (b) THC-OH (c) THC-COOH.
Applsci 12 02838 g004
Table 1. Results of Method Validation Cannabinoid Determination from Serum.
SerumΔ9-THC-D3THC-OHTHC-COOH
Range Range Range
No. of SamplesMean Value [%]CV [%]Min [%]-Max [%]Mean Value [%]CV [%]Min [%]-Max [%]Mean Value [%]CV [%]Min [%]-Max [%]
Recovery25101.210.86100.12-104.1599.541.5196.41-101.45100.650.5299.69-101.75
Within-laboratory Precision 11094.282.73 98.382.99 101.281.61
Within-laboratory Precision 210101.010.51100.420.44100.790.62
Within-laboratory Precision 310100.660.5899.930.96100.621.52
Within-laboratory Precision 41099.11 1.24103.110.80102.253.11
Within-laboratory Precision 510102.742.00101.292.05100.721.84
Measurement Precision25101.210.3099.080.53101.250.43
LOD100.0870.1960.503
LOQ100.0990.2150.554
LOD (method)100.156 0.349 0.896
LOQ (method)100.1760.3840.987
Table 2. Results of Method Validation for Cannabinoid Determination from Urine.
UrineTHC-D3THC-OHTHC-COOH
Range Range Range
No. of SamplesMean Value [%]CV [%]Min [%]-Max [%]Mean Value [%]CV [%]Min [%]-Max [%]Mean Value [%]CV [%]Min [%]-Max [%]
Recovery2583.863.6477.54-87.5391.091.8588.91-94.5383.5435.779.04-92.66
Within-laboratory Precision 11096.022.97 88.461.03 77.851.66
Within-laboratory Precision 21090.092.2286.432.4680.532.78
Within-laboratory Precision 31085.342.8290.971.7484.093.89
Within-laboratory Precision 41098.243.4288.911.6083.842.51
Within-laboratory Precision 51099.642.9285.952.0384.962.76
Measurement Precision2599.951.2287.520.8387.011.59
LOD100.0810.2320.482
LOQ100.2280.5711.089
LOD (method)100.040 0.113 0.235
LOQ (method)100.1110.2790.531
Table 3. Results of Method Validation for Cannabinoid Determination from Saliva.
SalivaTHC-D3THC-OHTHC-COOH
Range Range Range
No. of SamplesMean Value [%]CV [%]Min [%]-Max [%]Mean Value [%]CV [%]Min [%]-Max [%]Mean Value [%]CV [%]Min [%]-Max [%]
Recovery2598.153.8589.62-104.85103.221.36100.68-105.47104.082.4898.22-108.34
Within-laboratory Precision 110106.483.02 99.671.45 104.331.94
Within-laboratory Precision 21099.272.90103.311.32103.382.76
Within-laboratory Precision 31099.363.74107.731.79108.292.66
Within-laboratory Precision 410103.023.97106.682.22104.533.12
Within-laboratory Precision 510107.082.69106.632.69108.622.70
Measurement Precision25100.450.50101.620.41100.590.78
LOD100.0680.5961.712
LOQ100.1491.4054.086
LOD (method)100.037 0.328 0.942
LOQ (method)100.0820.7732.247
Table 4. Results of economic evaluation.
SerumUrineOral Fluid
Lab TechnicianBiomekLab TechnicianBiomekLab TechnicianBiomekUnit
No. of samples per run969696969696[unit]
Operating costs1,095,758.29 €546,602.36 €1,058,167.50 €478,749.00 €1,104,136.61 €1,107,571.18 €[€]
Annual depreciation (10 years)0.00 €39,637.46 €0.00 €40,079.86 €0.00 €29,727.16 €[€]
Annual imputed interest0.00 €1981.87 €0.00 €2003.99 €0.00 €1486.36 €[€]
Total costs per year1,095,758.29 €588,221.69 €1,058,167.50 €520,832.85 €1,104,136.61 €1,138,784.70 €[€]
Turnaround time5.637.205.957.094.882.43[h]
No. of samples per year100,80072,00096,00072,000115,200192,000[unit]
Cost per sample10.87 €7.59 €11.02 €6.65 €9.58 €5.93 €[€]
Net present value (NPV)166,056.24 €1,533,671.83 €−16,585.04 €2,167,508.14 €1,247,705.42 €8,920,346.90 €[€]
Payback period01.95never1.4800.31[years]
Publisher’s Note: MDPI stays neutral with regard to jurisdictional claims in published maps and institutional affiliations.

