1. Introduction
The autonomous power system of Rhodes Island, Greece, has recently undergone a major transformation, including the implementation of a new thermal power plant (TPP), the reinforcement and upgrade of the HV network transmission system from 66 kV to 150 kV, and the installation of a new GIS HV/MV substation fed by underground HV cable lines to supply the city of Rhodes. These developments have altered the fundamental electrical characteristics of the local power system and created challenges that had to be overcome to secure its operation. One major challenge was related to the management of excess reactive power during low demand periods, an issue typically addressed by shunt reactors, as is the case in modern power systems incorporating significant lengths of cable lines [
1].
To properly size reactive compensation, voltage rise and power transfer capability limitations are taken into account in typical interconnected system planning studies [
1,
2,
3,
4]. HVAC overhead and cable lines produce substantial amounts of reactive power which may have to be transmitted over long distances, if not consumed locally, as is the case in light load conditions. This, in turn, will impact active power transmission capability, increase losses, and give rise to significant overvoltages. VQ curves can help determine the amount of reactive compensation needed, while secondary voltage control (if applied) is in charge of shunt compensation switching, with the objective of maintaining reactive reserves on generators to face incidents [
5]. Reactive compensation can significantly improve voltage stability, and the effect of its allocation and amount on the voltage stability margin is often analyzed with sensitivity analysis methods [
6,
7].
Traditionally, the locations for placing new VAr sources are either simply estimated or directly assumed. The optimal allocation and determination of the types and sizes of installed reactive compensation is known as reactive power planning. Recent research has presented some rigorous optimization-based methods to address reactive power planning as a security-constrained optimal power flow problem in large power systems [
8,
9,
10,
11].
In autonomous systems, excess reactive power will have to be consumed by voltage-regulating units, typically synchronous generators operating in an underexcitated mode, a situation usually characterized by a reduced rotor angle stability margin and prevented by means of underexcitation limiters (UELs) [
12]. However, the application of underexcitation limiters in autonomous systems should be approached with caution, as this may result in overvoltage instability, even though there may be no imminent risk of loss of synchronism [
13,
14,
15]. An incident of this type occurred in Rhodes in 2016 and is analyzed in detail in [
16].
As it will be further analyzed in this paper, in dealing with a small autonomous system, the main driver when sizing reactive power compensation is not voltage rise concerns in certain parts of the network, but rather the reactive power absorption capability of local generators.
An investment-oriented approach would foresee reactive power compensation facilities large enough to consume any excess VAr in the system, ensuring that reactive power issues never interfere with unit commitment and economic dispatch (UC-ED). However, such an approach would inevitably result in over-dimensioning compensation facilities. An operational approach, on the other hand, would seek a suitable unit commitment schedule, securing online units with sufficient reactive power absorption capabilities to manage excess VAr in the system. Even if a feasible UC solution does exist, such an approach would come at the detriment of operating efficiency, as reactive power constraints would impact the generation cost of the system and potentially hamper renewable energy penetration by enforcing the operation of a high number/capacity of conventional units.
The implementation of the right capacity of reactive power compensation facilities, as needed to minimize negative effects of increased reactive power absorption requirements from online generators for the autonomous power system of Rhodes, is the topic addressed in this paper. Both an investment-oriented and an operational approach are evaluated to derive the optimal size of shunt reactors needed for alleviating the reactive power equilibrium-based distortions introduced in the power system of Rhodes after reinforcement of its HV network.
To determine an acceptable commitment status of thermal units adhering to the reactive power absorption specificities of the Rhodes system, a suitable UC-ED model for islands is implemented [
17,
18] that has been amended to include simplified reactive power constraints. System operation is investigated under several reactive compensation levels, ranging from full to no compensation. System operation is simulated for an entire year, through consecutive execution of the daily UC-ED process. The impact of reactive power constraints on key system performance indices, such as the annual RES penetration levels, system generation cost, and operation of thermal units, is evaluated to determine the preferable size of shunt reactors from an operating cost and efficiency viewpoint. To assess the feasibility of the obtained results in terms of operational security of the system, a frequency stability analysis is performed, examining system operation at lowest annual demand and thus minimum inertia conditions. Frequency stability is assessed for two major system disturbances and three different reactive power compensation levels.
In brief, the main contribution of this study lies in the development and application of a coherent method to determine the optimum size of reactive compensators for a real-world study case island. The method quantifies the tangible system benefits deriving from the introduction of shunt reactors to a system facing VAr excess by utilizing a detailed UC-ED methodology. The proposed UC-ED model builds upon the classical MILP mathematical formulation [
19,
20,
21], and further incorporates the reactive power absorption capabilities of thermal units so that they deal with the excess of reactive power generated by the HV network of the island during low load periods. The mathematical formulation incorporates reactive power equilibria during normal operating conditions, as well as events impacting the reactive power absorption capability, such as the loss of online generating units. The model employed in the paper incorporates the low-loading operation of thermal units, which has been presented in detail in a previous work of ours [
22], and contributes to the feasibility of the UC solution for this specific case study. Additionally, the proposed UC-ED model complements the network analysis tools typically used for this purpose to justify a reasonable level for reactive compensation. Overall, the objective and contribution of this work is to optimally size reactive compensation in real-world island systems by concurrently evaluating several indices, including RES curtailment levels, system economics, constraints of thermal units, and operating security criteria.
The remainder of the paper is organized as follows.
Section 2 describes the specificities of the Rhodes power system.
Section 3 addresses how limitations in the reactive power absorption capability of synchronous generators may cause voltage instability in autonomous power systems and defines the reactive power consumption requirements of the system.
Section 4 describes the mathematical formulation of the UC-ED optimization and performs the cost-benefit analysis regarding the feasibility of introducing new reactive power compensator.
Section 5 presents the dynamic security assessment of the results of the cost-benefit analysis and
Section 6 discusses the main conclusions.
Appendix A sets out further assumptions regarding the management principles of Rhodes Island, while Abbreviations presents the notation used for the UC-ED model.
2. The Autonomous Power System of Rhodes
Figure 1 shows the 150 kV transmission network of the island of Rhodes, located in the south-eastern Aegean Sea. The non-interconnected island systems in Greece are operated by the Hellenic Electricity Distribution Network Operator, under its capacity as the non-interconnected island operator (NII-O). The principles governing the generation management in the Greek non-interconnected islands are described in [
17,
23].
The peak load of Rhodes exceeds 200 MW, occurring during the summer period. The lowest load periods are presented during March and November, when the total system load drops down to 35 MW. Until recently, the power generation system consisted of a single thermal power plant, the Soroni TPP, with 11 units of 207 MW total installed capacity (see
Appendix A). Five wind power plants (WPPs) are also installed on the island, with a total installed capacity of 49.15 MW, while another 18.16 MW of PV units are distributed at the MV and LV levels.
As is typically the case in small autonomous power systems, frequency stability is the main challenge due to low inertia. In Rhodes, frequency stability relies on an under-frequency load shedding (UFLS) protection scheme. However, in recent years, another difficulty emerged as it became necessary for the generators of the Soroni TPP to absorb significant amounts of reactive power during low load periods, systematically requiring the underexcited operation of synchronous generators. The main reasons that led to such operating conditions are identified as follows:
The upgrade of the transmission system from 66 kV to 150 kV, resulting in a higher reactive power generation from the HV lines.
High MAX to MIN load ratio, which leads to a practically unloaded operation of the transmission system in low load conditions occurring in Autumn and Spring.
Increasing number of MV cables with significantly higher capacitance compared to overhead lines.
The analysis presented in this paper demonstrates that excess reactive power generation conditions in the local system are further exacerbated by two additional developments that took place recently:
A new TPP located in the southern part of the island entered operation, with seven units of 119 MW cumulative capacity, increasing the total length of HV overhead lines.
A new urban HV/MV substation was installed to supply the main load center of the city of Rhodes at the north, interconnected via underground HV cable lines.
3. Needs for Reactive Power Compensation
3.1. Synchronous Generator Underexcited Operation in Autonomous Power Systems
For a synchronous generator to consume reactive power, it normally needs to operate underexcited. Typically, synchronous generators are protected against extensive underexcitation by (a) the UEL that will block the reduction of the excitation current below a selected threshold to prevent loss of synchronism of the generator and (b) the LOF relay that will trip the generator in case of detecting excitation loss [
12]. In large, interconnected power systems, the UELs of synchronous generators play a critical role in protecting them from rotor angle instability (loss of synchronism). Additionally, the UEL is affectively set in a way to avoid the occurrence of loss-of-field incidents during normal operation.
On the other hand, the application of UELs in isolated autonomous systems should be approached with caution, given that, while there is low risk for loss of synchronism, an attempt to limit the absorption of reactive power may lead to overvoltage instability [
14,
15]. The diversified behavior between isolated and interconnected power systems is demonstrated by the two capacitive networks shown in
Figure 2.
Figure 2 shows the common configuration, where an equivalent single synchronous generator is interconnected to an infinite bus through a transmission circuits represented by a series reactance
X and a concentrated shunt susceptance
B. With
R <<
X at the transmission level, the voltage difference between the two HV nodes of
Figure 2a is approximately [
24]:
At light load conditions, the current and reactive power losses XI2 are low, there is significant local reactive power generation (), and the generator consumes reactive power (Qg < 0). However, the generator reactive power absorption is limited in order to avoid decreasing the generator excitation below a predefined threshold. This function is automatically provided by the UEL of the generator. The result is the export of reactive power surplus (Q > 0) and a generator voltage rise (ΔV > 0).
Figure 2b shows the case of an autonomous power system, where the equivalent generator feeds a small active power load. In this case, there is no way to export reactive power and the following constraint needs to be satisfied to obtain a feasible operating point:
Again, at light load conditions, the reactive power losses (
XI2) are low, as is the reactive power consumption of the load
QL, which results in a very low voltage difference between the two HV nodes of
Figure 2b.
Due to the above constraint (3), attempting to limit the generator reactive power absorption may result in overvoltage instability: increasing the field current increases the generator EMF and the system voltage, which results in further reactive power produced by the HV lines and consumed by the generator. Note that operating with constant excitation may also be unstable, as analyzed in [
14,
15,
16]. It is therefore crucial to make use of the reactive power consumption capabilities of the synchronous generators and avoid inhibiting their automatic voltage regulation (e.g., by the underexcitation limiter or manual blocking of the excitation) to avoid voltage instability. Note also that, contrary to standard operator experience with conditions as shown in
Figure 2a, the operational conditions of
Figure 2b are not necessarily associated with high voltage levels. In addition, it is beneficial for the system to operate at a relatively low voltage, which is defined by the equivalent generator (and its step-up transformer, not shown in
Figure 2), as this will result in lower reactive power generation.
As we analyze in detail for the case of Rhodes in
Section 4, using the synchronous generators to consume excess reactive power may result in uneconomical operation, thus justifying investments in reactive power compensation.
3.2. Reactive Power Consumption Requirements in Rhodes Power System
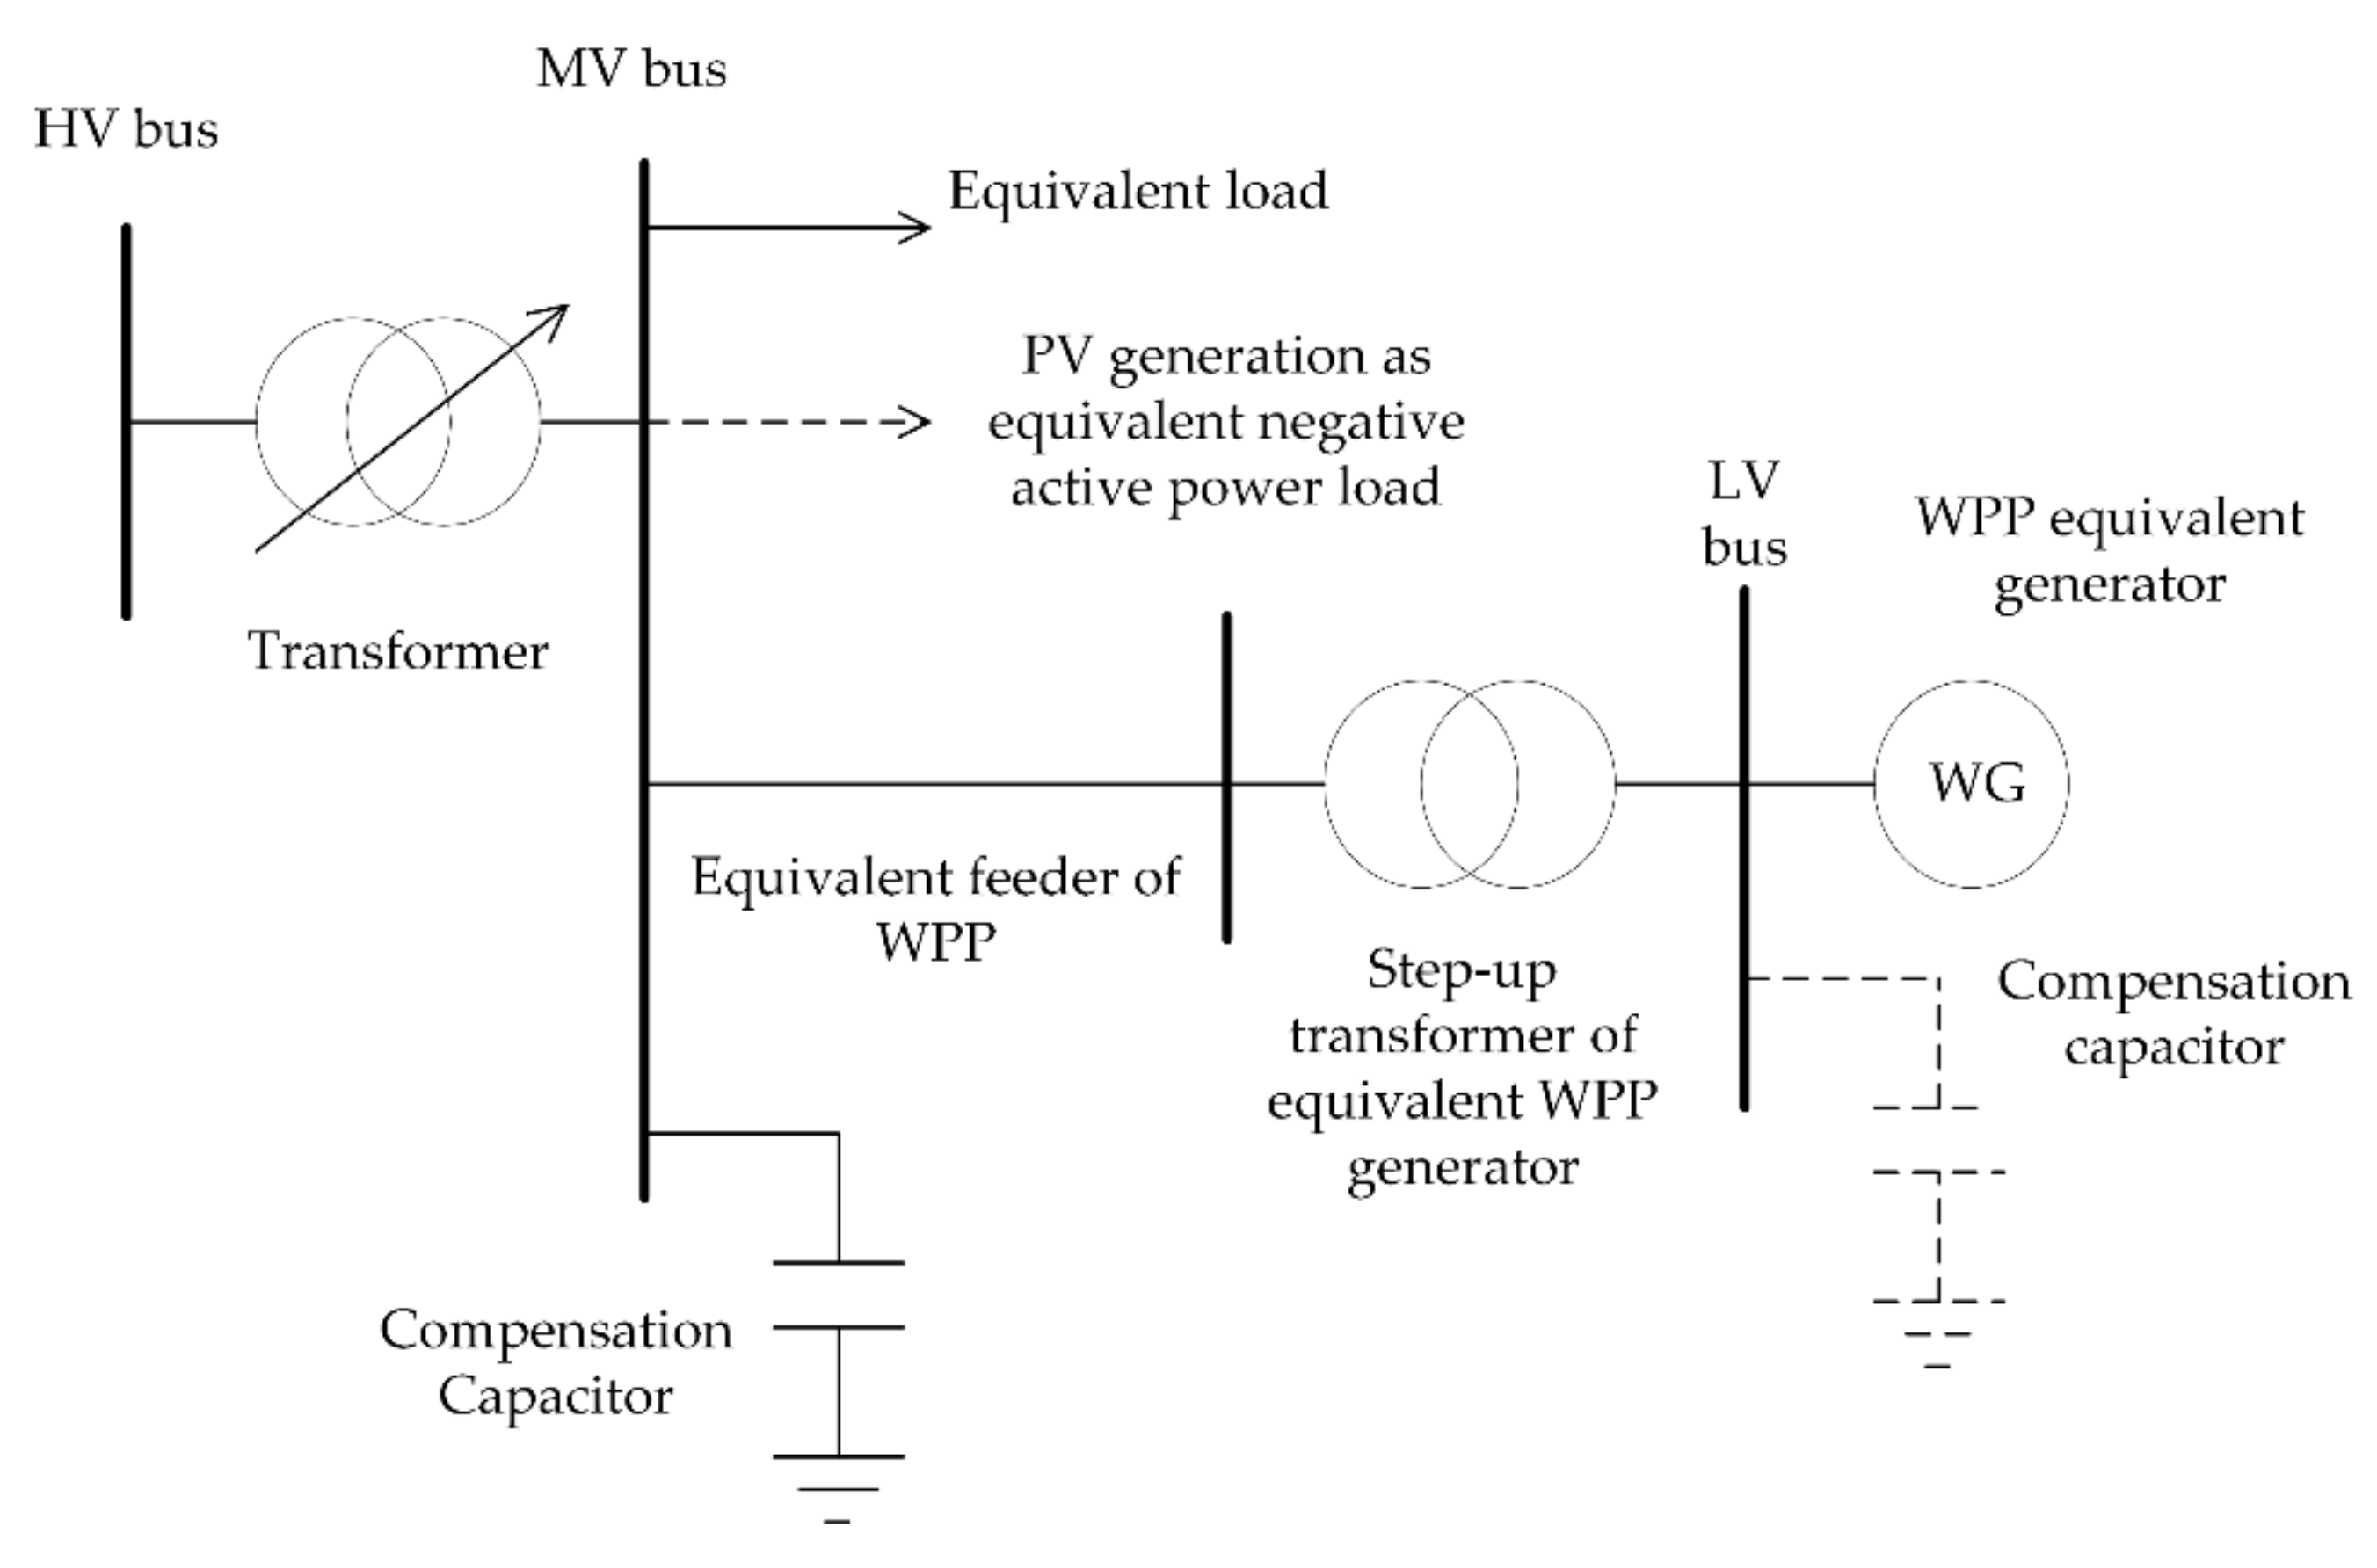
In order to investigate whether reactive power compensation is justified, the amounts of reactive power that need to be consumed by the generators in the system of Rhodes are first calculated by means of power flow analysis. The power flow model of the transmission system shown in
Figure 1 is enhanced with TPP step-up transformers, the system’s HV/MV distribution transformers, equivalent models for loads and PV generation per HV/MV transformer, load compensation capacitors (out-of-service at low load conditions), and an equivalent feeder and generator for wind power plants, as shown in
Figure 3.
The maximum reactive power consumption requirements occur under minimum load conditions (35 MW), which appear during autumn and spring nights. The equivalent load power factor is high due to a relatively extended MV cable network. Thus, a conservative assumption of unity power factor is made for the equivalent load under minimum demand conditions. WPPs are also modeled with unity p.f., as is the standard practice to minimize energy losses. Certain WPPs could consume reactive power, but the island system control center is capable of dispatching only active power setpoints. Moreover, according to available data, the installed inverters of both wind and PV power plants are not capable of operating in StatCom mode, i.e., to absorb reactive power at zero active power conditions.
HV transmission lines operate as net reactive power producers due to their significant capacitance and low loading levels. In the absence of reactive power compensation, the synchronous generators need to absorb excess reactive power, which may reach up to 27 MVAr at minimum load conditions. Excess VAr are reduced with increasing load levels, e.g., to 24 MVAr at 65 MW of demand. In the UC-ED model, the relationship between excess reactive power and system load is assumed to be linear for simplification purposes.
Due to the short distances and the autonomous nature of the local power system, sizing the reactive power compensation is not an issue of voltage drop/rise but of reactive power balance over the entire system. Therefore, the location of compensating devices does not make a significant difference in this respect, even though the installation location and the breakdown into multiple smaller compensating facilities will have to be determined with other considerations in mind, including ensuring connectivity at N-1 conditions, so that reactors remain in service in case of disturbances leading to HV circuit outages.
4. UC-ED-Oriented Cost-Benefit Analysis
To investigate the economic feasibility of introducing reactive power compensation into the power system of Rhodes, a cost-benefit analysis is performed utilizing a UC-ED mathematical optimization model, built upon the MILP method. The model adopts a cost-optimal approach, in compliance with the generation scheduling processes applicable on the Greek islands, as described in detail in [
17], suitably amended to incorporate simplified reactive power constraints for the needs of this particular system. The UC-ED optimization, performed on a 24-h horizon with a 1-hour time resolution, is consecutively executed over the course of one year. Note that the analysis is not restricted to a limited number of system operating points to determine the required size of reactive power compensators, as would be a conventional approach. Instead, it quantifies the total annual benefits in generation management that will arise out of the introduction of compensation, compared to a business-as-usual scenario of system operation without reactive compensation.
4.1. Model Fundamentals
The mathematical model for the UC-ED used in the paper is built upon the fundamentals of the MILP generation scheduling process for island systems, as described in detail in [
17,
18]. To enhance the flexibility of the system, the dual minimum loading technique proposed in [
22] is adopted. This approach enables low load operation of the thermal units, below their normal technical minimum loading level, in a coordinated manner aiming to increase RES absorption during base-load hours without committing expensive peaking units [
25,
26,
27].
The problem formulation involves constraints (4) to (20). All symbols are defined in the nomenclature section in Abbreviations. The cost minimization objective function (4) includes the variable operating costs of thermal units operating within their normal operating limits (
CM.I), the cost attributed to the low-loading operation of thermal units (
CM.II) and their start-up (
Csu) and shut-down (
Csd) costs. Details regarding the definition of cost terms can be found in [
17,
20,
22,
28,
29]. Equation (5) defines the active power equilibrium, while constraints (6) and (7) bound the power output of the thermal units when operating in low-load mode. Equation (8) defines the final power output of thermal units, either when in normal (over) or in low-loading (under) operation. Constraints (9) to (11) impose the commitment status of thermal units, while (12) and (13) bound their operation when in normal mode (i.e., operating within their declared minimum and maximum loading levels). Constraints (14) and (15) impose the minimum up and down times for thermal units, respectively. Constraints (16) to (18) ensure the fulfillment of reserve requirements per type (primary, secondary, and tertiary) and direction (upward/downward), while (19) limits the reserves provision per type according to the respective capabilities of each unit. Equation (20) defines the primary up reserves requirements of the system, which are crucial for island system stability during severe disturbances, e.g., the sudden loss of generation. Non-linear terms in (20) are linearized according to the methodology of [
30]. For the quantification of the remaining reserves requirements, the principles of [
17] apply.
4.2. Incorporation of Reactive Power Constraints for Thermal Units
To include the specificities of reactive power limitations on the island of Rhodes, the UC-ED is further amended by introducing relevant constraints. Note that the mathematical formulation of the UC-ED does not account for the AC power flow analysis of the system. Rather, it focuses on the reactive power absorption capabilities of thermal units, as well as the impact that the inclusion of such constraints may have on the overall UC-ED results for power systems experiencing excess reactive power during low demand periods. As analyzed in
Section 3, the reactive power compensation sizing is not an issue of voltage rise, but a question of managing the reactive power absorption capability of operating synchronous generators to reasonable and secure levels.
Online thermal units should provide a cumulative reactive power absorption capability, as needed to meet the excess reactive power of the system. To ensure that the system will survive disturbances, such as the loss of generation, without compromising its reactive power absorption capability, VAr constraints should also be satisfied at G-1 conditions (loss of any online generator).
Constraints (21) to (27) ensure that online thermal units will be capable of absorbing the reactive power generated by the HV network during normal and G-1 operating conditions. More specifically, (21) forces the commitment of as many units as necessary to secure reactive absorption during normal operation (
is negative when units need to absorb reactive power). Constraint (22) aims at identifying the online thermal unit that provides maximum VAr absorption capability among the committed generators. The non-linearities of (22) are properly linearized via (23) to (25). Constraint (25) identifies the generator that contributes most by setting the corresponding binary variable
equal to “1”. Finally, (26) defines the status of all units after the loss of the unit that contributes the most in reactive power absorption, while (27) imposes the fulfillment of reactive power absorption requirements at G-1 operation. Note that constraint (21) is obsolete when (27) applies, yet it is included in the formulation for the sake of completeness.
Similarly, constraints (28) to (34) ensure the required levels of reactive power production by online thermal units to meet demand (when the system consumes reactive power).
Constraints (28) to (34) have been introduced within the MILP, but they do not impact the final UC-ED solution, as the reactive power production capabilities of online units far exceed the corresponding system requirements.
4.3. System Operation with and without Reactive Power Constraints
The operation of the Rhodes power system during the lowest demand day of the year is presented in
Figure 4 for two cases.
Figure 4a presents system operation ignoring reactive power constraints; this case effectively represents operation with a full reactive compensation scheme in place.
Figure 4b refers to system operation when all reactive power constraints are introduced, without implementing any reactive compensation measures; in this case, the reactive power absorption capability of online units during the lowest demand period should exceed 27 MVAr at G-1 conditions.
Figure 5 illustrates the fulfillment of system reactive power requirements by online thermal units at G and G-1 conditions for both cases described above, while
Figure 6 shows the corresponding loading levels of thermal units committed to meet demand requirements.
Apparently, during the low demand intervals of the examined day (hours 00:00–08:00), where maximum reactive power absorption requirements apply, the secure operation of the system cannot be guaranteed at G-1 conditions in the absence of reactive power constraints integrated in the UC-ED (yellow solid line of
Figure 5a). Note that without the introduction of reactive constraints, the operation of the system could be compromised even at G conditions, given that the four online units committed by the optimization algorithm at low demand hours (Steam#1 & ICE#7-#9) marginally fulfill the reactive power absorption requirements (red dashed line in
Figure 5a). Obviously, such a UC-ED outcome would be optimal for a power system that does not face reactive power challenges, yet it cannot be acceptable for the examined case study.
This is circumvented by introducing constraints (21)–(27), ensuring that the committed thermal units provide the necessary level of reactive power absorption capabilities at G and G-1 conditions, as can be seen in
Figure 5b. However, to achieve this, at least six generators are required to be online during the low demand hours of the examined day (Steam#1, OCGT#4, ICE#1-#2 & ICE#6-#7).
The fulfilment of system reactive power constraints comes at a cost in terms of achievable RES penetration levels, system economics, and the management of thermal units. Comparing
Figure 4a,b it is apparent that RES curtailments are increased when reactive power constraints apply, due to the increased number of thermal units required to be online, which present a higher total minimum loading level (solid red line/TML of
Figure 4), limiting the RES hosting capacity. This is only partially alleviated through the low load operation of thermal units during low demand periods (gray line/rML of
Figure 4).
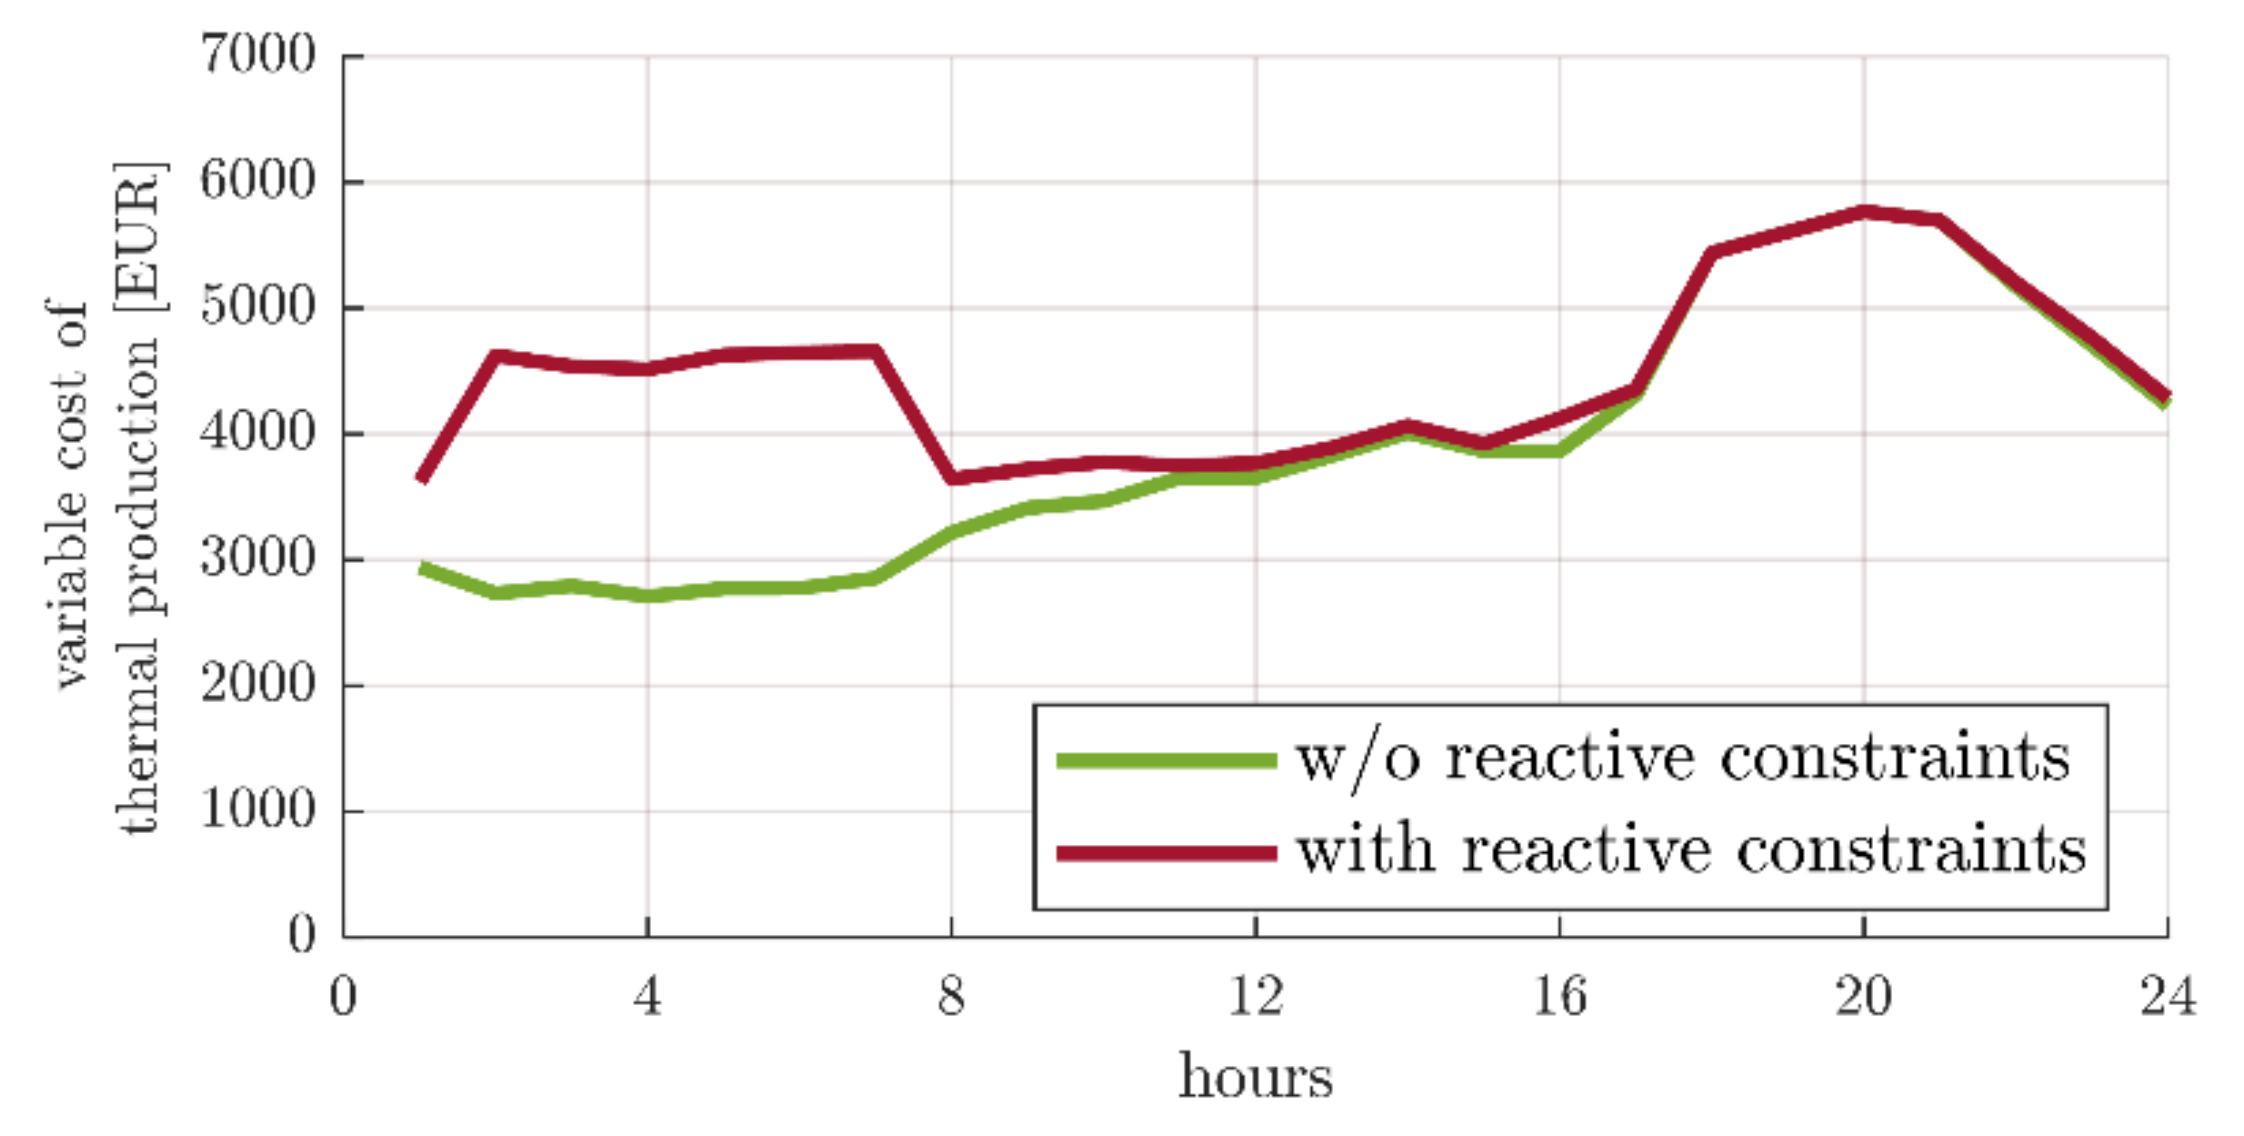
It is worth observing that the only feasible solution that concurrently fulfills the active and reactive power constraints of the problem involves the commitment of an expensive OCGT unit during the low demand hours, since the OCGT presents at the same time increased reactive power absorption capability (see
Appendix A) and a very low TML, below 20% of its rated power. However, this leads to a substantial escalation in the production cost of the system, as demonstrated in
Figure 7.
4.4. Reactive Compensation Requirements and Feasibility Analysis
From the analysis performed so far, it has become clear that in order to secure system operation with respect to the reactive power absorption requirements, an unreasonable unit commitment and load dispatch schedule must be applied, with an excessive number of units in operation, including peaking OCGTs during base load periods, and prolonged operation below the TML levels of the units.
To address these issues, the operation of the Rhodes power system is investigated in this section assuming seven different levels of reactive power compensation, evaluating the positive effects on generation cost and RES curtailments, which provide the basis for the cost-benefit analysis of investments in reactive compensation. The business-as-usual/no-compensation scenario is characterized by a 27 MVAr reactive power consumption from online thermal units during low demand periods (
Qreq = −27 MVAr). Compensating reactors are then introduced in steps of 4 MVAr capacity, as shown in
Table 1.
Renewable curtailments and the annual duration of thermal units’ operation below their technical minimum loading are presented in
Figure 8 as a function of the installed reactor capacity. The introduction of appropriately sized inductive compensation can reduce both curtailments and TML violations. It appears that a reactor capacity of 12 MVAr brings about the entire anticipated benefit, reducing annual RES curtailments by 5%, from 13% to 8%, and the hours of TML violations by almost 93% (from 2400 h/y to less than 180 h/y cumulatively for all thermal units). The introduction of additional reactor capacity is pointless with regard to these performance indicators.
The achieved reduction in the annual generation cost of the Rhodes system through the installation of compensating reactors is shown in
Figure 9. This is primarily due to two factors. First, easing reactive power constraints (21)–(27) UC-ED leads to the commitment of fewer units in low demand periods, with a lower cumulative TML and therefore more room available to accommodate renewable production. The reduction in RES curtailments shown in
Figure 8 is translated into a lower system variable cost, due to the substitution of more expensive thermal generation. In addition, the commitment of expensive OCGT units during low demand periods (see
Figure 6) is now avoided, resulting in further savings. Overall, significant variable cost reductions are observed for inductive compensation up to around 8 MVAr.
The system benefit due to the presence of inductive compensation is calculated as the cost difference between the business-as-usual scenario without reactive compensation and the scenario that includes the examined size of inductive compensator.
To perform the cost-benefit analysis, the equivalent annual cost (EAC) of inductors is calculated using Equation (35), while the fundamentals of [
31] apply. For the purposes of this study, the CAPEX is assumed equal to EUR 150 k/MVAr, the annual OPEX is 2% of the CAPEX, the discount rate is 5%, and the investment lifetime is assumed 15 years.
The net system benefit after the implementation of reactors can be derived by subtracting the EAC of the investment from the achieved system cost savings. The results are illustrated in
Figure 10, with the optimum reactor size being in the order of 8 MVAr, resulting in a net system benefit around EUR 0.8 M/year. Almost the same benefit can also be obtained with the introduction of an additional 4 MVAr of inductors (12 MVAr in total). Overall, any level of inductive compensation between 8 and 20 MVAr achieves an annual economic benefit above EUR 0.7 M.
The sensitivity of the results to the cost of reactors is presented in
Figure 11 for a CAPEX ranging between EUR 50 and 200 k/MVAr. The optimum reactor size increases as their CAPEX decreases, reaching up to 16 MVAr, with the system benefit exceeding EUR 0.9 M per year. In the increased CAPEX scenarios (EUR 150 and 200 k/MVAr), the optimum size falls to 8 MVA, with an annual gain of EUR 0.75 M in the worst-case scenario.
5. Dynamic Security Analysis
The results of the UC-ED analysis are complemented with further analysis of the system operational security. To this end, critical disturbances are simulated using a dynamic model developed in the PSS/E software that represents the particularities of the power system of Rhodes and is suitable for short-term stability analysis through fundamental frequency time domain simulations [
32]. It consists of models from the PSS/E library [
33] for:
Each synchronous generator of the two TPPs with its excitation and automatic voltage regulation system, as well as its turbine and governor. The modeling parameters used are based on available manufacturer data, test measurements, and disturbance recordings. A loss of excitation distance relay model is also included.
Dynamic models with typical parameters for each WPP modeled with one equivalent generator.
Frequency and voltage relay models for WPPs based on the settings as set by the corresponding independent power producers.
Frequency-dependent loads, represented in dynamic simulation as frequency-dependent admittances (P = Pload V2 Δf). The reactive power load demand is assumed to be zero, per the conservative assumption of the static analysis.
Under-frequency relay models according to the applied UFLS scheme, consisting of 13 stages, applied to 33 MV lines.
This dynamic model has been used also in the post-mortem analysis of a Rhodes blackout event [
12]. Its performance has been further verified for the analysis presented herein, by comparing the simulation results of a number of events that have occurred in the Rhodes system before the S. Rhodes TPP integration to the events’ available recorded data, mainly the number of MV lines shed, i.e., the number of UFLS stages activated. As an example,
Figure 12 shows the response of frequency as it results from the simulation of a trip of one diesel unit generating 16 MW at low load conditions (79 MW). This resulted in the activation of four UFLS stages, tripping eight MV lines, the same as recorded. Total load shedding amounted to 6.5 MW in the simulation.
Based on the results of the UC-ED analysis, the feasibility of 4 MVAr, 8 MVAr, and 12 MVAr compensation is further examined with respect to dynamic security. In particular, minimum load conditions are examined (35 MW of system load) with the generators shown in
Table 2 per case examined. RES generation is available from wind only, as minimum load conditions occur during the night.
Next, results from the analysis of two critical disturbances are presented: (a) loss a single synchronous generator after a fault (G-1 contingency) and (b) loss of the S. Rhodes TPP after a fault, resulting in the loss of its double-circuit interconnection line (N-2).
5.1. Generator Loss
The simulated disturbance consists of a three-phase fault at the HV side of the step-up transformer of the generator with the highest reactive power absorption capacity, i.e., one of the new diesel units in S. Rhodes TPP. The fault is cleared in 100 ms with tripping of the transformer and generator. Two older WPPs (not complying with low voltage ride-through requirements) also trip in the simulation. The system is stable in all three cases, as shown in
Figure 13, where the plots of voltage and frequency at the HV bus of the Soroni TPP are shown. The frequency nadir, however, ranges from approximately 49.5 Hz in the case with 4 MVAr compensation and six units in operation to less than 49.2 Hz in the case with 12 MVAr compensation and four units, as the system dynamic performance deteriorates with decreasing inertia, as expected. This results in 3.5 MW of load shed in the 12 MVAr case due to the activation of the UFLS scheme, while the latter is only marginally activated in the 8 MVAr case (1.1 MW load shed) and not activated at all in the 4 MVAr case. As a re-tuning of the UFLS is considered necessary after the latest radical system changes, no load shedding at all may be achieved also in the 8 MVAr case.
5.2. Loss of S. Rhodes TPP
In the following, the critical N-2 disturbance of tripping the double-circuit OHL connecting the S. Rhodes TPP to the rest of the Rhodes transmission system following a 100 ms fault is examined. It is assumed that the compensating reactors are installed in substations Afantou and Soroni, so they remain in service after the disturbance. In such an extreme disturbance—which, however, has a significant probability of occurrence—load shedding is acceptable as a necessary means to avoid a complete blackout, which is the main concern.
Figure 14 shows the voltage and frequency at the HV bus of the Soroni TPP. Even though the voltage recovers in all cases, in the 12 MVAr case, the system is unstable as the frequency collapses. The only synchronous generator remaining in service after the disturbance is the steam turbine generator in the Soroni TPP, which is not capable of maintaining frequency stability even though extensive load shedding takes place (more than 18 MW).
6. Conclusions
This paper addresses the problem of appropriate dimensioning of the reactive compensation in the autonomous power system of Rhodes Island in Greece, which faces excessive reactive power system generation during low load periods, after major upgrades in its HV network. Against standard practice in interconnected power systems, in an autonomous system, the compensation level is not determined by local voltage management issues, but rather by the total reactive power absorption capability of voltage-regulating units, typically the synchronous generators in operation. This renders a cost-benefit analysis necessary for the problem, even though such an analysis is not typical when sizing reactive power compensation.
A comprehensive method to determine the optimum size of reactive compensators is proposed, relying on a cost-benefit analysis approach that utilizes a detailed UC-ED model to suitably quantify system benefits due to the introduction of reactors. The proposed model complements the network analysis methods typically used for this purpose.
The analysis performed in the paper indicates that the introduction of reactive power compensators in the network of Rhodes is justified from a system-level cost-benefit viewpoint. System cost estimation indicates that the introduction of 8 MVAr of reactive power compensation is optimal, while higher compensation levels (e.g., 12 MVAr) will also deliver substantial system benefits.
Simulation of system operation with and without compensation showed that reactive power compensation will have a significant impact on mitigating renewable curtailments, which can be reduced from ~13% to ~8.5% when inductors in the order of 8 MVAr are installed. RES curtailment reduction constitutes an important criterion dictating the appropriate sizing of the required reactive compensation for the network of Rhodes Island, regardless of the system’s economics, given the significance of exploiting available renewable resource towards power sector decarbonization.
Finally, dynamic security assessment revealed that attempting to harvest the economic benefits of higher compensation levels (12 MVAr and beyond) can jeopardize system security in case of critical disturbances.


