Article

A BIM Based Framework for Damage Segmentation, Modeling, and Visualization Using IFC

by
Mathias Artus
*,
Mohamed Said Helmy Alabassy
and
Christian Koch
Faculty of Civil Engineering, Bauhaus-Universität Weimar, 99423 Weimar, Germany
*
Author to whom correspondence should be addressed.
Appl. Sci. 2022, 12(6), 2772; https://doi.org/10.3390/app12062772
Submission received: 21 December 2021 / Revised: 24 February 2022 / Accepted: 3 March 2022 / Published: 8 March 2022
(This article belongs to the Section Civil Engineering)

Abstract

:
Paper-based data acquisition and manual transfer between incompatible software or data formats during inspections of bridges, as done currently, are time-consuming, error-prone, cumbersome, and lead to information loss. A fully digitized workflow using open data formats would reduce data loss, efforts, and the costs of future inspections. On the one hand, existing studies proposed methods to automatize data acquisition and visualization for inspections. These studies lack an open standard to make the gathered data available for other processes. On the other hand, several studies discuss data structures for exchanging damage information among different stakeholders. However, those studies do not cover the process of automatic data acquisition and transfer. This study focuses on a framework that incorporates automatic damage data acquisition, transfer, and a damage information model for data exchange. This enables inspectors to use damage data for subsequent analyses and simulations. The proposed framework shows the potentials for a comprehensive damage information model and related (semi-)automatic data acquisition and processing.

1. Introduction

Bridges are designed to last for more than 50 years. During this period they consume up to 50% of their life-cycle costs [1,2]. In conventional bridge inspections, data acquisition and exchange are performed in the form of paper-based reports as well as proprietary and incompatible data formats, so that any data transfer is done manually. Inspections start with an inspector or an engineer performing the visual inspection on-site. All defects and related data are recorded in paper-based reports and the inspector subsequently digitizes the data later in the office. Other stakeholders, such as structural engineers, retrieve these data either as paper-based reports, as exports of databases, or in other proprietary data formats. Then, engineers would have to integrate or import this data again into their digital models. Such repetition of manual data digitization is cumbersome, time consuming, and leads to information loss [3,4]. The concept of Building Information Modeling (BIM) has been designed to overcome these issues. BIM should cover the entire life-cycle of structures including the operation phase with inspections and maintenance [4]. Defects and related information are vital for the inspection process. However, Sacks et al. remarked that “There is currently no accepted, consistent or thorough way to represent the defects that may occur in bridges” [5] (p. 144). This leads to the conclusion that BIM requires an extension to support the inspection process.
Hereinafter, the concept of modeling defects and related information will be called Damage Information Modeling (DIM) and the associated model as Damage Information Model. Throughout the life-cycle of a BIM model, several states, such as as-planned, as-designed, as-built, and as-is, are known. The operation phase includes inspections to ensure the safety of a structure. Inspections deliver additional information of a structure, for instance, measurements, report documents, or photos. Based on this information, defects are identified. Models, which include damage information, will be called as-damaged models. As-damaged models provide required information to the related domains, for example, inspection, simulation, and material analysis. Figure 1 shows a conceptual overview of the as-damaged model and some related processes. This study aims to provide a framework that covers data acquisition and visualization. The framework is designed with open data formats in mind, enabling integration of further domains in future work.

2. Background

Several aspects are relevant for digitizing bridge inspection procedures. First, a comprehensive model of the bridge is required. BIM is an established concept in the Architecture, Engineering, and Construction (AEC) sector. Hence, efforts done in this sector have been investigated. On the basis of the BIM model, DIM is defined. Several studies regarding DIM have been published. Last but not least, the automatic damage segmentation has been addressed by several studies.

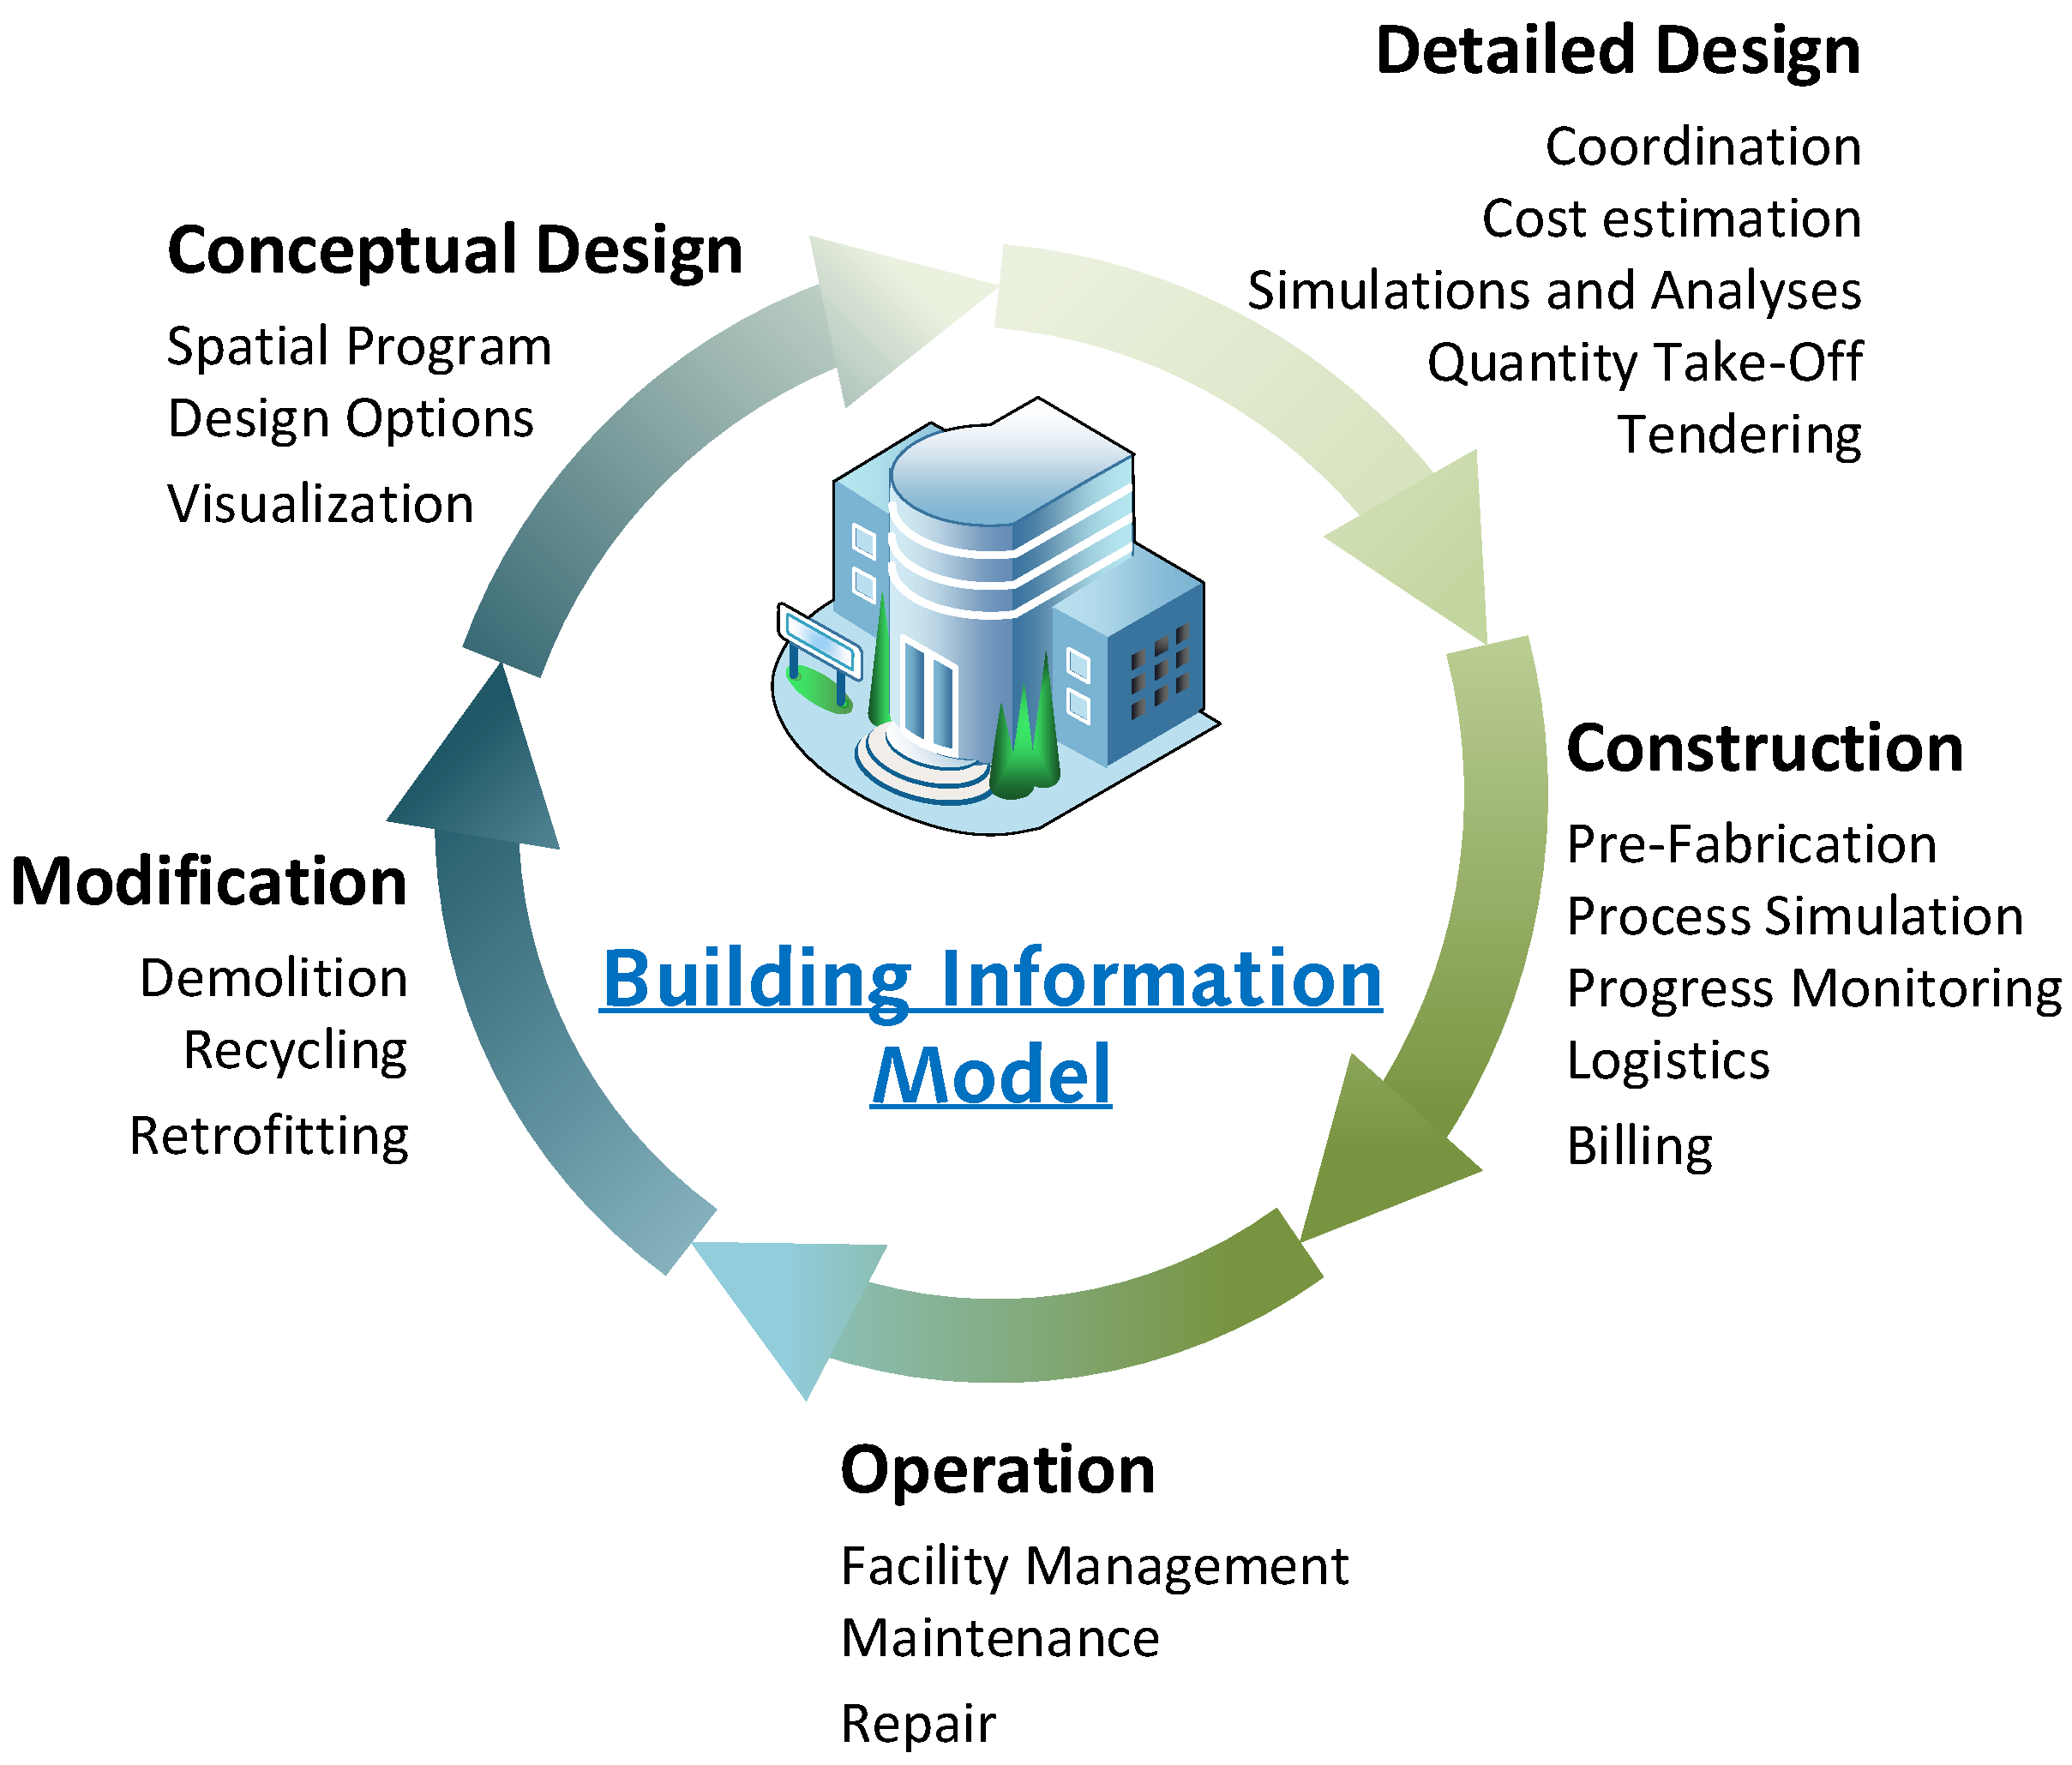
2.1. Building Information Modeling

BIM is defined as the concept supporting the overall facilities’ life-cycle. Figure 2 shows the building model for design, construction, operation, modification, and conceptual design. The operation phase includes facility management, maintenance, and repair. Numerous studies dealt with design and construction, but less effort was put into the operation phase.
Several stakeholders are involved during the operation phase, which is similar to design, planning, and construction processes. These stakeholders have to continuously exchange building information back and forth interactively. The conservative way is to utilize software for discipline-specific tasks and exchange 2D plans and documents with third party parties; this approach is called Little BIM. Conversely, Big BIM means sharing digital building models between parties instead of 2D plans and documents. The building model may be exchanged via an open standard or proprietary data formats; this is called open or closed BIM, respectively [4]. Proprietary data formats may limit the choice of software products or exclude stakeholders that do not have access to the required software. Hence, an open standard is preferable during operations phase.
Central to the entire BIM concept are the Industry Foundation Classes (IFC). This standard defines an open data format to exchange building data. IFC has been designed to cover geometric and semantic data within the AEC sector [4]; hence, it includes several extensions, for example, for products, processes, and materials. Leading proprietary software, for example, Autodesk Revit [14], Archicad [15], as well as open source software, such as xBIM [16] and Java IFC Toolbox [17], are able to handle IFC files. BIM was originally focused on building construction and not infrastructure; thus, bridge models could not be properly exchanged using the IFC. This led to the extension of BIM and the IFC standard to bridges and roads [18]. Further extensions focus on tunnels, airports, ports, and harbors. Although, there is the prospect of exchanging bridge data between the different stakeholders with the help of IFC, 78% of the bridges were built before 1990. For bridges pre-dating that time, no BIM model exists, which is a prerequisite for the application of DIM. A number of studies have been conducted in the domain of 3D model generation of existing buildings via point clouds, widely known as scan-to-BIM [19,20,21]. In accordance with such as-built models, damage information could be added to extend the use of BIM for inspection and assessment.

2.2. Damage Data Model

To define a DIM, Sacks et al. published an Information Delivery Manual (IDM) for the open data exchange during inspection and assessment [3]. The manual provides an overview of the designed inspection process called SeeBridge. The SeeBridge inspection process extends the conservative inspection process, which has been described earlier. Following tasks are part of that process: generation of the bridge model, damage acquisition, point cloud generation, damage segmentation, and the calculation procedure for performance indices. However, the IDM does not describe how to explicitly exchange damage data between the stakeholders.
Several attempts have been made to define data structures for damage information models. First, these models have to incorporate semantic information, such as measurements and relationships. This is covered by existing bridge management systems [22].
Second, visual data, for example, photos, are part of information models as shown by Hüthwohl at al. [23]. They included the photos directly as texture in the model. However, some defects may have multiple photos but a texture with multiple photos would be challenging regarding visualization. A DIM must cover both scenarios: including a texture and including several photos.
Last, geometric data is part of DIMs. Hamdan et al. developed an ontological model to store damage data including defect geometry with relation to a damaged element. The study did not cover the generation of the geometry per-se nor related effects to the component geometry [24].
Another required information is the time relation of a defect. A defect is registered during an inspection and the geometry may change over time. Hence, the defect or defect data needs a relation to time, that is, a relation to an inspection process. This has been covered by the work of Tanaka et al. [25].
Most researchers focus on the inclusion of defect geometry in general, disregarding that physical defects affect the geometry of a component. Furthermore, the generation of defect geometry and transferring the damage information to other applications are missing.

2.3. Damage Data Acquisition

German et al. have proposed an image-based method to automatically detect spalled regions and related properties at reinforced concrete columns [26]. The region of spalling was first isolated by way of a local entropy-based thresholding algorithm, then the exposure of longitudinal reinforcement (i.e., depth of spalling in column) and length of spalling along the column were measured using a global adaptive thresholding algorithm, in conjunction with image processing methods for template matching and morphological operations. That method was tested on a set of images for damaged RC columns, indicating its validity against manual measurements.
They later improved upon their work by adapting the aforementioned algorithms for spalling segmentation and property retrieval to sufficiently detect the absence of spalled regions on concrete surfaces, detecting transverse reinforcement and distinguishing it from longitudinal reinforcement [27]. Those enhancements enabled a better classification based on contextual information from depth retrieval pertaining to the amount and type of reinforcement, which falls into one of five respective categories, namely: no spalling, spalling of concrete cover, no exposure of reinforcement, spalling which exposes transverse reinforcement, spalling which exposes longitudinal reinforcement, and spalling of concrete, which exposes both transverse and longitudinal reinforcement.
Dawood et al. developed an integrated model based on image processing techniques and machine learning to automate consistent spalling segmentation and numerical representation of distress in subway networks [28]. A hybrid algorithm including the support of regression analysis allows a prediction of spalling depth. A spalling processor detects distress attributes from noise-reduced images and creates 3D visualisation models of the defect. Subsequently, the regression analysis model and image processing techniques measure depth and severity of the spalling distress. The overall process and implementation were able to quantify the spalling depth in 75 images with an average validity of 93%.
Wu et al. proposed spalling segmentation method by analysing surface roughness reconstructed from point clouds acquired by laser scanning [29]. In the proposed method, points on ancillary facilities are filtered via circular scan-line fitting and large residual error filtering. A roughness descriptor was used to identify high rough patches. Next, high rough areas on the tunnel surface, such as bolt holes, or segment seams were filtered as well after classifying them using Hough transformation and similarity analysis to verify its classification. The remaining patches were presumed to be concrete spalling.
Hoang et al. proposed another approach to identify image texture for features extraction [30]. Image textures obtained from statistical properties of colour channels, grey-level cooccurrence matrix, and grey-level run lengths were used as features to characterize surface condition of a concrete wall. These extracted features were classified into spalling and nonspalling classes.
A Mask R-CNN architecture developed by Facebook AI Research [31] was utilised by Borin and Cazzini [32] to segment spalling images and automatically back-project the segmented spalling patches from image plane into 3D space using the available information about the pose of the camera for each captured image and its EXIF metadata as a 2D texture laid over host elements in the 3D information model.
Besides manual and optical acquisition methods, Structural Health Monitoring (SHM) provides additional concepts and methods to gather damage data. SHM provides continuous measurements from structures and buildings, allowing inferences about the structural condition [33]. Problematic is the influence of environmental and operational variations to measurements [34].

2.4. Damage Data Applications

Based on the damage data, different applications process the given data. The processing of data is divided into visualization and simulation. This study focuses on visualization. Visualization is necessary for assessment and planning. Planning covers several sub-tasks: planning of non-destructive testing, inspection, and maintenance procedures.
Damage and bridge data have to be visualized for different use cases. Most studies address the visualization for the task of assessment. Bruno et al. developed a framework to assess historic buildings. The Historic Building Information Model (HBIM) includes inspection and survey results to provide a structured overview of defects to engineers [35]. The visualization mainly consists of tabular structured text and related photos.
Based on Structure from Motion (SfM) and laser scans, 3D point clouds of damaged bridges may be generated. Torok et al. have shown how to generate those point clouds and highlight damaged sections in such a point cloud [36]. This approach provides a 3D surface model of the damaged bridge. The assessment needs overviews of registered defects and related components. A labeled point cloud does not provide the related semantics needed.
BIM aims to incorporate raw data, such as photos, measurements, and point clouds; furthermore, conclusions and deductions from stakeholders, for example, task planning or conditions states. Chan et al. have used a BIM model of a bridge and added the condition state of the individual components. Additionally, they highlighted the benefits of proprietary software, that include images and textual information [37]. These two different visualizations are the first step towards virtual model based inspections.
A reasonable assessment also requires geometric information, such as the defect position. McGuire et al. [38] target this problem by adding damage cubes to the BIM model. Visualizing damage and bridge data according to the requirements of national inspection manuals have been covered extensively. However, the proposed approaches are not open for additional tasks, views, and use cases. This is necessary because it is not possible to predict future use cases without them. Hence, this study focuses on addressing assessment requirements and using open standards.
Apart from visualization, using 3D damage data may be utilized for structural analyses. Based on geometric damage information, the Finite Element Analysis (FEA) model may be generated by using adapted material parameters [39]. However, in-depth information on how to exchange damage data with third party software is not provided in this study. Hamdan et al. developed a framework for bridge assessment based on a linked model approach [40]. Such linked models have the disadvantage of data dispersion. For later data exchange, it is beneficial if all data is stored in a single file. Isailović et al. proposed an open framework on the basis of point clouds [41]. However, the photos for damage detection are generated based on the point cloud that may lead to information loss. To omit this limitation, this study used photos of the inspected bridge as input.

2.5. Problem Statements and Objectives

Several frameworks that generate point clouds and damage information from images and perform FEAs exist [39,40]. However, these models focus on supporting FEA only; other applications or domains have not been considered. Other frameworks, which are focused on the traditional inspection process, lack supporting functionality for FEA, durability simulations, or special planning tasks, for example, for non-destructive testing [35,42]. The aim of this study is to provide a framework utilizing open standards enabling the integration of further domains in future applications. The Framework is based on a DIM developed in prior studies [43,44]. The following research questions are addressed by this study:
  • How are damage geometries generated on the basis of photos?
  • How are geometric as-damaged BIM models generated?
  • How could additional data, for instance, documents or photos, be added to the geometric as-damaged BIM model?
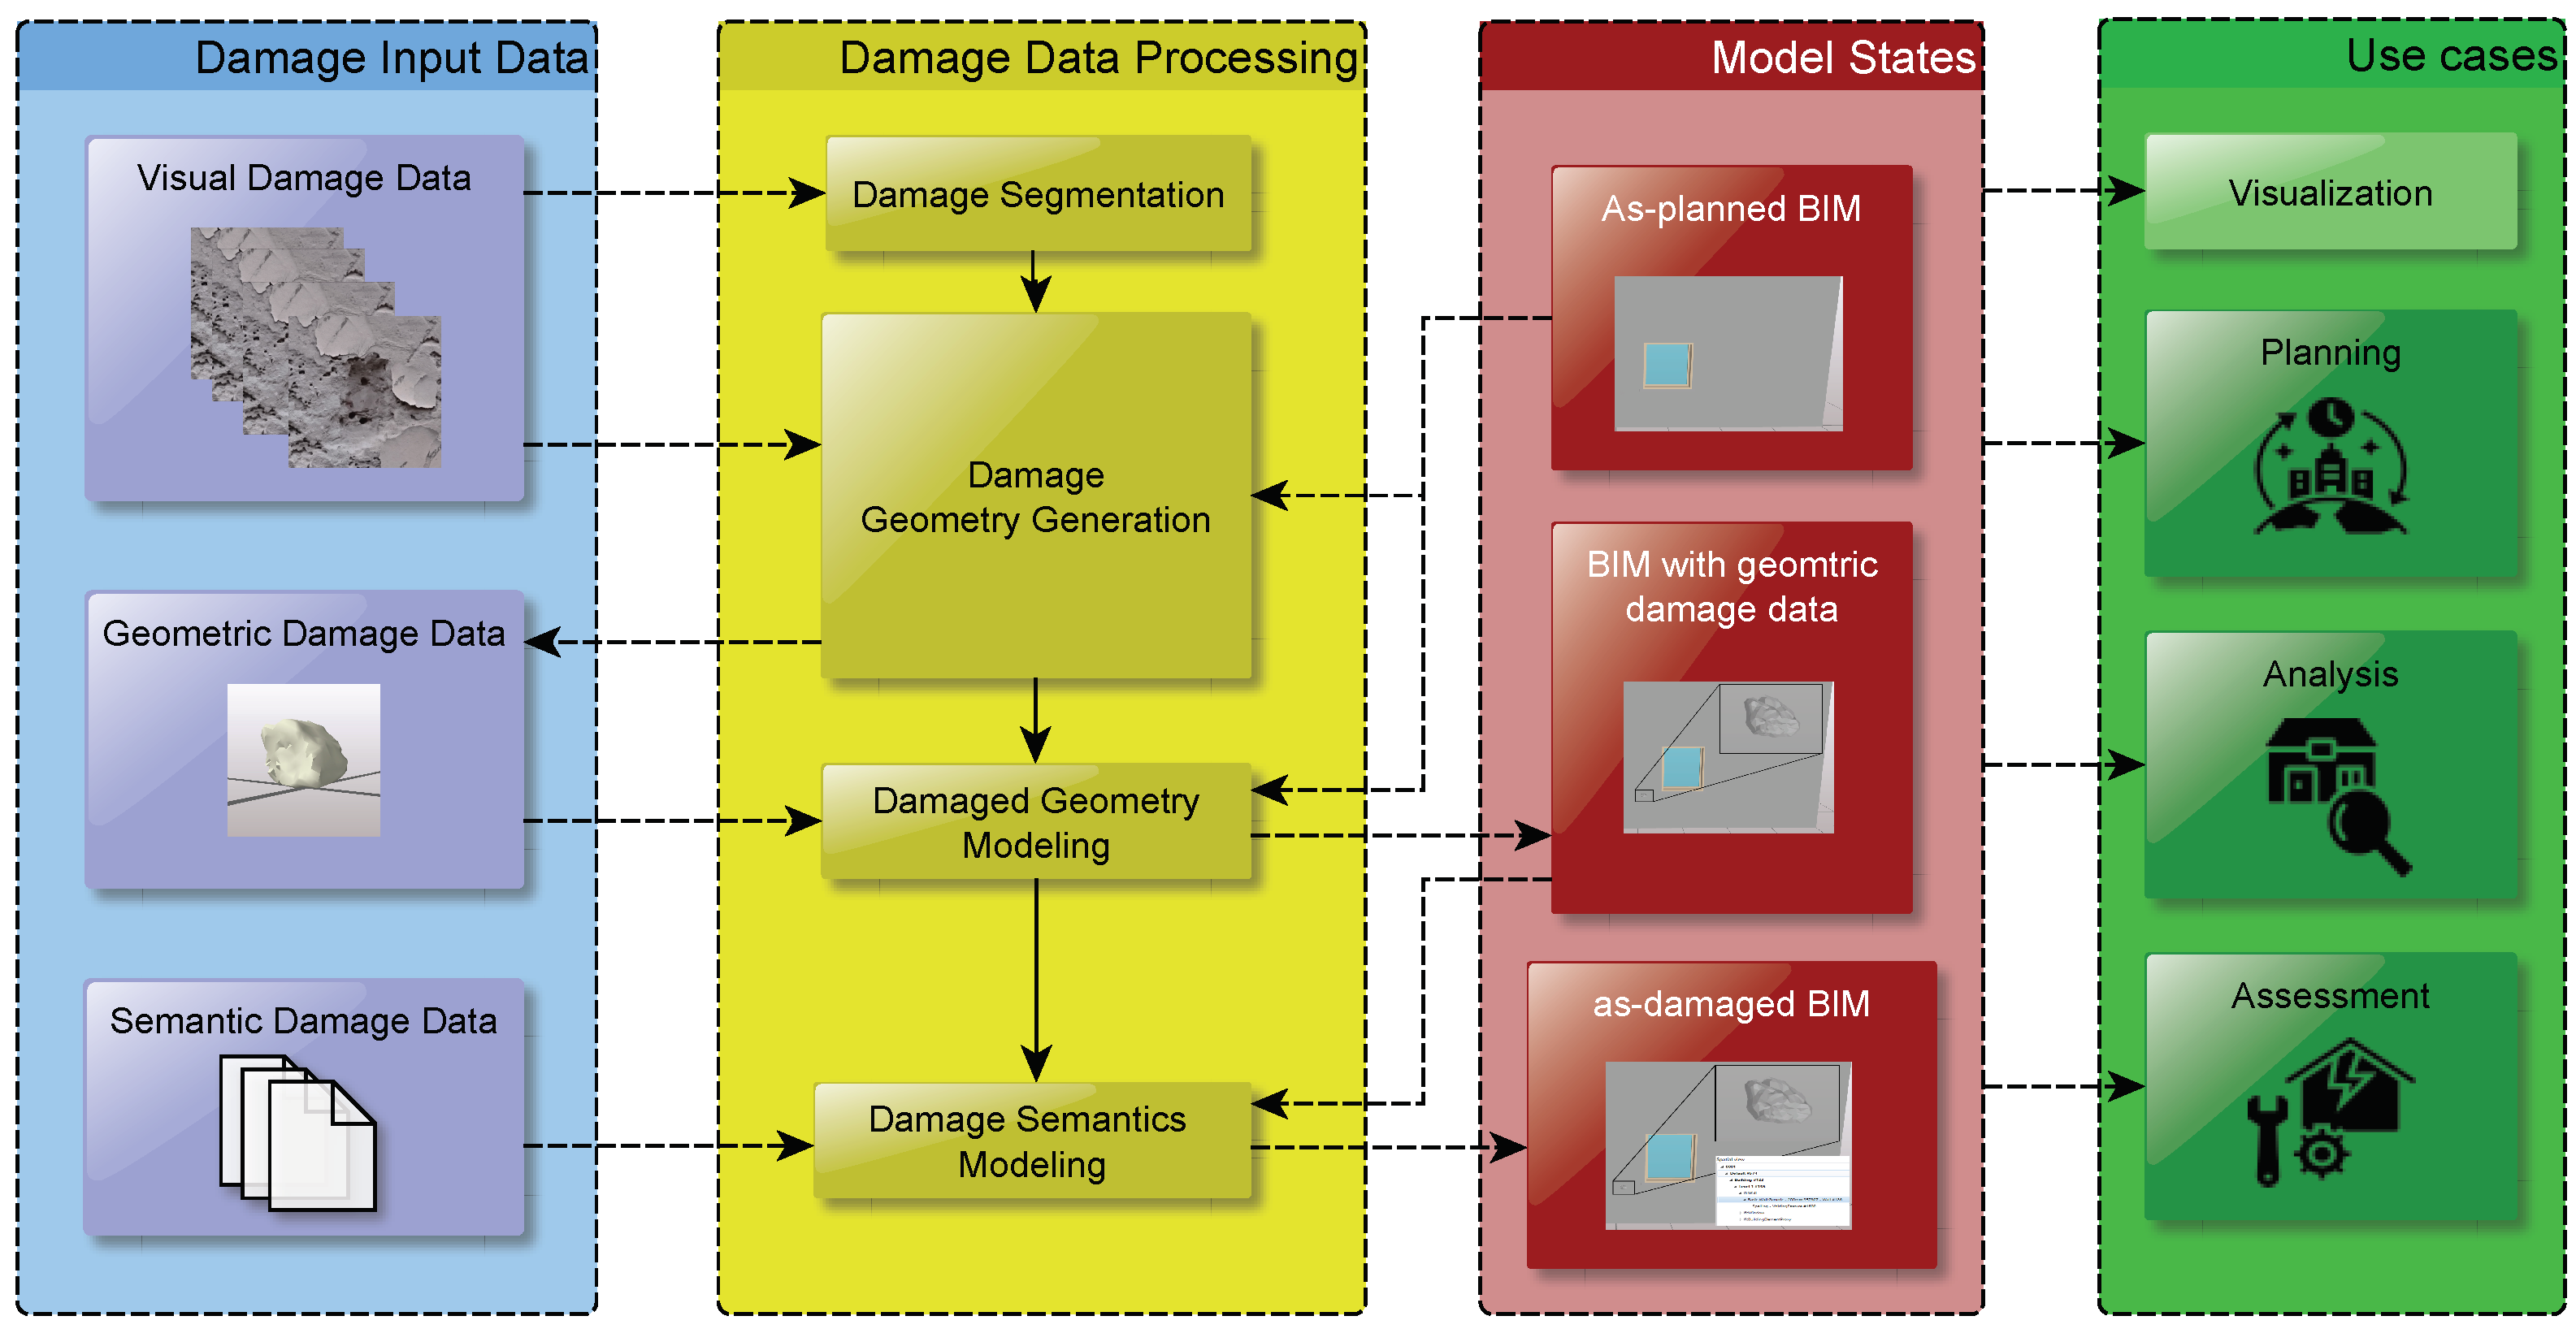
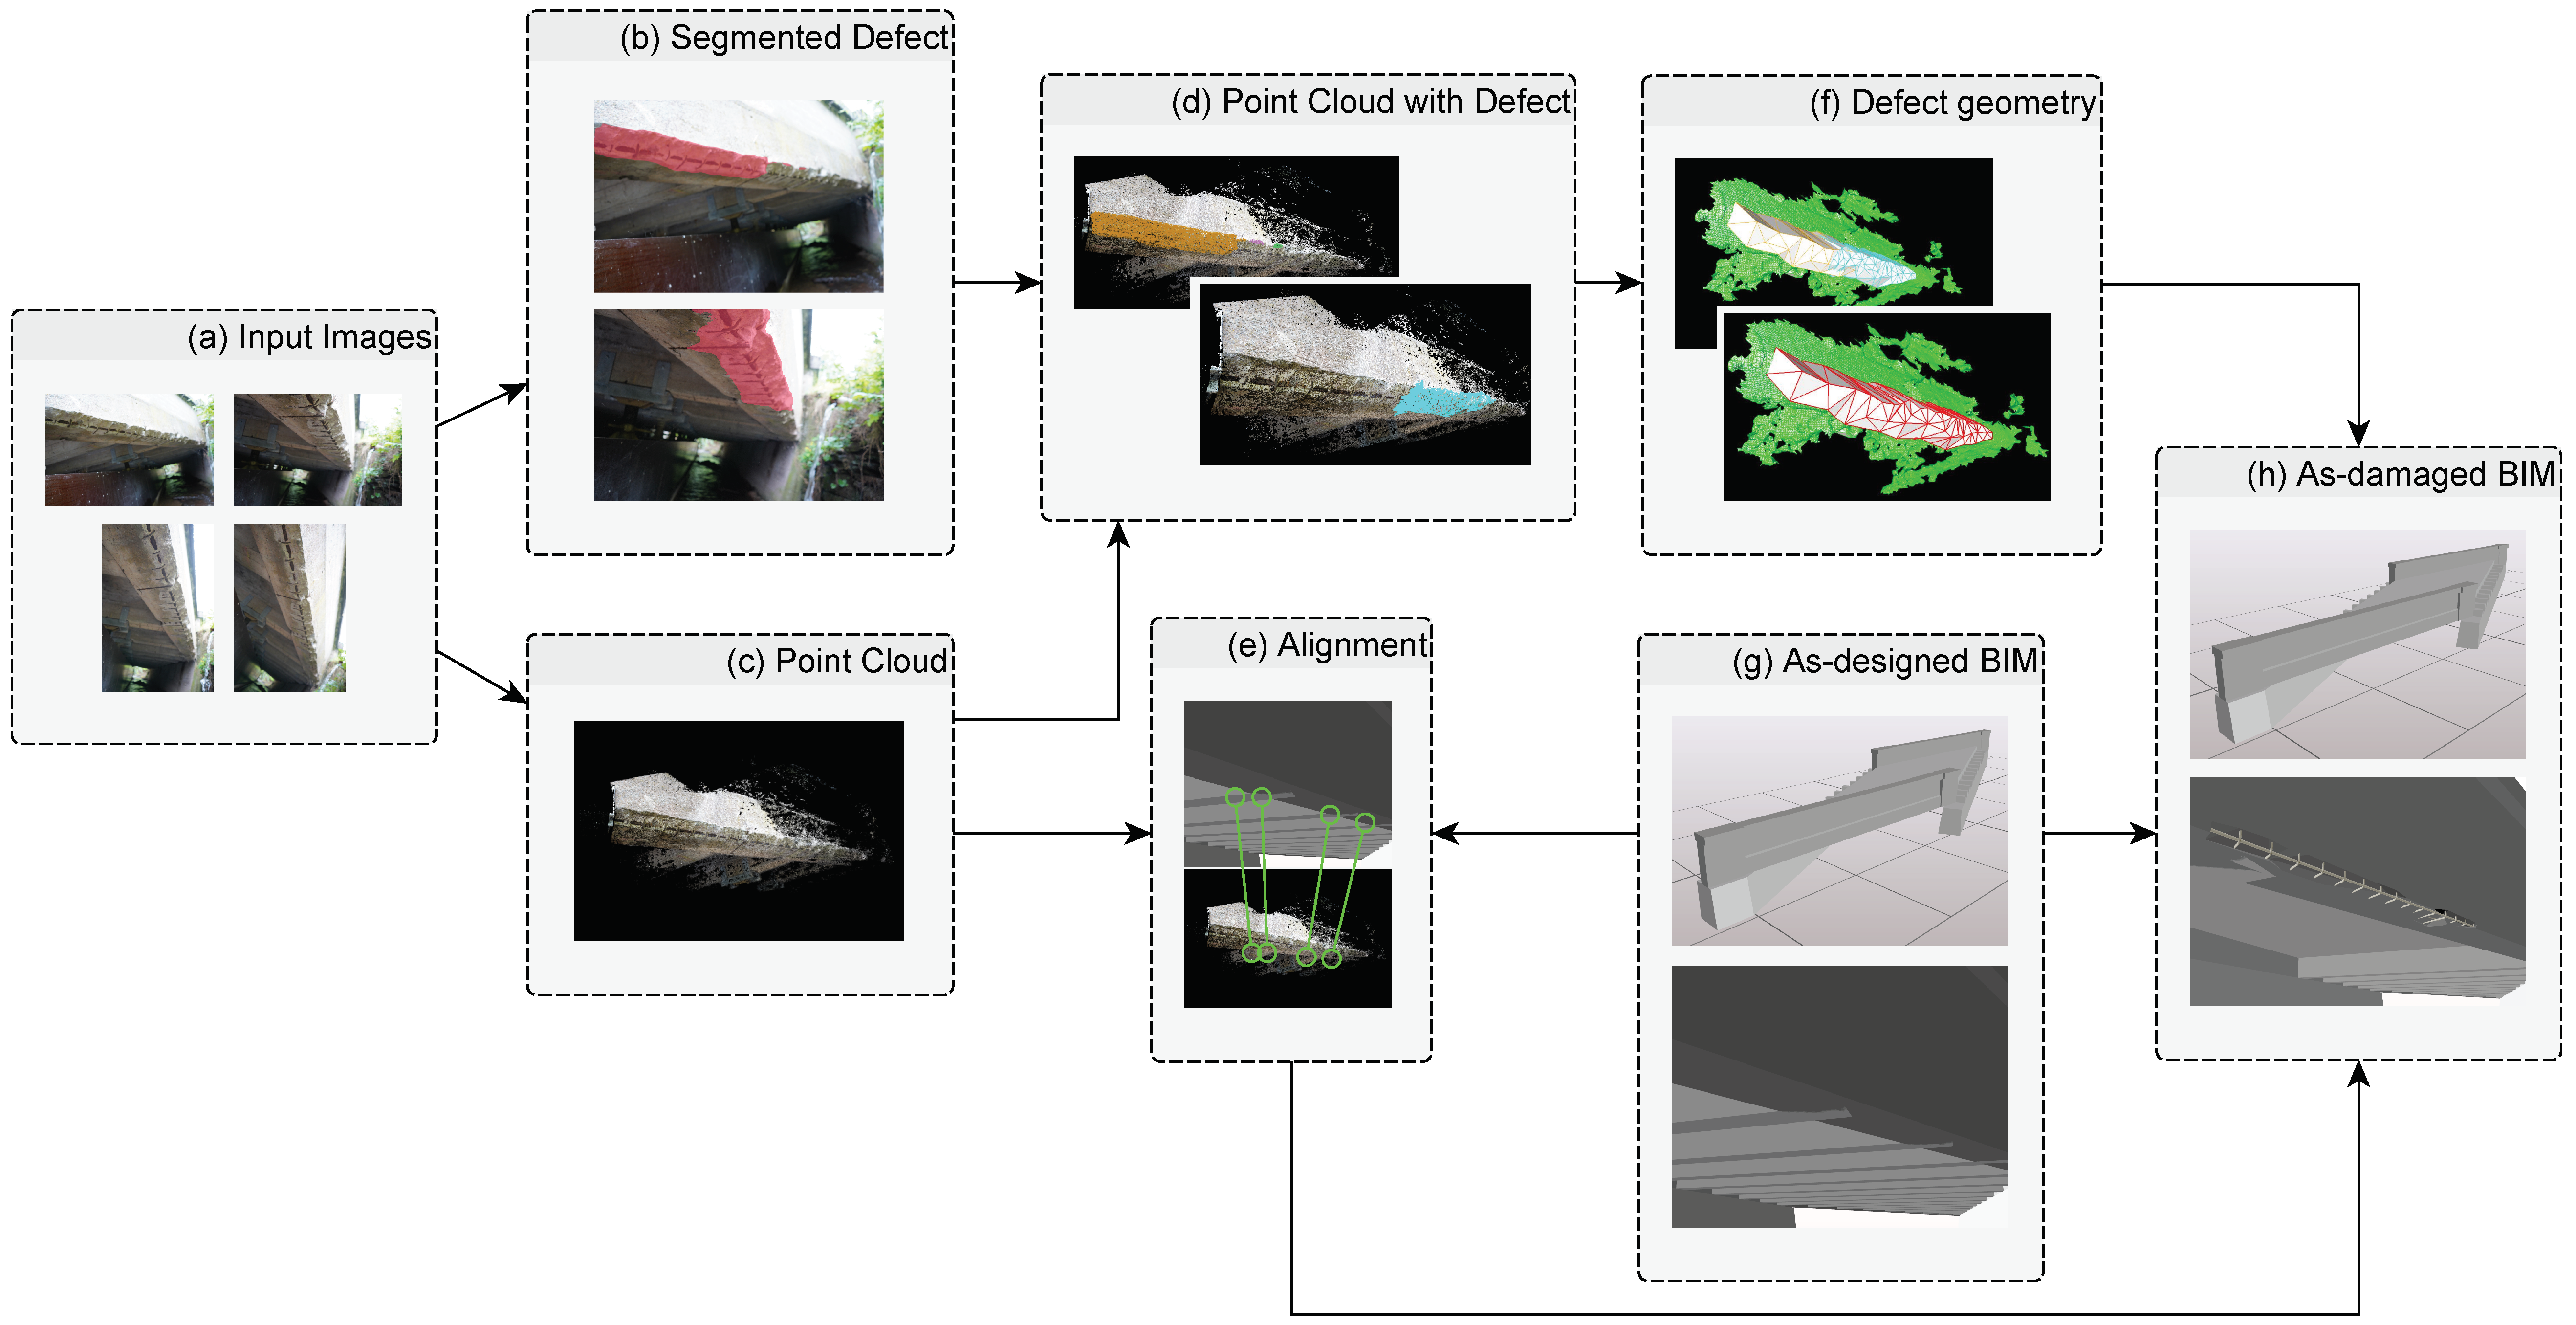
3. Methodology

Figure 3 shows the framework with the three pillars Damage Input Data in blue, Damage Data Processing in yellow, and the resultant Model States in red. Possible subsequent processes are depicted in green on the right side. The bridge inspection delivers the required damage data, such as photos, measurements, and textual descriptions. To segment defects and generate the related geometry, the damage segmentation and geometry generation processes take the visual data. Subsequently, the damage alignment defines the position of the defects at their related components using the defect geometry and the BIM Model of the bridge. Finally, semantic damage data is added manually to the geometric as-damaged BIM model. The resulting model is used for later planning, analysis and assessment. Planning is necessary for further surveys, for example, ultrasonic or impact-echo. Given the 3D as-damaged BIM model, 3D Finite Element Analyses (FEA) may be set up easier because the geometry of damaged components may be directly imported into the simulation environment. Furthermore, probabilistic simulations may utilize semantic and geometric data. Last, the assessment of the bridge is based on all data incorporated in the as-damaged BIM model. The proposed method covers the entire framework with no in-depth information about damage segmentation, geometry generation, or damage alignment.

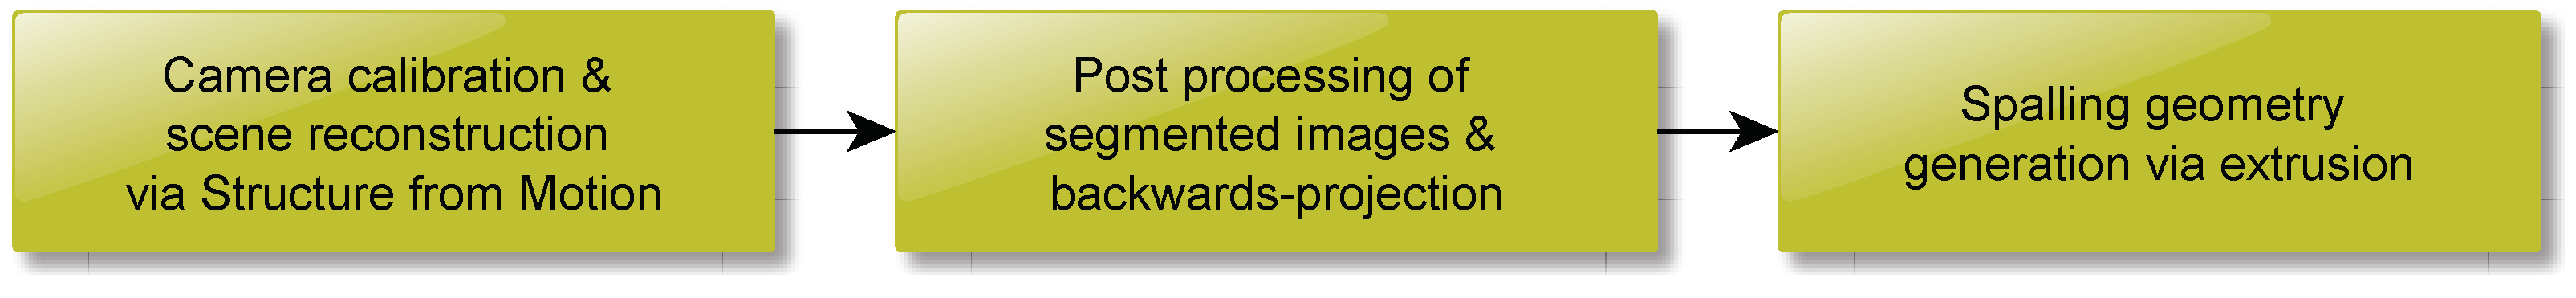
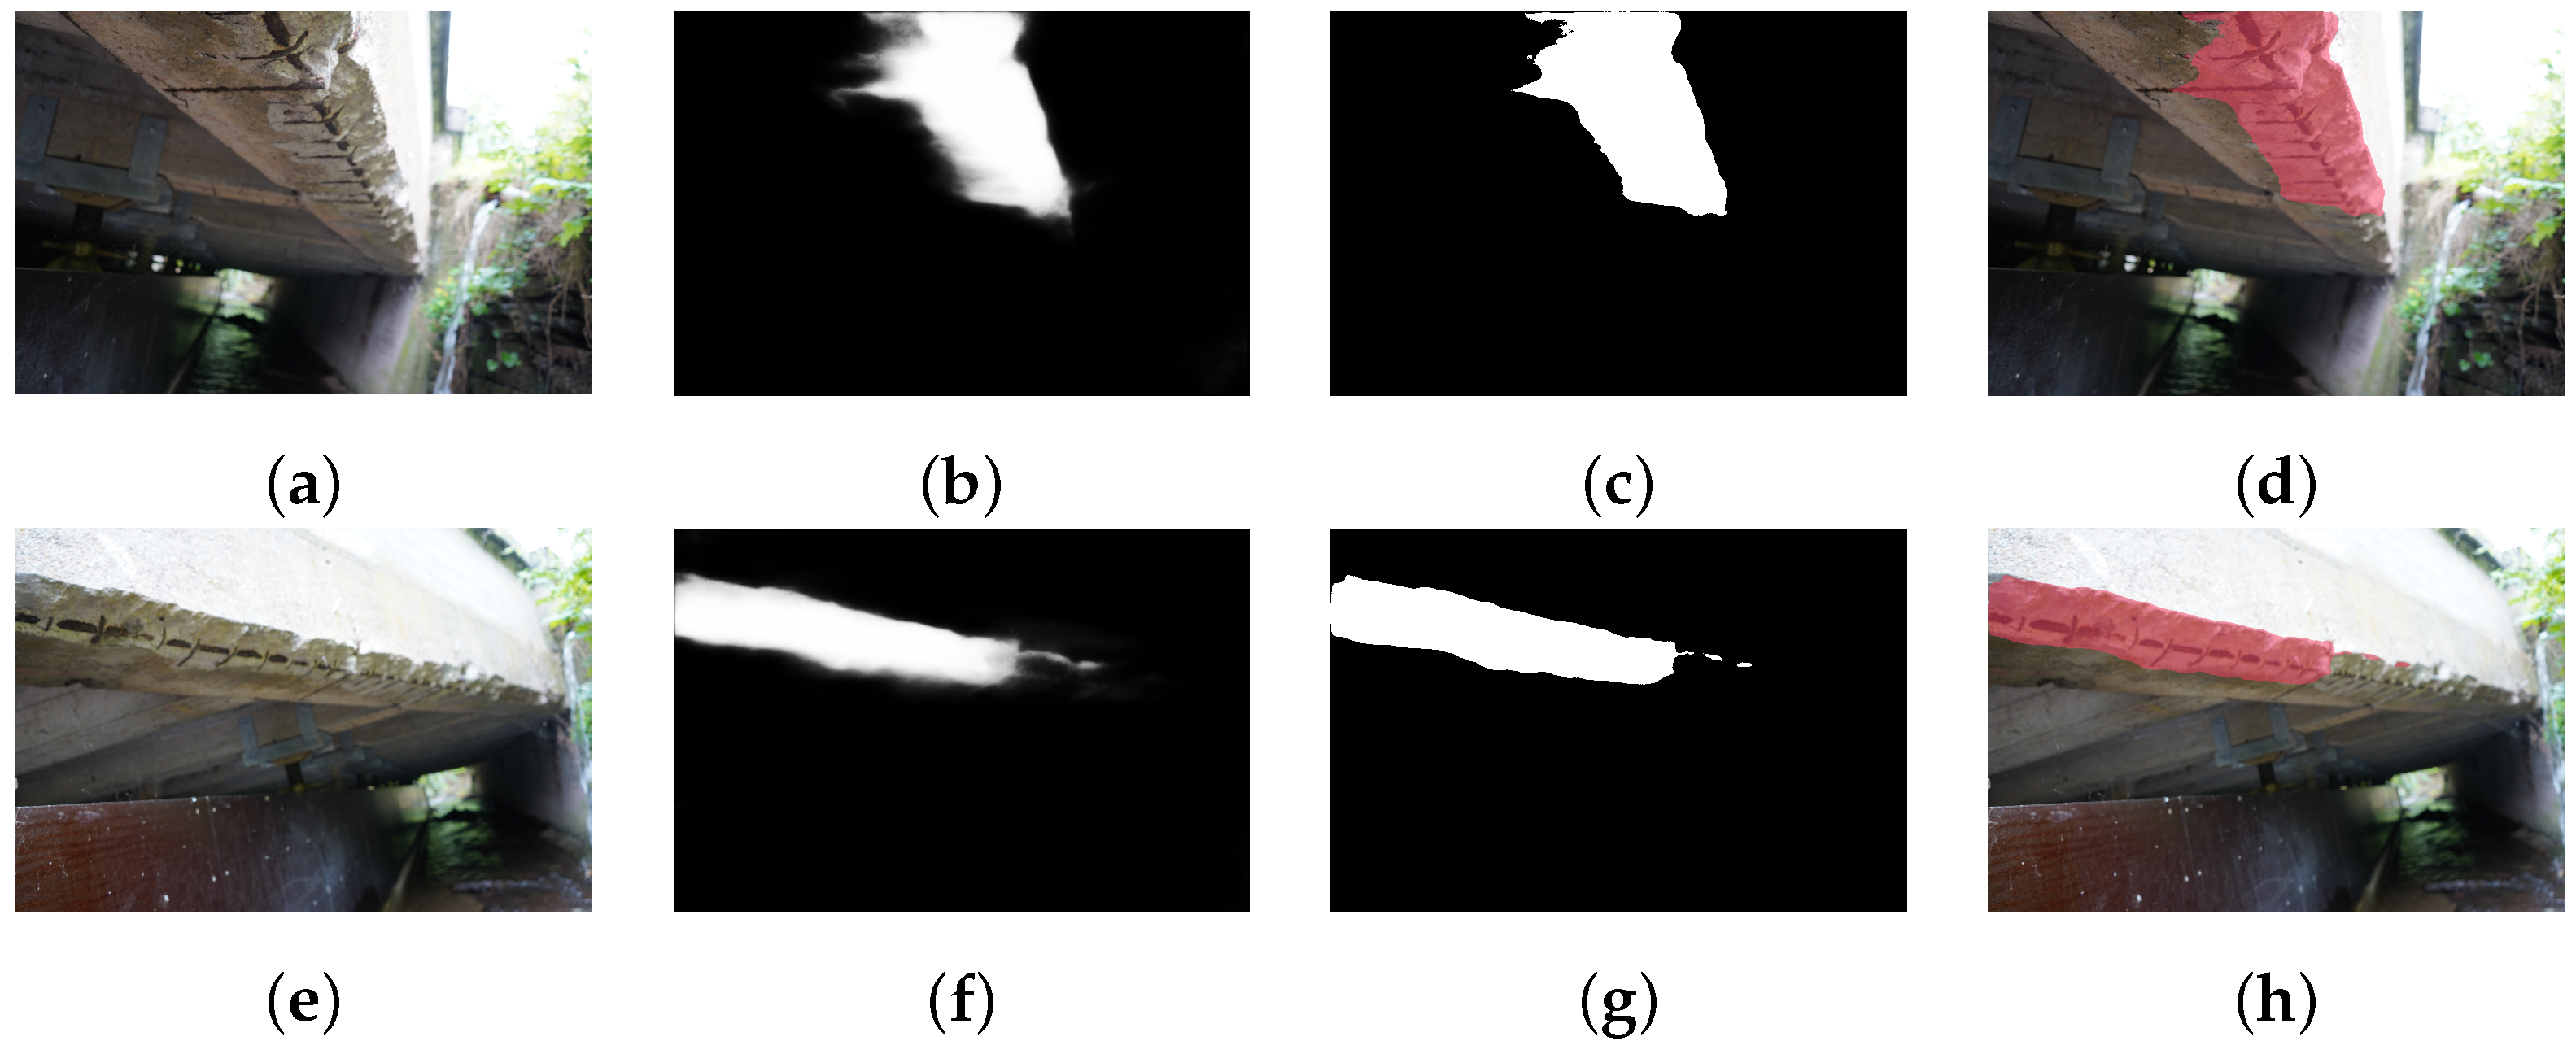
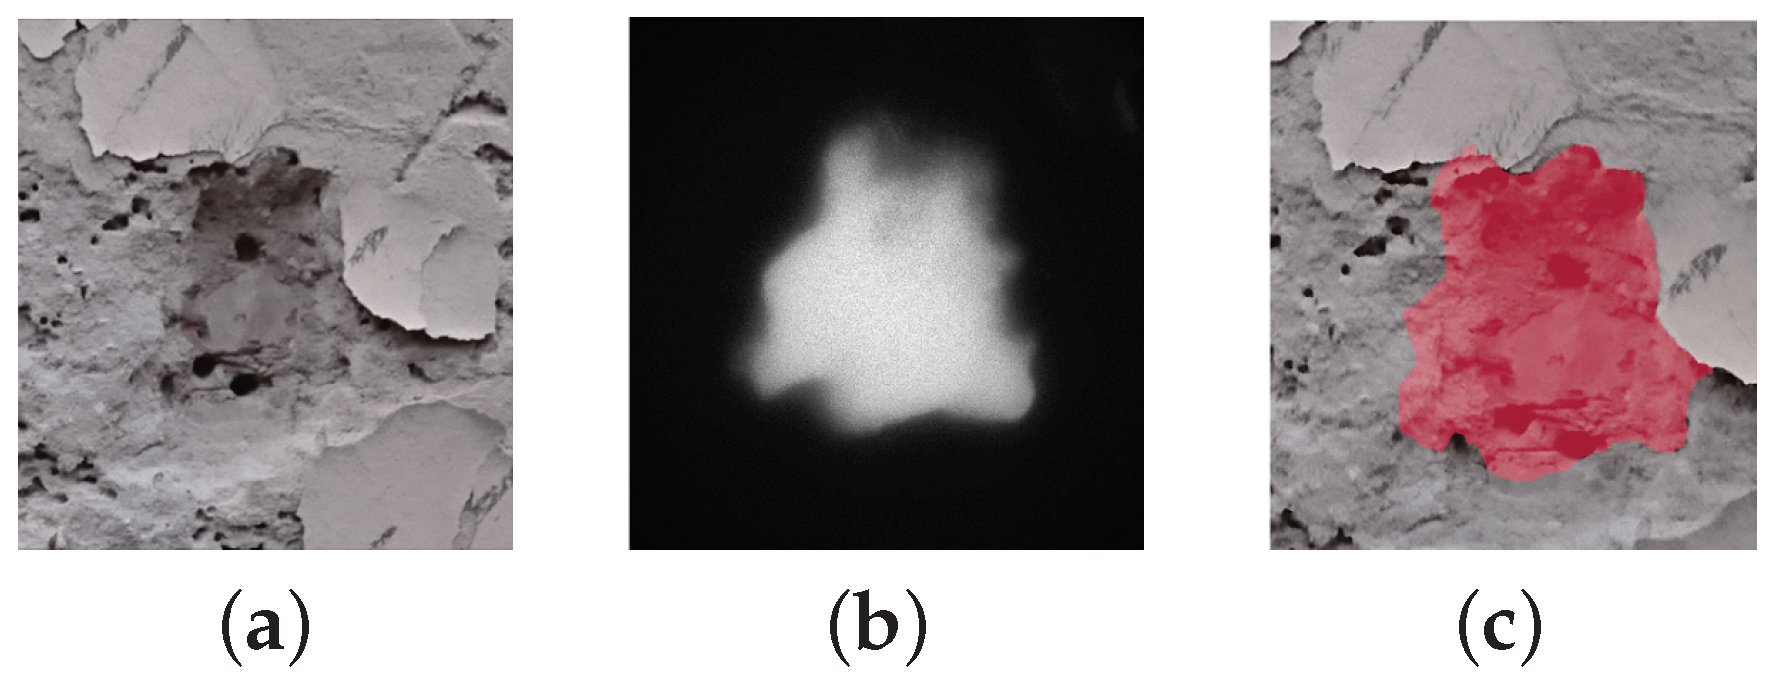
3.1. Damage Segmentation

Convolution Neural Networks (CNN’s) have been proven to provide superior performance in object recognition, that has been repeatedly demonstrated at the Kaggle challenges. Several works have proved these advantages in the case of spalling detection and segmentation as well [41,45,46]. As no point cloud dataset of damages has been compiled so far, the time consuming, and loaborious manual annotation process of damage classes they require for processing such dataset to allow retraining a CNN model for point cloud segmentation, and the impracticability of the reliance on unsupervised learning models for point cloud segmentation to produce unlabelled point clouds that have to be later identified manually, this study has focused on damage recognition from images. Hence, this study relies also on a CNN for semantic segmentation of spalling defects from images. Out of numerous CNN models available, the TernausNet16 has been chosen for this study. From the acquired inspection images, the spalling could be identified at pixel level via semantic segmentation inferred from the TernausNet16 retrained on a dataset containing images of spalls via transfer learning. The original inspection image is then provided as an input to the retrained model, which in turn outputs a probability map representing the probability of each pixel in the image as a decimal value in between 0 and 1. This probability map could be then visualized as a grey-scale image and thresholded at a specific probability value above which the pixel is to be classified as a spalling to produce a binary map of values containing either 0 or 1 only [47]. Figure 4 shows some exemplary photos for the steps taken during segmentation. Figure 4a shows the photo with the damage, Figure 4 shows the damage probability map, and Figure 4 shows the overlay of both after thresholding.

3.2. Damage Geometry Generation

The main three steps followed to generate the damage geometry on the basis of photos are shown in Figure 5. First, photos of a checkerboard pattern are used to calibrate the camera. Intrinsic parameters and the radial distortion coefficients, which are required for 3D reconstruction, respectively for undistorting images and their segmented masks, are defined by this calibration. With all intrinsic parameters identified, the OpenSfM library in Python was then used to 3D reconstruct a dense point cloud based on the inspection images up to scale. The process of generating the point cloud may be accelerated by separating the images into clusters to generate point cloud submodels. Furthermore, this modification limits the need to segment unnecessary images used to reconstruct the scene and could be used to reduce the density of submodels without defect geometries.
Second, among the outputs of the resulting 3D reconstruction are the estimated pose of the camera for each inspection image taken (i.e., 3D rotation and translation) as well as its depth map. This additional information concludes the full knowledge of all variables in the perspective projection equation for each image, which could be utilized to project the classified spalling pixels in the selected images of choice backwards into the 3D space of the reconstructed scene [48,49]. The regions of interest classified as spallings in the binary maps of the selected defect images could be then converted from pixel units into 3D world coordinates. Figure 6 shows the point cloud with the marked damage points on the left. These points are triangulated to retrieve the surface of the defect.
Third, to reconstruct the shape of the spalling, the unit vector for the extrusion direction is derived from the arithmetic mean of all conformed normals pointing into the direction of the camera for all vertices of each segmented spall patch in the point cloud. Each main patch is defined by merging overlapping labeled patches from different images via a boolean union operation after filtering out duplicated vertices, if they exist. Extruding along that unit vector for a distance significantly larger than the depth of the hosting damaged beam ensures the generation of a valid defect shape with an outer surface always protruding from the surface of the hosting building element. Figure 6 shows the resulting damage geometry after the step of extruding. Overdimensioning the subtraction geometry avoids the possibility of erroneous boolean difference operations when creating the voids that was reported by Isailović et al. [41]. On the most right of Figure 6, the subtraction is illustrated. This step requires further semantic modeling.

3.3. Damage Modeling
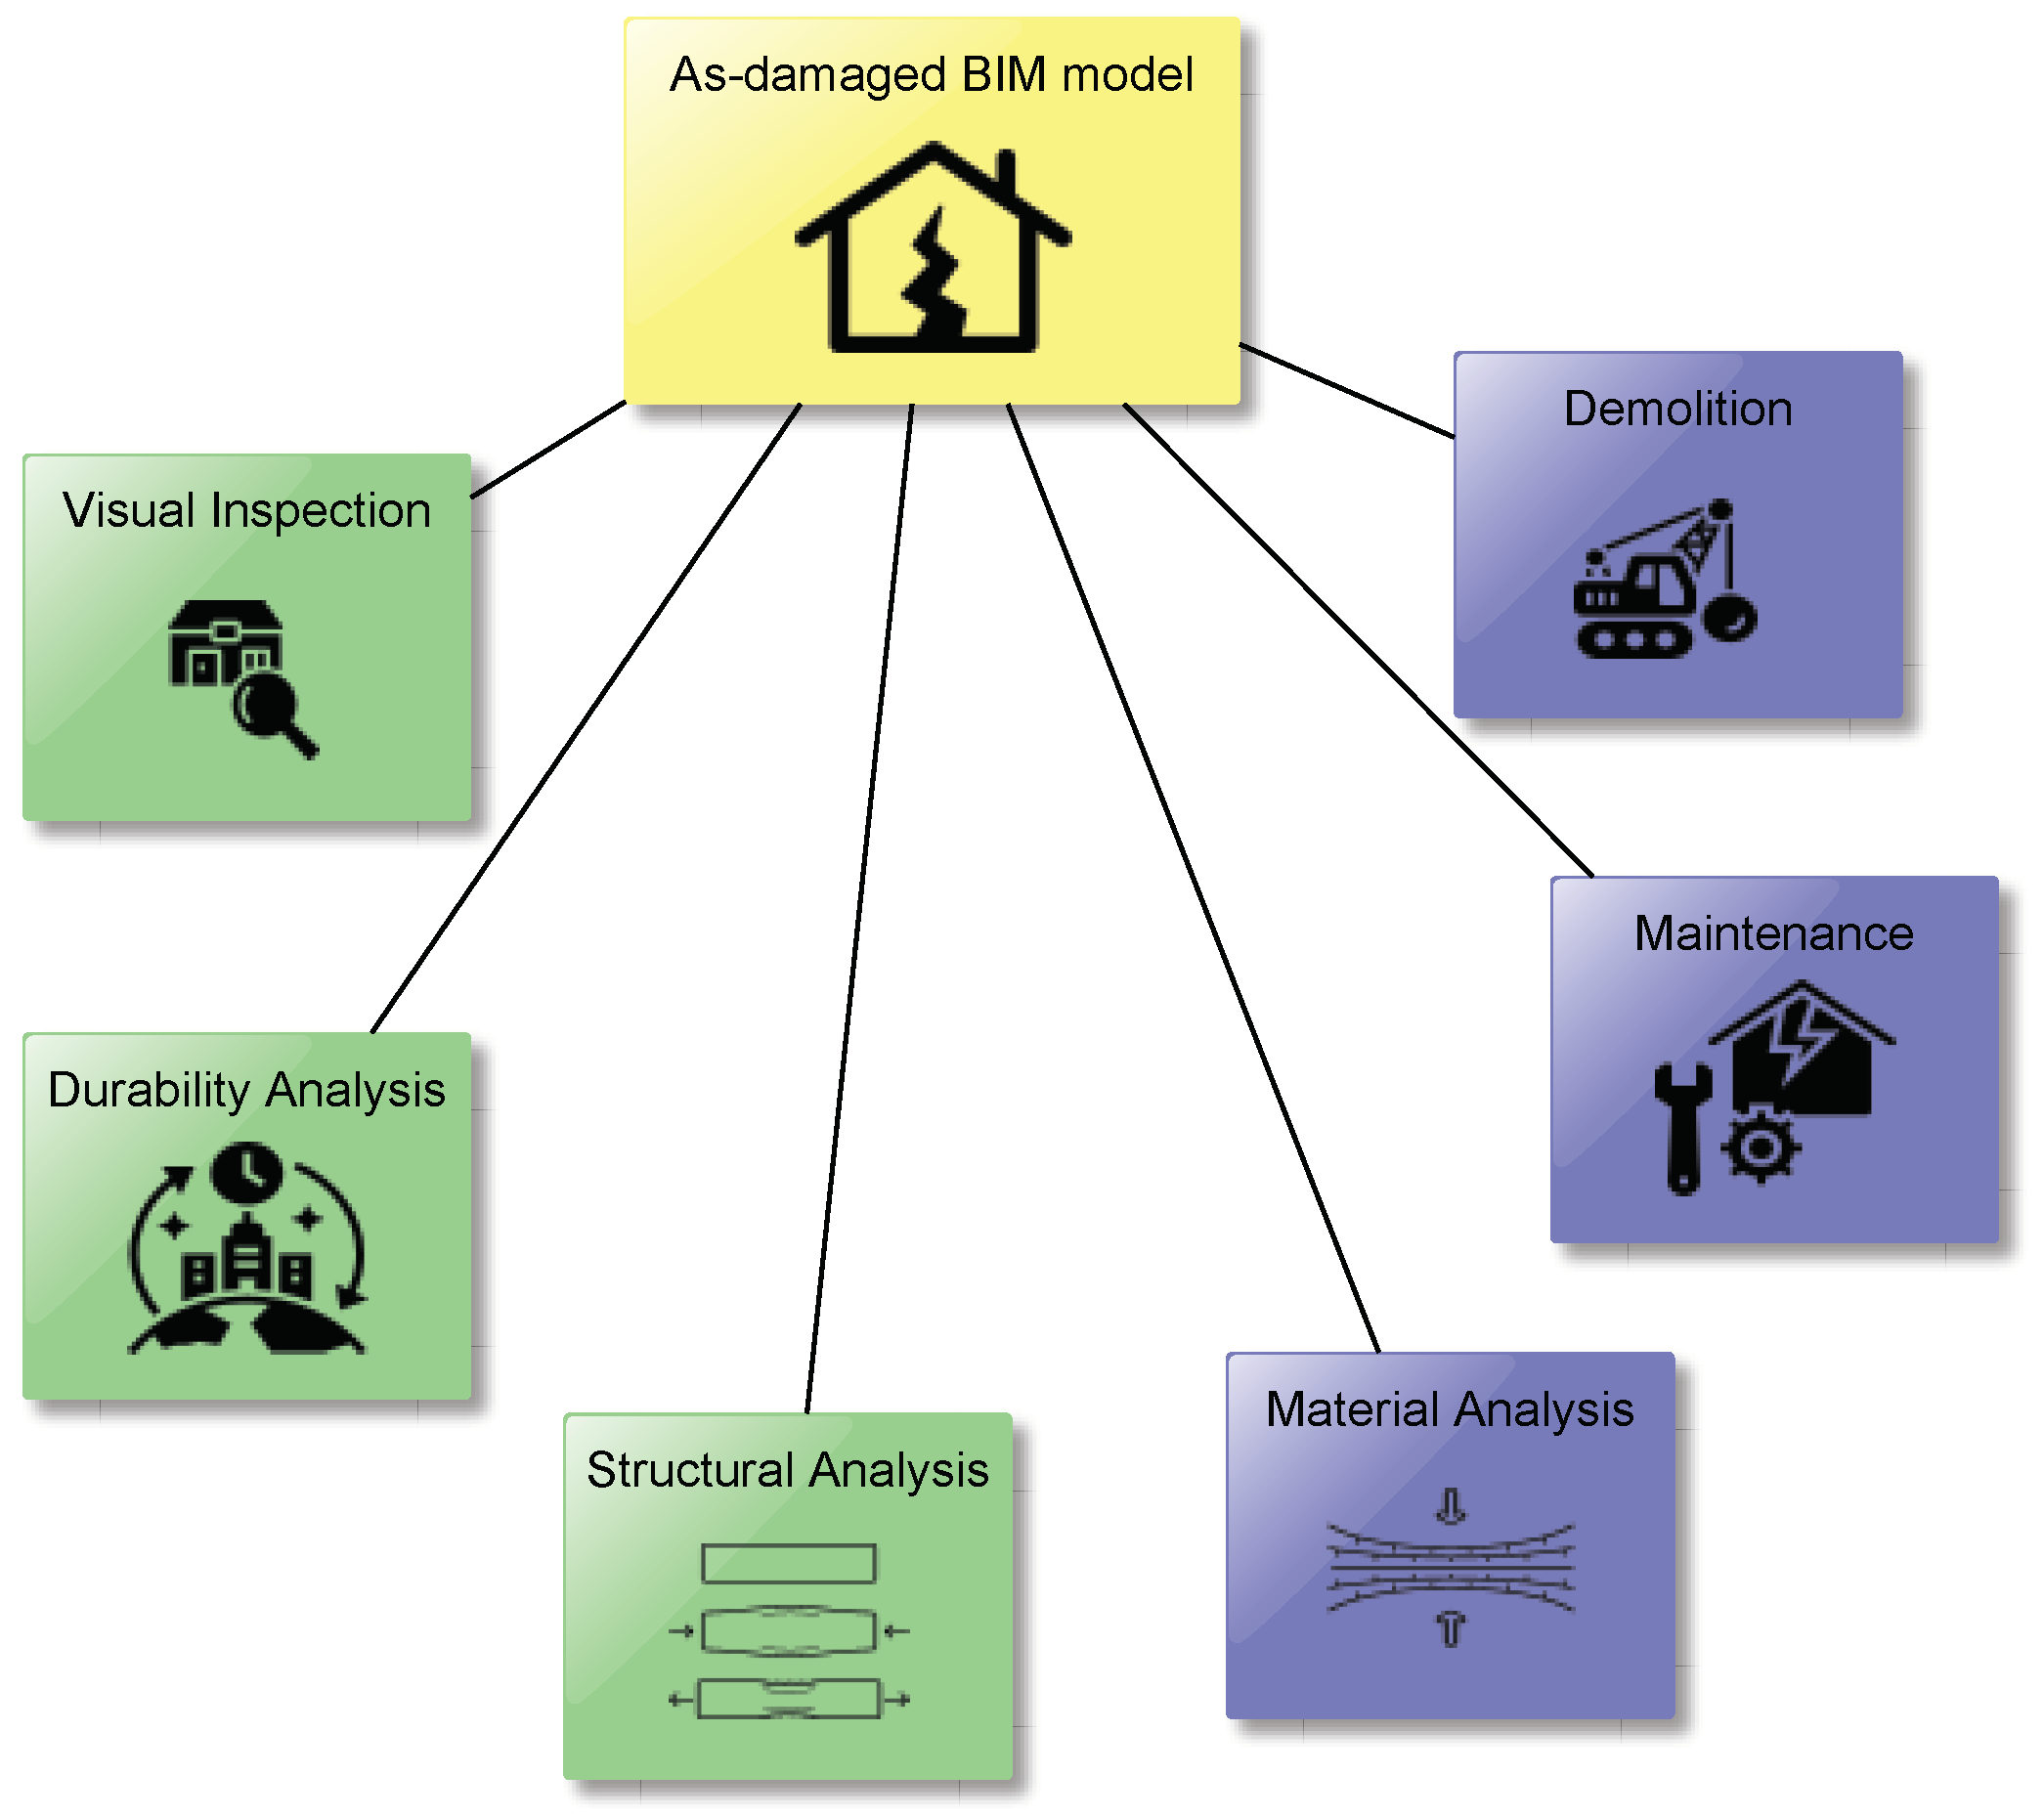
Damage modeling includes geometric and semantic modeling. After the calculation of the geometry, it is necessary to create an as-damaged BIM. This includes the alignment and linking of the damage. Aligning the defect geometry correctly in the resulting BIM model requires the coordinate transformation between the generated point cloud and the BIM model. For this purpose, a BIM model of the afflicted structure or component is generated and a synthetic point cloud is calculated based on this model. The dense point cloud from the SfM and the synthetic point cloud from the BIM model may be aligned manually or by using automated methods such as Iterative Closest Point (ICP) algorithm [50,51].
The data model is the central exchange point for the entire framework. Section 2.2 discussed the requirements of an open standard supporting multiple domains. Figure 7 shows a UML class diagram of the final data model incorporating semantic and geometric data. Blue elements are semantic data, visual data is depicted in green, and yellow elements refer to geometric data. Bridge related classes are colored in gray.
A single defect is represented by a DefectAnnotation with a name, id, and description. Such defect needs a relationship to the affected component; this relationship is realized with an objectified relationship; namely either the DefectProductRelation or the DamageGeometryCutout. The former relationship only represents that a defect affects a component. The latter includes the geometric impact of a defect, such as the subtraction in case of a spalling. Objectified relationships may carry additional information, for example, a name and description. Furthermore, the defect has a DamageType; damage types may be crack, spalling, or corrosion. Some defects need additional measurements, such as width or depth. This information is stored in a Measurement object. Several Measurements are grouped into a MeasurementSet. As an example, the breadth and depth of a spalling are stored as measurements with a value and unit. These two measurements are grouped into a measurement set as geometric parameters.
Defects may have relationships to other defects, such as a cause or an effect, that is stored in the objectified DefectCause relationship, for example, a spalling is the resulting defect of a corrosion. Last, additional documents may be provided for further information about a defect or damaged component. For this purpose, a DocumentReference is available. This document reference stores at least a label of the document, an identifier, and the URI to the document.
Images, for example, photos or sketches, are a combination of geometric, semantic, pixel position, and pixel color density data. If images are rectified, they may be used as textures depicted on a 3D geometry. For this purpose, the data model contains the class Texturing. A texture needs a defined area to be placed onto; this information is stored in the TextureArea class. The Texturing itself contains the URI of the image and is linked to the DefectAnnotation.
Geometry data are crucial for physical defects, for instance cracks or spalling. A defect annotation and a building product have one or more geometries. Multiple geometries occur if a defect has been registered repeatedly over time or if a component has an undamaged and damaged representation. To consider multiple geometries with the related context information, the geometry has a related RepresentationContext.
On the basis of the BIM model with the related geometric damage information, further semantic and visual data is added. Several studies proposed methods for automatic semantic enrichment. Although, this study relies on manual semantic enrichment, automatic enrichment may be used as well. One task is to add additional defects to cover further damage types, such as material changes, joint defects, or divergences from specification. Another task is to include the cause and effect relations between individual defects or group defects. To include external documents, additional photos, or textures, such data is added manually as well.

3.4. Use Cases

Subsequent use cases may be categorized as manual, for example, planning an inspection, or automatic, for instance, condition rating. A few use cases in the operations phase have been automatized. Some examples are the automated generation of FEA models [52], automated assessment [53], or automated deterioration prediction [54]. Generating FEA models requires material data for parameters, such as tensile strength, and damage geometry data for cross sections. Material data is included in up-to-date BIM models; damage geometry data is included in DIM models. These data are processed to generate structural models with either slabs, shells, and bars, or volumetric components. Performing a volumetric FEA, the 3D geometry has to be meshed. All necessary data is included in the provided data model.
Automated assessment could be based on semantic data, like measurements or classifications, on image data, geometric, or a combination. Numerous images may be collected during the inspection and stored in the model. These data may be processed by additional image processing algorithms, neural networks, or other data processing techniques to identify further damage parameters or directly rate defects and components. Further damage parameters and also the final assessment may be stored in the model provided in this paper.
Similarly, predictions for damage extent and severity are possible. Stochastic models, like Markov chains [54], predict damage ratings based on past ratings. Other models focus on the prediction of damage parameters, for example, the width or length of a crack. These approaches use finite element analysis, boundary element analysis, or similar techniques for their predictions [55]. Subsequent ratings are based on the calculated parameters. Parameters required by these methods, may be also extracted from the given data model.
However, numerous tasks in the operations phase are performed manually and require an appropriate visualization still. Although, the model proposed in this paper provides the required data for multiple use cases, only visualization is explained to limit the scope.

4. Implementation

The implementation is split up into damage geometry generation and data modeling.

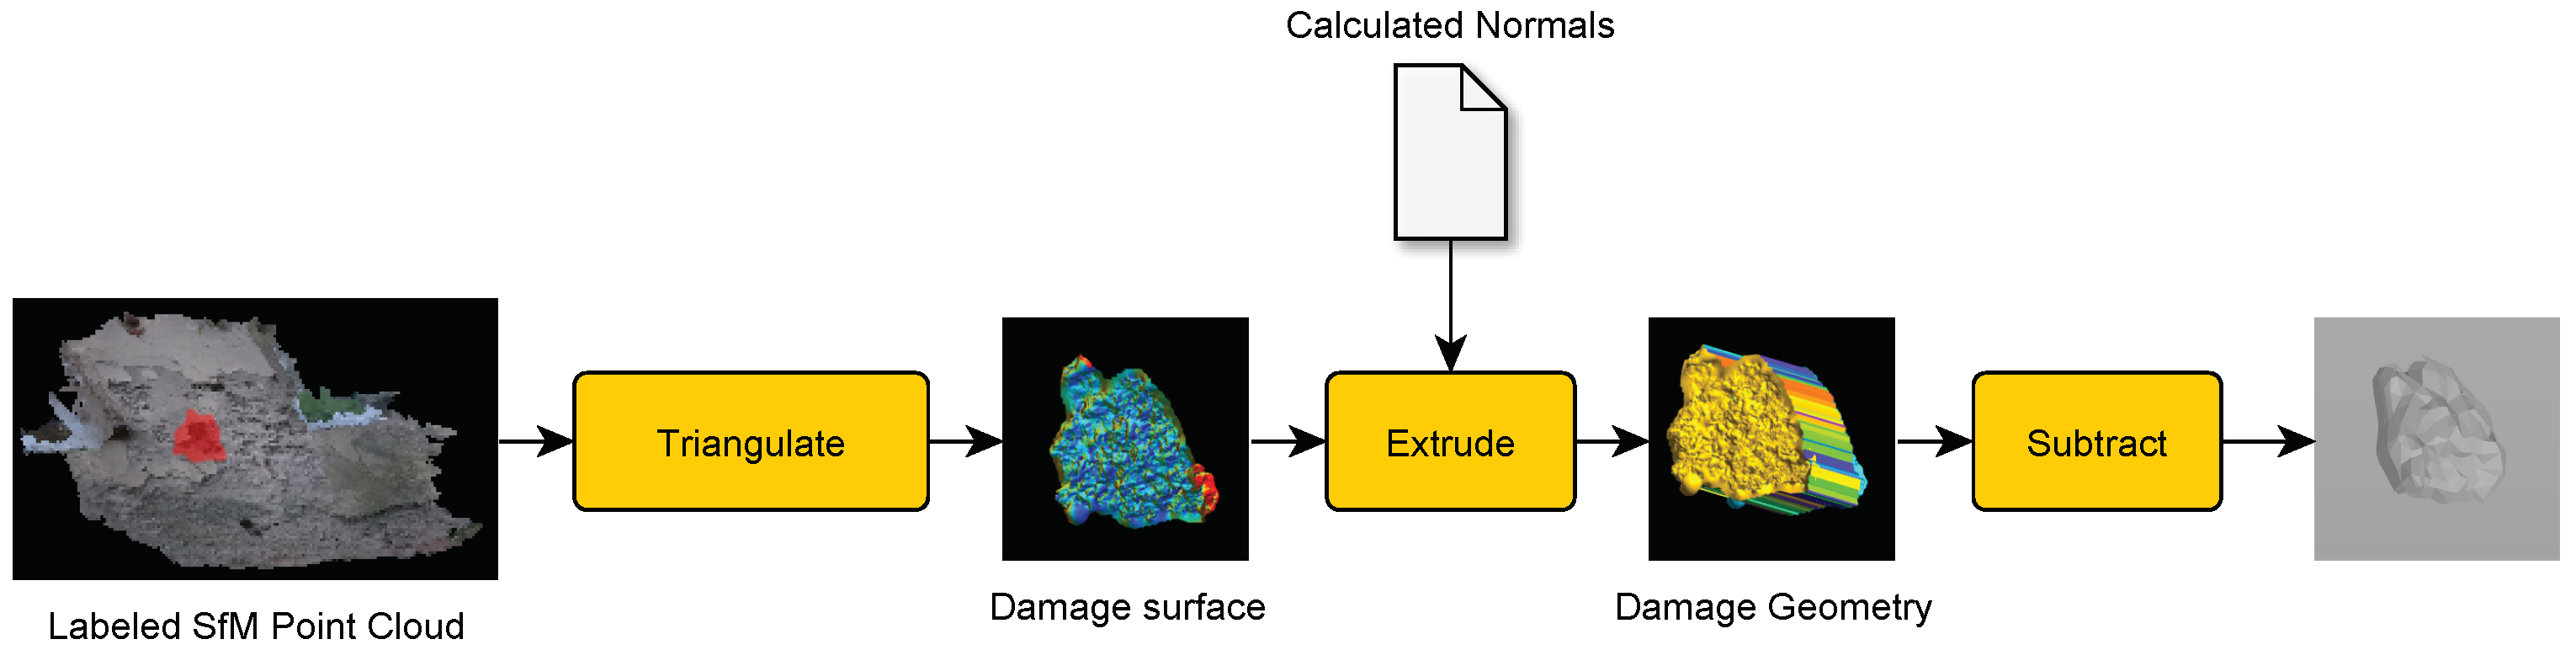
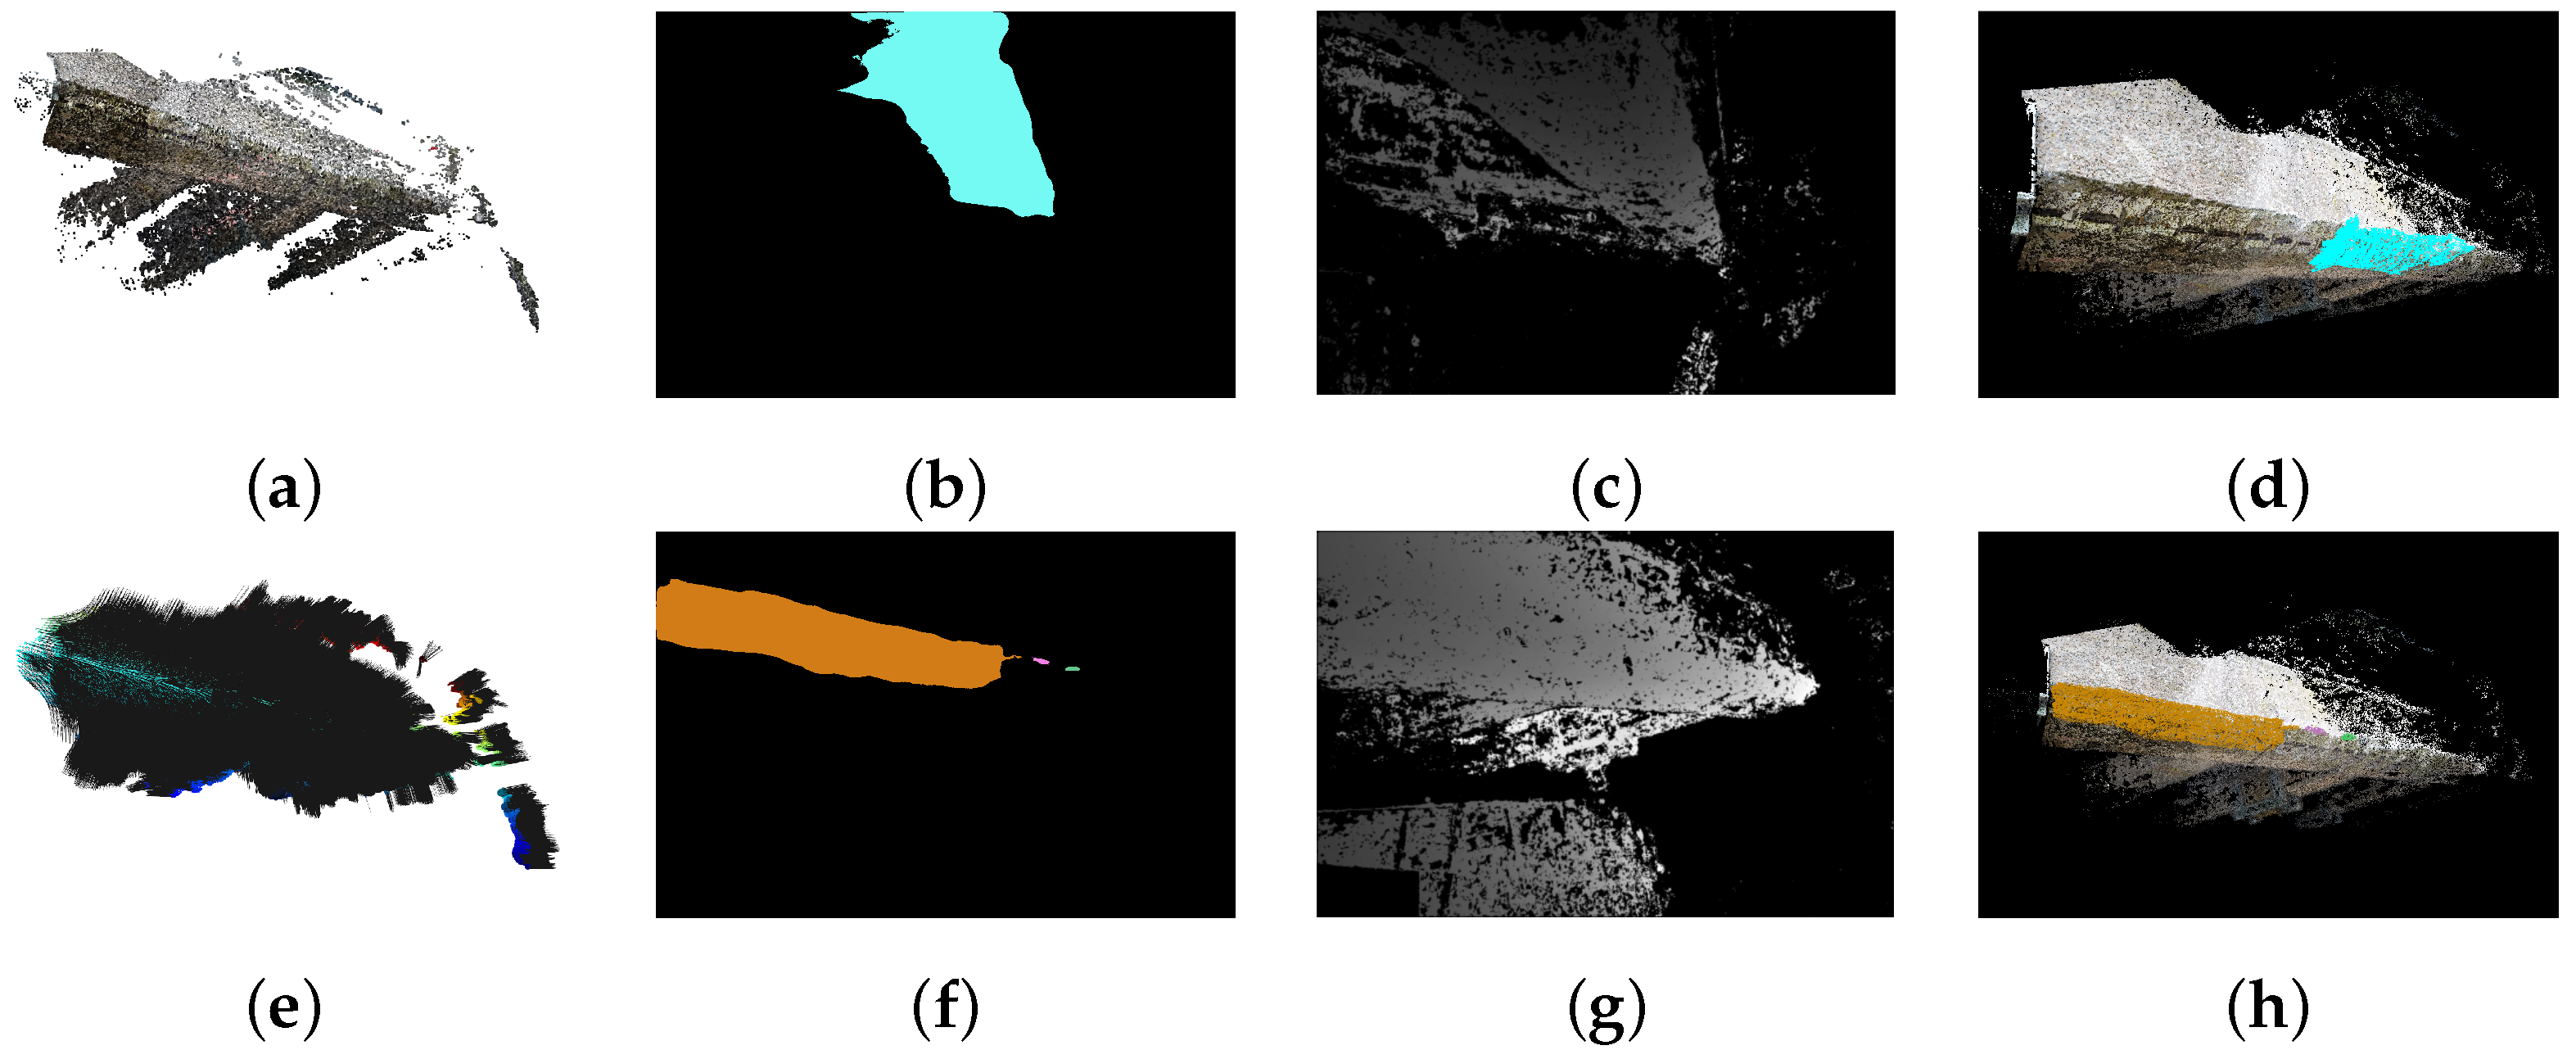
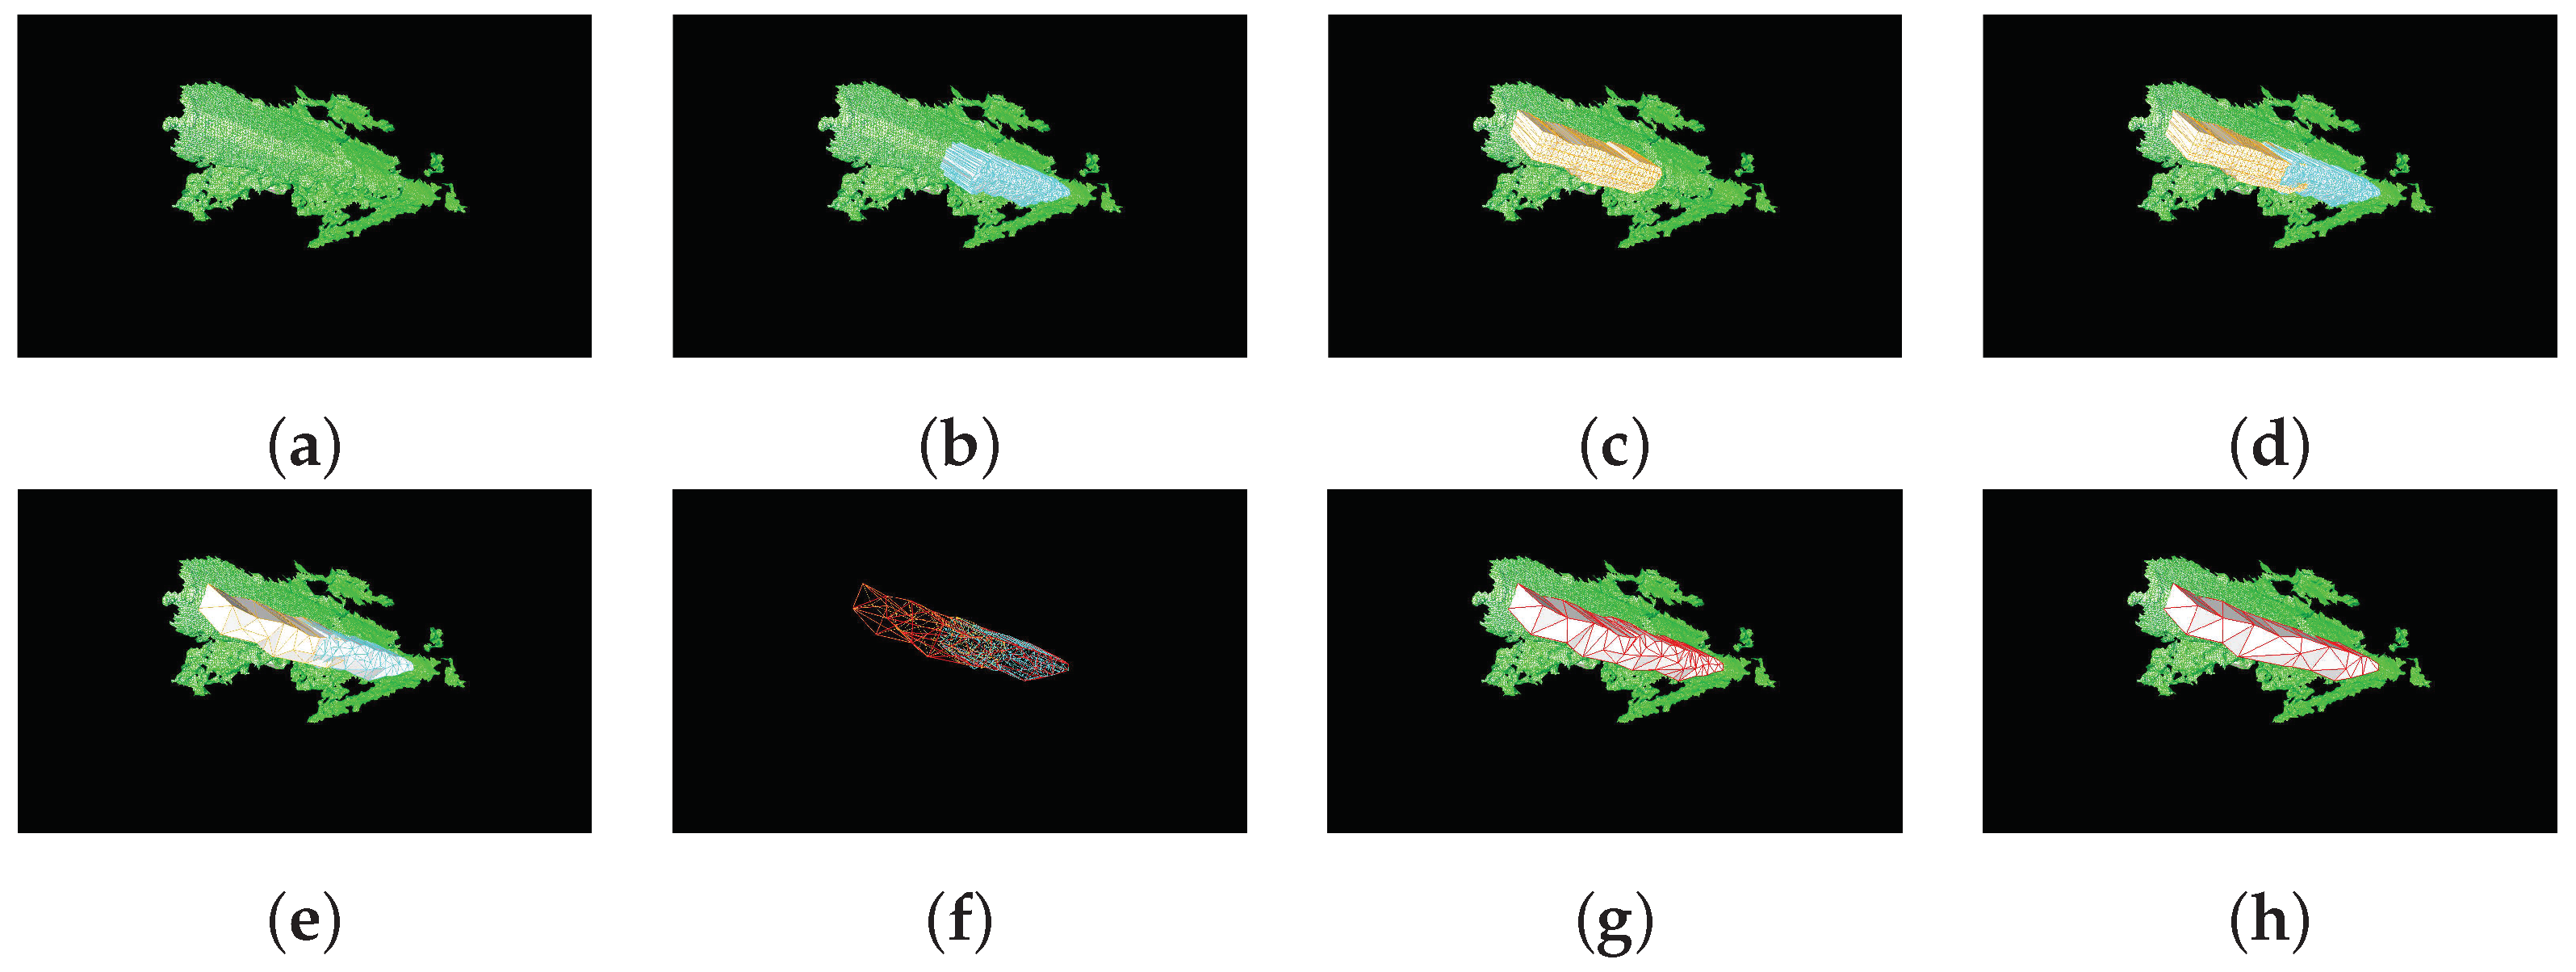
4.1. Defect Geometry Generation and Alignment

For semantic segmentation of inspection images, a retrained TernausNet16 [56] was used. This CNN is based on the UNet architecture with the 16 layers of the Visual Geometry Group (VGG) network architecture as encoder. Similar to the original TernausNet16, K-Folding cross-validation was used, albeit for 5 folds with 6 batches and 15 epochs per fold for transfer learning on the concrete structure spalling and crack (CSSC) database [45,46], from which 715 relevant annotated images of 768 × 768 pixels were selected. This allowed the learning process to be performed with the limited number of images available. The mean performance metrics of the retrained TernausNet16 model are detailed in Table 1.
The camera calibration, which consists of the intrinsic parameters and distortion coefficients, is calculated by processing a set of photos with checkerboard patterns through OpenCV [57]. SfM is used to generate the point clouds based on the inspection photos containing defects. The OpenSfM library in Python [58] has the advantage of generating noticeably better quality of point clouds in comparison with other alternatives. Additionally, its commands for 3D reconstruction can be run seamlessly in a background process. Backwards projection of an image additionally requires the estimated pose of the camera, the undistorted image synthetically generated based on the camera calibration parameters previously estimated, and the depth map of said image, that could be retrieved from the generated outputs of the 3D reconstruction.
Aligning the defect and generating the defect geometry require the point cloud of the undamaged building or object. This is achieved by modeling the structure or object in Revit [14], export this model into IFC, import the IFC into Blender [59] for triangulation, and final generation of the dense point cloud. Next, the point cloud from the SfM algorithm and the point cloud generated based on the BIM model are aligned using ICP [50,51].

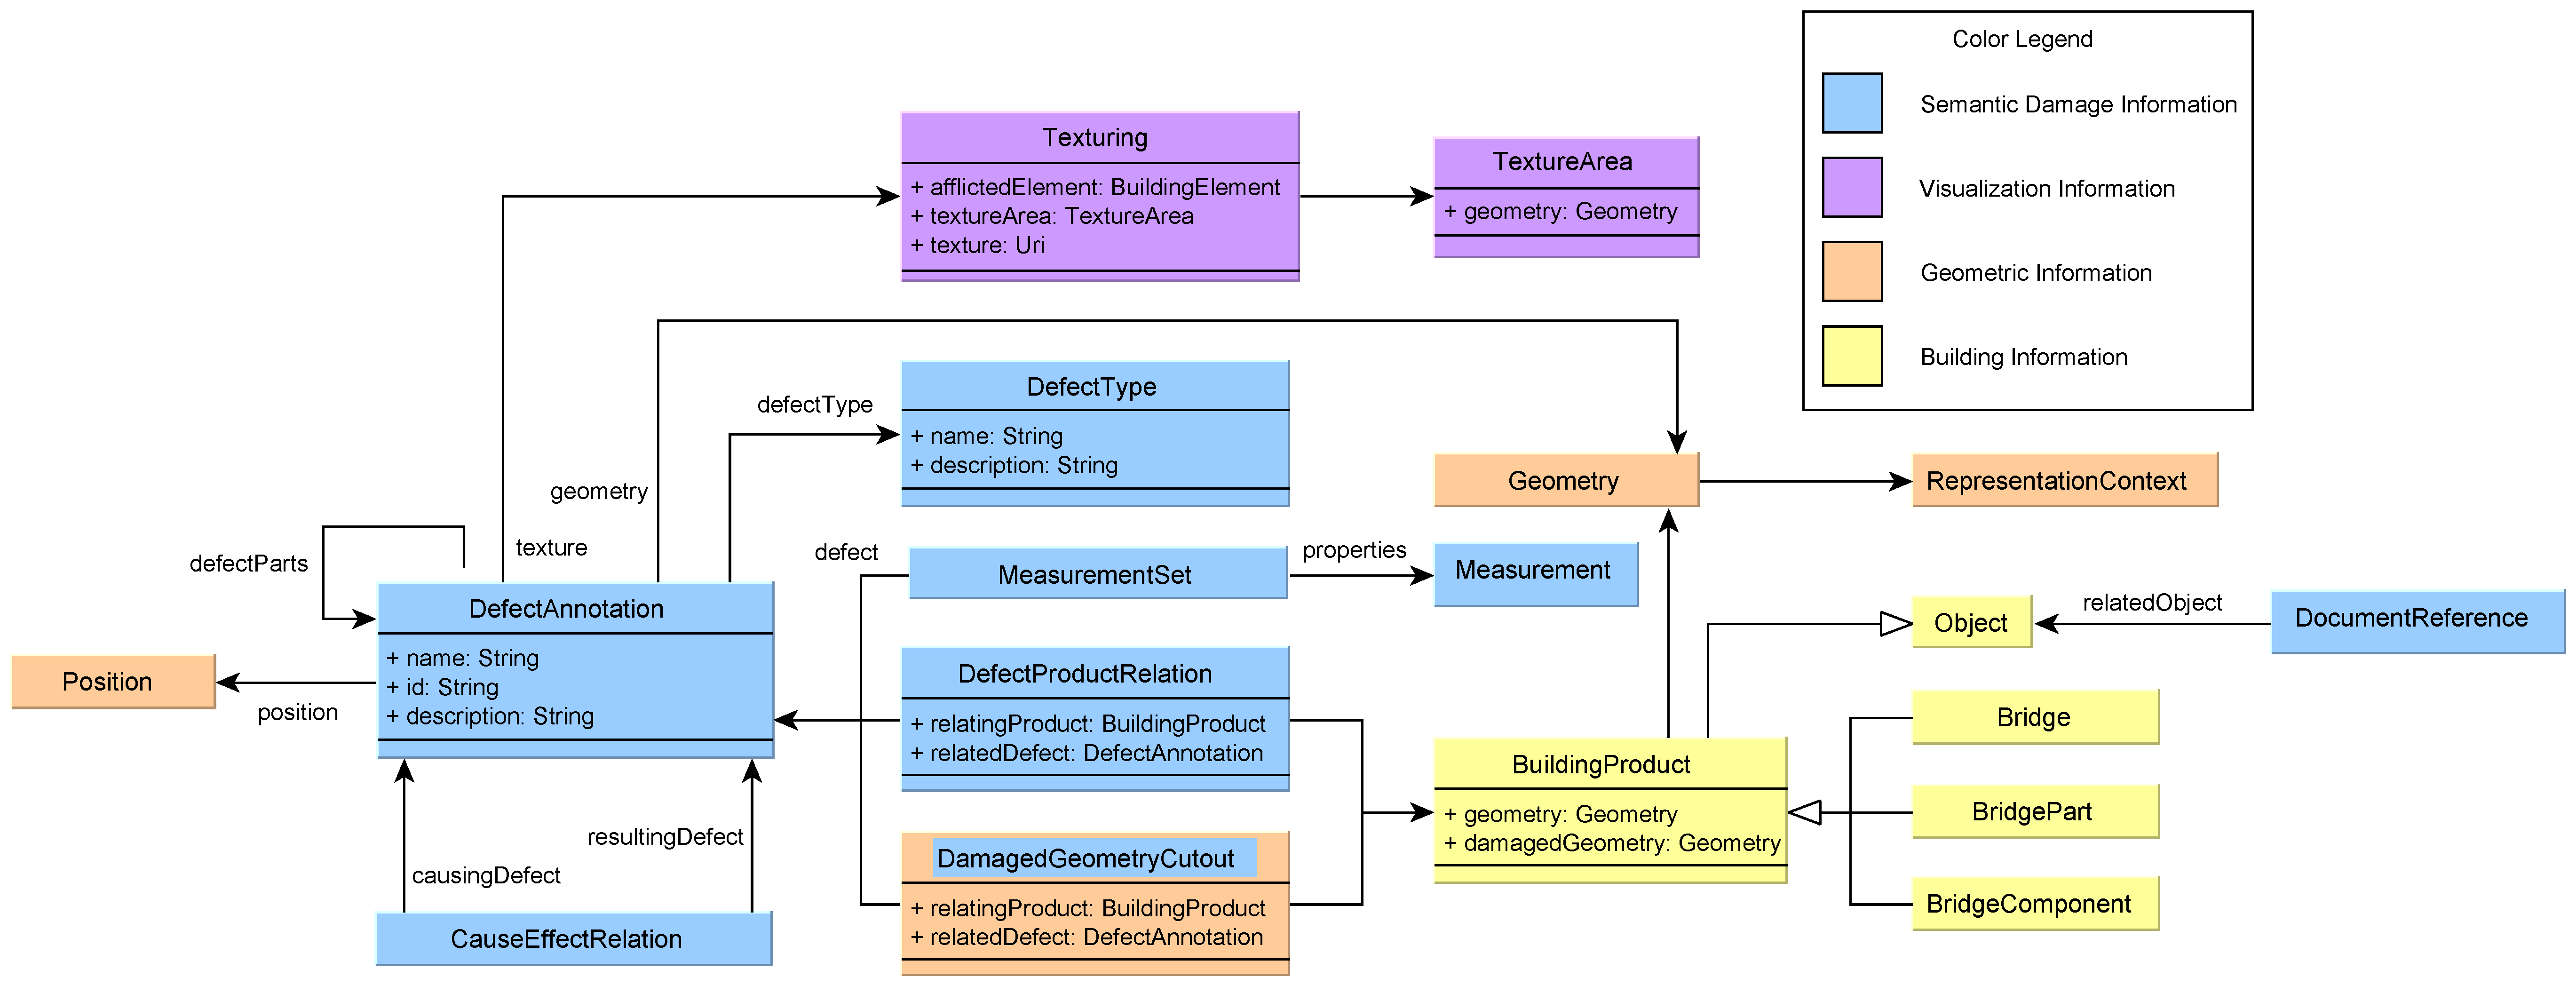
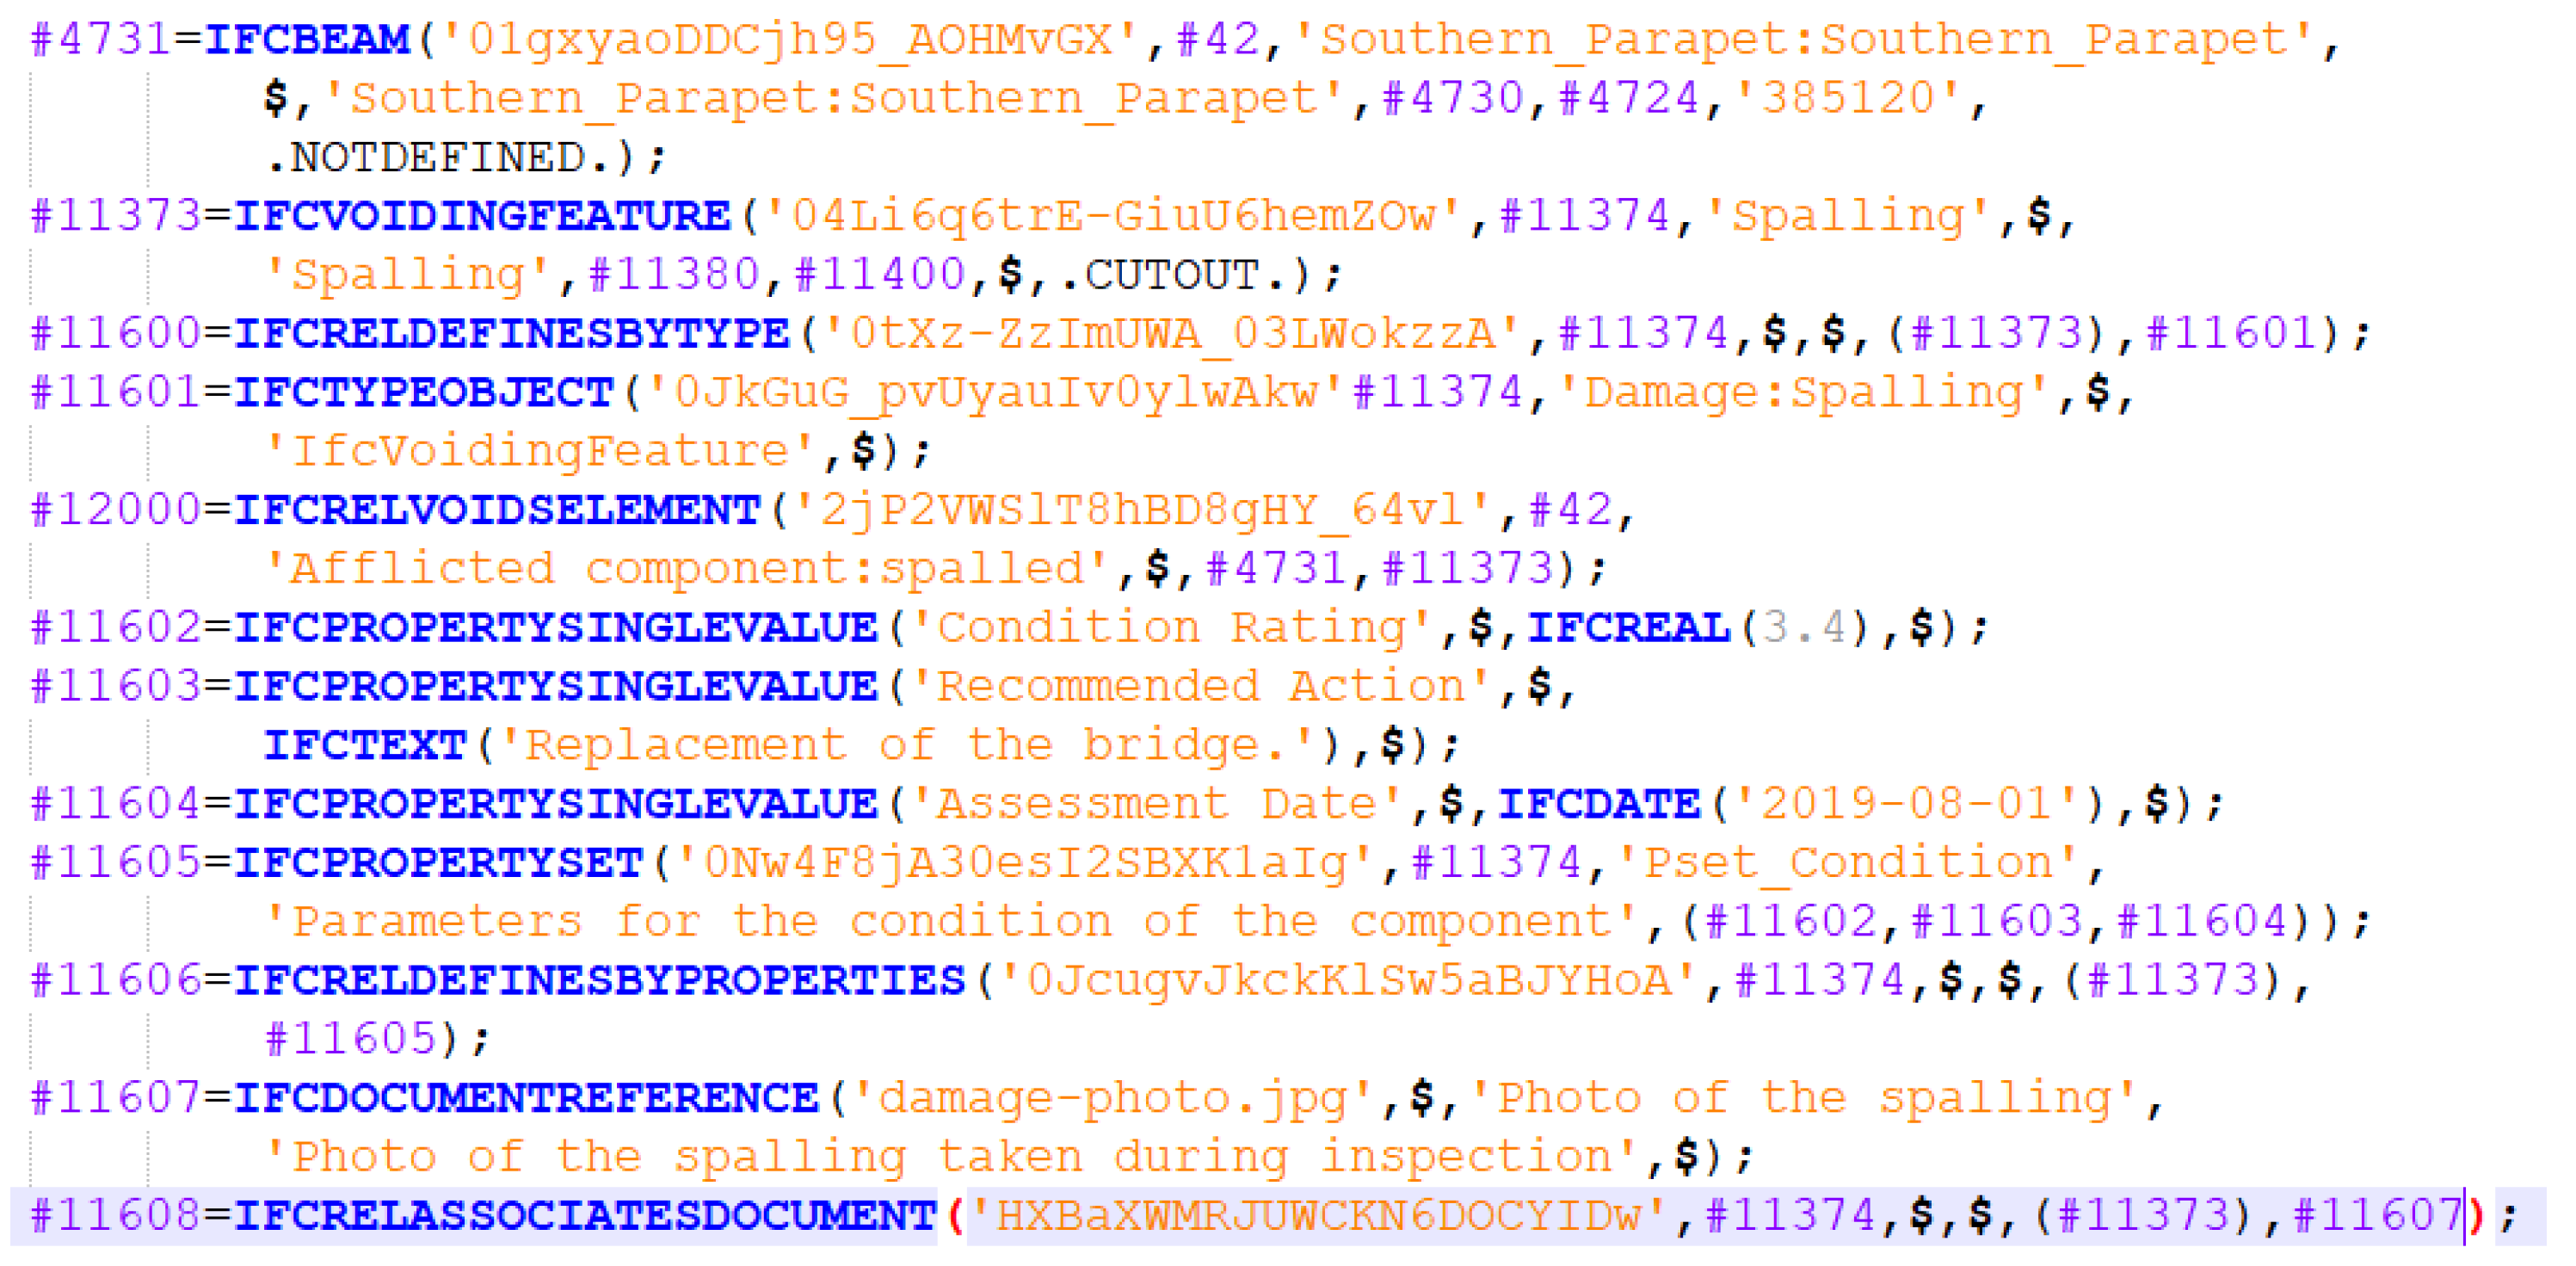
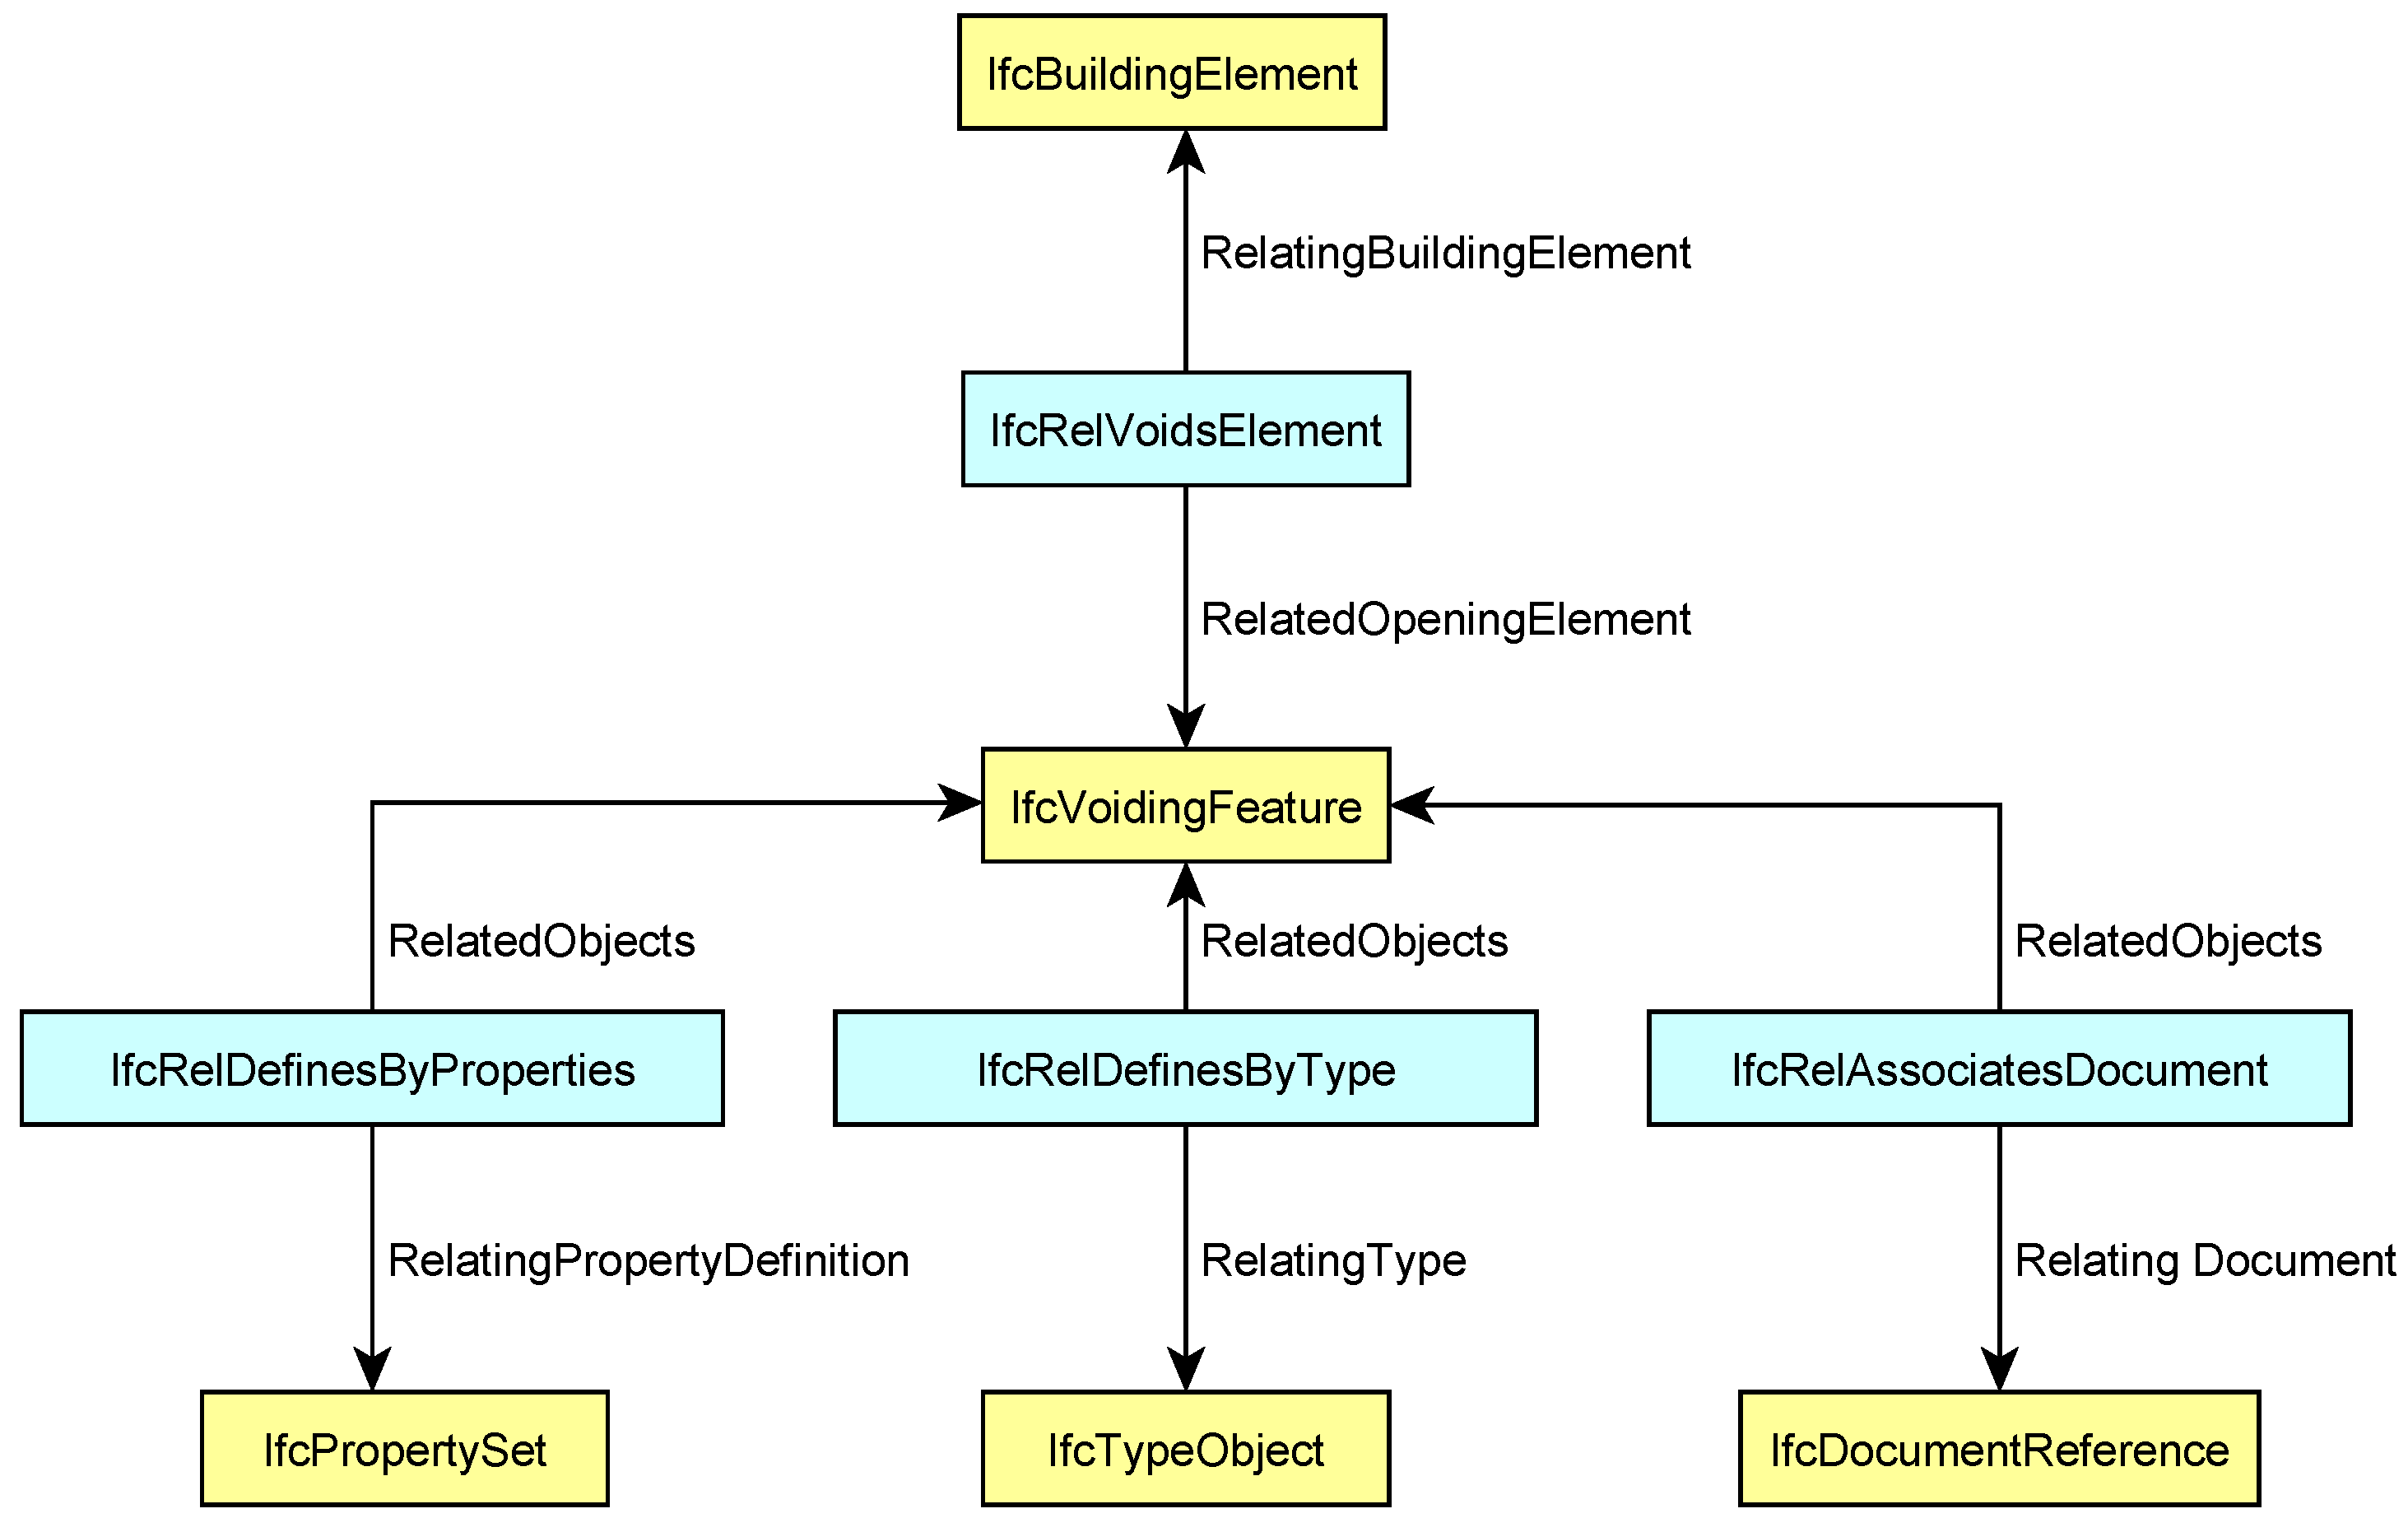
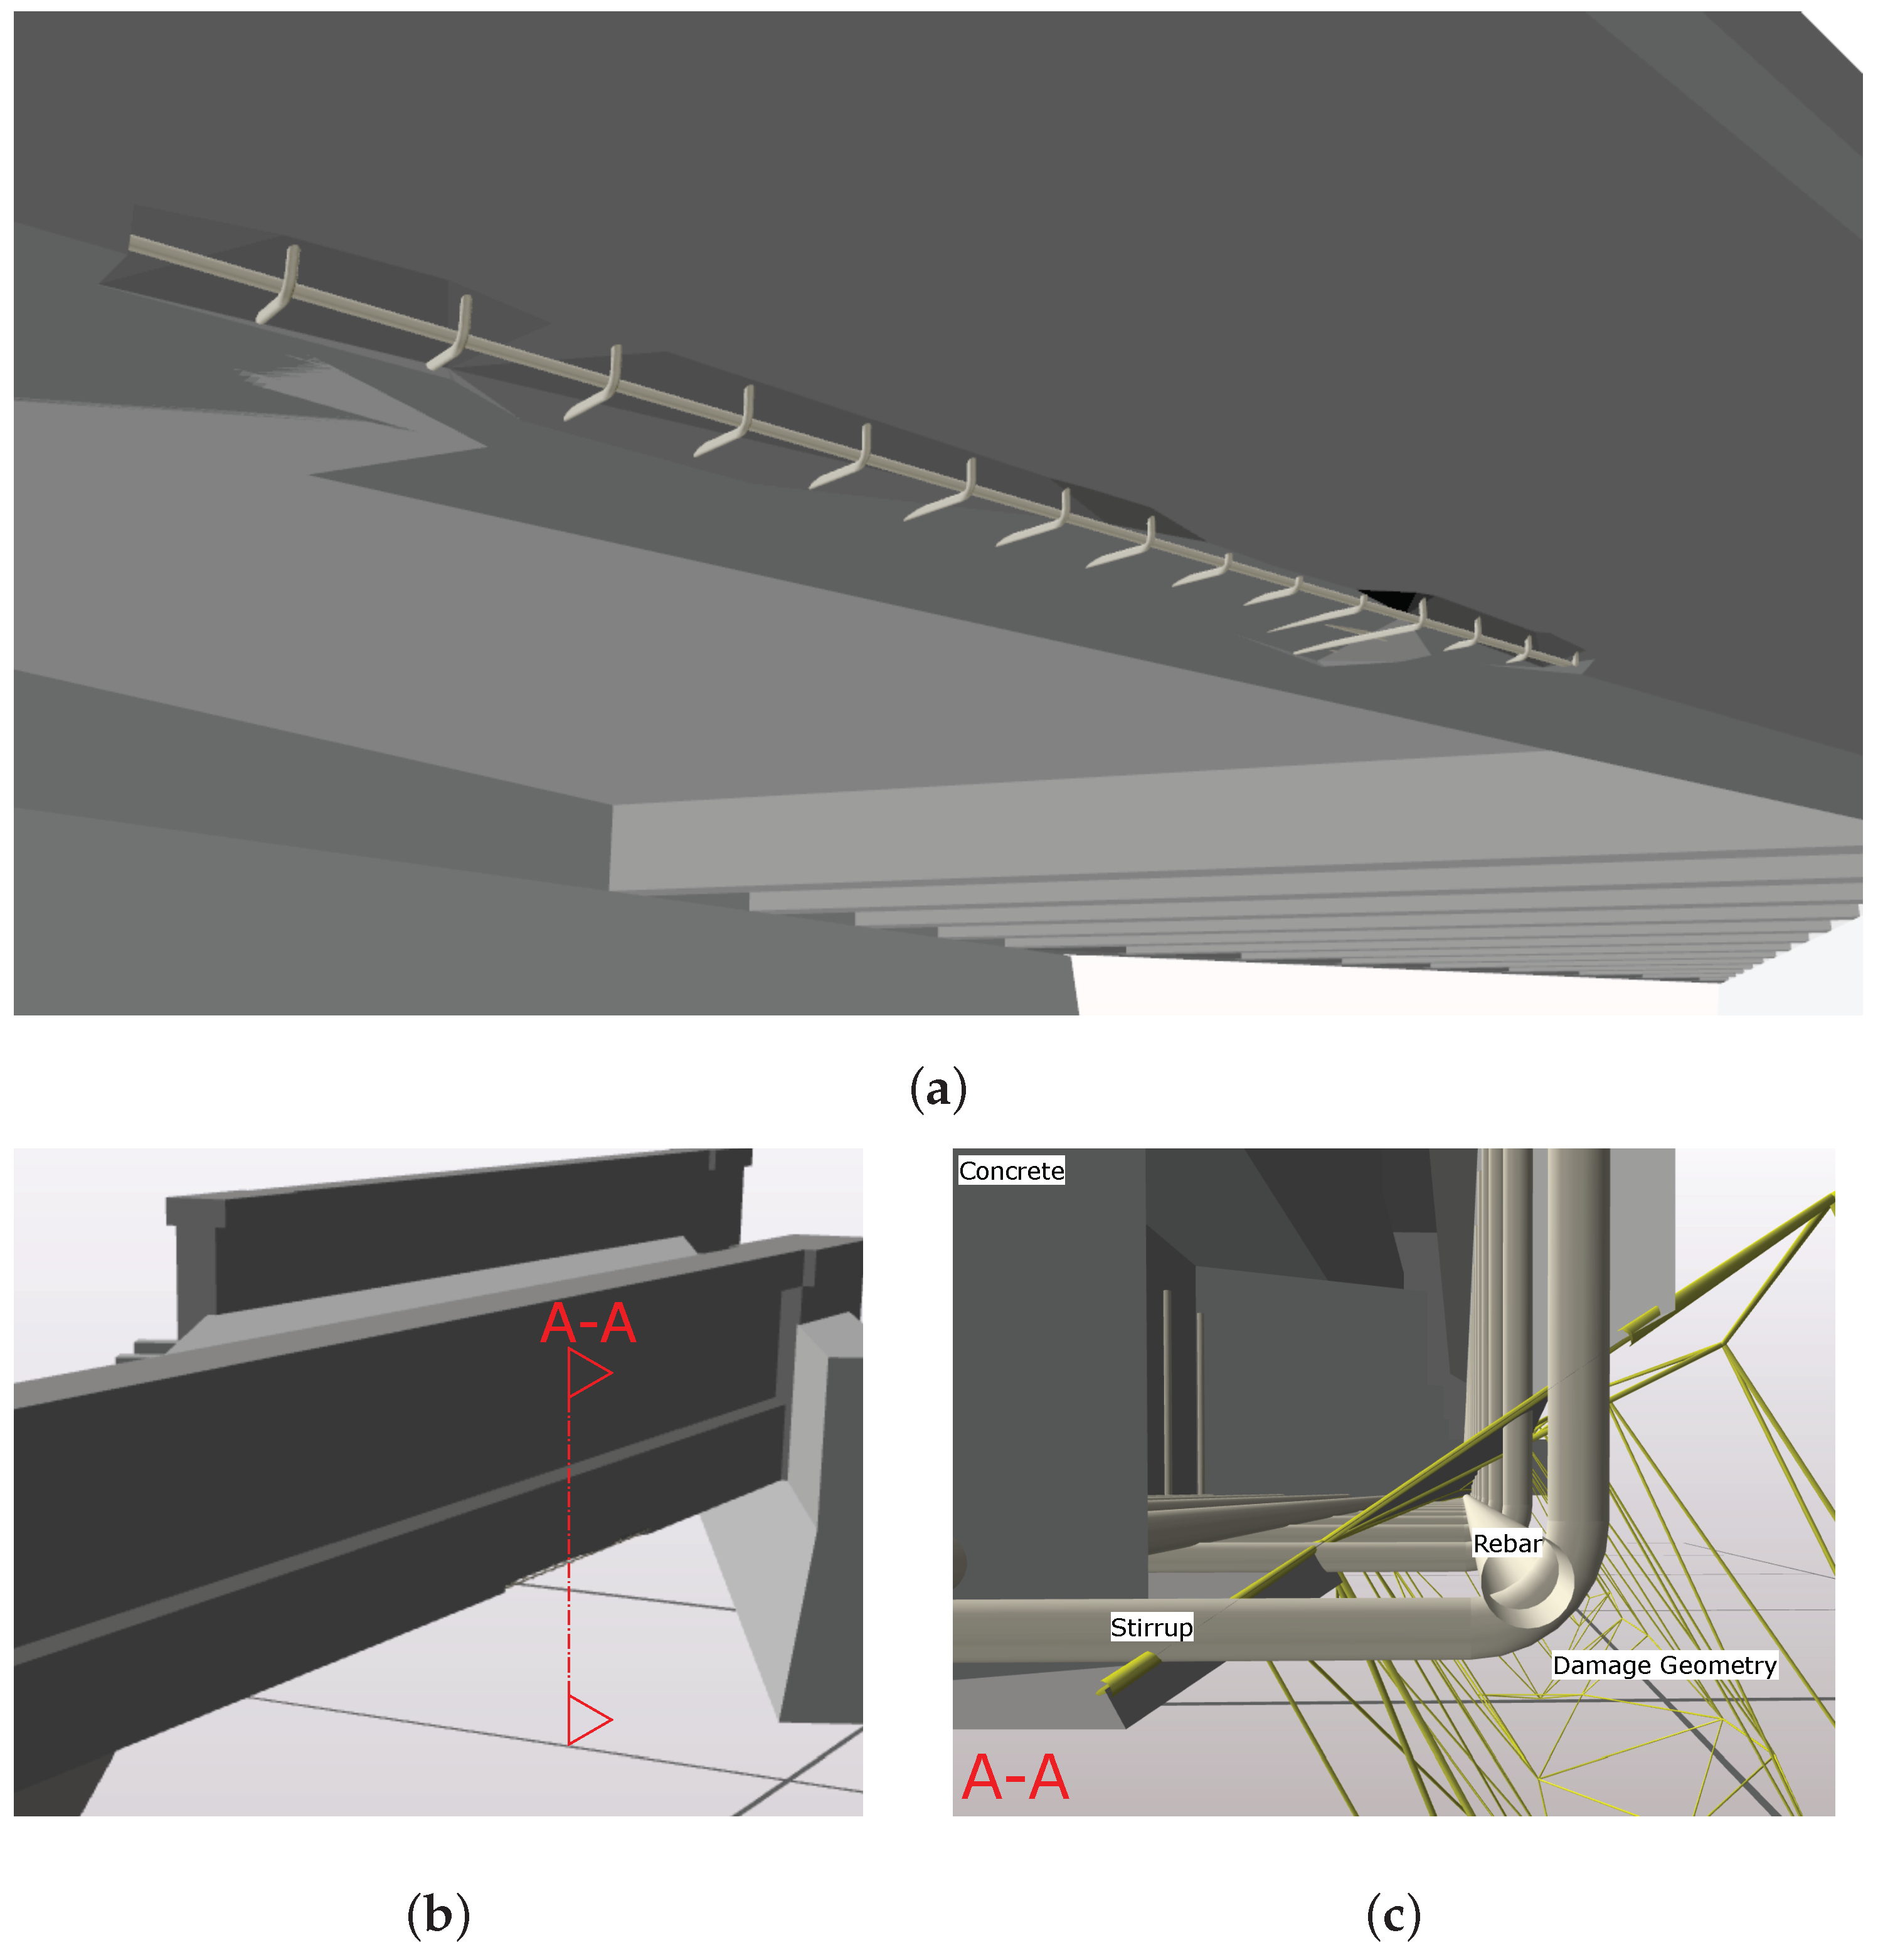
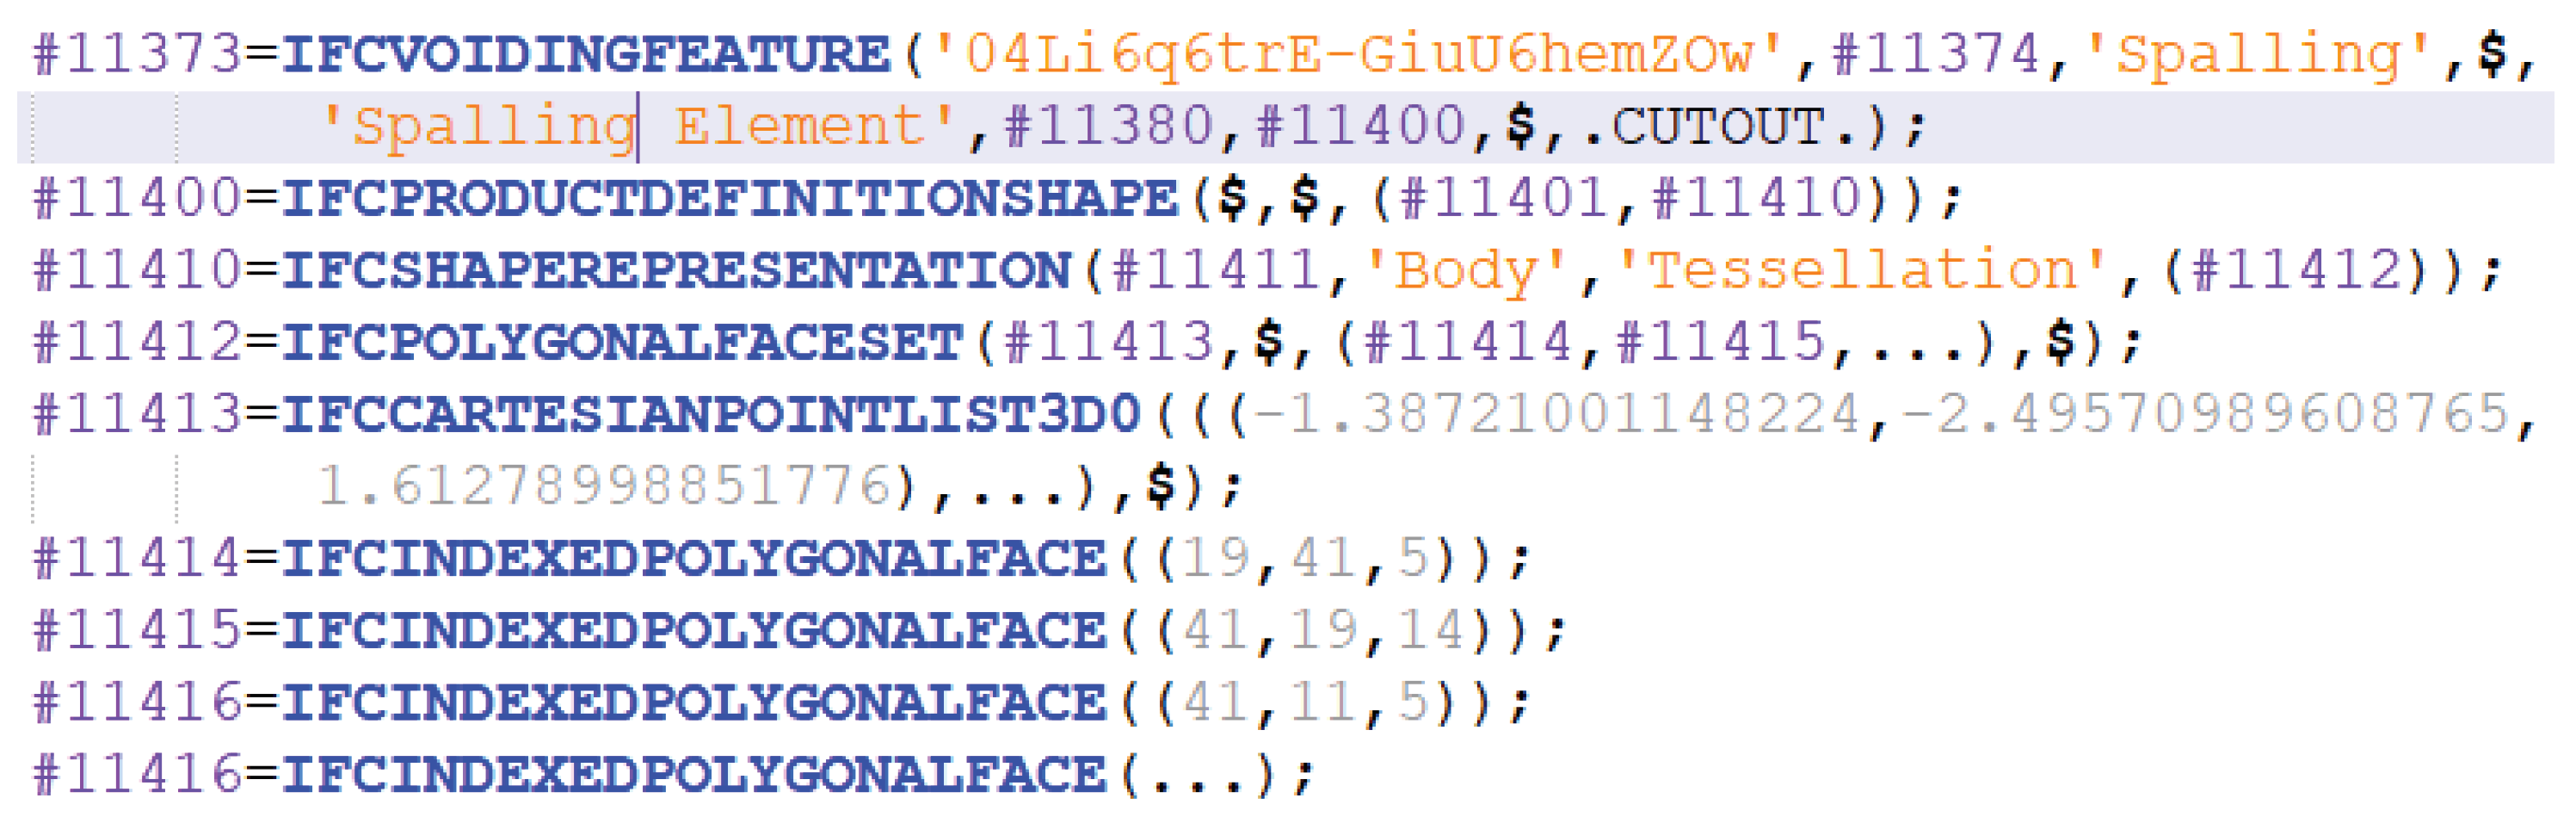
4.2. As-Damaged BIM with IFC
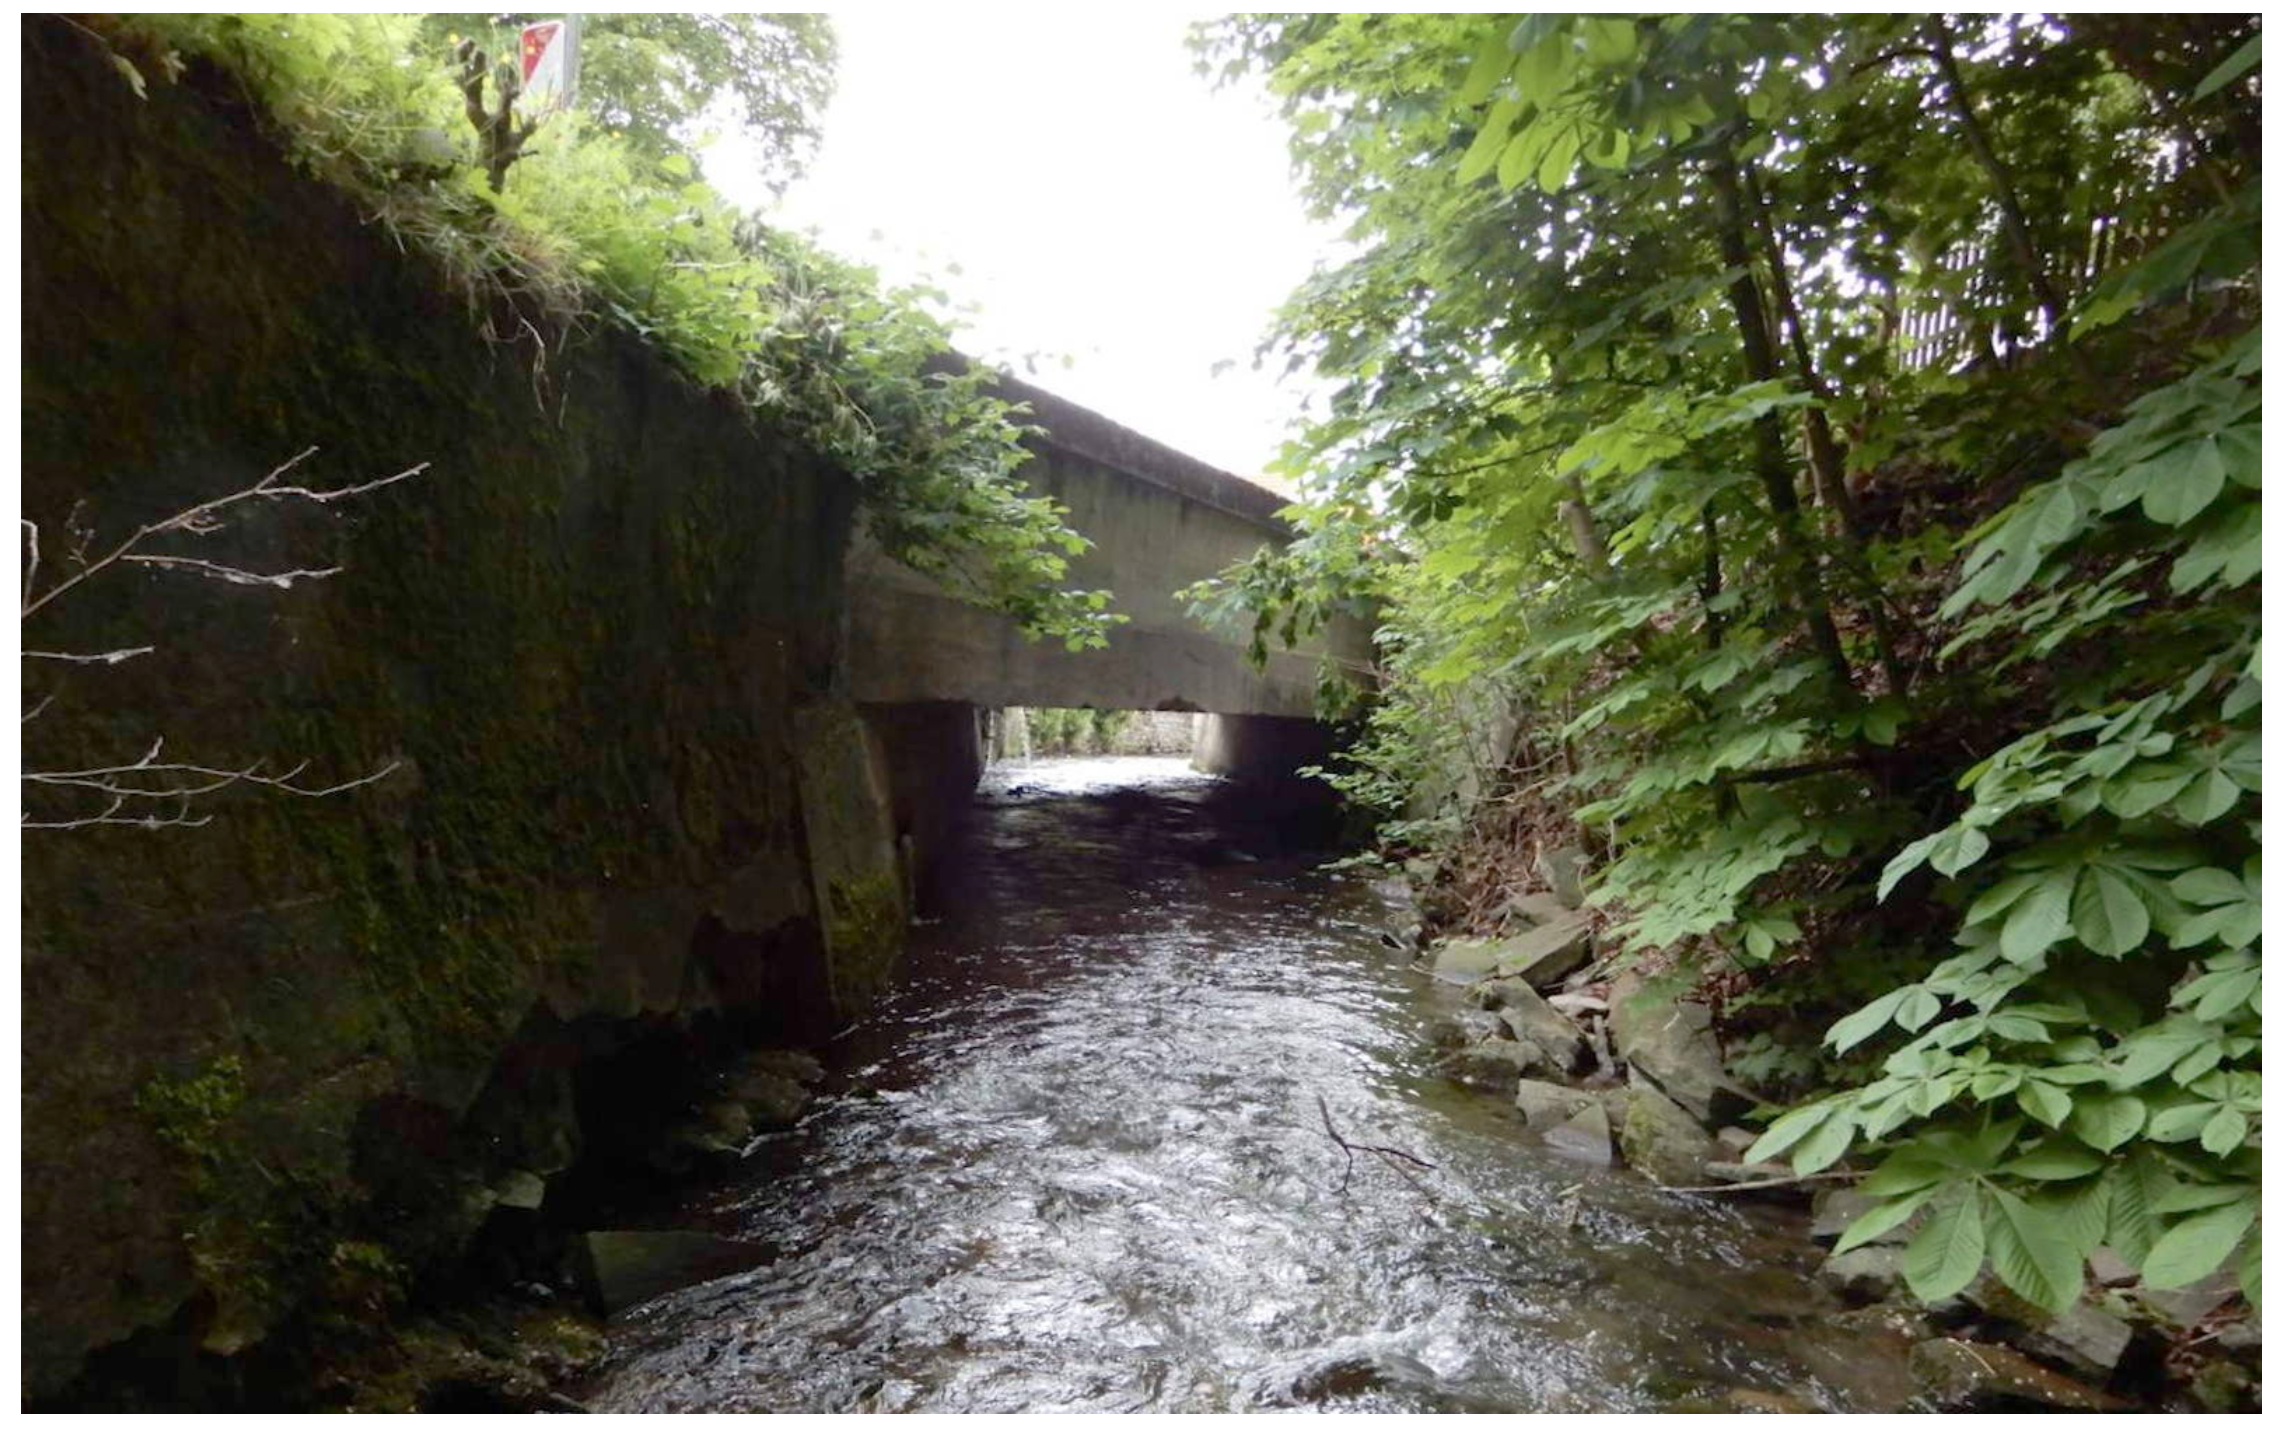
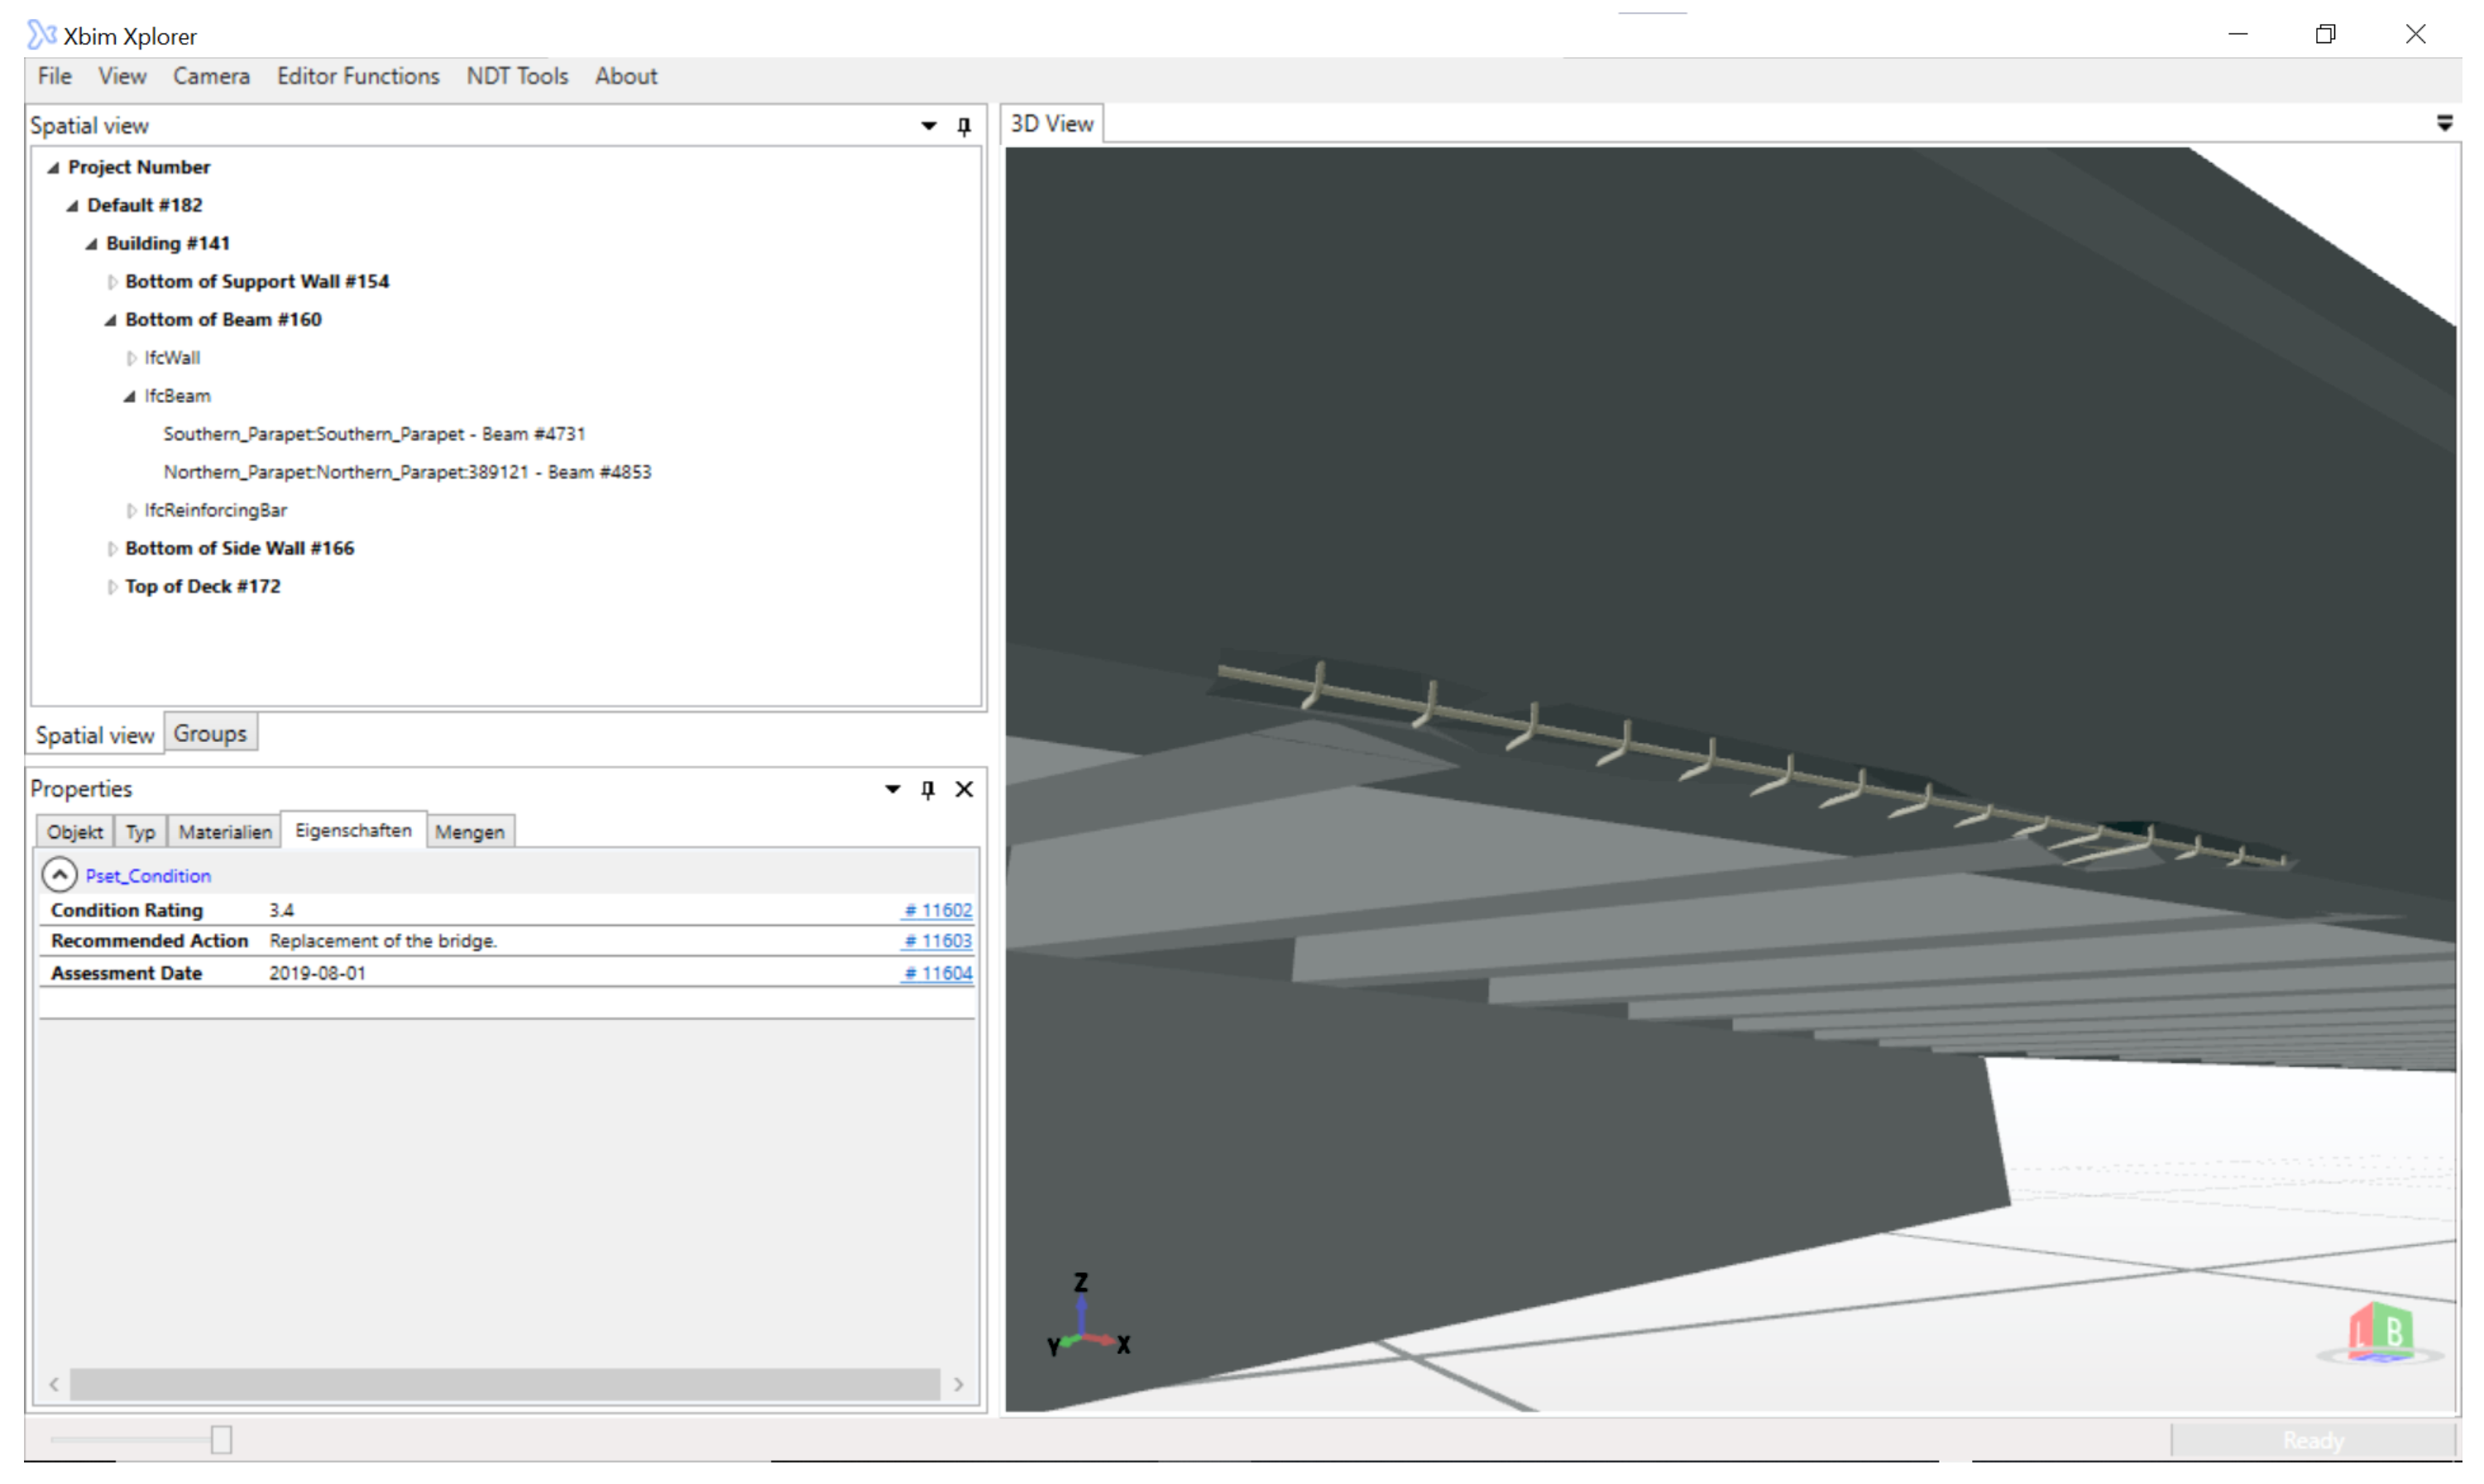
As aforementioned in Section 2.2, this study aims to provide a framework with respect to the big open BIM concept. In compliance with this requirement, the IFC 4 standard is used for the implementation of this data model [60]. Four different entities may be used to represent the defect annotation: IfcProxy, IfcVoidingFeature, IfcSurfaceFeature, or IfcAnnotation. Proxies are generic elements that can represent every entity not included in the IFC so far, and hence, are suitable for any damage type. Voiding features lead to a subtraction of the defect geometry from geometry of the affected component. This circumstance is applicable for physical defects. Surface features represent changes on the surface of a component, such as corrosion. Annotations are designed to add further information to a component. In case of divergences from national bridge requirements or norms, these annotations may be used.
The defect product relation depends on the selection of the defect annotation. In case of using a voiding feature, IfcRelVoidsElement is the way to go. This relationship leads to cutting out the defect geometry from the component geometry. However, providing a geometric representation context would not be possible in this case. Another possibility is to assign a defect to a component with IfcRelAssociatesProduct. A defect is part of a component as long as both exist; hence, an aggregation is suitable as well. For the defect cause, only the assignment is applicable. Figure 8 shows a block diagram as overview of the designed IFC structure. The IfcVoidingFeature represents the defect at the building element. Further data, for example, measurements or ratings, may be included by IfcPropertySets. A type of a defect is realized with the IfcTypeObject or one of its sub-classes. Additional documents, such as additional reports or photos, are included via IfcDocumentReferences.
IFC offers additional classifications via IfcTypeObject. Type objects are linked to the related instances via IfcRelDefinesByType. IfcDocumentReference provides the functionality to include external documents or additional photos. Properties and property sets are used to incorporate measurement data.
Geometries are stored as IfcGeometricRepresentationItems. Several subclasses of this class provide possibilities to model different geometries, for example, surface models, solid models, or Constructive Solid Geometries (CSG). Any geometry has a relation to a representation that again has a relation to an IfcRepresentationContext.
For texturing a 3D model or a part of it, the texture is provided by IfcSurfaceTexture. Based on the used subclass, a blob, image, or pixel texture is provided. By using a styled item and a surface style, the texture is connected to the geometric representation item. Besides the image for the texture, the texture mapping is required. The texture mapping defines which vertex of the geometry corresponds to which coordinate in the texture. This may be done via an algorithm or explicitly. IFC provides the class IfcTextureCoordinate to provide this mapping information.

5. Case Study

The case study aims to validate the proposed frame work. For this purpose, the “Thüringer Landesamt für Bau und Verkehr” [Thuringian Department for Construction and Transport] provided data of a bridge with severe defects, such as extensive spallings at the beams and corroded reinforcement. A side view of the entire bridge is shown in Figure 9. Details about the location or overall photos cannot be provided because of data privacy issues. First, photos are acquired and utilized to generate the BIM model with spalling and geometric damage information. Furthermore, additional defects from existing reports are added. The resulting model may be used for subsequent planning of non destructive testing, FEA, and the assessment. Figure 10 shows an overview of all steps for the use case. As explained in Section 3, the damage images are segmented, then the damage geometry is generated, and finally, the damage is added to the BIM model. Subsequently, the steps and results are described in detail.

5.1. Generation of BIM with Physical Defects

The photos for automatic processing have been taken manually with a Sony Alpha 7 III camera and a 28–70 mm lens. Figure 10a shows some example photos that have been used for the damage segmentation. The spalling investigated is on a primary beam of the bridge. It shows several exposed and corroded reinforcement. 26 images with a resolution of 4000 × 6000 Pixels of this spalling have been taken. These images were used segmenting the defect as shown in Figure 10b. In parallel, the images are used to generate the point cloud of the damaged beam. Figure 11 shows a demonstrative series of images to illustrate the resulting segmentation via inference, where Figure 11a show a spalling in concrete, the inferred damage probability map after damage segmentation is depicted in Figure 11b, whereas Figure 11c show the thresholded binary images of the prediction maps, and Finally, Figure 11d the show the defect with the binary damage map superimposed on the original inspection images.
Figure 10d illustrates the generation of the point cloud with the defect based on the segmented defect and the point cloud of the component. Highlighted orange and cyan points in the damaged point cloud are labeled as damaged in Figure 12d,h respectively.
The described process of geometry generation requires the alignment of the point cloud that has been generated from the BIM model and from the SfM. This alignment is achieved by using the GoICP algorithm [50,51]. Figure 13b shows the resultant extrusion of the points marked as spalling. The multitude of points in the point cloud is not required for subsequent finite element analysis or visualization, and hence, the geometry is simplified to limit the memory required. Therefore, Figure 13c shows a geometry with reduced details, which may be observed by decreased roughness of the surface on the front. Subsequently, the point cloud with the defect information is used for generating the vertices of the defect geometry. Damaged points are used to triangulate a mesh, which is used as a profile for extruding the final geometry. Figure 13 shows the point cloud with the defect as input and the resultant defect geometry.
A BIM model of the bridge has been created by using existing plans, measurements on site, and Google Maps. Based on the BIM model, a synthetic point cloud of the as-built bridge model is generated by OpenSfM. The mesh of the segmented defect is generated by triangulating the vertices of the back-projected pixels in the segmented image into 3D world coordinates using its estimated depth map, the available intrinsic parameters of the camera, and its estimated pose calculated during the 3D reconstruction process via OpenSfM. The 3D reconstructed point cloud by SfM is downsampled and registered to the synthetic point cloud of the BIM model with ICP algorithm from Open3D [61] for the initial alignment and Globally optimal ICP (GoICP) [51] for a refined global registration. Figure 10c,e,g show the point cloud, alignment, and BIM model of the bridge, respectively.
Next, the damage geometry from Figure 10f, the bridge BIM model from Figure 10g, and the alignment from Figure 10e are combined to build the as-damaged BIM model of the bridge as shown in Figure 10h. The damage geometry is used as geometry for an IfcVoidingFeature that is subtracted from the affected component. Figure 14a depicts the cut plane of the cut view in Figure 14b. The spalling is subtracted from the primary beam and exposes the reinforcement as depicted by Figure 14c. Figure 15 shows an excerpt of the resultant IFC file with the spalling as voiding feature (#11373) an the calculated geometry of that voiding.

5.2. Semantic Data

Besides the geometry, semantic data have been included in the model. As an example, Figure 16 shows an excerpt of the IFC file with the relation between the spalling (#11373) and the afflicted beam (#4731). Exemplary for properties, the condition rating (#11602), recommended action(#11603), and assessment date (#11604) have been added to the spalling. Additional documents, for instance photos, may be included via document references as shown by entity #11607.
Figure 17 shows the visualization of the resulting model in the BIM software xBIM Xplorer [62]. On the top left, the hierarchical view of the project is shown. Below the hierarchical view, the properties view is shown with the condition rating, recommended action, and the assessment date. Last, the 3D view on the right shows the bridge with the spalled beam.
Analyzing the latest inspection report of the bridge, further 22 additional defects are identified. First, physical defects, such as cracks and spallings, may be integrated in the as-damaged model in the same way. Second, moisture penetration at the superstructure has to be included in the model. Moisture penetration cannot be represented by a subtraction. Instead, a simple proxy with a geometry for the extent and localization or photos may be used. Third, the report contains notes about rock pockets, plant covering, divergences from specifications, and missing elements. These defects may be included in the model using textual descriptions and photos as shown by Artus and Koch [43].
The report contains several pieces of numerical information, such as crack widths, the size of areas, and volume. Several defects in the report could be related to each other with a cause–effect relationship, for example, moisture penetration led to corrosion, which in turn led to spalling. Two defects are marked for noncompliance with existing norms. These defects have also a reference to the related norm or guideline. Last, some information, such as “water passes through the expansion joint at the support”, may be stored as text.

5.3. Lessons Learned

On the one hand, dense point clouds, which have been used for the geometry generation, include detailed information. On the other Hand, dense point clouds require huge amount of memory and increase the processing time. The density of the point cloud has to be defined based on the requirements of subsequent processing steps to have a suitable trade-off between memory requirement, processing time, and details.
To provide comprehensive damage models, the BIM model, which is the basis of the DIM, has to be complete. This requires incorporating small or invisible objects, such as the reinforcement, drainage and bearings. The model used for the case study, misses such objects, like drainage.
Modeling and visualizing missing components in the as-damaged model needs further investigation. A missing component could be modeled by just removing the component from the model; however, this would conclude that an expected model is necessary for comparison. Another approach could be a flag at the component indicating that the component is missing. Using property sets in the IFC file may be a possible implementation for that. However, such a flag has to be visualized properly, for example, with a color.
The inspection report contains two defects that are related to joints, for example, the joint tape is cracked. Modeling joints has gotten less attention until now. Not only joints are parts of bridges and other buildings, but also they are non-material objects and occur in huge amounts, which led to the practice to omit modeling joints. Future research has to clarify how damaged joints may be included in DIMs.
Some defects affect the location of the structure in relation to the environment or affect the surrounding itself, for instance settling, tilting, or subsidence of the slope. A proper visualization of these defects require a model of the surrounding ground. Different from that is the distortion of the superstructure of a bridge. This changes the geometry of numerous elements. This type of defect could also not be handled.

6. Summary

To ensure safety, traffic safety, and durability of bridges, inspections, analyses, and simulations are required. Hitherto, inspections and subsequent processes relied on paper based inspection and data exchange. The proposed framework outlines a complete digitized data acquisition and exchange of building and damage information. Based on an existing BIM model in the form of an IFC file and photos from the damaged structure, a geometric-semantic as-damaged BIM model with damage data is generated. The model is implemented using an open standard, and hence, subsequent processes and related software may use this data. Nondestructive Testing (NDT) planning tasks require condition information of the building and components, such as the condition of the component surface. The included geometric damage data provides detailed information about the surface of damaged components. Structural analyses also require as-damaged geometries of components. Software applications such as Ansys [63] can import geometry data and use it for automated meshing or provide it to the user as blue print. Analogous to that, damage geometry may be used for crack propagation. Probabilistic deterioration simulations rely on semantic data, such as condition ratings, which could also be included in the provided IFC model. Last, numerous processes rely on manual work of engineers that require appropriate visualization. This study has shown possible visualization of the resultant defect with hierarchy, properties and geometry. For better support, components or defects could be highlighted according to their properties, shape, or relations.
The main contributions of this study are:
  • Development and implementation of an image based processes for:
    -
    Defect geometry generation
    -
    Defect alignment to BIM models
  • Development of an inspection framework based on open file formats
  • Providing a case study to test practical usability of the data acquisitions and storage

7. Discussion and Outlook

With novel technologies, numerous photos may be taken for bridge inspections. This study developed an open framework to acquire bridge data and facilitate inspection data for planning, analysis, and assessment. In the first step, the defect geometry is generated. A prior study with a small example used a point cloud of a single component to calculate and align defect geometry [64]. The presented case study contained more photos of a bigger structure. This led to a dense point cloud with too many vertices for further processing, thus, splitting up this point cloud was necessary. Generally speaking, the density of the point cloud is an important factor in processing and storing damage data.
The proposed open framework is able to handle the geometric, semantic, and graphical data of defects. Furthermore, the DIM can accommodate various damage types effectively, like spalling, corrosion, divergences from specifications, and moisture penetration. Problematic defects are plant covering, missing components, and rock pockets. Due to missing concepts for modeling joints, the framework is not able to visualize damaged joints properly. Especially, joint defects are important in case of inspections [13]. Modeling joints and joint defects should be addressed in future research.
With the information of planned reinforcement and existing defects, such as spalling, cracks, and moisture penetration, most of the planning of ultrasonic or impact-echo surveys can be done in office. However, survey results are included as reports only until now. The aim for future work is to incorporate the results of non-destructive testing in machine-readable formats.
Mathematical simulations, such as probabilistic deterioration simulations [54], are written using MATLAB. The model provided in this paper is based on the IFC standard. Based on that, integrating a library to read IFC files would allow us to automatically use bridge condition ratings for probabilistic simulations. One remaining problem is that less inspection data is available in form of IFC files.
Up until now, structural analyses are set up manually based on plans and inspection. However, incorporating damage data into IFC models allows automatic workflows for structural analysis. The damaged component geometry may be meshed automatically for subsequent calculations or is transferred into slabs, shells, and bars [52]. Similarly, an automation of analytical damage propagation would be possible.
Finally, the visualization for assessment provides the engineer with available semantic, geometric, and graphical data. The engineer may observe component groups or the entire structure to gain an overview of problematic defects or components. However, decisions about the condition rating of the bridge lie within the responsibility of the engineer. This final decision requires deep knowledge of the existing norms, guidelines, and experience in impacts of defects. The framework aims to digitize the workflow of data acquisition and exchange, but leaves decisions to the engineer.

Author Contributions

Conceptualization: M.A.; methodology: M.A., M.S.H.A.; software: M.A., M.S.H.A.; validation, M.A., M.S.H.A.; writing—original draft preparation, M.A.; writing—review and editing: M.A., M.S.H.A., C.K.; visualization: M.A. and M.S.H.A.; supervision: C.K.; project administration: M.A.; funding acquisition: M.A. All authors have read and agreed to the published version of the manuscript.

Funding

The APC was funded by German Research Foundation (DFG, Bonn) and Bauhaus-Universität Weimar within the program of Open Access Publishing.

Institutional Review Board Statement

Not applicable.

Informed Consent Statement

Not applicable.

Data Availability Statement

The photos used for calibration, damage segmentation, and use cases are available on request from the corresponding author. The data is not publicly available due to confidentiality agreement between the authors and the ”Thüringer Landesamt für Bau und Verkehr”. The inspection reports are property of the ”Thüringer Landesamt für Bau und Verkehr.” Restrictions apply to the availability of these data. Data was obtained from ”Thüringer Landesamt für Bau und Verkehr” and is available from the authors with the permission of Thüringer Landesamt für Bau und Verkehr.

Acknowledgments

We thank the “Thüringer Landesamt für Bau und Verkehr” [Thuringian Department for Construction and Transport] to provide us with data and helped us with their practical expertise.

Conflicts of Interest

The authors declare no conflict of interest. The funders had no role in the design of the study; in the collection, analyses, or interpretation of data; in the writing of the manuscript, or in the decision to publish the results.

Abbreviations

The following abbreviations are used in this manuscript:
AECArchitecture, Engineering and Construction
BIMBuilding Information Modeling
CNNConvolutional Neural Network
CSGConstructive Solid Geometry
DIMDamage Information Modeling
FEAFinite Element Analysis
GoICPGolbally optimal Iterative Closest Point
GPRGround Penetrating Radar
HBIMHistoric Building Information Model
ICPIterative Closest Point
IDMInformation Delivery Manual
IFCIndustry Foundation Classes
NDTNondestructive Testing
SfMStructure from Motion
SHMStructural Health Monitoring
UMLUnified Modeling Language
URIUnified Resource Identifier
VGGVisual Geometry Group

References

  1. Schach, R.; Otto, J.; Häupel, H.; Fritzsche, M. Lebenszykluskosten von Brücken. Bauingenieur 2006, 81, 7–14. Available online: https://tu-dresden.de/bu/bauingenieurwesen/ibb/ressourcen/dateien/publikationen/periodika/2006/bauing08_2006.pdf?lang=de (accessed on 20 December 2021).
  2. Nagel, L.M.; Pauly, M.; Mucha, V.; Setzer, J.; Wilhelm, F. Wettlauf Gegen den Verfall. 2016. Available online: http://www.welt.de/politik/interaktiv/bruecken/deutschlands-bruecken-wettlauf-gegen-den-verfall.html (accessed on 27 September 2018).
  3. Sacks, R.; Eastman, C.M.; Lee, G.; Teicholz, P.M. BIM Handbook: A Guide to Building Information Modeling for Owners, Designers, Engineers, Contractors, and Facility Managers, 3rd ed.; Wiley: Hoboken, NJ, USA, 2018. [Google Scholar]
  4. Borrmann, A.; König, M.; Koch, C.; Beetz, J. (Eds.) Building Information Modeling: Technology Foundations and Industry Practice, 2nd ed.; Springer: Cham, Switzerland, 2018. [Google Scholar] [CrossRef]
  5. Sacks, R.; Kedar, A.; Borrmann, A.; Ma, L.; Brilakis, I.; Hüthwohl, P.; Daum, S.; Kattel, U.; Yosef, R.; Liebich, T.; et al. SeeBridge as next generation bridge inspection: Overview, Information Delivery Manual and Model View Definition. Autom. Constr. 2018, 90, 134–145. [Google Scholar] [CrossRef] [Green Version]
  6. Adrien Coquet. Damage. 2020. Available online: https://thenounproject.com/term/damage/4211556/ (accessed on 20 December 2021).
  7. Nawicon. Demolition. 2020. Available online: https://thenounproject.com/term/demolition/3364573/ (accessed on 20 December 2021).
  8. Eucalyp. Maintenance. 2019. Available online: https://thenounproject.com/term/maintenance/3050592/ (accessed on 20 December 2021).
  9. Oleksandr Panasovskyi. Elastic Material. 2020. Available online: https://thenounproject.com/term/elastic-material/3636285/ (accessed on 20 December 2021).
  10. Oleksandr Panasovskyi. Deformation. 2020. Available online: https://thenounproject.com/term/deformation/2753612/ (accessed on 20 December 2021).
  11. Nithinan Tatah. Sustainable. 2020. Available online: https://thenounproject.com/term/sustainable/3031205/ (accessed on 20 December 2021).
  12. Shocho. Inspection. 2020. Available online: https://thenounproject.com/term/inspection/2851743/ (accessed on 20 December 2021).
  13. Artus, M.; Koch, C. State of the art in damage information modeling for RC bridges—A literature review. Adv. Eng. Inform. 2020, 46, 101171. [Google Scholar] [CrossRef]
  14. Autodesk. Revit. 2019. Available online: https://www.autodesk.de/products/revit/overview (accessed on 14 October 2019).
  15. Graphisoft. Archicad. 1984. Available online: https://graphisoft.com/us (accessed on 20 December 2021).
  16. Ward, A.; Benghi, C.; Černý, M.; Lockley, S. xBIM XbimWindowsUI. 2007. Available online: https://github.com/xBimTeam/XbimWindowsUI (accessed on 15 October 2019).
  17. Java IFC Viewer. 2012. Available online: http://www.apstex.com (accessed on 14 October 2019).
  18. Lebegue, E. IFC-Bridge & IFC for Roads at BuildingSmart Infrastructure Room, Held on 08.10.2013 in Munich. Available online: http://iug.buildingsmart.org/resources/itm-and-iug-meetings-2013-munich/infra-room/ifc-bridge-ifc-for-roads (accessed on 9 August 2018).
  19. Volk, R.; Stengel, J.; Schultmann, F. Building Information Modeling (BIM) for existing buildings—Literature review and future needs. Autom. Constr. 2014, 38, 109–127. [Google Scholar] [CrossRef] [Green Version]
  20. Barazzetti, L.; Banfi, F.; Brumana, R.; Previtali, M.; Roncoroni, F. BIM from Laser Scans… not just for Buildings: Nurbs-Based Parametric Modeling of a Medieval Bridge. ISPRS Ann. Photogramm. Remote Sens. Spat. Inf. Sci. 2016, III-5, 51–56. [Google Scholar] [CrossRef] [Green Version]
  21. Kropp, C.; Koch, C.; König, M. Interior construction state recognition with 4D BIM registered image sequences. Autom. Constr. 2018, 86, 11–32. [Google Scholar] [CrossRef]
  22. Hearn, G. Bridge Inspection Practices; Transportation Research Board. 2007. Available online: https://www.researchgate.net/publication/298792603_Bridge_Inspection_Practices (accessed on 11 May 2020).
  23. Hüthwohl, P.; Brilakis, I.; Borrmann, A.; Sacks, R. Integrating RC Bridge Defect Information into BIM Models. J. Comput. Civ. Eng. 2018, 32, 1–14. [Google Scholar] [CrossRef]
  24. Hamdan, A.H.; Scherer, J.R. Modular Concatenation of Reference Damage Patterns. In EWork and EBusiness in Architecture, Engineering and Construction; Karlshoj, J., Scherer, R., Eds.; Chapman and Hall/CRC: Milton, MA, USA, 2018. [Google Scholar]
  25. Tanaka, F.; Tsuchida, M.; Onosato, M.; Date, H.; Kanai, S.; Hada, Y.; Nakao, M.; Kobayashi, H.; Hasegawa, E.; Sugawara, T.; et al. Bridge Information Modeling based on IFC for supporting maintenance management of existing bridges. In Proceedings of the ICCCBE 2018 Conference Proceedings, Tampere, Finland, 5–7 June 2018; pp. 778–785. [Google Scholar]
  26. German, S.; Brilakis, I.; DesRoches, R. Rapid entropy-based detection and properties measurement of concrete spalling with machine vision for post-earthquake safety assessments. Adv. Eng. Inform. 2012, 26, 846–858. [Google Scholar] [CrossRef]
  27. Paal, S.G.; Brilakis, I.; DesRoches, R. Automated Damage Index Estimation of Reinforced Concrete Columns for Post-Earthquake. J. Struct. Eng. 2015, 141, 04014228. [Google Scholar] [CrossRef] [Green Version]
  28. Dawood, T.; Zhu, Z.; Zayed, T. Machine vision-based model for spalling detection and quantification in subway networks. Autom. Constr. 2017, 81, 149–160. [Google Scholar] [CrossRef]
  29. Wu, H.; Ao, X.; Chen, Z.; Liu, C.; Xu, Z.; Yu, P. Concrete Spalling Detection for Metro Tunnel from Point Cloud Based on Roughness Descriptor. J. Sens. 2019, 2019, 1–12. [Google Scholar] [CrossRef]
  30. Hoang, N.D.; Nguyen, Q.L.; Tran, X.L. Automatic Detection of Concrete Spalling Using Piecewise Linear Stochastic Gradient Descent Logistic Regression and Image Texture Analysis. Complexity 2019, 2019, 5910625. [Google Scholar] [CrossRef] [Green Version]
  31. He, K.; Gkioxari, G.; Dollar, P.; Girshick, R. Mask R-CNN. In Proceedings of the 2017 IEEE International Conference on Computer Vision (ICCV), Venice, Italy, 22–29 October 2017. [Google Scholar] [CrossRef]
  32. Borin, P.; Cavazzini, F. Condition Assessment of RC Bridges. Integrating Machine Learning, Photogrammetry and BIM. Int. Arch. Photogramm. Remote Sens. Spat. Inf. Sci. 2019, 42, 201–208. [Google Scholar] [CrossRef] [Green Version]
  33. Jeong, S.; Byun, J.; Kim, D.; Sohn, H.; Bae, I.H.; Law, K.H. A data management infrastructure for bridge monitoring. In SPIE Smart Structures and Materials + Nondestructive Evaluation and Health Monitoring; Lynch, J.P., Ed.; SPIE: Bellingham, WA, USA, 2015. [Google Scholar] [CrossRef] [Green Version]
  34. Mousavi, M.; Gandomi, A.H. Prediction error of Johansen cointegration residuals for structural health monitoring. Mech. Syst. Signal Process. 2021, 160, 107847. [Google Scholar] [CrossRef]
  35. Bruno, S.; de Fino, M.; Fatiguso, F. Historic Building Information Modelling: Performance assessment for diagnosis-aided information modelling and management. Autom. Constr. 2018, 86, 256–276. [Google Scholar] [CrossRef]
  36. Torok, M.M.; Golparvar-Fard, M.; Kochersberger, K.B. Image-Based Automated 3D Crack Detection for Post-disaster Building Assessment. J. Comput. Civ. Eng. 2014, 28, A4014004. [Google Scholar] [CrossRef]
  37. Chan, B.; Guan, H.; Hou, L.; Jo, J.; Blumenstein, M.; Wang, J. Defining a conceptual framework for the integration of modelling and advanced imaging for improving the reliability and efficiency of bridge assessments. J. Civ. Struct. Health Monit. 2016, 6, 703–714. [Google Scholar] [CrossRef] [Green Version]
  38. McGuire, B.M. Using Building Information Modeling to Track and Assess the Structural Condition of Bridges. Master’s Thesis, Colorado State University, Fort Collins, CO, USA, 2014. [Google Scholar]
  39. McGuire, B.; Atadero, R.; Clevenger, C.; Ozbek, M. Bridge Information Modeling for Inspection and Evaluation. J. Bridge Eng. 2016, 21, 04015076. [Google Scholar] [CrossRef]
  40. Hamdan, A.H.; Taraben, J.; Helmrich, M.; Mansperger, T.; Morgenthal, G.; Scherer, R.J. A semantic modeling approach for the automated detection and interpretation of structural damage. Autom. Constr. 2021, 128, 103739. [Google Scholar] [CrossRef]
  41. Isailović, D.; Stojanovic, V.; Trapp, M.; Richter, R.; Hajdin, R.; Döllner, J. Bridge damage: Detection, IFC-based semantic enrichment and visualization. Autom. Constr. 2020, 112, 103088. [Google Scholar] [CrossRef]
  42. Lindenberg, R.E.; McGormley, J.C. Visualizing Bridge Inspection with 2D + 1 Software. In Computing in Civil Engineering; Brilakis, I., Lee, S., Becerik-Gerber, B., Eds.; American Society of Civil Engineers: Reston, VA, USA, 2013; pp. 857–864. [Google Scholar] [CrossRef]
  43. Artus, M.; Koch, C. Modeling Geometry and Semantics of Physical Damages using IFC. In EG-ICE 2020 Workshop on Intelligent Computing in Engineering; Ungureanu, L.C., Hartmann, T., Eds.; Universitätsverlag der TU Berlin: Berlin, Germany, 2020; pp. 144–153. [Google Scholar]
  44. Artus, M.; Koch, C. Modeling Physical Damages Using the Industry Foundation Classes—A Software Evaluation. In Proceedings of the 18th International Conference on Computing in Civil and Building Engineering, Sao Paulo, Brazil, 18–20 August 2021; Toledo Santos, E., Scheer, S., Eds.; Springer: Cham, Switzerland, 2021; Volume 98, pp. 507–518. [Google Scholar]
  45. Yang, L.; Li, B.; Li, W.; Liu, Z.; Yang, G.; Xiao, J. A robotic system towards concrete structure spalling and crack database. In Proceedings of the 2017 IEEE International Conference on Robotics and Biomimetics (ROBIO), Macao, China, 5–8 December 2017; pp. 1276–1281. [Google Scholar] [CrossRef]
  46. Yang, L.; Li, B.; Li, W.; Jiang, B.; Xiao, J. Semantic Metric 3D Reconstruction for Concrete Inspection. In Proceedings of the 2018 IEEE/CVF Conference on Computer Vision and Pattern Recognition Workshops (CVPRW), Salt Lake City, UT, USA, 18–22 June 2018; pp. 1624–16248. [Google Scholar] [CrossRef]
  47. Shih, F.Y. Image Segmentation. In Encyclopedia of Database Systems; Liu, L., Özsu, M.T., Eds.; Springer: Boston, MA, USA, 2009; pp. 1389–1395. [Google Scholar]
  48. Faugeras, O.; Luong, Q.-T. The Geometry of Multiple Images: The Laws That Govern the Formation of Multiple Images of a Scene and Some of Their Applications; The MIT Press: Cambridge, MA, USA, 2001. [Google Scholar] [CrossRef]
  49. Förstner, W.; Wrobel, B.P. Photogrammetric Computer Vision; Springer: Berlin/Heidelberg, Germany, 2016. [Google Scholar] [CrossRef] [Green Version]
  50. Yang, J.; Li, H.; Jia, Y. Go-ICP: Solving 3D Registration Efficiently and Globally Optimally. In Proceedings of the 2013 IEEE International Conference on Computer Vision, Sydney, Australia, 1–8 December 2013; pp. 1457–1464. [Google Scholar] [CrossRef] [Green Version]
  51. Yang, J.; Li, H.; Campbell, D.; Jia, Y. Go-ICP: A Globally Optimal Solution to 3D ICP Point-Set Registration. IEEE Trans. Pattern Anal. Mach. Intell. 2016, 38, 2241–2254. [Google Scholar] [CrossRef] [Green Version]
  52. Fröhlich, J. On Systematic Approaches for Interpreted Information Transfer of Inspection Data from Bridge Models to Structural Analysis. Master’s Thesis, Bauhaus Universität Weimar, Weimar, Germany, 10 February 2020. [Google Scholar]
  53. Adhikari, R.S.; Moselhi, O.; Bagchi, A. Automated Prediction of Condition State Rating in Bridge Inspection. In Proceedings of the International Symposium on Automation and Robotics in Construction, Eindhoven, The Netherlands, 1 February 2012. [Google Scholar] [CrossRef] [Green Version]
  54. Wellalage, W.; Zhang, T.; Dwight, R.; El-Akruti, K. Bridge Deterioration Modeling by Markov Chain Monte Carlo (MCMC) Simulation Method. In Engineering Asset Management-Systems, Professional Practices and Certification; Lecture Notes in Mechanical Engineering; Tse, P.W., Mathew, J., Wong, K., Lam, R., Ko, C.N., Eds.; Springer: Cham, Switzerland, 2015; pp. 545–556. [Google Scholar]
  55. Cong, L.; Bin, H.; Zongjun, H.; Zhongrong, N. Analysis of multi-crack propagation by using the extended boundary element method. Eng. Anal. Bound. Elem. 2021, 132, 65–76. [Google Scholar] [CrossRef]
  56. Shvets, A.A.; Rakhlin, A.; Kalinin, A.A.; Iglovikov, V.I. Automatic Instrument Segmentation in Robot-Assisted Surgery using Deep Learning. In Proceedings of the 2018 17th IEEE International Conference on Machine Learning and Applications (ICMLA), Orlando, FL, USA, 17–20 December 2018; pp. 624–628. [Google Scholar] [CrossRef] [Green Version]
  57. Bradski, G.R.; Kaehler, A. Learning OpenCV: Computer Vision with the OpenCV Library, 1st ed.; Software That Sees; O’Reilly: Beijing, China, 2011. [Google Scholar]
  58. Mapillary AB. OpenSfM. 2014. Available online: https://opensfm.org (accessed on 18 November 2021).
  59. Blender Foundation. Blender v. 2.92. 1995. Available online: https://www.blender.org/ (accessed on 16 March 2021).
  60. buildingSMART International Ltd. IFC4 Add2: Addendum 2 [Official]. 2016. Available online: https://standards.buildingsmart.org/IFC/RELEASE/IFC4/ADD2_TC1/HTML/ (accessed on 1 June 2018).
  61. Zhou, Q.Y.; Park, J.; Koltun, V. Open3D: A Modern Library for 3D Data Processing. arXiv 2018, arXiv:1801.09847. [Google Scholar]
  62. Lockley, S.; Ward, A.; Cerny, M.; Artus, M. xBIM Xplorer. 2020. Available online: https://github.com/Noranius/XbimWindowsUI (accessed on 20 December 2021).
  63. ANSYS Inc. Ansys 2020 R2. 2020. Available online: https://www.ansys.com/en-us/products/ansys-workbench (accessed on 14 April 2021).
  64. Artus, M.; Alabassy, M.S.H.; Koch, C. IFC based Framework for Generating, Modeling and Visualizing Spalling Defect Geometries. In EG-ICE 2021 Workshop on Intelligent Computing in Engineering; Abualdenien, J., Borrmann, A., Ungureanu, L.C., Hartmann, T., Eds.; Universitätsverlag der TU Berlin: Berlin, Germany, 2021. [Google Scholar]
Figure 1. The as-damaged BIM model as a central point for involved domains during the operation phase. Pictograms have been taken from the Noun Project [6,7,8,9,10,11,12].
Applsci 12 02772 g001
Figure 2. BIM in the life-cycle of a facility [13], according to [4].
Applsci 12 02772 g002
Figure 3. Overview of the framework with the damage input data, damage data processing, model states, and possible use cases. Pictograms have been taken from the Noun Project [8,11,12].
Applsci 12 02772 g003
Figure 4. Exemplary segmentation of a spalling defect. (a) cropped part of the inspection photo. (b) spalling map. (c) overlay of the indentified spalled region and the inspection photo.
Applsci 12 02772 g004
Figure 5. Process for generating the geometry.
Applsci 12 02772 g005
Figure 6. Workflow of the geometry generation with triangulation and extrusion.
Applsci 12 02772 g006
Figure 7. UML diagram of the data model. Semantic data is depicted in blue. Yellow elements refer to geometric data and green elements are related to visual data. The gray elements are related to the bridge.
Applsci 12 02772 g007
Figure 8. Block diagram of the resultant IFC structure. Yellow elements are instances and blue elements are relationships.
Applsci 12 02772 g008
Figure 9. Bridge that has been used for the investigation. Name and location of the bridge are confidential.
Applsci 12 02772 g009
Figure 10. Overview of the case study with all included steps.
Applsci 12 02772 g010
Figure 11. Inference output of the retrained TernausNet16 model via transfer learning on the use case inspection images. (a) First inspection image for the presented case study. (b) The resulting prediction map of (a) from inference. (c) Binary thresholded prediction mask of (b). (d) Binary mask overlaid onto the image in (a). (e) Second inspection image. (f) The prediction map of (e). (g) Binary thresholded prediction mask of (f). (h) Binary mask overlaid onto the image in (e).
Applsci 12 02772 g011
Figure 12. The process of backwards projection of specific pixels into 3D space. (a) The 3D reconstructed point cloud. (b) Labeled binary map of Figure 11c. (c) The estimated depth map of the photo in Figure 11a. (d) The back projected labelled points from (b). (e) The conformed normals of the vertices in the point cloud pointing towards the camera. (f) Labeled binary map of Figure 11c. (g) The estimated depth map of the photo in Figure 11a. (h) The back projected labeled points from (f).
Applsci 12 02772 g012
Figure 13. Steps for geometry generation of spalling defect. (a) Triangulated mesh of the 3D reconstructed point cloud via OpenSfM. (b) Extrusion of the triangulated labeled defect patch in Figure 12d along the mean conformed unit normal direction. (c) Extrusion of the triangulated labeled defect patch in Figure 12h along the mean conformed unit normal direction. (d) Both extruded patches are added together. (e) Resultant geometry of mesh decimation for both extruded batches. (f) The output of the boolean union operation of both extruded patches displayed in wire-frame view mode. (g) The output of the boolean union operation displayed as a solid geometry. (h) The final simplified geometry generated for the segmented defect to further reduce its number of faces.
Applsci 12 02772 g013
Figure 14. Close-up view of the modeled defect. (a) close-up view of the bridge beam with spalling subtraction and exposed reinforcement (b) bridge overview with marked section A-A (c) section A-A with the subtraction as wireframe.
Applsci 12 02772 g014
Figure 15. Excerpt of an IFC file with the spalling (#11373) and the geometry definition.
Applsci 12 02772 g015
Figure 16. Excerpt of the resultant IFC file.
Applsci 12 02772 g016
Figure 17. Screenshot from the BIM software xBIM Xplorer [62] with the hierarchy, properties, and 3D view.
Applsci 12 02772 g017
Table 1. Mean Performance metrics values for the F1 score, Jaccard index, Accuracy, Precision, and Recall of the retrained TernausNet16 model respectively. The column mean shows the mean values and std contains standard deviations.
MetricMeanStd
Dice (F1)0.83040.1754
Jaccard (IoU)0.83260.2013
Accuracy0.91960.0672
Precision0.87550.1672
Recall0.81360.2057
Publisher’s Note: MDPI stays neutral with regard to jurisdictional claims in published maps and institutional affiliations.

