Article

Effect of Novel Aspergillus and Neurospora Species-Based Additive on Ensiling Parameters and Biomethane Potential of Sugar Beet Leaves

1
Department of Biochemical Conversion, German Biomass Research Centre, 04347 Leipzig, Germany
2
Department of Chemical Engineering, University of Port Harcourt, PMB, Choba 5323, Nigeria
3
Senzyme GmbH, 53840 Troisdorf, Germany
4
Department of Waste and Resource Management, University of Rostock, 18055 Rostock, Germany
*
Author to whom correspondence should be addressed.
Appl. Sci. 2022, 12(5), 2684; https://doi.org/10.3390/app12052684
Submission received: 10 February 2022 / Revised: 1 March 2022 / Accepted: 2 March 2022 / Published: 4 March 2022
(This article belongs to the Special Issue Combined Energetic and Material Utilization of Agriculture Residues)

Abstract

:
Research on additives that improve the quality of silages for an enhanced and sustainable biogas production are limited in the literature. Frequently used additives such as lactic acid bacteria enhance the quality of silages but have no significant effect on biogas yield. This study investigated the effect of a new enzymatic additive on the quality of ensiling and BMP of sugar beet leaves. Sugar beet leaves were ensiled with and without the additive (Aspergillus- and Neurospora-based additive) in ratios of 50:1 (A50:1), 150:1 (B150:1), and 500:1 (C500:1) (gsubstrate/gadditive) for 370 days at ambient temperature. Results showed that silages with additive had lower yeast activity and increased biodegradability compared to silages without additive (control). The additive increased the BMP by 45.35%, 24.23%, and 21.69% in silages A50:1, B150:1, and C500:1 respectively, compared to silages without additive (control). Although the novel enzyme is in its early stage, the results indicate that it has a potential for practical application at an additive to substrate ratio (g/g) of 1:50. The use of sugar beet leaves and the novel enzyme for biogas production forms part of the circular economy since it involves the use of wastes for clean energy production.

1. Introduction

Sugar beet leaves (SBL) are a by-product of sugar beet harvesting. They make up an average of 27% of the fresh sugar beet plant [1]. Every year, about 120 million tons of SBL is produced in Europe [2], with an estimated 18 million tons produced in Germany. The nutritional content of SBL has been reported to be low, making it an unlikely source of animal nutrition [2]. Despite the huge availability of this biomass, it has largely remained underutilised without previous utilisation as fodder or biogas substrate. To be used for year-round biogas production, seasonal harvested SBL will need to be preserved so that it can be made available whenever it is needed. One promising way of preserving SBL is by ensiling.
Ensiling is a preservation technique for wet biomass. It has been used extensively to preserve animal feed [3] and as a pretreatment technique to improve biogas production by causing a change in the chemical and structural composition of the biomass [4]. Different fermentation pathways can take place during ensiling, depending on the conditions used [5]. These different fermentation pathways determine the effectiveness and further characteristics of the ensiling process.
One way of improving the efficiency of ensiling is by the use of additives to control the properties of the substrates to be ensiled [6]. The type of fermentation products formed during ensiling can be influenced by the type of additives used [7]. These fermentation products are important factors that play a key role in the quantity and quality of biogas produced from the silages. Effects of additives on silages are given by (i) conserving the dry matter and energy of the substrate against losses by degradation in the ensiling process itself and in the aerobic phase before feed-out to the digester, (ii) enhancing anaerobic degradability of ensiled materials during digestion, and (iii) enhancing biogas generation from the fermentation products [8]. Additives such as formic acids quickly decrease the pH of a system, thereby inhibiting the activities of undesirable microbes such as Clostridia [9], while additives such as lactic acid bacteria (LAB) accelerate the fermentation of water-soluble carbohydrates (WSC) to lactic acid, which also reduces the pH of the system and in turn prevents undesirable microbial activities [10]. Some other additives such as molasses increase the amount of WSC that are needed for the formation of lactic acids in the system [11].
A large number the additives used for ensiling enhance the conservation of energy and nutritional content of the silage for animal feed [3]. These silages that are fit for use as animal feed may not be optimal for use as a substrate for biogas production [12], although the general requirements of silages for anaerobic digestion (AD) are much lower than those for animal nutrition, regarding aspects such as palatability, content of essential amino or fatty acids, and digestibility. If silages are to be used for AD, the effect of the additives on the kinetics and especially on the biomethane potential (BMP) needs to be considered. While the literature is very rich with regards to additives for use in ensiling wet biomass for animal nutrition, the research on additives for silages that are used for AD is limited [12]. Additives such as lactic acid bacteria enhance the quality of ensiling but have little or no effect on biogas production [6]. Therefore, the purpose of this study was to (i) investigate the effect of a newly developed enzymatic additives on the quality of ensiling and BMP of SBL and (ii) evaluate the kinetics of the BMP of SBL. The study is within the subject of circular economy as it involves using waste materials to produce biomethane which has been reported to have the potential to reduce greenhouse gas emissions [13,14], thereby providing affordable and clean energy, consistent with the millennium developmental goals of the United Nations. The novelty of this work is in the use of a novel enzymatic additive developed from vegetable wastes materials to improve the BMP of sugar beet leaves.

2. Materials and Methods

2.1. Substrates, Additive and Inoculum

SBL were obtained from a local farm in Saxony, Eastern Germany, just after harvesting sugar beet. The leaves were then transported in usual plastic bags to the Deutsches Biomasseforschungszentrum gGmbH (DBFZ), Leipzig, where they were grinded to particle sizes of less than 2 mm using a mechanical grinder (Mainca PC-82/22, Barcelona, Spain). The additive used was in granular form and was a product of solid-state fermentation of vegetable raw materials (rape seed meal, sugar beet pulp, and maize gluten) using Aspergillus niger, Aspergillus tubingensis, and Neurospora intermedia. The inoculum (pH = 7.64, TS = 2.64, and VS = 71.87% TS) used for BMP tests was obtained from an active continuous-stirred tank reactor (CSTR) at the DBFZ and degassed by incubation at 37 °C for 7 days to minimise the generation of non-specific gases. The CSTR is specifically operated for methane yield tests and runs on a maize silage–cow dung–sunflower oil mixture with a hydraulic retention time of 100 days and an organic loading rate of 0.5 g VS/L/d.

2.2. Ensiling Process

Four sets of silages were prepared as follows: (i) substrates without additives (CTL), (ii) a mixture of 1 g of additive and 50 g of SBL (A50:1), (iii) a mixture of 1 g of additive and 150 g of SBL (B150:1), and (iv) a mixture of 1 g of additive and 500 g of SBL (C500:1). Three replications of each treatment were prepared via plastic bags taken as mini-silos. Before packing and sealing, a given mass of fresh SBL was first grinded and then thoroughly mixed with the additive by hand. Thereafter, the mixture of SBL and additive was grinded together and mixed again. Approximately 300 g of the mixture was packed into air-tight bags of size 310 × 105 mm (PA/PE, La.va, Bad Saulgau, Germany) and sealed with a vacuum chamber machine (Cookmax Serie 42, Darmstadt, Germany) to remove oxygen. A total of 72 mini-silos were prepared and stored at ambient temperature. Mini-silos were opened and sampled on days 30, 60, 90, 120, and 370 for analysis. Triplicate bags of each sample were sacrificed on every day of investigation.

2.3. Physicochemical Measurements

SBL samples before ensiling and their silages were analysed for total solids (TS) and volatile solids (VS) using standard methods [15] and corrected for organic acid and alcohol losses using the method of Weissbach and Strubelt [16]. The content of organic acids and alcohols were measured by analysis on a 7890A gas chromatograph with a flame ionisation detector (FID) (Agilent Technologies, Inc., Santa Clara, CA, USA) following the method of Apelt [17]. Ammonia–nitrogen (NH3-N) concentrations were determined using test kits, Nessler reagent, and a Hack DR 2000 spectrophotometer (HACH LANGE GmbH, Berlin, Germany). Concentration and composition of WSC was measured by analysis on an Azura HPLC system (Knauer GmbH, Berlin, Germany) equipped with a degasser, binary pump system, auto sampler, column oven, and refractive index detector (RID) set at 40 °C, according to the method of Mühlenberg [18]. Cellulose, hemicellulose, and lignin components were determined using the neutral detergent fibre (NDF), acid detergent fibre (ADF), and acid detergent lignin (ADL) methods as described by van Soest and Wine [19]. Determination of crude protein (CP) and crude fibre (CF) was done using standard methods [20,21]. Carbon (C) and nitrogen (N) content of the fresh SBL was analysed by means of an elemental analyser (TrueSpec, LECO Instrumente GmbH, Mönchengladbrach, Germany). The content of oxygen (O2) was calculated on the basis of the ash content and analysed elemental composition.

2.4. Biochemical Methane Potential (BMP) Tests

BMP of the silages was measured using the AMPTS II (Bioprocess Control, Lund, Sweden). Each AMPTS reactor consisted of 400 mL inoculum and 4.77 g VS substrate. The inoculum to substrate ratio was 0.9 gVSinoculum/1 gVSsubstrate. Additionally, a reactor with 4.26 g of microcrystalline cellulose (MCC) was used to monitor the quality of the inoculum. The headspace of each reactor was flushed with N2 for about 2 min to ensure anaerobic conditions. Daily methane production of each reactor was recorded using the software Bioprocess Control (Sweden) and corrected to standard conditions (273.15 K and 101.325 kPa).

2.5. Kinetic Evaluation and Data Analysis

Two kinetic models were used to fit the experimental data of the BMP of the silages. These models were the dual pool first-order kinetic model (DPKM) given in Equation (1) and the modified Gompertz model given in Equation (2).
G t = G 0 1 α e k 1 t   1 α e   k 2 t
G t = G 0 . exp   { exp R max . e G 0 λ t   +   1 }
where G(t) = cumulative methane produced (mL/gVS), G(0) = the ultimate methane produced (mL/gVS), k1 = the first-order degradation constant of fast degrading component(1/d), k2 = the first-order degradation constant of slow degrading component (1/d), α = fraction of degradable material, t = duration of digestion (d), Rmax = maximum rate of methane production (mL/gVS/d), λ = lag phase (d), and e = Euler’s constant (2.71828).
The time, tmax, at which the maximum rate of methane production is achieved was estimated using Equation (3).
t max = λ + G 0 R max e
Parameters from the models were estimated using a Solver add-in program in Microsoft Excel. The statistical indicators that were used to determine the more appropriate model that predicted the experimental BMP were the coefficient of determination (R2), the root mean square error (RMSE) shown in Equation (4), the Bayesian information criterion (BIC) given in Equation (5), and the Akaike information criterion (AIC) given in Equation (6).
RMSE = SS n
BIC = nln ss n + kln n
AIC = nln ss n +   2 k
where n is the number of datasets, SS is the squared sum of residuals, and k is the number of parameters in the model.
Data on fermentation characteristics in silages were evaluated by a two-way ANOVA with the main effects of storage period and inoculant by first-level interaction using the general linear model procedure “lm” of the statistical package R (R core team 2018). Tukey’s post hoc test was adopted to compare the difference at the 0.05 significant level. Pearson correlation analysis was used to evaluate the interdependence of fermentation products.

3. Results and Discussion

3.1. Characteristics of Sugar Beet Leaves before Ensiling

The properties of SBL before ensiling are summarised in Table 1. The water content of SBL was seen to be as high as 81.55%, which is consistent with the report of Gissén et al. [22]. The additive increased the total solids of the substrates in direct proportion to the substrate to additive ratio, as was also reported during the ensiling of maize [23]. A high concentration of WSC (mainly glucose) was also observed in the substrate before ensiling, an indication that SBL can be easily ensiled [24]. The crude protein content of SBL in this study was less than the 22.8% reported by Tenorio [1]. The crude fibre content was higher than the 9.9%TS reported by Starke and Hoffmann [25]. Differences in crude protein and crude fibre content could be a result of a difference in varieties, growing conditions, etc. Cellulose content was seen to be higher than hemicellulose content, as is common with most lignocellulose biomass [26], and falls within the range reported by Kiskini et al. [27] for SBL. TS and VS content of SBL before ensiling were consistent with the values reported by Kreuger et al. [28] and Larsen et al. [29]. The pH value of the leaves before ensiling was 4.98, which is lower than the 7.87 previously reported by Beheary et al. [30], probably due to a higher concentration of lactic acid arising from handling technique and time difference between harvest and ensiling in the laboratory. The presence of lactic acid and acetic acid is an indication that initial fermentation started in the substrate before ensiling [6].
The carbon/nitrogen ratio of the SBL in our study is comparable with the 12.0 reported by Zauner and Küntzel [31] but lower than the 14.0 reported by Parawira et al. [32]. The ash content of SBL was above the range of 9.6 to 19.5%TS reported by some authors depending on species and maturity [33], but was consistent with the report of Larsen et al. [29] who obtained an ash content value of 3.2%FM. In terms of fresh matter, the ash content for the control, A50:1, B150:1, and C500:1 silages were 2.94, 3.16, 3.10, and 3.26%FM, respectively.

3.2. Effect of Additive on Silage Characteristics

Fermentation products (i.e., lactic acid, acetic acid, butyric acid, propionic acid, ethanol, and ammonia–nitrogen) in addition to the pH values of the silages were periodically measured throughout the 370 days of ensiling (Table 2). The concentration of NH3-N in all silages (data not shown) was less than 0.01 mg/L and was not significantly affected (p < 0.05) by treatment, ensiling duration, and their interaction, indicating that there was no protein degradation [34]. In all silages, the concentration of butyric acid was below a detectable limit (<0.01), an indication of the absence of clostridia fermentation, and therefore adequate silage preservation was maintained [35]. Butyric acid fermentation brings about higher pH and TS losses compared to lactic or acetic acid fermentation, and therefore processes with high butyric acid concentration require a higher quantity of substrate for a given volume of BMP [36].
There were changes in the TS and VS content of all silages, as shown in Table 2. TS and VS contents were significantly lower (p < 0.05) after the ensiling period compared to the initial values (time, t = 0), probably due to degradation to organic acids and alcohols. Losses in VS with duration of ensiling has also been reported by several authors [37,38]. CTL silage had the lowest VS loss of 2.47% at the end of the ensiling period, while the losses in VS were 4.13, 4.07, and 3.76% in A50:1, B150:1, and C500:1 silages, respectively, indicating that VS loss increases with the elevated dosage of the additive, as also reported during the ensiling of maize [23] and sweet sorghum [39].
An important parameter used to evaluate the quality of silages is pH. Compared to the initial pH, there was a decline in the pH of the treated silages at day 30, unlike in CTL silage, wherein there was a slight increase, an indication that there was a faster production of lactic acid in the treated silages. However, neither treatment nor duration of ensiling had a significant effect (p < 0.05) on the pH of the silages between days 30 and 120, during which there was a gradual decrease in the pH of all silages. However, the pH of all silages significantly decreased at day 370 compared to day 120, with no significant difference among the silages.
At 30 days of ensiling, propionic acid was present in all silages with a significantly higher concentration in A50:1 silage (p < 0.05) compared to other silages, an indication that the production of the acid was significantly affected by treatment after 30 days. However, propionic acid was undetected in all silages between day 60 and 120 (Table 2). As the ensiling continued, propionic acid significantly increased in CTL and A50:1 silages (p < 0.05), particularly in CTL silage on day 370, probably due to lactic acid degradation [35], indicating that the additive at lower concentration (gsubstrate/gadditive) inhibited the decomposition of lactic acid to propionic acid.
Lactic acid was the most abundant organic acid in all the silages, as is common with well-preserved silages [34]. Treatment, ensiling duration, and their interactions had no significant effect on lactic acid concentration on day 30. Moreover, lactic acid concentration was not significantly different (p < 0.05) among the silages after 90 days, except in A50:1 silage, wherein it was significantly higher. After 370 days of ensiling, lactic acid was higher (p < 0.05) in treated silages than in CTL silage. A high concentration of lactic acid in a silage brings about a reduction in the pH of the system, resulting in the inhibition of unwanted microbial activities [35]. However, there were no significant differences (p < 0.05) in the pH of the silages after 370 days of ensiling, although the concentration of lactic acid was significantly different among all silages (Table 2), probably because of the high buffering capacity of SBL [35]. Generally, lactic acid concentration increased with ensiling duration in all silages, an indication that more WSC may have been made available from the biological degradation of hemicellulose [9] due to accumulation of organic acids. Some authors [40,41] have reported a decrease in lactic acid concentration in silages during prolonged ensiling. However, Wang and Nashino [42] have shown that process variables such as temperature can affect the dynamics of fermentation products. Since the concentration of lactic acid was not determined within an interval of 250 days (between day 120 and 370), a conclusion on the dynamics of lactic acid concentration (and concentration of other fermentation products) in this study cannot be made.
CTL silage had the lowest concentration of acetic acid after ensiling (Table 2). From 30 to 120 days, acetic acid was highest in A50:1 silage, followed by C500:1 silage, but it significantly increased in all silages (p < 0.05) on day 370. Treatment, ensiling duration, and their interactions significantly affected the concentration of acetic acid after 370 days. A higher concentration of acetic acid indicates a potential for prolonged stability of the silage upon air exposure [35]. All silages had a lactic to acetic acid (LA/AA) ratio greater than 1.0, an indication that there was no abnormal fermentation in the systems [35]. Treated silages had a lower LA/AA ratio than CTL silage. Although there are reports that the quality of good silages increases with an increase in LA/AA ratio [43], it appears that this condition is only important if the silage is to be used as animal feed. Forage–sorghum mixture silages with lower LA/AA values of 2.46 were reported to produce higher methane yields than silages with higher LA/AA values of 12.70 [44]. Gallegos et al. [45] also reported a higher methane yield in a mixed silage of elodea and wheat straw with lower LA/AA ratio compared to silages with higher LA/AA ratios.
Ethanol was the most abundant alcohol present in all the silages, as is common in most silages, usually a consequence of yeast activity [35]. From 90 to 370 days, concentrations of ethanol were lower in A50:1 and B150:1 silages compared to CTL and C500:1 silages, indicating that the additive inhibited yeast activity in A50:1 and B150:1 silages but not in the C500:1 silage, which may mean that the additive can inhibit yeast activity at a higher dosage, while at a lower dosage, yeast activity can be enhanced. Guo et al. [46] and Li et al. [47] have also reported a reduction in the amount of yeast when additive was added during the ensiling of corn stalk and oat.
The total fermentation product (TFP) content of the silages were significantly affected by treatment, ensiling duration, and their interactions after 370 days, with the lowest and highest being in CTL and A50:1 silages, respectively. Silages with higher TFP had higher %VS losses, an indication that the formation of fermentation products could have been responsible for the VS losses.

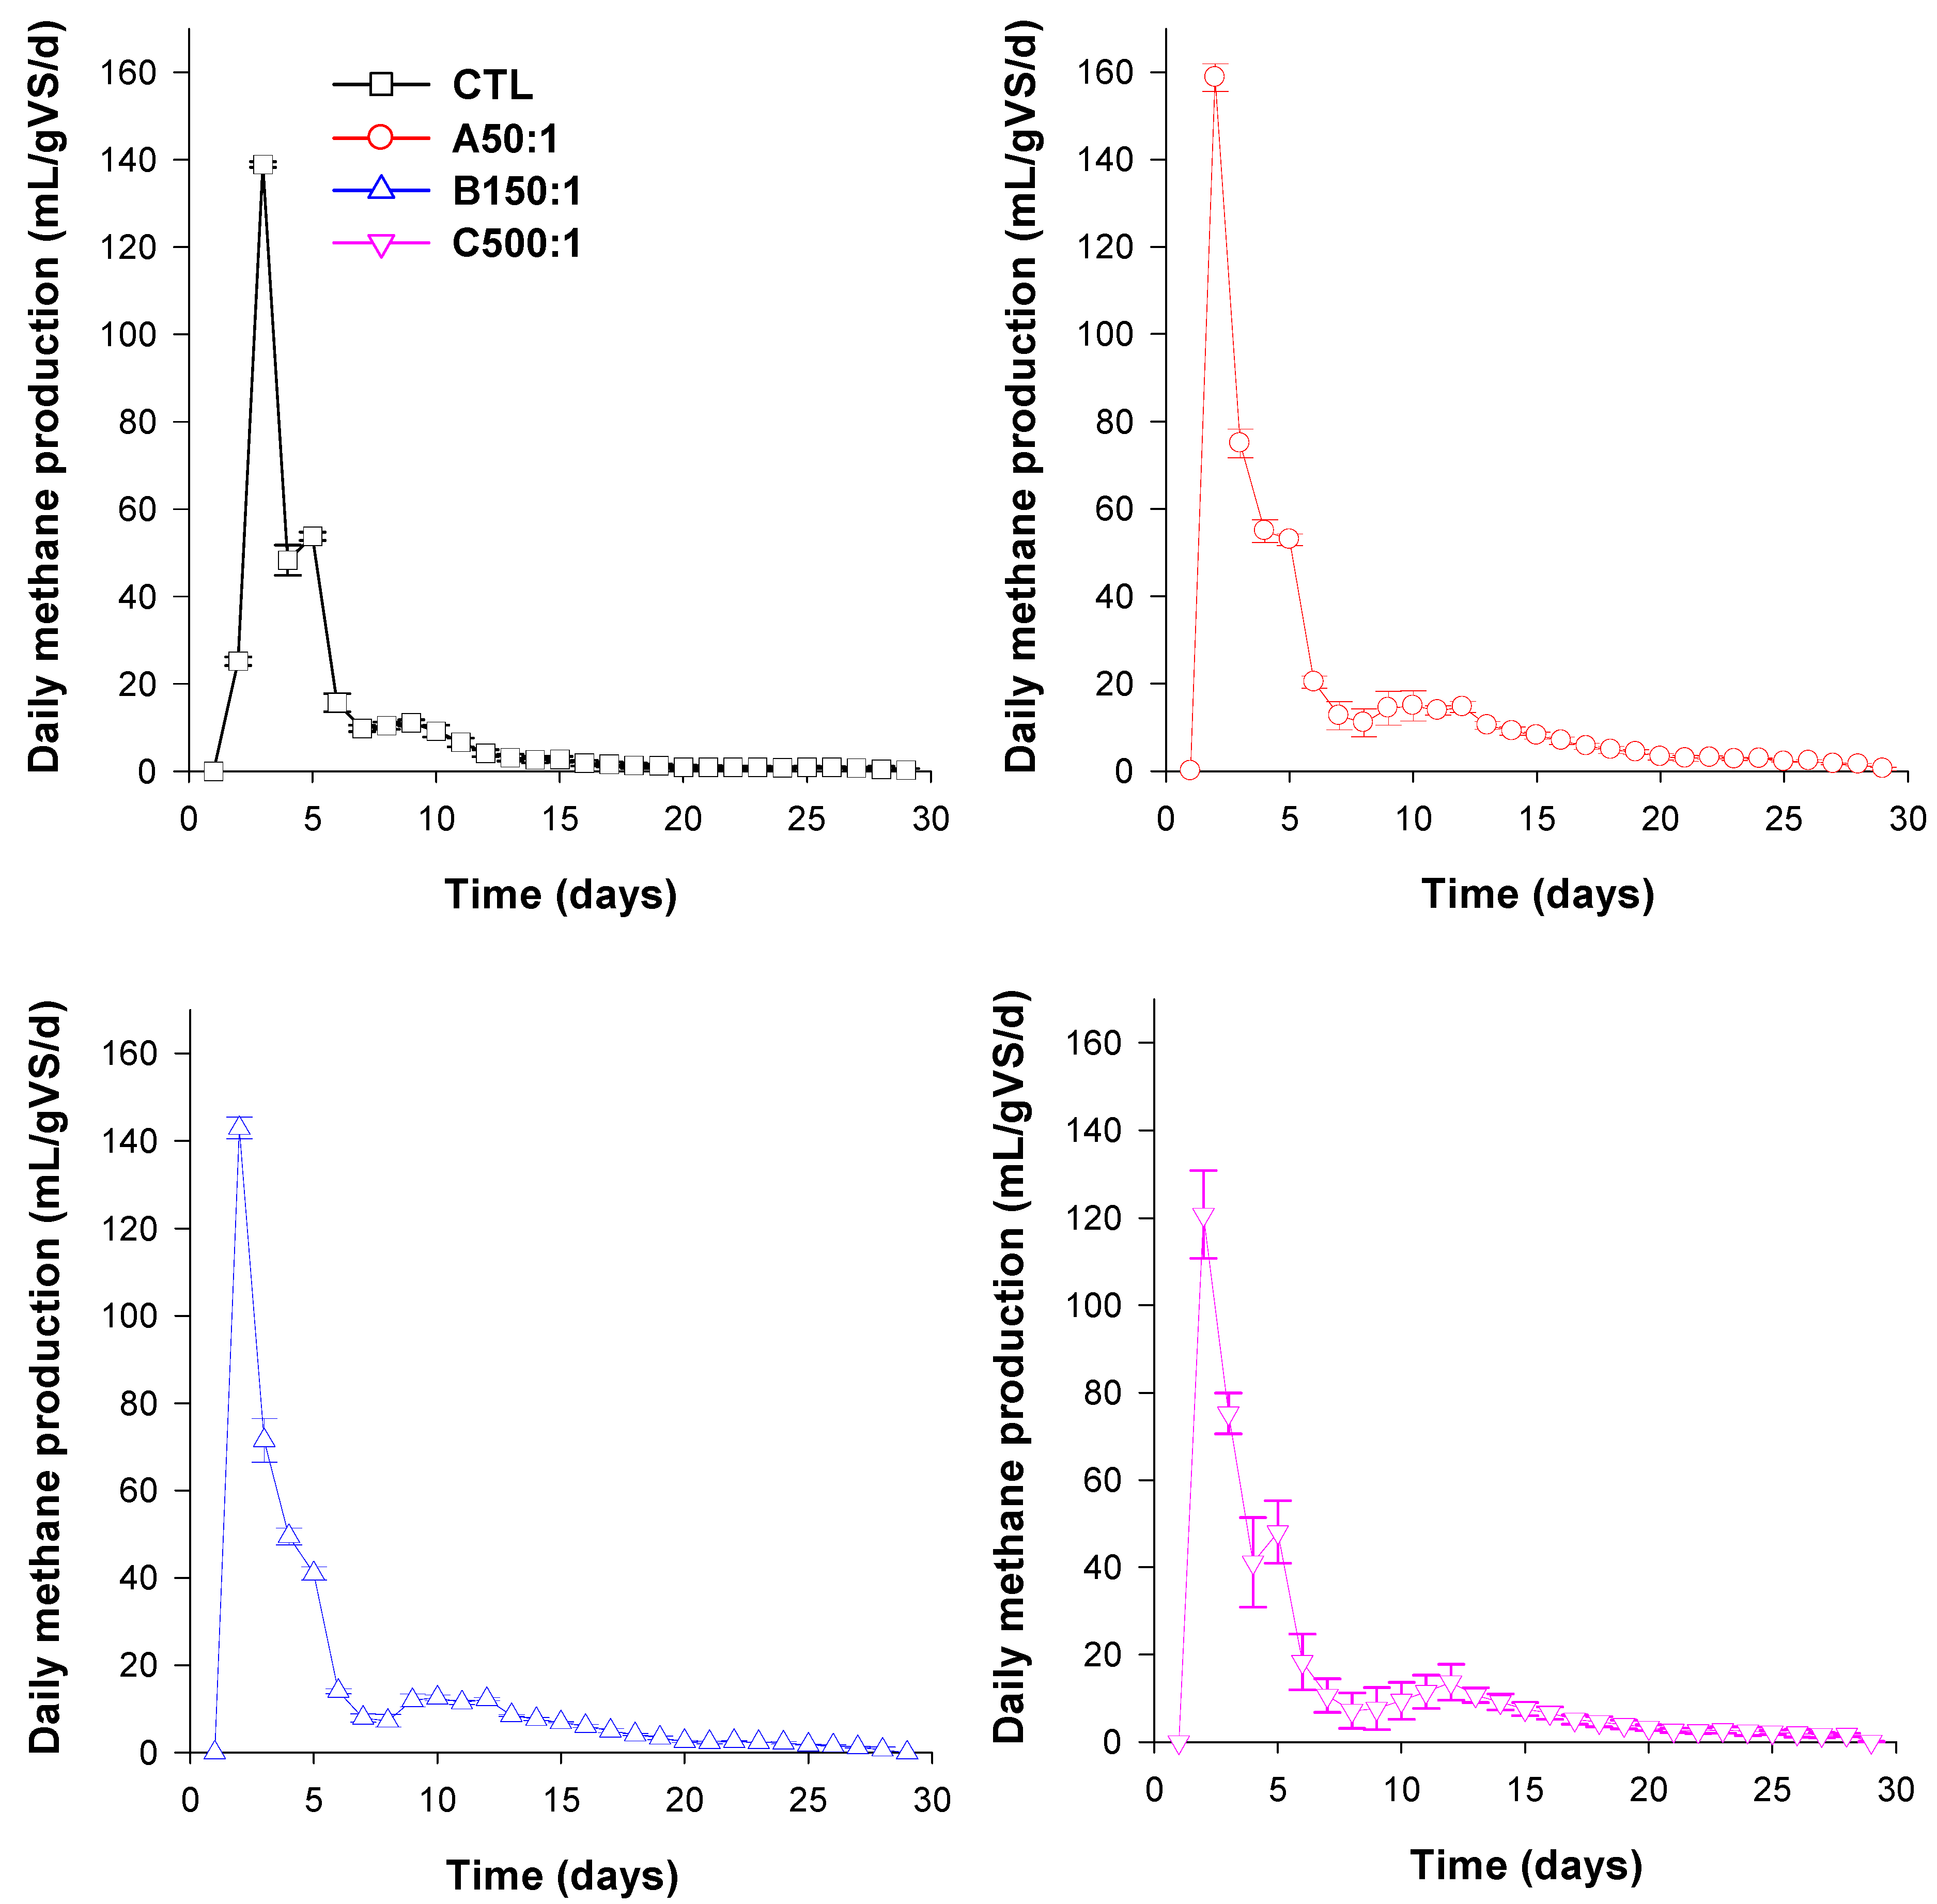
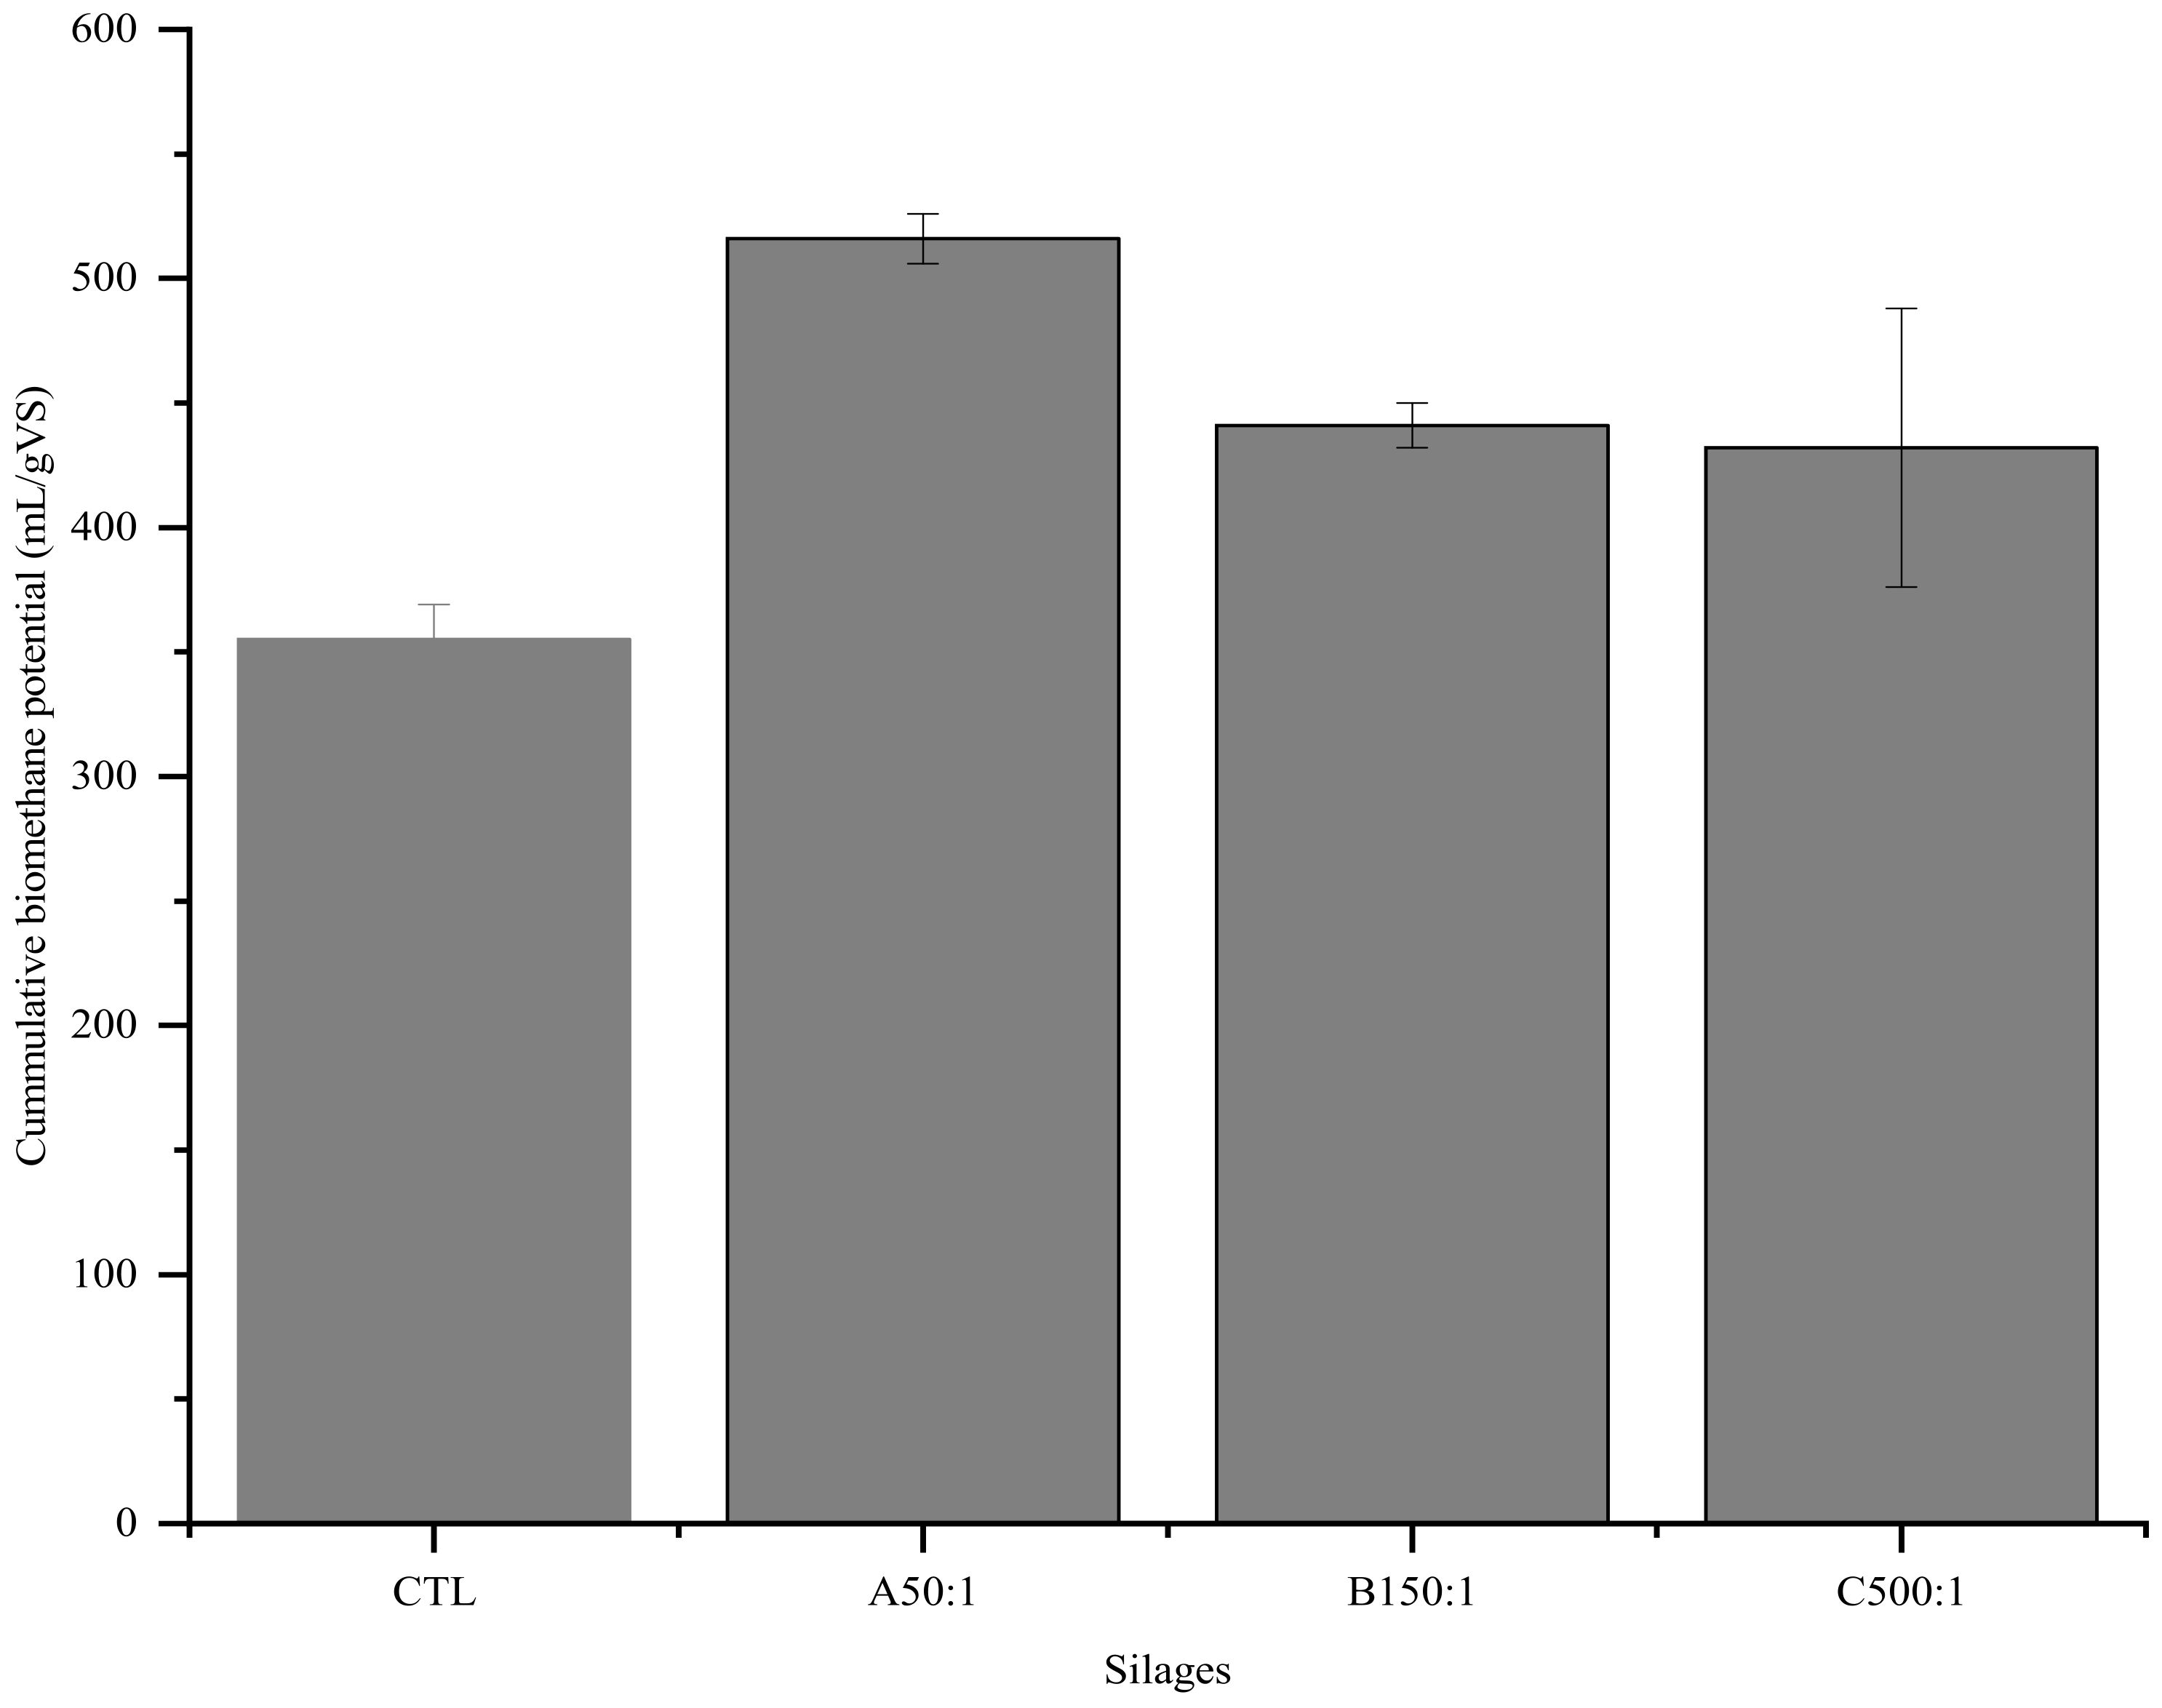
3.3. Effect of Additive on Biomethane Potential

The batch AD of the silages were conducted at a mesophilic temperature of 37 °C (±1) for 28 days. The highest daily methane production occurred on the first day and then fell continuously in all silages except in the CTL silage, wherein the daily methane production increased until the second day (Figure 1), an indication that the additives increased the digestibility of the substrate as also reported during the AD of straw [48] and other residues [12]. Probably due to the depletion of nutrients, the methane production rate declined after 15 days and the experiment was stopped after 28 days, in accordance with the VDI 4630 [49] methodology.
The additive used in our study had a positive significant effect (p < 0.05) on the BMP of the silages in direct proportion to the substrate to additive ratio (Figure 2). However, only the BMP of A50:1 silage was significantly higher (p < 0.05) than the BMP of the CTL silage. The A50:1 silage had the highest BMP of 516 mL/gVS, followed by the B150:1 silage (441 mL/gVS) and C500:1 silage (432 mL/gVS), representing increases of 45.35%, 24.23%, and 21.69%, respectively, compared to the BMP of CTL silage. The higher BMP of the treated silages compared to the CTL could be attributed to the higher TFP content of those silages [7].
The BMP of CTL silage compares with the 361 mL/gVS reported by Gissén et al. [22]. Table 3 shows a summary of the percentage increase in BMP of some silages as a result of the addition of a biological additive during ensiling. It can be seen that the additive in our study has the potential to significantly enhance biogas production.

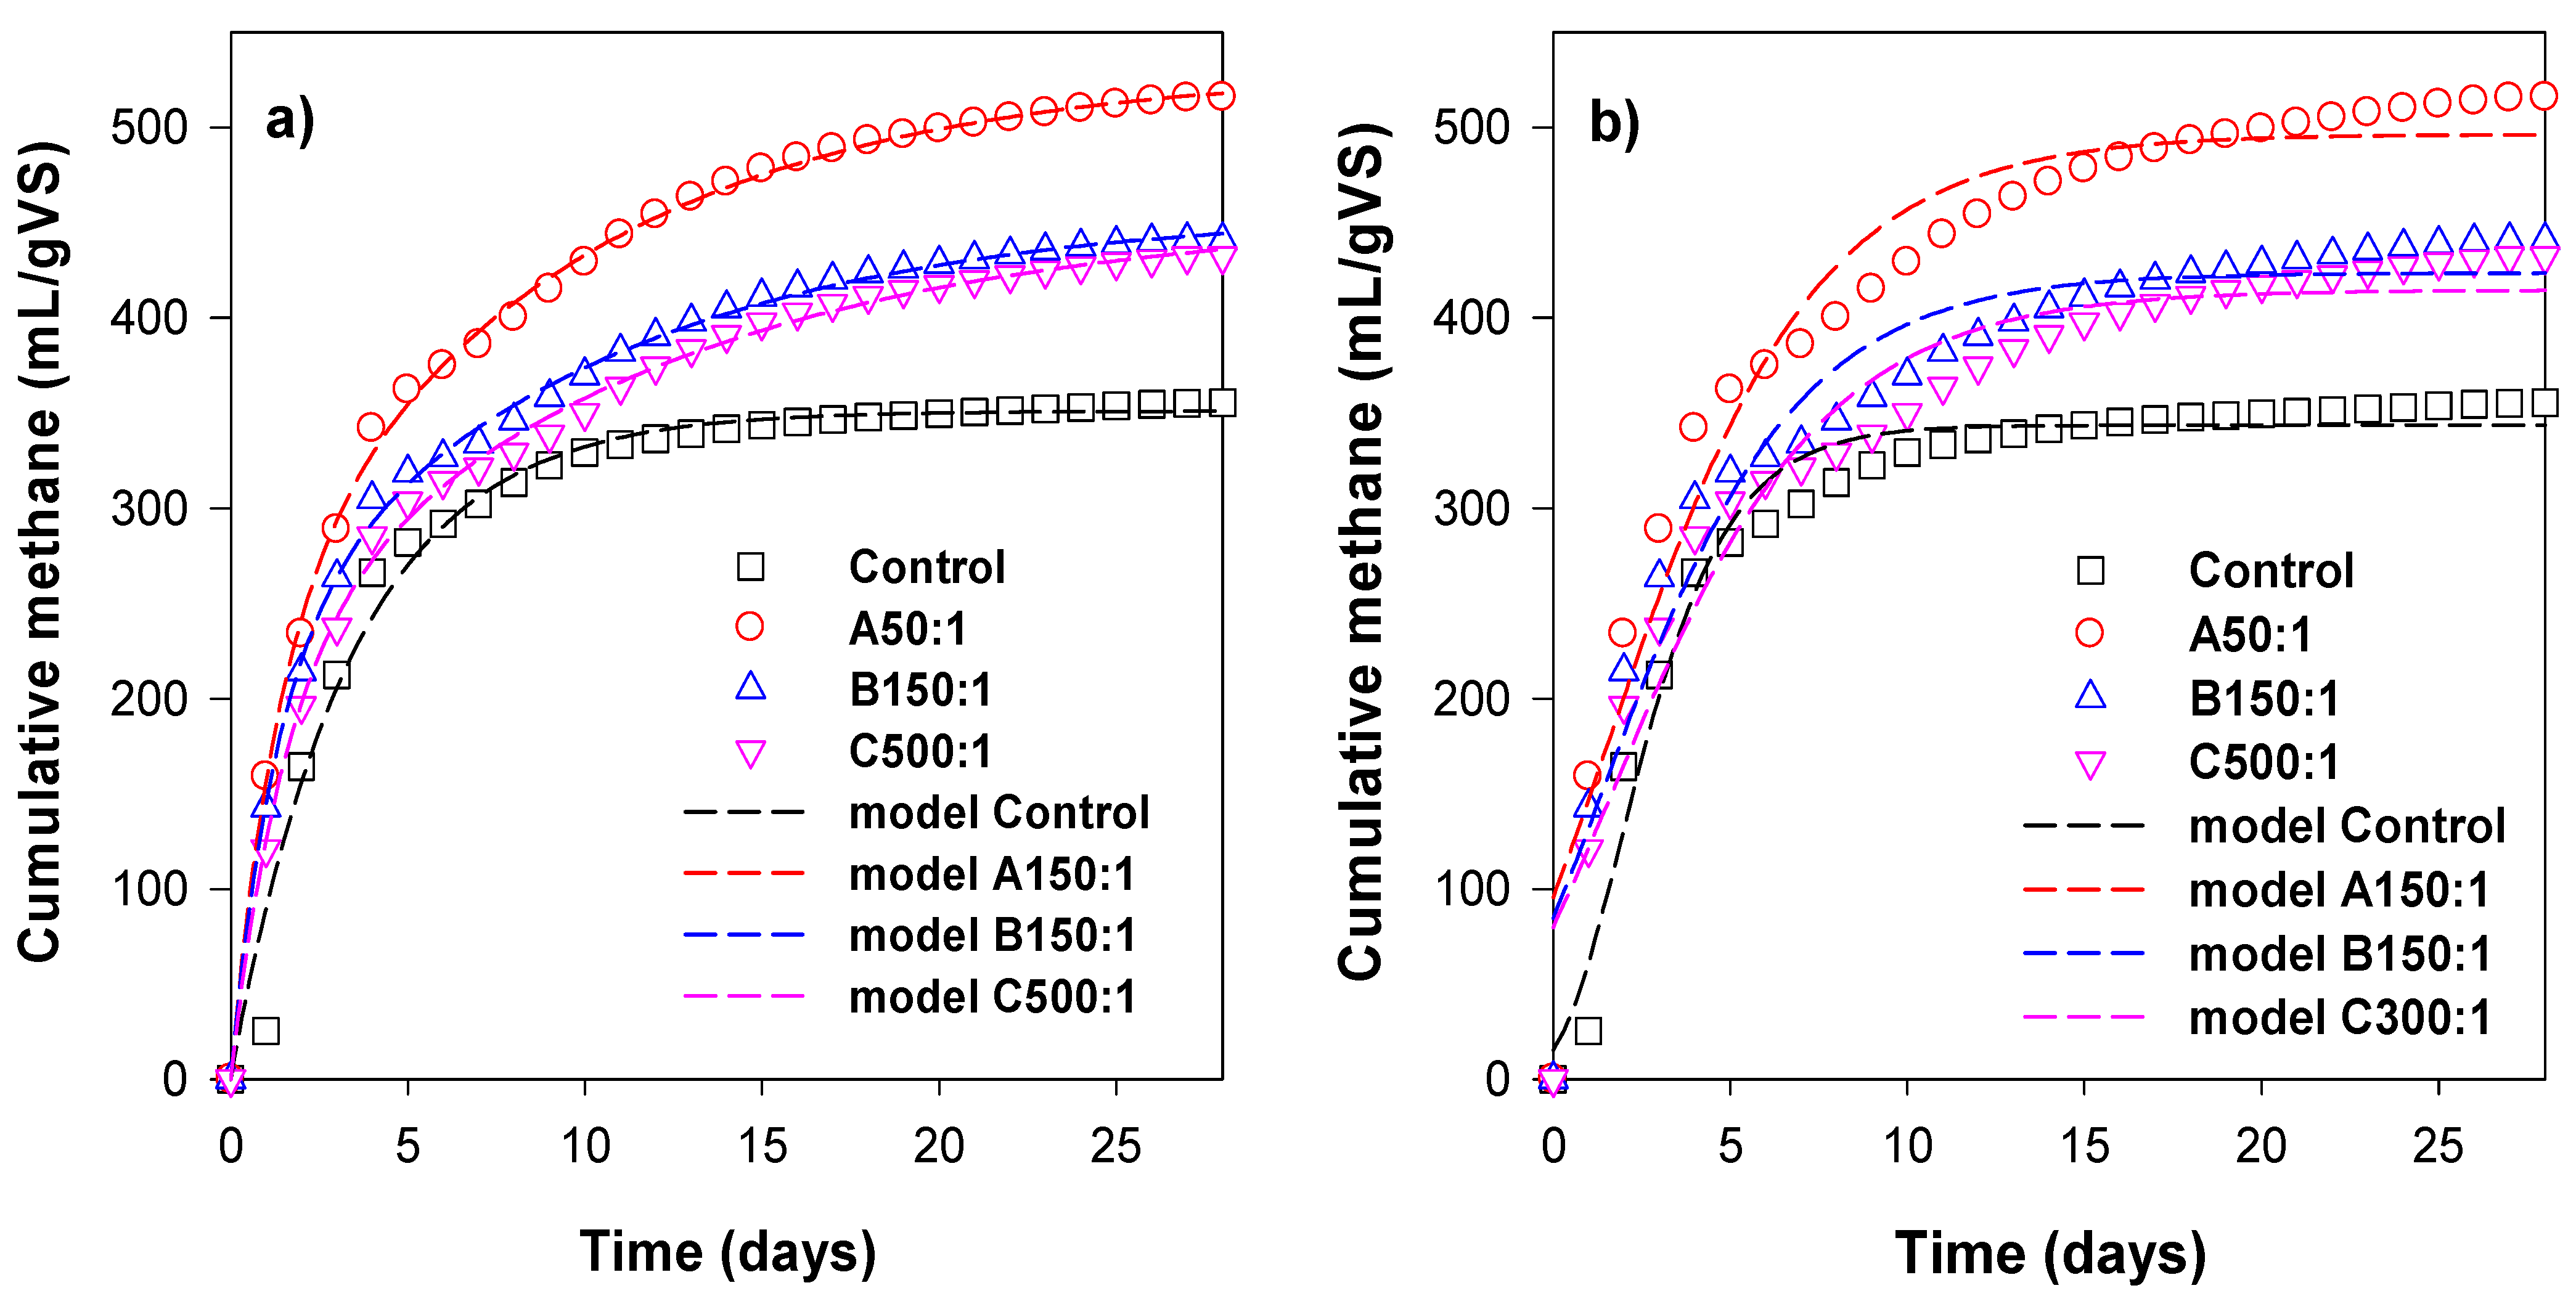
3.4. Kinetic Evaluation and Analysis

It is necessary to obtain a suitable model for the design and optimisation of a continuous process for biomethane production from SBL. To do this, two models were used to assess the accumulated BMP of the silages. Experimental BMP were fitted to the models, and kinetic parameters were estimated using Excel software. The measured data and the predicted curves from the models are shown in Figure 3. The two models provide a reasonably good fit to the measured data, as seen from the high values of coefficient of determination, R2 (Table 4). However, the dual pool kinetic model (DPKM) fitted the measured BMP better than the modified Gompertz model and therefore was more appropriate in describing the BMP of the substrates, probably because, unlike the modified Gompertz model, the DPKM was derived on the assumption that complex substrates such as sugar beet leaves used for AD contain both fast and slow degradable components [53]. Other parameters that were used to determine a better fit of a model to the experimental data are shown in Table 4.
An indication of a more appropriate model to describe a process is the lower values of RMSE, BIC, and AIC [54]. The dual pool kinetic model (DPKM) was seen to exhibit a better BMP fit for the experimental data than the modified Gompertz model. The deviations between the cumulative experimental and predicted BMP from the DPKM for CTL, A50:1, B150:1, and C500:1 silages were 1.2%, 0.04%, 0.08%, and 1.5%, respectively. From the modified Gompertz model, the deviations for CTL, A50:1, B150:1, and C500:1 silages were 3.3%, 6.1%, 6.2%, and 6.6%, respectively. From the DPKM, the values of hydrolytic constant of fast degradable components, k1, were at least nine times higher than the hydrolytic constants of slow degradable components, k2, in all silages, an indication that components of SBL degrade at different rates. The hydrolytic constants (k1 and k2) of the silages with additives were significantly higher in compared to the values of the CTL silage, an indication of increased enzymatic hydrolysis.
The fraction of degradable components, α, were significantly higher (p < 0.05) in the silages with additives, an indication that the additive may have enhanced the biodegradation of structural carbohydrate [37]. Values of α and Rmax were in the order of A50:1 > B150:1 > C500:1 > CTL. Figure 3 also shows the presence of a logarithmic phase (1–10 days), as well as the absence of a lag phase, except for the CTL silage, wherein the lag phase was seen to be about 0.24 days. In AD processes, a short lag phase, which is an indication of higher activity and tolerance for the system in the reactor [55], is usually preferred. Using the values of the lag phase (λ), maximum rate of biomethane production (Rmax) and accumulated methane yield from the modified Gompertz model, the maximum time, tmax, at which the maximum methane rate was obtained, was calculated to be 2.09, 2.14, 1.93, and 2.00 days for CTL, A50:1, B150:1, and C500:1 silages, respectively. These values are true only for the CTL silage, as seen in Figure 1, confirming that the Gompertz model does not provide a better fit of the experimental data. However, the values provide an approximation of the time within which the maximum rate of biomethane production can be achieved. An important parameter that can also be deduced from the curves is the effective methane production time, Teff. This is the time it will take for 90% of the cumulative biomethane to be produced. The measured Teff for the substrates without additive was 8 days, and 14 days for the silages with additive. Teff from the DPKM were closer to the measured values than Teff from the modified Gompertz model. In both models, silages with additive had a higher Teff than the silage without additive (Table 4). Mao et al. [56] has reported that a higher Teff is associated with substrates that have a shorter lag phase and a higher BMP.

3.5. Circularity of Materials and Management

The present study encompasses the features of circular economy, which includes the use of waste materials for the production of clean energy with increased efficiency [57] through the use of the novel additive during ensiling. Although the additive is still being developed, the results show that it has a potential for practical application in the ensiling of sugar beet leaves. Compared to commercially available biological additives, the amount of additive used in the present study, relative to the amount of substrate that produced the highest BMP, was high. For example, in Gallegos et al. [58], the recommended additive to substrate ratio (g/g) for a commercially available biological additive was 1:100 but without a significant increase in biomethane yield. This indicates that at least twice the mass of a commercially available additive is required for the additive in the present study to significantly improve the BMP of sugar beet leaves. The biomethane produced from sugar beet leaves can find application as a source of heating and as a feed to gas grid for electricity generation. The digestate after AD has been reported to be a sustainable source of biofertilizer [59].

4. Conclusions

This study showed that sugar beet leaf silage is a potential substrate for biomethane production. The high concentration of water-soluble carbohydrate in the substrate makes ensiling a plausible preservation method for biogas production. The novel Aspergillus and Neurospora species-based additive inhibited yeast activity in the silages and improved the biomethane potential of sugar beet leaves by enhancing the formation of total fermentation products that are precursors to biomethane production. The increased fermentation products in the silages with additives resulted in a higher loss in volatile solids. The biodegradability of the silages with additives was also enhanced by the additive as seen in the higher values of the hydrolysis constants (k1 and k2). The increase in BMP of the silages with additive was between 21 and 45%, depending on the concentration of additive in the silage mixture (g/g). The dual pool kinetic model predicted the methane yield better than the modified Gompertz model and is therefore a more appropriate model for the design and optimisation of process parameters for the production of biomethane from sugar beet leaves.

Author Contributions

Conceptualisation, W.S. and J.U.; methodology, W.S. and J.U.; software, D.G. and J.U.; validation, W.S., J.L. and M.N.; formal analysis, J.U. and D.G.; investigation, J.U.; resources, W.S.; data curation, W.S., M.N. and J.L.; writing—original draft preparation, J.U.; writing—review and editing, J.U., D.G., J.L., M.N. and W.S.; visualisation, J.U.; supervision, M.N. and W.S.; project administration, W.S.; funding acquisition, W.S. All authors have read and agreed to the published version of the manuscript.

Funding

This research was funded by the German federal Ministry of Education and Research, grant number 031B0578A.

Institutional Review Board Statement

Not applicable.

Informed Consent Statement

Not applicable.

Data Availability Statement

Not applicable.

Acknowledgments

The Petroleum Technology Development Fund (PTDF) Nigeria and the German Academic Exchange Service (DAAD) jointly sponsored the PhD program of Jerome Undiandeye under the funding number 57401043. The funding is appreciated. The authors wish to thank Frank Busch for supplying the sugar beet leaves, as well as the laboratory staff of the DBFZ for their technical support.

Conflicts of Interest

The authors declare that the experiments, evaluation of results, and publication were performed without conflict of interest. Senzyme GmbH delivered the additives free of charge without influencing the experiments, results, or evaluation.

References

  1. Tenorio, A.T. Sugar Beet Leaves for Functional Ingredients. Ph.D. Thesis, Wageningen University, Wageningen, The Netherlands, July 2020. [Google Scholar]
  2. Modelska, M.; Binczarski, M.J.; Dziugan, P.; Nowak, S.; Romanowska-Duda, Z.; Sadowski, A.; Witońska, I.A. Potential of Waste Biomass from the Sugar Industry as a Source of Furfural and Its Derivatives for Use as Fuel Additives in Poland. Energies 2020, 13, 6684. [Google Scholar] [CrossRef]
  3. Mordenti, A.L.; Giaretta, E.; Campidonico, L.; Parazza, P.; Formigoni, A. A Review Regarding the Use of Molasses in Animal Nutrition. Animals 2021, 11, 115. [Google Scholar] [CrossRef] [PubMed]
  4. Nagle, N.J.; Donohoe, B.S.; Wolfrum, E.J.; Kuhn, E.M.; Haas, T.J.; Ray, A.E.; Wendt, L.M.; Delwiche, M.E.; Weiss, N.D.; Radtke, C. Chemical and Structural Changes in Corn Stover After Ensiling: Influence on Bioconversion. Front. Bioeng. Biotechnol. 2020, 8, 739. [Google Scholar] [CrossRef] [PubMed]
  5. Nolan, P.; Doyle, E.M.; Grant, J.; O’Kiely, P. Upgrading grass biomass during ensiling with contrasting fibrolytic enzyme additives for enhanced methane production. Renew. Energy 2018, 115, 462–473. [Google Scholar] [CrossRef]
  6. Sun, H.; Cui, X.; Li, R.; Guo, J.; Dong, R. Ensiling process for efficient biogas production from lignocellulosic substrates: Methods, mechanisms, and measures. Bioresour. Technol. 2021, 342, 125928. [Google Scholar] [CrossRef]
  7. Zhao, X.; Liu, J.; Liu, J.; Yang, F.; Zhu, W.; Yuan, X.; Hu, Y.; Cui, Z.; Wang, X. Effect of ensiling and silage additives on biogas production and microbial community dynamics during anaerobic digestion of switchgrass. Bioresour. Technol. 2017, 241, 349–359. [Google Scholar] [CrossRef]
  8. Wu, P.; Li, L.; Jiang, J.; Sun, Y.; Yuan, Z.; Feng, X.; Guo, Y. Effects of fermentative and non-fermentative additives on silage quality and anaerobic digestion performance of Pennisetum purpureum. Bioresour. Technol. 2020, 297, 122425. [Google Scholar] [CrossRef] [PubMed]
  9. Zhao, J.; Tao, X.; Li, J.; Jia, Y.; Shao, T. Enhancement of biomass conservation and enzymatic hydrolysis of rice straw by dilute acid-assisted ensiling pretreatment. Bioresour. Technol. 2021, 320, 124341. [Google Scholar] [CrossRef]
  10. Carvalho, B.F.; Sales, G.F.C.; Schwan, R.F.; Ávila, C.L.S. Criteria for lactic acid bacteria screening to enhance silage quality. J. Appl. Microbiol. 2021, 130, 341–355. [Google Scholar] [CrossRef]
  11. Chaji, M.; Direkvandi, E.; Salem, A.Z.M. Ensiling of Conocarpus erectus tree leaves with molasses, exogenous enzyme and Lactobacillus plantarum impacts on ruminal sheep biogases production and fermentation. Agrofor. Syst. 2020, 94, 1611–1623. [Google Scholar] [CrossRef]
  12. Villa, R.; Rodriguez, L.O.; Fenech, C.; Anika, O.C. Ensiling for anaerobic digestion: A review of key considerations to maximise methane yields. Renew. Sustain. Energy Rev. 2020, 134, 110401. [Google Scholar] [CrossRef]
  13. D’Adamo, I.; Falcone, P.M.; Huisingh, D.; Morone, P. A circular economy model based on biomethane: What are the opportunities for the municipality of Rome and beyond? Renew. Energy 2021, 163, 1660–1672. [Google Scholar] [CrossRef]
  14. Selvaggi, R.; Valenti, F.; Pecorino, B.; Porto, S.M.C. Assessment of Tomato Peels Suitable for Producing Biomethane within the Context of Circular Economy: A GIS-Based Model Analysis. Sustainability 2021, 13, 5559. [Google Scholar] [CrossRef]
  15. Strach, K. Determination of Total Solids (Dry Matter) and Volatile Solids (Organic Dry Matter). In Collection of Methods for Biogas: Methods to Determine Parameters for Analysis Purposes and Parameters that Describe Processes in the Biogas Sector; Liebetrau, J., Ed.; Federal Ministry for Economic Affairs and Energy (BMWi): Berlin, Germany, 2016; pp. 26–27. [Google Scholar]
  16. Weissbach, F.; Strubelt, C. Correcting the dry matter content of grass silages as a substrate for biogas production. Landtechnik 2008, 63, 210–211. [Google Scholar]
  17. Apelt, M. Determination of Aliphatic, Organic Acids and Benzaldehyde with Headspace GC. In Collection of Methods for Biogas: Methods to Determine Parameters for Analysis Purposes and Parameters that Describe Processes in the Biogas Sector; Liebetrau, J., Ed.; Federal Ministry for Economic Affairs and Energy (BMWi): Berlin, Germany, 2016; pp. 35–39. [Google Scholar]
  18. Mühlenberg, J. Determination of Sugars and Glucose Degradation Products. In Collection of Methods for Biogas: Methods to Determine Parameters for Analysis Purposes and Parameters that Describe Processes in the Biogas Sector; Liebetrau, J., Ed.; Federal Ministry for Economic Affairs and Energy (BMWi): Berlin, Germany, 2016; pp. 50–53. [Google Scholar]
  19. van Soest, P.J.; Wine, R.H. Use of Detergents in the Analysis of Fibrous Feeds. IV. Determination of Plant Cell-Wall Constituents. J. Assoc. Off. Anal. Chem. 2020, 50, 50–55. [Google Scholar] [CrossRef]
  20. Dittrich-Zechendorf, M. Determination of total Kjeldahl nitrogen and crude protein. In Collection of Methods for Biogas: Methods to Determine Parameters for Analysis Purposes and Parameters that Describe Processes in the Biogas Sector; Liebetrau, J., Ed.; Federal Ministry for Economic Affairs and Energy (BMWi): Berlin, Germany, 2016; pp. 57–59. [Google Scholar]
  21. Dittrich-Zechendorf, M. Determination of Crude Fibre. In Collection of Methods for Biogas: Methods to Determine Parameters for Analysis Purposes and Parameters that Describe Processes in the Biogas Sector; Liebetrau, J., Ed.; Federal Ministry for Economic Affairs and Energy (BMWi): Berlin, Germany, 2016. [Google Scholar]
  22. Gissén, C.; Prade, T.; Kreuger, E.; Nges, I.A.; Rosenqvist, H.; Svensson, S.-E.; Lantz, M.; Mattsson, J.E.; Börjesson, P.; Björnsson, L. Comparing energy crops for biogas production—Yields, energy input and costs in cultivation using digestate and mineral fertilisation. Biomass Bioenergy 2014, 64, 199–210. [Google Scholar] [CrossRef]
  23. Weiß, K.; Kroschewski, B.; Auerbach, H. Formation of volatile organic compounds during the fermentation of maize as affected by sealing time and silage additive use. Arch. Anim. Nutr. 2020, 74, 150–163. [Google Scholar] [CrossRef] [PubMed]
  24. Franco, R.T.; Bayard, R.; Buffière, P. Mathematical modelling of the ensiling process before biogas production: Strengthening the links between biomass storage and anaerobic digestion. Chem. Eng. J. 2018, 350, 872–882. [Google Scholar] [CrossRef]
  25. Starke, P.; Hoffmann, C.M. Dry matter and sugar content as parameters to assess the quality of sugar beet varieties for anaerobic digestion. Agric./Landwirtsch. 2014, 139, 232–240. [Google Scholar] [CrossRef]
  26. Ge, X.; Chang, C.; Zhang, L.; Cui, S.; Luo, X.; Hu, S.; Qin, Y.; Li, Y. Chapter Five—Conversion of Lignocellulosic Biomass into Platform Chemicals for Biobased Polyurethane Application; Li, Y., Ge, X., Eds.; Elsevier: Amsterdam, The Netherlands, 2018; pp. 161–213. [Google Scholar]
  27. Kiskini, A.; Vissers, A.; Vincken, J.-P.; Gruppen, H.; Wierenga, P.A. Effect of Plant Age on the Quantity and Quality of Proteins Extracted from Sugar Beet (Beta vulgaris L.) Leaves. J. Agric. Food Chem. 2016, 64, 8305–8314. [Google Scholar] [CrossRef]
  28. Kreuger, E.; Nges, I.A.; Björnsson, L. Ensiling of crops for biogas production: Effects on methane yield and total solids determination. Biotechnol Biofuels 2011, 4, 44. [Google Scholar] [CrossRef] [PubMed] [Green Version]
  29. Larsen, S.U.; Hjort-Gregersen, K.; Vazifehkhoran, A.H.; Triolo, J.M. Co-ensiling of straw with sugar beet leaves increases the methane yield from straw. Bioresour. Technol. 2017, 245, 106–115. [Google Scholar] [CrossRef] [PubMed]
  30. Beheary, M.S.; Hassan, R.A.; Ahmed, J.L.; Mosstafa, A. Optimization of In-Vessel Co-Composting of Sugar Beet Agro-Industrial Wastes Through Addition of Cane Vinasse. Glob. J. Environ. Res. 2019, 13, 17–32. [Google Scholar]
  31. Zauner, E.; Küntzel, U. Methane production from ensiled plant material. Biomass 1986, 10, 207–223. [Google Scholar] [CrossRef]
  32. Parawira, W.; Murto, M.; Zvauya, R.; Mattiasson, B. Anaerobic batch digestion of solid potato waste alone and in combination with sugar beet leaves. Renew. Energy 2004, 29, 1811–1823. [Google Scholar] [CrossRef]
  33. Kiskini, A. Sugar Beet Leaves: From Biorefinery to Techno-Functionality. Ph.D. Thesis, Wageningen University, Wageningen, The Netherlands, October 2017. [Google Scholar]
  34. Herrmann, C.; Heiermann, M.; Idler, C. Effects of ensiling, silage additives and storage period on methane formation of biogas crops. Bioresour. Technol. 2011, 102, 5153–5161. [Google Scholar] [CrossRef]
  35. Kung, L.; Shaver, R.D.; Grant, R.J.; Schmidt, R.J. Silage review: Interpretation of chemical, microbial, and organoleptic components of silages. J. Dairy Sci. 2018, 101, 4020–4033. [Google Scholar] [CrossRef] [PubMed]
  36. McEniry, J.; Allen, E.; Murphy, J.D.; O’Kiely, P. Grass for biogas production: The impact of silage fermentation characteristics on methane yield in two contrasting biomethane potential test systems. Renew. Energy 2014, 63, 524–530. [Google Scholar] [CrossRef]
  37. Franco, R.T.; Buffière, P.; Bayard, R. Optimizing storage of a catch crop before biogas production: Impact of ensiling and wilting under unsuitable weather conditions. Biomass Bioenergy 2017, 100, 84–91. [Google Scholar] [CrossRef] [Green Version]
  38. Larsen, S.U.; Ambye-Jensen, M.; Jørgensen, H.; Jørgensen, U. Ensiling of the pulp fraction after biorefining of grass into pulp and protein juice. Ind. Crops Prod. 2019, 139, 111576. [Google Scholar] [CrossRef]
  39. Bai, Y.; Rafiq, M.K.; Li, S.; Degen, A.A.; Mašek, O.; Sun, H.; Han, H.; Wang, T.; Joseph, S.; Bachmann, R.T.; et al. Biochar from pyrolyzed Tibetan Yak dung as a novel additive in ensiling sweet sorghum: An alternate to the hazardous use of Yak dung as a fuel in the home. J. Hazard. Mater. 2021, 403, 123647. [Google Scholar] [CrossRef] [PubMed]
  40. Xu, H.; Sun, L.; Na, N.; Wang, C.; Yin, G.; Liu, S.; Xue, Y. Dynamics of Bacterial Community and Fermentation Quality in Leymus chinensis Silage Treated with Lactic Acid Bacteria and/or Water. Front. Microbiol. 2021, 12, 717120. [Google Scholar] [CrossRef] [PubMed]
  41. Sun, Z.; Jia, T.; Gao, R.; Xu, S.; Wu, Z.; Wang, B.; Yu, Z. Effects of Chopping Length and Additive on the Fermentation Quality and Aerobic Stability in Silage of Leymus chinensis. Processes 2020, 8, 1283. [Google Scholar] [CrossRef]
  42. Wang, C.; Nishino, N. Effects of storage temperature and ensiling period on fermentation products, aerobic stability and microbial communities of total mixed ration silage. J. Appl. Microbiol. 2013, 114, 1687–1695. [Google Scholar] [CrossRef]
  43. Yang, L.; Yuan, X.; Li, J.; Dong, Z.; Shao, T. Dynamics of microbial community and fermentation quality during ensiling of sterile and nonsterile alfalfa with or without Lactobacillus plantarum inoculant. Bioresour. Technol. 2019, 275, 280–287. [Google Scholar] [CrossRef]
  44. Kaewpila, C.; Gunun, P.; Kesorn, P.; Subepang, S.; Thip-uten, S.; Cai, Y.; Pholsen, S.; Cherdthong, A.; Khota, W. Improving ensiling characteristics by adding lactic acid bacteria modifies in vitro digestibility and methane production of forage-sorghum mixture silage. Sci. Rep. 2021, 11, 1968. [Google Scholar] [CrossRef]
  45. Gallegos, D.; Wedwitschka, H.; Moeller, L.; Weinrich, S.; Zehnsdorf, A.; Nelles, M.; Stinner, W. Mixed silage of Elodea and wheat straw as a substrate for energy production in anaerobic digestion plants. Energy Sustain. Soc. 2018, 8, 110. [Google Scholar] [CrossRef]
  46. Guo, L.; Lu, Y.; Li, P.; Chen, L.; Gou, W.; Zhang, C. Effects of Delayed Harvest and Additives on Fermentation Quality and Bacterial Community of Corn Stalk Silage. Front. Microbiol. 2021, 12, 687481. [Google Scholar] [CrossRef]
  47. Li, P.; Tang, X.; Liao, C.; Li, M.; Chen, L.; Lu, G.; Huang, X.; Chen, C.; Gou, W. Effects of Additives on Silage Fermentation Characteristic and In Vitro Digestibility of Perennial Oat at Different Maturity Stages on the Qinghai Tibetan. Microorganisms 2021, 9, 2403. [Google Scholar] [CrossRef]
  48. Weide, T.; Baquero, C.D.; Schomaker, M.; Brügging, E.; Wetter, C. Effects of enzyme addition on biogas and methane yields in the batch anaerobic digestion of agricultural waste (silage, straw, and animal manure). Biomass Bioenergy 2020, 132, 105442. [Google Scholar] [CrossRef]
  49. Verein Deutscher Ingenieure. VDI 4630 Fermentation of Organic Materials—Characteristics of the Substrates, Sampling, Collection of Material Data, fermentation Tests; Beuth Verlag: Berlin, Germany, 2016. [Google Scholar]
  50. Pakarinen, O.; Lehtomäki, A.; Rissanen, S.; Rintala, J. Storing energy crops for methane production: Effects of solids content and biological additive. Bioresour. Technol. 2008, 99, 7074–7082. [Google Scholar] [CrossRef] [PubMed]
  51. Kupryś-Caruk, M.; Choińska, R.; Dekowska, A.; Piasecka-Jóźwiak, K. Silage quality and biogas production from Spartina pectinata L. fermented with a novel xylan-degrading strain of Lactobacillus buchneri M B/00077. Sci. Rep. 2021, 11, 13175. [Google Scholar] [CrossRef] [PubMed]
  52. Janke, L.; McCabe, B.K.; Harris, P.; Hill, A.; Lee, S.; Weinrich, S.; Marchuk, S.; Baillie, C. Ensiling fermentation reveals pre-treatment effects for anaerobic digestion of sugarcane biomass: An assessment of ensiling additives on methane potential. Bioresour. Technol. 2019, 279, 398–403. [Google Scholar] [CrossRef]
  53. Brulé, M.; Oechsner, H.; Jungbluth, T. Exponential model describing methane production kinetics in batch anaerobic digestion: A tool for evaluation of biochemical methane potential assays. Bioprocess Biosyst. Eng. 2014, 37, 1759–1770. [Google Scholar] [CrossRef] [PubMed]
  54. Yang, H.; Deng, L.; Liu, G.; Di Yang Liu, Y.; Chen, Z. A model for methane production in anaerobic digestion of swine wastewater. Water Res. 2016, 102, 464–474. [Google Scholar] [CrossRef]
  55. Song, L.; Li, D.; Cao, X.; Tang, Y.; Liu, R.; Niu, Q.; Li, Y.-Y. Optimizing biomethane production of mesophilic chicken manure and sheep manure digestion: Mono-digestion and co-digestion kinetic investigation, autofluorescence analysis and microbial community assessment. J. Environ. Manag. 2019, 237, 103–113. [Google Scholar] [CrossRef] [PubMed]
  56. Mao, C.; Zhang, T.; Wang, X.; Feng, Y.; Ren, G.; Yang, G. Process performance and methane production optimizing of anaerobic co-digestion of swine manure and corn straw. Sci. Rep. 2017, 7, 9379. [Google Scholar] [CrossRef] [Green Version]
  57. Rocchi, L.; Paolotti, L.; Cortina, C.; Fagioli, F.F.; Boggia, A. Measuring circularity: An application of modified Material Circularity Indicator to agricultural systems. Agric. Food Econ. 2021, 9, 9. [Google Scholar] [CrossRef]
  58. Gallegos, D.; Wedwitschka, H.; Moeller, L.; Zehnsdorf, A.; Stinner, W. Effect of particle size reduction and ensiling fermentation on biogas formation and silage quality of wheat straw. Bioresour. Technol. 2017, 245, 216–224. [Google Scholar] [CrossRef]
  59. Akbar, S.; Ahmed, S.; Khan, S.; Badshah, M. Anaerobic Digestate: A Sustainable Source of Bio-fertilizer. In Sustainable Intensification for Agroecosystem Services and Management; Jhariya, M.K., Banerjee, A., Meena, R.S., Kumar, S., Raj, A., Eds.; Springer: Singapore, 2021; pp. 493–542. [Google Scholar]
Figure 1. Daily methane production rate of the silages. Error bars indicate standard deviation.
Applsci 12 02684 g001
Figure 2. Cumulative biomethane potential of silages (error bars indicate standard deviation).
Applsci 12 02684 g002
Figure 3. Experimental data and model simulation of cumulative biomethane potential of the silages using the dual pool kinetic model (a) and the modified Gompertz model (b).
Applsci 12 02684 g003
Table 1. Physicochemical parameters (±standard deviation) of sugar beet leaves with and without additive before ensiling.
Substrates
ParametersCTLA:50B:150C:500
TS (%FM)14.06 ± 0.2315.82 ± 0.1114.79 ± 0.0914.73 ± 0.23
VS (%TS)79.08 ± 0.3479.99 ± 0.2179.03 ± 0.2277.84 ± 0.14
Acetic acid (g/L)3.2 ± 0.02n.d.n.d.n.d.
Lactic acid (g/L)7.03 ± 0.03n.d.n.d.n.d.
Butyric acid (g/L)<0.01n.d.n.d.n.d.
NH4N (g/L)0.004n.d.n.d.n.d.
Hemicellulose (%TS)10.78 ± 0.21n.d.n.d.n.d.
Cellulose (%TS)14.37 ± 0.33n.d.n.d.n.d.
Lignin (%TS)5.36 ± 0.06n.d.n.d.n.d.
Crude protein (%TS)17.54 ± 0.01n.d.n.d.n.d.
Crude fibre (%TS)11.37 ± 0.07n.d.n.d.n.d.
WSC (g/l)75.36 ± 0.13n.d.n.d.n.d.
Carbon (%TS)37.5 ± 0.31n.d.n.d.n.d.
Nitrogen (%TS)2.93 ± 0.03n.d.n.d.n.d.
Carbon/nitrogen12.80 ± 0.22n.d.n.d.n.d.
Ash (%TS)20.92 ± 0.6620.01 ± 0.2920.97 ± 0.3822.16 ± 0.35
pH4.98 ± 0.02n.d.n.d.n.d.
FM, fresh matter; TS, total solids; VS, volatile solids; CTL, control; NH4N, ammonium nitrogen; WSC, water soluble carbohydrate; A50:1, mixture of 1 g of additive and 50 g of sugar beet leaves; B150:1, mixture of 1 g of additive and 150 g of sugar beet leaves; C500:1, mixture of 1 g of additive and 500 g of sugar beet leaves. n.d, not determined.
Table 2. Effect of additive on fermentation quality of sugar beet leaves silages.
ItemSilageStorage Period (Days)SEMp-Value
0306090120370SIS × I
TSCTL14.06 aA13.51 aAB13.64 aABC13.56 aABC13.12 aBC12.98 aC0.794.66 × 10−138.59 × 10−100.0343
A50:115.82 bA15.61 bAB15.19 bAB14.92 bB13.96 bC13.80 bC
B150:114.79 cA14.58 cAB14.41 cBC14.24 cC13.50 abD13.07 aC
C500:114.73 cA14.52 cA14.16 cAB14.19 cAB13.64 abBC13.16 aC
VSCTL79.08 aA78.93 aA78.34 acA77.98 aA76.12 aA77.13 aA1.401.93 × 10−120.65920.0696
A50:179.99 bA80.17 bA79.31 bA79.44 bA77.31 aB76.69 aB
B150:179.02 aA78.87 aA78.61 aA78.46 abA77.0 aB75.80 bC
C500:177.84 cA78.20 aA78.01 cA77.47 aAB76.67 aB74.91 cC
pHCTL4.945.12 aA4.65 aB4.63 aB4.57 aB4.50 aC0.170.7240.1250.304
A50:1n.d4.72 bA4.57 bB4.55 aB4.51 bB4.46 aC
B150:1n.d4.81 cA4.61 abB4.63 aB4.56 abB4.47 aA
C500:1n.d4.86 dA4.58 bB4.59 aB4.63 aB4.48 aC
LACTL0.700.94 aA1.19 aB1.42 aC1.66 aD7.07 aE0.033<2 × 10−160.111450.00364
A50:1n.d1.07 aAB1.06 bB1.78 bC1.33 bA14.04 bD
B150:1n.d1.06 aA1.21 aA1.49 aA1.19 bA13.77 cB
C500:1n.d1.06 aA1.24 aAB1.51 aBC1.75 aC8.12 bD
AACTL0.320.36 acA0.30 aB0.38 aA0.36 aA2.86 aC0.0122.1 × 10−102.42 × 10−51.37 × 10−6
A50:1n.d0.41 bA0.39 bA0.50 bB0.47 bB9.73 bC
B150:1n.d0.35 aA0.36 bcA0.44 cB0.39 aC8.33 cD
C500:1n.d0.38 cA0.35 cA0.44 cA0.42 cA6.97 dB
PACTL0.000.20 aA0.000.000.000.91 aB0.0211.07 × 10−80.004475.97 × 10−8
A50:1n.d0.26 bA0.000.000.000.61 bB
B150:1n.d0.14 c0.000.000.000.00
C500:1n.d0.13 c0.000.000.000.00
EthCTL0.080.09 aA0.09 aA0.12 aA0.17 aB2.38 aC0.101.89 × 10−80.6870.259
A50:1n.d0.08 abA0.08 bA0.12 aA0.56 bB0.06 bA
B150:1n.d0.08 bA0.07 bA0.10 bB0.21 aC0.17 bD
C500:1n.d0.08 abA0.09 aA0.11 aAB0.27 aB4.72 cC
TFPCTL1.101.59 aA1.59 abA1.92 aB2.19 aC13.22 aD0.999<0.01<0.01<0.01
A50:1n.d1.83 bA1.93 aB2.39 bC2.55 aC24.43 bD
B150:1n.d1.63 abA1.64 bA2.02 aA2.15 bA22.28 cB
C500:1n.d1.65 abA1.68 bA2.06 aAB2.44 aB19.81 dC
CTL, control (silage without additive); A50:1, B150:1, and C500:1, mixture of 1 g of additive and 50 g, 150 g, and 500 g of sugar beet leaves, respectively; TS, total solid (%FM); VS, volatile solids (%TS); LA, lactic acid (g/L); AA, acetic acid (g/L); PA, propionic acid (g/L); Eth, ethanol (g/L); TFP, total fermentation products (g/L); S, effect of storage period; I, effect of inoculant; S × I, interaction effect between storage period and inoculant. aA−dD Means with different lower-case letters show significant difference among silages with different dosages of additives at the same ensiling time, whereas means with different upper-case letters show significant differences between ensiling times with the same dosage (p < 0.05). SEM, standard error of means.
Table 3. Effect of different biological additives on the BMP of different silages.
Silage% of BMP
Increase
Name of
Additive
Duration of
Ensiling (Days)
References
Switch grass13.08L. brevis30[7]
MaizeNegligibleL. plantarum90[34]
Grass10.34homo LAB110[50]
Sorghum13.64Biochar90[39]
Grass20L. buchneri90[51]
Sugarcane trash71.1Mol + LAB70[52]
Sugar beet leaves45(see M&M)370This study
M&M, materials and methods; Mol, molasses; LAB, lactic acid bacteria.
Table 4. Kinetic data and criteria for selection of best fit model.
Silages
Equation ParametersControlA50:1B150:1C500:1
Dual Pool Kinetic Model
G0 (mL/gVS)351.044531.083457.115454.658
α0.5800.8510.7480.681
k1(/day)0.2440.3590.3260.319
k2(/day)0.0130.0490.0210.032
R20.98890.98320.98210.9874
RMSE13.5454.3854.2426.713
BIC159.09896.10294.248119.953
AIC153.93690.77388.919114.624
Teff8141414
Modified Gompertz Model
G0 (mL/gVS)343.564484.466413.286403.674
Rmax (mL/gVS)74.28683.27379.00568.277
λ(days)0.2350.000.000.00
R20.96290.97020.96330.9652
RMSE14.33233.95630.30429.376
BIC159.264207.401201.028199.286
AIC155.102203.404197.032195.289
Teff6777
G0, ultimate methane yield (mL/gVS); α, fraction of fast degrading material; k1, first-order degradation constant of fast degrading component (1/day); k2, first-order degradation constant of slow-degrading component (1/day); Rmax, maximum rate of methane production (mL/gVS. days); λ, lag phase (days); Teff, the effective biomethane production time; R2, coefficient of determination; RMSE, root mean square error; BIC, Bayesian information criterion; AIC, Akaike information criterion; CTL, control; A50:1: mixture of 1 g of additive and 50 g of sugar beet leaves; B150: mixture of 1 g of additive and 150 g of sugar beet leaves; C500:1: mixture of 1 g of additive and 500 g of sugar beet leaves.
Publisher’s Note: MDPI stays neutral with regard to jurisdictional claims in published maps and institutional affiliations.

