Article

The Peripheral Kynurenine Pathway and Psychosomatic Comorbidity in Subjects with Morbid Obesity Undergoing Bariatric Surgery

1
Department of Research, Innlandet Hospital Trust, PB 104, N-2381 Brumunddal, Norway
2
Department of Clinical and Molecular Medicine, Faculty of Medicine and Health Sciences, Norwegian University of Science and Technology, N-7491 Trondheim, Norway
3
Department of Health and Nursing Science, Faculty of Health and Social Sciences, Inland Norway University of Applied Sciences, N-2418 Elverum, Norway
*
Author to whom correspondence should be addressed.
Appl. Sci. 2022, 12(5), 2648; https://doi.org/10.3390/app12052648
Submission received: 20 December 2021 / Revised: 23 February 2022 / Accepted: 2 March 2022 / Published: 4 March 2022

Abstract

:
Background: The Kynurenine pathway (KP) is involved in various disorders, but little is known about the KP and psychosomatic complaints. The aim was to study the peripheral KP and psychosomatic comorbidity in subjects with morbid obesity. Methods: Psychosomatic comorbidity (perceived general health, muscle-skeletal pain, well-being, mood disorders, fatigue, self-esteem, sleepiness, and sense of humour) was registered, and serum samples were collected six months before and after bariatric surgery. Results: A total of 141 subjects (men/women, 116/25) with a mean age of 43.0 (SD 8.7) years and BMI of 42.1 (SD 3.8) kg/m2 were included. No significant associations were seen between the psychosomatic disorders and the KP. There was a significant downregulation of all KP metabolites after surgery, a reduction in CRP, and strong associations between CRP and the KP, particularly with the ratios of Kynurenine/Tryptophan and Quinolinic acid (QA)/Xanthurenic acid (XA). The QA/XA ratio was negatively associated with diabetes. Conclusions: The peripheral KP seemed to be of minor importance for the psychosomatic comorbidity in subjects with morbid obesity. The downregulation of all KP metabolites after bariatric surgery indicated reduced inflammation. The QA/XA ratio seemed to be a marker of insulin sensitivity and favourable glucose control.

1. Introduction

The metabolism of Tryptophan (Trypt) through the Kynurenine pathway (KP) is complex and is involved in immunological and inflammatory disorders, psychiatric illness, cognition, pain, metabolic and endocrine diseases, exercise, and others [1,2,3,4]. These disorders often occur together and have shared biological characteristics, such as low-grade chronic inflammation and dysregulation of the KP [4,5,6,7,8,9,10,11].
Monitoring the KP has not been standardised. Both concentrations of the metabolites and ratios between the concentrations have been reported [12]. The ratios measure the enzyme activity and sometimes reflect the metabolites’ functions more precisely than the concentrations.
Figure 1 shows an overview of the Trypt–Kynurenine (Kyn) metabolism with the metabolites and the five enzymes of relevance for this paper [10]:
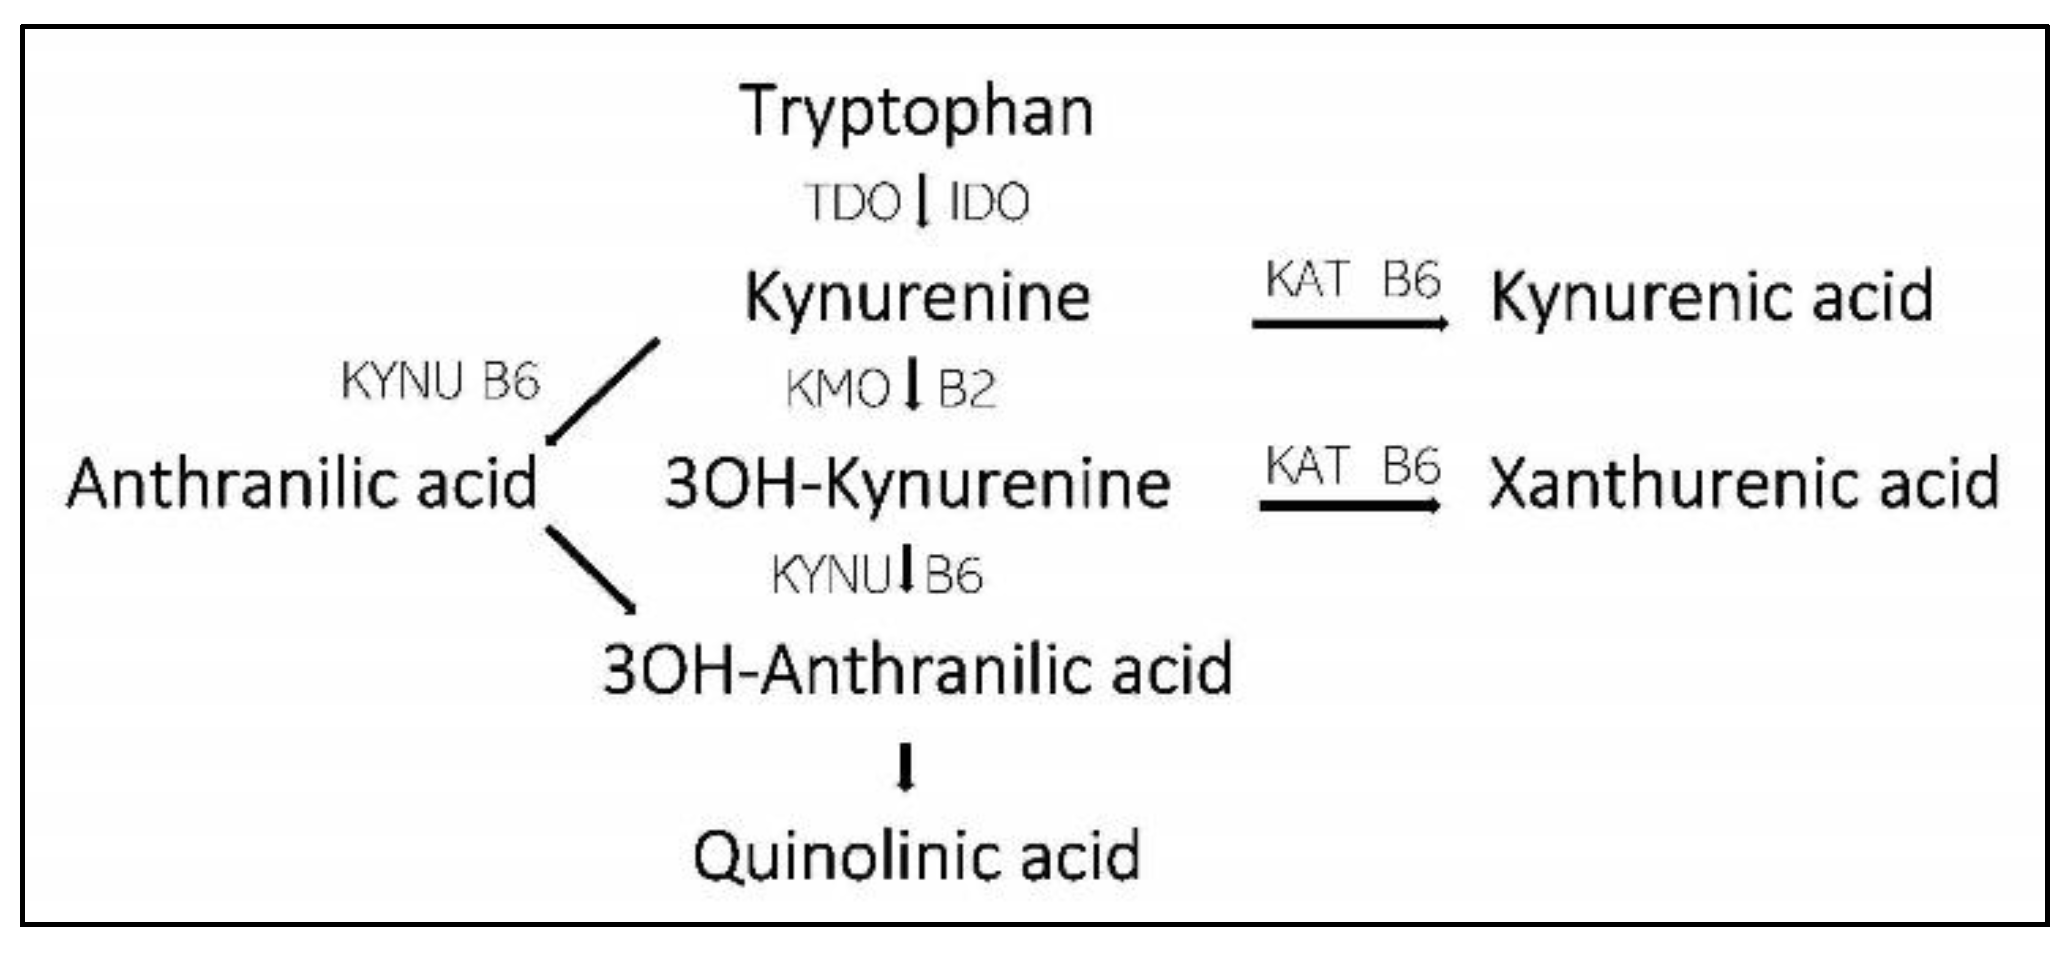
  • Tryptophan 2,3-dioxygenase (TDO) and indoleamine 2,3 dioxygenase (IDO) regulate the Trypt to Kyn step.
  • Kynurenine aminotransferase (KAT) regulate the steps from Kyn to Kynurenine acid (KA) and 3OH-Kyn to Xanthurenic acid (XA).
  • Kynureninase (KYNU) and kynurenine 3-monooxygenase (KMO) are involved in the steps from Kyn to Quinolinic acid (QA).
Vitamin B6 (pyridoxal 5-phosphate) is an essential cofactor for KAT, KMO, and KYNU. The enzymatic activity is continuously influenced by hormones, oxidative and antioxidative processes, inflammation, and other biosystems [10,12].
The effects of the KP metabolites and ratios are only partly understood. Inflammation shunts the Trypt metabolism from serotonin towards Kyn and increases the Kyn/Trypt ratio [1]. Muscular exercise shifts the Kyn metabolism towards the production of KA and increases the KA/Kyn ratio [3]. KA is neuroprotective and anti-inflammatory; QA is a proinflammatory neurotoxic mediator in the brain; and the KA/QA ratio has been considered neuroprotective [1,13,14]. KA and XA are structurally related and involved in the dopamine regulation in the brain. An imbalance in the KA/XA ratio may result in mood disorders [15]. Elevated levels of KA and XA have been reported in subjects with diabetes mellitus (DM), and both have been ascribed diabetogenic effects by inhibiting proinsulin and insulin synthesis [2,8]. QA reduces serum glucose, and the QA/XA ratio has been positively associated with good insulin sensitivity and glucose control [2,8].
The KP has been thoroughly studied in subjects with psychiatric illness, such as anxiety, depression, suicide, psychosis, schizophrenia, and cognitive deficits. [1,3,4,16,17]. The importance of the KP for less severe, everyday psychosomatic complaints is scarcely evaluated. Some studies have shown disturbed KP in subjects with chronic fatigue syndrome and fibromyalgia [11,18]. Subjects with morbid obesity have an upregulated KP that normalises after bariatric surgery and a high prevalence of metabolic and psychosomatic comorbidity, making them suitable for research of bio–psycho–social interactions. [7,8,10]. The disturbed KP in subjects with obesity is expected to be associated with common psychosomatic comorbidities, such as perceived general health, muscle-skeletal pain, well-being, mood disorders, fatigue, self-esteem, sleepiness, and sense of humour. However, to our knowledge, no such studies have been performed.
Thus, the paramount aim was to study the peripheral KP and psychosomatic comorbidity in subjects with morbid obesity undergoing bariatric surgery. Specific aims: (1) Explore associations between the KP and psychosomatic complaints; (2) Study changes in the KP from six months before to six months after bariatric surgery; (3) Explore predictors of the KP.

2. Materials and Methods

2.1. Data Materials and Study Design

This retrospective cohort study used data from the prospective cohort study “Morbid Obesity—Bio-Psycho-Social disorders” (the MO-BiPS study). The first part of the cohort study was a six-month period before bariatric surgery with conservative treatment. The second part was a six-month follow-up period after bariatric surgery. This study used data from inclusion six months before surgery and the follow-up visit six months after surgery. Previous publications have reported the study population and the psychosomatic disorders in different contexts [19,20,21].

2.2. Participants and Inclusion Criteria

The study was performed at the obesity unit, Innlandet Hospital Trust, Gjøvik, Norway. Subjects 18–65 years of age with morbid obesity (defined as BMI > 40 kg/m2 or >35 kg/m2 with obesity-related complications) referred for the evaluation of bariatric surgery, were invited. In this pragmatic study, subjects judged by the surgeons as unfit for bariatric surgery, e.g., subjects with organic gastrointestinal disorders, previous major gastrointestinal surgery, alcohol and drug abuse, major psychiatric disorders, and severe not-obesity-related somatic disorders, were excluded. No strict exclusion criteria were used.

2.3. Interventions

At the first visit, the medical history was noted, a physical examination was performed, blood samples were taken, and self-reported biopsychosocial disorders were collected on validated questionnaires. During the first part, there were regular individual and group meetings with nurses, doctors, nutritionists, and psychologists about lifestyle and dietary interventions, motivation for weight loss, and information about surgical treatment. The subjects followed a strict “crispbread diet” or a meal replacement powder diet containing 3765 kJ/day the last three weeks before surgery. In addition, beverages without calories and vegetables (except sweet corn, olives, and avocados) were allowed ad libitum, giving a maximum daily energy intake of 4200 kJ/day. More details are given in previous papers [19,21]. Bariatric surgery was performed as Roux-en-Y gastric bypass or Gastric sleeve at the doctors’ discretion [22,23]. The procedures at the first visit were repeated six months after surgery.

2.4. Variables

Age, gender, ethnicity, and social factors were registered only at visit 1; other variables were collected at both visits.
  • Demographic and anthropometric data: age (years), gender (male/female), height (m), body weight (kg), body mass index (BMI: kg/m2), and ethnicity.
  • Social factors: cohabitation (yes/no), employed (yes/no), and smoking (daily/not daily).
  • The physical activity score was the sum of two scores: easy activity (not sweaty/breathless): none; <1 h/week, 1–2 h/week, and >3 h/week (scores 0–3); and strenuous activity (sweaty/breathless): none, <1 h/week, 1–2 h/week, and >3 h/week (scores 0, 3, 4, and 5). The sum score for physical activity was 0–8.
  • General health: Bad (0), Not quite good (1), Good (2), and Very good (3), score 0–3.
  • Comorbidities: 12 current or previous disorders were noted (yes/no), score 0–12.
  • Musculoskeletal pain from six parts of the body: none (0), mild (1), and severe (2), score 0–12.
  • The World Health Organization—Five Well-Being Index (WHO-5) (scores 0–100, scores ≤ 50 indicate low mood, and scores ≤ 28 indicate likely depression) [24].
  • Hopkins Symptom Checklist 10 measures psychological distress (scores 1–4, scores ≥ 1.85 indicate mental distress) [25].
  • Fatigue Severity Scale: a validated Norwegian translation of the Fatigue Severity Scale was used (scores 1–7; scores ≥ 4 indicate further evaluation) [26].
  • Rosenberg Self-Esteem Scale: a validated Norwegian translation of the international questionnaire was used (scores 0–30, values < 15 indicate low self-esteem) [27,28].
  • Epworth Sleepiness Scale: a validated Norwegian translation was used (scores 0–24; normal 0–10, mild 11–14, moderate 15–18, and severe 19–25) [29].
  • Sense of Humour Questionnaire: a Norwegian version of the short form SHQ-6: “Attitudes towards humour” was used (scores 6–24) [30].

2.5. The Kynurenine Pathway

Trypt, Kyn, KA, QA, and XA were quantified in serum. Protein precipitation of 20 µL human plasma after adding 20 µL internal standard solution (one deuterated substance for each of the analytes) was performed using 60 µL 50% (w/v) trichloroacetic acid (TCA) in water. After thorough mixing (8 min) and centrifugation (15 min, 4000 g at 20 °C), an aliquot of 5 µL was injected from the supernatant into the high-performance liquid chromatography (HPLC) system. HPLC was performed with an Agilent 1260 Infinity liquid chromatograph (Agilent Technologies, Palo Alto, CA, USA) with an Agilent 6460 Triple Quad LC/MS detector. Tryptophan and the metabolites were separated on a 3.0 mm × 100 mm, 2.6 µm, EVO C18 reversed phase column from Phenomenex (Phenomenex Inc., Torrance, CA, USA). The column temperature was 40 °C, and the gradient was 100% 0.1% formic acid in water to 100% 0.1% formic acid in acetonitrile. A seven-point calibration curve was created for each analyte for quantification of Trypt and the metabolites in test samples and control samples. VITAS AS, Oslo, Norway, performed the KP analyses.

2.6. Statistics

The results are given as mean (SD) and number (proportion in percentage). Paired t-test was used for the comparisons between inclusion and the follow-up visit. The associations between the KP (dependent variables) and covariates, and between the psychosomatic disorders (dependent variables) and the KP metabolites were analysed with mixed model linear regression for repeated measurements and reported with 95% confidence intervals and p-values. IBM SPSS Statistics for Windows, version 27.0 IBM Corp: Armonk, NY, USA, was used for the analyses. The p-values in the associations between the KP and dependent variables (in total 90 p-values), and between the psychosomatic disorders and the KP metabolites (80 p-values) were adjusted for multiple testing ad modum Benjamini–Hochberg in R-studio v 1.4.1106 and reported as q-values. p- and q-values < 0.05 were judged as statistically significant. Only q-values < 0.10 were reported.

3. Results

3.1. Participants

Out of 159 subjects included in the study, 7 were excluded because of comorbidity not related to obesity (e.g., major depression and somatic disorders), 8 for missing or inadequately filled-in questionnaires, and 3 for lack of serum for the KP analyses. In all, 141 subjects (women/men, 116/25) with a mean BMI of 42.1 (3.8) kg/m2 were included in the analyses at visit 1. A total of 113 subjects underwent surgery; 91 (81%) had gastric bypass, and 22 (19%) gastric sleeve. Ninety-five had a follow up with blood samples six months after surgery and were included in the analyses. Table 1 gives the participants’ characteristics at inclusion and six months after surgery.
The responses to the psychosomatic questionnaires were incomplete. The numbers of respondents to the various psychosomatic variables at visits 1 and 2 were 137–141 and 71–74, respectively. All psychosomatic disorders improved from inclusion to six months after surgery; the changes were statistically significant for all variables, except for somatic disorders and sense of humour. Table 1 gives the details.

3.2. The Kynurenine Pathway

All the KP metabolites and relevant ratios between the metabolites were highly significantly reduced after surgery (Table 1).
The analyses of predictors of the KP showed significant associations between CRP and the Kyn/Trypt and QA/XA ratios also after correction for multiple testing. In addition, DM and age were significantly associated with several KP metabolites. Table 2 gives all predictors of the KP.

3.3. The Psychosomatic Disorders

There were no significant associations between the psychosomatic disorders and the KP, except for two marginally significant p-values unadjusted for multiple testing. Table 3 gives all details.

4. Discussion

The main finding was the lack of clear associations between the KP and psychosomatic disorders, which was unexpected (Table 3). Most reviews and studies pinpoint the importance of the KP for mental health and psychological disorders [1,3,4,15,16,17]. As seen in this study, the burden of psychosomatic comorbidity in subjects with morbid obesity is not insignificant. It was, therefore, expected to find associations between the psychosomatic disorders and the KP. Some studies have shown associations between KP and fibromyalgia and chronic fatigue [11,18]. In this study, neither fatigue nor muscle-skeletal pain (fibromyalgia-like symptoms) were associated with the KP. Daytime sleepiness is a frequent disorder in subjects with depression, and the sleepiness scores before surgery were nearly as high as in subjects with depression [31]. The slight negative association between KY/QA and sleepiness in this study, the same association as has been reported between KY/QA and depression, indicates that sleepiness and depression are related disorders [32]. The favourable effects of the KA/Kyn ratio reported in other studies might be reflected in the tendency to associate with improved self-esteem in this study [11].
One explanation for the lack of clear associations between the KP and psychosomatic disorders could be that the psychosomatic disorders were, nevertheless, not severe. Subjects with severe anxiety, depression, or other psychiatric disorders in need of treatment, were excluded from the study and offered other treatment. Another explanation is that the pronounced metabolic disorders in subjects with morbid obesity, which affects the KP, might have obscured the associations between KP and the psychosomatic disorders. The third explanation could be poor correlation between KP in serum and the cerebrospinal fluid. Trypt and Kyn easily pass the blood–brain barrier, and 60–80% of Kyn in the brain is of exogenous origin [1,33]. In contrast, KA and QA hardly cross the blood–brain barrier, and the values in serum might be invalid markers of psychosomatic disorders [34]. Measures of the KP in cerebrospinal fluid could have given other results. In all, the study indicates that the peripheral KP is of minor importance for the psychosomatic comorbidity in subjects with obesity.
All KP metabolites and their ratios were reduced after bariatric surgery. Other studies have reported these findings in subjects with obesity undergoing surgery with the same surgical methods [8,10]. The downregulation from high to normal values has been judged as favourable and interpreted as reduced inflammation. The interpretation is confirmed by the reduction in CRP and positive associations between CRP and the KP metabolites, particularly with the Kyn/Tryp ratio, a known marker of inflammation [1,2,3]. The metabolic improvements are, however, not accompanied by a reduction in the adipose tissue inflammation [35]. High values of the KP metabolites, especially Kyn, KA, and XA, have been reported in subjects with DM type II and are potential tools for evaluating cardiovascular risk [2]. After surgery, the reduced KA/Kyn and KA/QA ratios could indicate reduced exercise and reduced neuroprotection, respectively, which did not fit the improved physical activity and mental health [1,3,13,14]. The reduced QA/XA ratio after surgery was not compatible with the improved glucose tolerance measured as reduced HbA1c and s-glucose after surgery [2,8]. The results reveal the uncertain relations between clinical disorders and the KP metabolites.
There were several significant associations between the KP and variables assumed to interfere with the KP (Table 2). After adjusting for multiple testing, one of the statistically significant findings was the positive association between the Kyn/Trypt ratio and CRP, also seen in another study [8]. Inflammation is upregulated in subjects with obesity, and the Kyn/Trypt ratio is a well-known marker of inflammation [1,2,3,5,7,10]. Another significant finding was the positive association between CRP and QA/XA ratio after adjusting for DM and other variables. QA is a proinflammatory neurotoxin in the brain and might also have peripheral inflammatory functions [13]. The QA/XA ratio could be a marker of inflammation. The negative association between the QA/XA ratio and DM is in accordance with the assumption that QA/XA is a biomarker of healthy glucose metabolism [2,8]. DM was associated with several steps in the KP and supports the statement by Kiluk et al. that “KP appears to be one of the important factors regulating the mechanisms involved in the development of type II DM in the prediabetic state” [2]. The negative association between DM and the Kyn/Trypt ratio after adjusting for CRP and age is difficult to explain.
Other significant predictors of the KP in this study should be cautiously interpreted. Age was associated with a trend of an increase in the KP metabolites. An increase in inflammation (e.g., CRP) with age is well known and explains the positive association between age and the K/T ratio [36]. Vitamin B6, an essential cofactor for three of the enzymes in the KP, was not associated with the KP. An adequate nutrient status at inclusion and vitamin supplement after surgery probably prevented crucial vitamin B6 deficiency. The findings in a population-based survey that KA was higher in subjects with moderate than low psychical activity and that smoking was associated with low levels of all KP metabolites were not confirmed in this study [37]. In this study, the physical exercise was modest and likely insufficient for significant effects on the KP. A possible reduction in QA was seen in smokers. In the adjusted analyses, neither gender nor BMI were associated with the KP.

Strengths and Limitations

The study included consecutive subjects from the general population referred for evaluation of bariatric surgery. The study population with a mean age of 43 years, a female predominance (82%), and a BMI reduction of 11 kg/m2 seemed to be representative of subjects undergoing bariatric surgery [38]. There is no consensus for the handling of subjects undergoing bariatric surgery. In this study, the interventions were performed according to international recommendations. There was a conservative lifestyle intervention for six months and an energy-restricted diet in the last weeks before surgery. Surgery was performed with accepted methods, and there was a follow-up six months after surgery [39,40]. The psychosomatic symptoms were registered with validated questionnaires. Because the data were collected six months before and not immediately before surgery, the observed changes were the results of combined conservative and surgical treatment. The follow-up period of six months might have been too short for complete stabilisation after surgery. The gender distribution was skewed in favour of females, which is common, but it reduces external validity [38]. The downregulation of the KP metabolites after surgery was judged as normalisation, but reference values for non-obese subjects with the same method for comparison with this slightly overweight/obese group six months after surgery were not available. The accordance with other studies regarding downregulation of the KP after surgery indirectly substantiates the other findings, e.g., the overall negative associations between the KP and psychosomatic disorders. The KP in the cerebrospinal fluid might reflect the psychosomatic symptoms better than the KP in blood. The mixed model linear regression analyses allowed using data from all subjects and not only from subjects with complete data sets. The high risk of type I errors because of multiple testing was counteracted by adjusting for multiple testing ad modum Benjamini–Hochberg. The relatively small sample size increased the possibility of type II errors.

5. Conclusions

Considering the comprehensive literature about the KP and psychiatric health, the lack of clear and significant associations with psychosomatic disorders was unexpected. An important finding was the significant downregulation of all KP metabolites after surgery, indicating reduced inflammation. This interpretation was confirmed by a significant reduction in CRP and the strong associations between CRP and the KP. After adjusting for multiple testing, the associations between CRP and the ratios Kyn/Typt and QA/XA were statistically significant. The results confirm Kyn/Trypt, and probably QA/XA, as markers of inflammation. DM was associated with several of the KP metabolites. The negative association with the QA/XA ratio confirms the ratio as a marker of insulin sensitivity and favourable glucose control. Age was associated with several KP metabolites, particularly with the Typt/Kyn ratio, indicating increased inflammation with age.

Author Contributions

Conceptualisation, P.G.F. and K.H.; methodology, P.G.F.; validation, P.G.F.; formal analysis, P.G.F.; investigation, P.G.F. and K.H.; resources, P.G.F. and K.H.; data curation, P.G.F.; writing—original draft preparation, P.G.F.; writing—review and editing, P.G.F. and K.H.; visualisation, P.G.F.; supervision, P.G.F.; project administration, P.G.F.; funding acquisition, P.G.F. All authors have read and agreed to the published version of the manuscript.

Funding

This research was funded by Innlandet Hospital Trust, Brumunddal, Norway.

Institutional Review Board Statement

The study was conducted according to the guidelines of the Declaration of Helsinki and approved by the Norwegian Regional Committees for Medical and Health Research Ethics, PB 1130, Blindern, 0318 Oslo, Norway (reference number 2012/966).

Informed Consent Statement

Informed consent was obtained from all subjects involved in the study.

Data Availability Statement

The raw data sets generated and analysed during the current study are not publicly available in order to protect participant confidentiality. Case report forms (CRFs) on paper are safely stored. The data were transferred to SPSS for statistical analyses, and the data files are stored by Innlandet Hospital Trust, Brumunddal, Norway, on a server dedicated to research. The security follows the rules given by The Norwegian Data Protection Authority, P.O. Box 8177 Dep. NO-0034 Oslo, Norway. The data are available on request to the authors.

Conflicts of Interest

The authors declare no conflict of interest.

References

  1. Savitz, J. The kynurenine pathway: A finger in every pie. Mol. Psychiatry 2020, 25, 131–147. [Google Scholar] [CrossRef] [PubMed]
  2. Kiluk, M.; Lewkowicz, J.; Pawlak, D.; Tankiewicz-Kwedlo, A. Crosstalk between Tryptophan Metabolism via Kynurenine Pathway and Carbohydrate Metabolism in the Context of Cardio-Metabolic Risk-Review. J. Clin. Med. 2021, 10, 2484. [Google Scholar] [CrossRef] [PubMed]
  3. Cervenka, I.; Agudelo, L.Z.; Ruas, J.L. Kynurenines: Tryptophan’s metabolites in exercise, inflammation, and mental health. Science 2017, 357, eaaf9794. [Google Scholar] [CrossRef] [PubMed] [Green Version]
  4. Kim, Y.K.; Jeon, S.W. Neuroinflammation and the Immune-Kynurenine Pathway in Anxiety Disorders. Curr. Neuropharmacol. 2018, 16, 574–582. [Google Scholar] [CrossRef]
  5. Saltiel, A.R.; Olefsky, J.M. Inflammatory mechanisms linking obesity and metabolic disease. J. Clin. Investig. 2017, 127, 1–4. [Google Scholar] [CrossRef]
  6. Gostner, J.M.; Geisler, S.; Stonig, M.; Mair, L.; Sperner-Unterweger, B.; Fuchs, D. Tryptophan Metabolism and Related Pathways in Psychoneuroimmunology: The Impact of Nutrition and Lifestyle. Neuropsychobiology 2020, 79, 89–99. [Google Scholar] [CrossRef]
  7. Favennec, M.; Hennart, B.; Caiazzo, R.; Leloire, A.; Yengo, L.; Verbanck, M.; Arredouani, A.; Marre, M.; Pigeyre, M.; Bessede, A.; et al. The kynurenine pathway is activated in human obesity and shifted toward kynurenine monooxygenase activation. Obesity 2015, 23, 2066–2074. [Google Scholar] [CrossRef]
  8. Favennec, M.; Hennart, B.; Verbanck, M.; Pigeyre, M.; Caiazzo, R.; Raverdy, V.; Verkindt, H.; Leloire, A.; Guillemin, G.J.; Yengo, L.; et al. Post-Bariatric Surgery Changes in Quinolinic and Xanthurenic Acid Concentrations Are Associated with Glucose Homeostasis. PLoS ONE 2016, 11, e0158051. [Google Scholar] [CrossRef] [Green Version]
  9. Liu, J.J.; Movassat, J.; Portha, B. Emerging role for kynurenines in metabolic pathologies. Curr. Opin. Clin. Nutr. Metab. Care 2019, 22, 82–90. [Google Scholar] [CrossRef]
  10. Christensen, M.H.E.; Fadnes, D.J.; Rost, T.H.; Pedersen, E.R.; Andersen, J.R.; Vage, V.; Ulvik, A.; Midttun, O.; Ueland, P.M.; Nygard, O.K.; et al. Inflammatory markers, the tryptophan-kynurenine pathway, and vitamin B status after bariatric surgery. PLoS ONE 2018, 13, e0192169. [Google Scholar] [CrossRef] [Green Version]
  11. Groven, N.; Reitan, S.K.; Fors, E.A.; Guzey, I.C. Kynurenine metabolites and ratios differ between Chronic Fatigue Syndrome, Fibromyalgia, and healthy controls. Psychoneuroendocrinology 2021, 131, 105287. [Google Scholar] [CrossRef] [PubMed]
  12. Tanaka, M.; Vecsei, L. Monitoring the kynurenine system: Concentrations, ratios or what else? Adv. Clin. Exp. Med. 2021, 30, 775–778. [Google Scholar] [CrossRef] [PubMed]
  13. Lugo-Huitron, R.; Ugalde Muniz, P.; Pineda, B.; Pedraza-Chaverri, J.; Rios, C.; Perez-de la Cruz, V. Quinolinic acid: An endogenous neurotoxin with multiple targets. Oxid. Med. Cell. Longev. 2013, 2013, 104024. [Google Scholar] [CrossRef] [PubMed] [Green Version]
  14. Dadvar, S.; Ferreira, D.M.S.; Cervenka, I.; Ruas, J.L. The weight of nutrients: Kynurenine metabolites in obesity and exercise. J. Intern. Med. 2018, 284, 519–533. [Google Scholar] [CrossRef] [PubMed] [Green Version]
  15. Taleb, O.; Maammar, M.; Klein, C.; Maitre, M.; Mensah-Nyagan, A.G. A Role for Xanthurenic Acid in the Control of Brain Dopaminergic Activity. Int. J. Mol. Sci. 2021, 22, 6974. [Google Scholar] [CrossRef]
  16. Hestad, K.A.; Engedal, K.; Whist, J.E.; Farup, P.G. The Relationships among Tryptophan, Kynurenine, Indoleamine 2,3-Dioxygenase, Depression, and Neuropsychological Performance. Front. Psychol. 2017, 8, 1561. [Google Scholar] [CrossRef] [PubMed] [Green Version]
  17. Marx, W.; McGuinness, A.J.; Rocks, T.; Ruusunen, A.; Cleminson, J.; Walker, A.J.; Gomes-da-Costa, S.; Lane, M.; Sanches, M.; Diaz, A.P.; et al. The kynurenine pathway in major depressive disorder, bipolar disorder, and schizophrenia: A meta-analysis of 101 studies. Mol. Psychiatry 2021, 26, 4158–4178. [Google Scholar] [CrossRef]
  18. Blankfield, A. A Brief Historic Overview of Clinical Disorders Associated with Tryptophan: The Relevance to Chronic Fatigue Syndrome (CFS) and Fibromyalgia (FM). Int. J. Tryptophan Res. 2012, 5, 27–32. [Google Scholar] [CrossRef] [Green Version]
  19. Farup, P.G. Are the Results of a Combined Behavioural and Surgical Treatment of Morbid Obesity Satisfactory and Predictable? Nutrients 2020, 12, 1997. [Google Scholar] [CrossRef]
  20. Farup, P.G.; Rootwelt, H.; Hestad, K. APOE—A genetic marker of comorbidity in subjects with morbid obesity. BMC Med. Genet. 2020, 21, 146. [Google Scholar] [CrossRef]
  21. Aasbrenn, M.; Lydersen, S.; Farup, P.G. A Conservative Weight Loss Intervention Relieves Bowel Symptoms in Morbidly Obese Subjects with Irritable Bowel Syndrome: A Prospective Cohort Study. J. Obes. 2018, 2018, 3732753. [Google Scholar] [CrossRef] [PubMed] [Green Version]
  22. Schauer, P.R.; Ikramuddin, S.; Hamad, G.; Eid, G.M.; Mattar, S.; Cottam, D.; Ramanathan, R.; Gourash, W. Laparoscopic gastric bypass surgery: Current technique. J. Laparoendosc. Adv. Surg. Tech. A 2003, 13, 229–239. [Google Scholar] [CrossRef] [PubMed]
  23. Roa, P.E.; Kaidar-Person, O.; Pinto, D.; Cho, M.; Szomstein, S.; Rosenthal, R.J. Laparoscopic sleeve gastrectomy as treatment for morbid obesity: Technique and short-term outcome. Obes. Surg. 2006, 16, 1323–1326. [Google Scholar] [CrossRef] [PubMed]
  24. Topp, C.W.; Ostergaard, S.D.; Sondergaard, S.; Bech, P. The WHO-5 Well-Being Index: A systematic review of the literature. Psychother. Psychosom. 2015, 84, 167–176. [Google Scholar] [CrossRef]
  25. Søgaard, A.J.; Bjelland, I.; Tell, G.S.; Røysamb, E. A comparison of the CONOR Mental Health Index to the HSCL-10 and HADS. Norsk Epidemiol. 2003, 13, 279–284. [Google Scholar]
  26. Lerdal, A.; Wahl, A.; Rustoen, T.; Hanestad, B.R.; Moum, T. Fatigue in the general population: A translation and test of the psychometric properties of the Norwegian version of the fatigue severity scale. Scand. J. Public Health 2005, 33, 123–130. [Google Scholar] [CrossRef]
  27. Alessandri, G.; Vecchione, M.; Eisenberg, N.; Laguna, M. On the factor structure of the Rosenberg (1965) General Self-Esteem Scale. Psychol. Assess. 2015, 27, 621–635. [Google Scholar] [CrossRef] [Green Version]
  28. von Soest, T. Rosenbergs selfølelsesskala: Validering av en norsk oversettelse. J. Norwegian. Psychol. Assoc. 2005, 42, 226–228. [Google Scholar]
  29. Beiske, K.K.; Kjelsberg, F.N.; Ruud, E.A.; Stavem, K. Reliability and validity of a Norwegian version of the Epworth sleepiness scale. Sleep Breath. 2009, 13, 65–72. [Google Scholar] [CrossRef]
  30. Svebak, S. The development of the Sense of Humor Questionnaire: From SHQ to SHQ-6. Humor-Int. J. Humor Res. 1996, 9, 341–362. [Google Scholar] [CrossRef]
  31. Mume, C.O. Excessive daytime sleepiness among depressed patients. Libyan J. Med. 2010, 5, 4626. [Google Scholar] [CrossRef] [PubMed]
  32. Schwieler, L.; Samuelsson, M.; Frye, M.A.; Bhat, M.; Schuppe-Koistinen, I.; Jungholm, O.; Johansson, A.G.; Landen, M.; Sellgren, C.M.; Erhardt, S. Electroconvulsive therapy suppresses the neurotoxic branch of the kynurenine pathway in treatment-resistant depressed patients. J. Neuroinflammation 2016, 13, 51. [Google Scholar] [CrossRef] [PubMed] [Green Version]
  33. Nemeth, H.; Toldi, J.; Vecsei, L. Role of kynurenines in the central and peripheral nervous systems. Curr. Neurovasc. Res. 2005, 2, 249–260. [Google Scholar] [CrossRef] [PubMed]
  34. Fukui, S.; Schwarcz, R.; Rapoport, S.I.; Takada, Y.; Smith, Q.R. Blood-brain barrier transport of kynurenines: Implications for brain synthesis and metabolism. J. Neurochem. 1991, 56, 2007–2017. [Google Scholar] [CrossRef]
  35. Hagman, D.K.; Larson, I.; Kuzma, J.N.; Cromer, G.; Makar, K.; Rubinow, K.B.; Foster-Schubert, K.E.; van Yserloo, B.; Billing, P.S.; Landerholm, R.W.; et al. The short-term and long-term effects of bariatric/metabolic surgery on subcutaneous adipose tissue inflammation in humans. Metabolism 2017, 70, 12–22. [Google Scholar] [CrossRef] [Green Version]
  36. Tang, Y.; Fung, E.; Xu, A.; Lan, H.Y. C-reactive protein and ageing. Clin. Exp. Pharmacol. Physiol. 2017, 44 (Suppl. 1), 9–14. [Google Scholar] [CrossRef] [Green Version]
  37. Theofylaktopoulou, D.; Midttun, O.; Ulvik, A.; Ueland, P.M.; Tell, G.S.; Vollset, S.E.; Nygard, O.; Eussen, S.J. A community-based study on determinants of circulating markers of cellular immune activation and kynurenines: The Hordaland Health Study. Clin. Exp. Immunol. 2013, 173, 121–130. [Google Scholar] [CrossRef]
  38. Chang, S.H.; Stoll, C.R.; Song, J.; Varela, J.E.; Eagon, C.J.; Colditz, G.A. The effectiveness and risks of bariatric surgery: An updated systematic review and meta-analysis, 2003–2012. JAMA Surg. 2014, 149, 275–287. [Google Scholar] [CrossRef] [Green Version]
  39. Kolen, A.M.; Romeijn, M.M.; Holthuijsen, D.D.B.; Janssen, L.; Greve, J.W.M.; Leclercq, W.K.G.; van Dielen, F.M.H. Current preoperative strategies applied in the Dutch bariatric centers: A national survey. Clin. Obes. 2021, 11, e12461. [Google Scholar] [CrossRef]
  40. Kim, J.J.; Rogers, A.M.; Ballem, N.; Schirmer, B.; American Society for Metabolic; Bariatric Surgery Clinical Issues Committee. ASMBS updated position statement on insurance mandated preoperative weight loss requirements. Surg. Obes. Relat Dis 2016, 12, 955–959. [Google Scholar] [CrossRef]
Figure 1. Schematic outline of the Kynurenine pathway limited to the steps presented in this paper. TDO: Tryptophan 2,3-dioxygenase. IDO: indoleamine 2,3 dioxygenase. KAT: Kynurenine aminotransferase. KUNU: Kynureninase. KMO: kynurenine 3-monooxygenase. B6: Vitamin B6.
Applsci 12 02648 g001
Table 1. Patients’ characteristics. The results are given as number (proportion, %) and mean (SD).
Patient CharacteristicsAt Inclusion
Mean (SD)
(No 141)
6 Months after
Surgery
Mean (SD) (No 95)
Difference
Compared with
Inclusion
(Paired Data)
Statistics
p-Values
Gender (female)116 (82%)77 (81%)
Age (years)43.0 (8.7)
BMI (kg/m2)42.1 (3.8)30.2 (3.6)−11.7 (2.7)<0.001
Cohabitation (yes)115 (82%)
Employed (yes)107 (76%)
Daily smoker (yes)25 (18%)7/89 (5%)
Physical activity (score 0–8)4.47 (2.2)5.4 (2.2)0.8 (2.5)0.007
General health (score 0–3)1.30 (0.7)2.03 (0.70)0.72 (0.75)<0.001
Somatic disorders (score 0–12)1.8 (1.4)1.7 (1.5)−0.2 (0.9)0.091
Muscle-skeletal pain (score 0–12)4.25 (2.94)3.04 (2.57)−1.81 (2.50)<0.001
WHO-5 Well-Being (score 0–100)59.5 (17.7)71.9 (16.1)14.6 (17.8)<0.001
Hopkins Symptoms Checklist (score 1–4)1.58 (0.54)1.32 (0.39)−0.26 (0.48)<0.001
Fatigue Severity Score (score 1–7)3.95 (1.63)3.14 (1.70)−0.90 (1.76)<0.001
Rosenberg Self-Esteem Scale (range 0–30)18.4 (5.3)22.2 (5.4)3.9 (5.5)<0.001
Epworth Sleepiness Scale (score 0–24)8.0 (4.7)5.8 (4.1)−2.4 (3.2)<0.001
Sense of humour (score 6–24)19.2 (2.7)19.7 (2.0)0.3 (1.9)0.144
CRP (mg/L)7.1 (6.3)1.87 (2.51)−4.92 (4.6)<0.001
Diabetes mellitus (yes)26/137 (18%)16/90 (18%)
Glucose (mmol/L)6.6 (3.1)5.4 (1.2)−1.1 (2.6)<0.001
HbA1c (%)5.9 (1.4)5.1 (0.8)−0.7 (0.9)<0.001
Vitamin B6 (15–160 nmol/l)31 (27)44 (30)10 (32)0.003
Tryptophan (Trypt) (ng/mL)12,630 (2777)11,339 (1912)−788 (2649)0.005
Kynurenine (Kyn) (ng/mL)488 (143)378 (91)−85 (111)<0.001
Kynurenic acid (KA) (ng/mL)14.2 (7.1)8.5 (3.9)−4.8 (4.7)<0.001
Quinolinic acid (QA) (ng/mL)111 (45)84 (30)−22 (30)<0.001
Xanthurenic acid (QA) (ng/mL)5.3 (1.2)4.6 (0.9)−0.4 (1.1)0.001
Kyn/Trypt ratio × 100039 (11)34 (9)−5 (7)<0.001
KA/Kyn ratio × 100030 (12)22 (8)−7 (11)<0.001
KA/QA ratio × 1000138 (70)107 (52)27 (60)<0.001
KA/XA ratio2.77 (1.27)1.84 (0.81)−0.88 (0.11)<0.001
QA/XA ratio21.9 (8.8)18.4 (6.3)−3.4 (8.0)<0.001
Table 2. Mixed linear regression model with tryptophan, kynurenine, and the metabolites (one at a time) as dependent variables, and Gender, Age, BMI, Smoking, Physical activity, Diabetes mellitus, CRP, Vitamin B6, and Time (before/after surgery) as independent variables.
Dependent VariablesIndependent Variables (B-Values with 95% CI, All p-Values and q-Values * < 0.10)
Typt-Kyn MetabolitesGenderAgeBMISmokingPhysical
Activity
Diabetes MellitusCRPVitamin B6Time
Tryptophan620 (−457; 1798)
p = 0.256
−18 (−72; 35)
p = 0.498
−10 (−128; 109)
p = 0.875
−230 (−1317; 856)
p = 0.676
90 (−91; 271)
p = 0.328
163 (−955; 1280)
p = 0.773
−67 (−141; 6)
p = 0.073
0 (−15; 15)
p = 0.997
−1784 (−3430; −139)
p= 0.034
Kynurenine4 (−54; 61)
p = 0.902
4 (0.6; 6.4)
p= 0.017
3 (−3; 9)
p = 0.379
−14 (−67; 38)
p = 0.589
7 (−1; 16)
p = 0.103
−60 (−119; −0.7)
p= 0.047
2 (−2; 5)
p = 0.305
0 (−0.7; 0.7)
p = 0.984
−70 (−151; 10)
p = 0.087
Kynurenic acid (KA)−0.18 (−3.18; 2.8)
p = 0.906
0.19 (0.03; 0.34)
p= 0.015
0.23 (−0.06; 0.52)
p = 0.115
0.65 (−1.79; 3.08)
p = 0.599
0.21 (−0.19; 0.61)
p = 0.297
−3.17 (−6.18; −0.15)
p= 0.040
−0.13 (−0.30; 0.04)
p = 0.132
0.02 (−0.01; 0.06)
p = 0.141
−3.7 (−7.6; 0.09)
p = 0.055
Quinolinic acid (QA)9.8 (−8.4; 28.0)
p = 0.288
0.9 (−0.03; 1.8)
p = 0.058
1.3 (−0.5; 3.1)
p = 0.156
−15.5(−30.8; 0.26)
p= 0.046
−1.2 (−3.7; 1.3)
p = 0.355
−21.9 (−40.3; −3.5)
p= 0.020
1.0 (−0.1; 2.0)
p = 0.076
−0.0 (−0.23; 0.17)
p = 0.757
−3.7 (−27.7; 20.3)
p = 0.759
Xanthurenic acid (XA)0.3 (−0.1; 0.8)
p = 0.137
−0.01 (−0.03; 0.02)
p = 0.607
0.0 (−0.05; 0.05)
p = 0.938
−0.04 (−0.50; 0.41)
p = 0.851
0.03 (−0.04; 0.11)
p = 0.368
0.11 (−0.36; 0.59)
p = 0.633
−0.03 (−0.06; 0.00)
p = 0.066
−0.00 (−0.00; 0.00)
p = 0.939
−0.77 (−1.47; −0.08)
p= 0.028
Kyn/Trypt ratio × 1000−1.2 (−5.6; 3.1)
p = 0.577
0.3 (0.095; 0.53
p= 0.005
0.1 (−0.3; 0.5)
p = 0.549
−0.8 (−4.1; 2.4)
p = 0.604
0.6 (0.05; 1.1)
p= 0.032
−5.9 (−10.2; −1.5)
p= 0.008
0.5 (0.3; 0.7)
p= 0.000061
q= 0.005
0.005 (−0.00; 0.047)
p = 0.819
−2.7 (−8.0; 2.5)
p = 0.315
KA/Kyn ratio × 1000−0.4 (−5.1; 4.3)
p = 0.857
0.1 (−0.2; 0.3)
p = 0.546
0.4 (−0.1; 0.9)
p = 0.150
0.3 (−4.3; 4.9)
p = 0.902
−0.2 (−0.9; 0.6)
p = 0.698
−1.9 (−6.7; 3.0)
p = 0.447
−0.3 (−0.7; −0.03)
p= 0.032
0.02 (−0.05; 0.08)
p = 0.650
−4.7 (−11.7; 2.3)
p = 0.186
KA/QA ratio × 1000−9 (−38; 20)
p = 0.532
0.4 (−1.1; 1.8)
p = 0.628
0.6 (−2.3; 3.8)
p = 0.627
34 (7; 61)
p= 0.013
0.7 (−3.7; 5.1)
p = 0.746
−7 (−36; 23)
p = 0.665
−1.7 (−3.5; 0.1)
p = 0.069
0.3 (−0.06; 0.7)
p = 0.100
−36 (−77; 5)
p = 0.089
KA/XA ratio−0.2 (−0.7; 0.3)
p = 0.452
0.03 (0.01; 0.06)
p= 0.016
0.04 (−0.01; 0.10)
p = 0.117
−0.04 (−0.52; 0.44)
p = 0.872
0.01 (−0.07; 0.09)
p = 0.743
−0.62 (−1.14; −0.10)
p= 0.021
−0.01 (−0.04; 0.03)
p = 0.672
0.00 (−0.005; 0.01)
p = 0.581
−0.5 (−1.2; 0.2)
p = 0.167
QA/XA ratio0.1 (−3.3; 3.5)
p = 0.954
0.2 (0.02; 0.35)
p= 0.030
0.3 (−0.1; 0.6)
p = 0.142
−3.0 (−6.2; 1.3)
p = 0.060
−0.3 (−0.8; 0.2)
p = 0.252
−5.3 (−8.8; −1.9)
p= 0.003
q= 0.090
0.37 (0.16; 0.59)
p= 0.0008
q= 0.036
−0.01 (−0.05; 0.03)
p = 0.691
1.6 (−3.3; 6.4)
p = 0.519
* q-values. All p-values in the table were adjusted for multiple testing ad modum Benjamini–Hochberg. The adjusted p-values are referred to as q-values. Only q-values < 0.10 are given in the table. p and q-values < 0.05 are marked in boldfaced type.
Table 3. Mixed linear regression model with the psychosomatic disorders as dependent variables (one at a time) and tryptophan, kynurenine, and the metabolites (one at a time) as independent variables adjusted for: Gender, Age, BMI, Smoking, Physical activity, CRP, Diabetes, Time (before/after). After adjusting for multiple testing, there were no statistically significant q-values *.
Dependent
Variable
Independent Variables, One at a Time
(B-Values with 95% Confidence Interval and p-Values *)
Tryptophan
× 105
Kynurenine
× 104
Kyn ac
× 103
Quin ac
× 103
Xanth ac
× 102
Kyn/Trypt
Ratio
KA/Kyn
Ratio
KA/QA
Ratio
KA/XT
Ratio × 102
QA/XT
Ratio × 103
General health 1.7 (−2.1; 5.5)
p = 0.384
−1.1 (−9.0; 6.8)
p = 0.790
0.4 (−16; 15)
p = 0.962
−1.4 (−4.0; 1.1)
p = 0.269
4 (−5; 13)
p = 0.379
−6 (−17; 5)
p = 0.278
−0.1 (−9; 9)
p = 0.979
0.6 (−1.0; 2.1)
p = 0.466
4 (−13; 4)
p = 0.340
−9 (−22; 4)
p = 0.168
Muscle-skeletal
pain
−1.1 (−15; 14)
p = 0.887
9 (−22; 40)
p = 0.560
32 (−31; 96)
p = 0.316
1.7 (−8.5; 12)
p = 0.740
−6 (−42; 29)
p = 0.722)
15 (−30; 59)
p = 0.512
−3 (−39; 32)
p = 0.848
0.6 (−5.6; 6.7)
p = 0.858
17 (−18; 51)
p = 0.337
6 (−45; 58)
p = 0.807
WHO−5
Well-Being
17 (75; 108)
p = 0.719)
61 (−132; 253)
p = 0.533
75 (−317; 468)
p = 0.705
40 (−22; 103)
p = 0.208
85 (−134; 303)
p = 0.446
13 (−258; 284)
p = 0.923
−2 (−225; 221)
p = 0.986
−14 (−53; 26)
p = 0.473
−44 (−260; 172)
p = 0.689
142 (−177; 462)
p = 0.380
Hopkins Symptom
Checklist−5
0.2 (−2.5; 2.9)
p = 0.890
0.2 (−5.4; 5.9)
p = 0.937
1 (−10; 12)
p = 0.867
−0.7 (−2.6; 1.1)
p = 0.453
−0.3 (−6.7; 6.0)
p = 0.909
1 (−7; 9)
p = 0.779
−0.3 (−7; 6)
p = 0.918
0.4 (−0.7; 1.5)
p = 0.428
2.0 (−4.2; 8.2)
p = 0.529
−5 (−14; 5)
p = 0.338)
Fatigue Severity
Score
1.6 (−7.1; 10.3)
p = 0.713
14 (−4; 32)
p = 0.134
11 (−26; 47)
p = 0.560
2.1 (−3.7; 8.1)
p = 0.473
−0.7 (−22; 20)
p = 0.943
17 (−8; 43)
p = 0.186
−14 (−35; 6)
p = 0.160
−0.5 (−4.0; 3.1)
p = 0.802
5.3 (−14.7; 25.4)
p = 0.598
2 (−27; 32)
p = 0.886
Rosenberg Self-
Esteem Scale
4 (−25; 34)
p = 0.755
9 (−70; 53)
p = 0.785
77 (−47; 200)
p = 0.222
2.3 (−17; 22)
p = 0.821
21 (−50; 92)
p = 0.561
−32 (−119; 53)
p = 0.453
72 (1.9; 142)
p= 0.044
5 (−7; 17)
p = 0.413
30 (−38; 98)
p = 0.381
20 (82; 122)
p = 0.697
Epworth Sleepiness
Scale
6 (−15; 28)
p = 0.547
24 (−25; 72)
p = 0.337
−52 (−151; 48)
p = 0.305
11 (−5; 27)
p = 0.191
9 (−43; 61)
p = 0.739
23 (−49; 95)
p = 0.525
−45 (−97;7)
p = 0.089
−10 (−19; −0.7)
p= 0.035
−23 (−75; 28)
p = 0.376
23 (−54; 101)
p = 0.558
Sense of humour−2 (−14; 10)
p = 0.729
−5 (−32; 23)
p = 0.741
−32 (−87; 22)
p = 0.246
−3 (−12; 5)
p = 0.445
−1.6 (−31; 28)
p = 0.914
9 (−30; 48)
p = 0.652
0.2 (−29; 29)
p = 0.988
−0.7 (−6; 4.5)
p = 0.800
−8 (−37; 20)
p = 0.567
−3 (−45; 41)
p = 0.913
* All p-values in the table were adjusted for multiple testing ad modum Benjamini–Hochberg and are referred to as q-values. All q-values were > 0.10 and are not given in the table. p-Values < 0.05 are marked in boldfaced type.
Publisher’s Note: MDPI stays neutral with regard to jurisdictional claims in published maps and institutional affiliations.

