Abstract
Presence is the sense of being in a virtual environment when physically situated in another place. It is one of the key components of the overall virtual reality (VR) experience, as well as other immersive audio applications. However, there is no standardized method for measuring presence. In our previous study, we explored the possibility of using electroencephalography (EEG) to measure presence by using questionnaires as a reference. It was found that an increase in the subjective presence level was correlated with an increase in the theta/beta ratio (an index derived from EEG). In the present study, we re-analyzed the original data and found that the peak alpha frequency (PAF), another EEG index, may also have the potential to reflect the change in the subjective presence level. Specifically, an increase in the subjective presence level was found to be correlated with a decrease in PAF. Together with our previous study, these results indicate the potential use of EEG for the objective measurement of presence in the future.
1. Introduction
Presence is the participant’s physiological sense of “being there” in the virtual environment while physically situated in another place [1,2]. As one of the factors that contribute most to the overall experience of virtual reality (VR), presence has been investigated in the context of VR in many studies [1,3,4,5,6,7,8,9,10,11]. In addition to VR, research on presence could also benefit other fields such as video games, audio production, and immersive audio technologies.
Generally, presence is measured using questionnaires, of which the two most widely used are the presence questionnaire (PQ) by Witmer and Singer [2,6] and the SUS questionnaire by Slater, Usoh and Steed [1,3,7]. Subjective measurement based on questionnaires is both valid and reliable since it reflects the subjective evaluation of the participants. As an alternative, researchers have been exploring and improving objective methods of measuring presence. Objective measurement uses physiological signals from the body directly, and can be straightforward and in real time if conducted under strictly controlled conditions. Furthermore, it can prevent the break in presence (BIP) [3,12,13] caused by the act of answering the questionnaires, since participants are no longer required to leave the virtual environment.
Since presence is a sensation generated by the brain, objective measurement could possibly utilize electroencephalography (EEG) as a tool to reveal physiological changes. EEG records brain activities through multiple electrodes placed on the scalp. It has already been used in research on presence [8,9,10,11,14,15] and in other fields [16,17,18,19,20].
In our previous study [21], we explored the possibility of measuring presence objectively using EEG. Two experiments were carried out, in which a loudspeaker array of eight loudspeakers was used to reproduce urban soundscapes as the only stimuli for presence. Subjective measurements (by questionnaires) and objective measurements (by EEG) were both conducted during the process. It was found that the presence score (the result of the questionnaire) and the theta/beta ratio (an index derived from EEG) could both indicate a change in the perceived presence level, and that they were positively correlated with each other.
In addition to the theta/beta ratio, several other indices were also investigated in the previous study, and we observed a dramatic change in the power of the alpha band as the presence level varied. In this study, we therefore re-analyzed the original data, focusing on the alpha band.
Alpha is the dominant oscillation in the brain’s EEG. Numerous studies have demonstrated that the alpha band plays an important role in cognitive processing [22,23,24,25]. Peak alpha frequency (PAF) is the predominant frequency of alpha-band oscillations (i.e., the maximal power value in the alpha band), and it can be viewed as a neurophysiological trait of cognitive functions [26,27,28]. It shows inter-individual differences [29,30,31,32,33], and also varies intra-individually with age [34,35,36], fatigue [37], and cognitive load or task demands [38,39]. For this reason, the present study used PAF specifically as an EEG index to investigate the correlation between EEG and subjective presence level.
In summary, the present study investigated the objective measurement of auditory presence using EEG on the basis of the previous study. Specifically, PAF was examined to determine whether it could reflect changes in the perceived presence level.
2. Materials and Methods
This study used the same experiment as that described in our previous paper [21]. The previous study focused on investigating the relationship between presence and the theta/beta ratio, whereas this study used the same raw data (i.e., the recorded raw EEG data and the results of questionnaires) to investigate the relationship between presence and another EEG index, the peak alpha frequency (PAF). Therefore, this section summarizes the experimental design while focusing on introducing the specific method for acquiring PAF. Details about the other aspects of the experimental design can be found in [21].
This study used ESMA-3D Immersive Soundscape Recordings by Dr. Hyunkook Lee’s team [40] as programs to stimulate presence. Due to its nature, the 8-channel signal was reproduced by an 8-channel double-layer quad-speaker array (i.e., cube array) [41] in the room, as shown in Figure 1. No visual stimuli were used in this study. To shorten the duration of the experiment, 6 out of 13 scenes were selected from the original file. With each scene lasting 30 s, the overall duration of the program was three minutes.
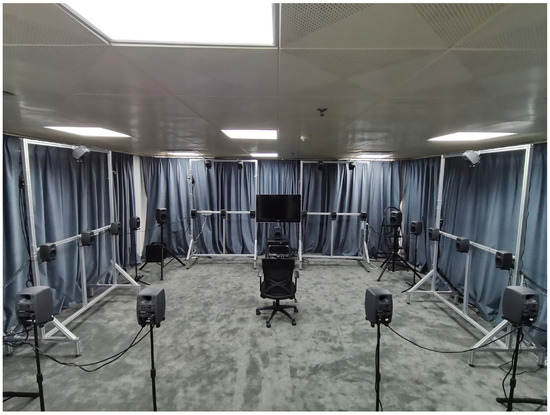
Figure 1.
Listening room setup.
As well as the original program described above (denoted Program A), two processed versions of it were also used to stimulate different levels of presence. Program B was created by combining signals from all eight channels of Program A and copying the sum to each channel. Since each channel had the same content, we should expect Program B to have a similar effect as a mono sound file. Program C was derived from Program A by muting the upper four height channels. Thus, the ESMA-3D degenerated into ESMA without height channels. We assumed that these three programs would stimulate presence levels in the following order: A > C > B. These three programs were then used in the subsequent experiments.
The study was composed of two experiments. Experiment 1 used Programs A and B for comparison, involving a total of 18 experienced listeners from the lab (16 males and 2 females, ages ranging from 23 to 27 years old), and Experiment 2 used Programs A and C for comparison, involving a total of 25 naïve listeners (8 males and 17 females, ranging in age from 21 to 28 years old).
During each experiment, two programs were presented in succession. In the meantime, EEG was recorded using a portable EEG device (Emotiv EPOC X [42]). After that, participants were required to fill in the questionnaire at the end of the experiment. The questionnaire used in the study contained four questions as follows:
- 1.
- Please rate your sense of being in the virtual environment on a scale of 0 to 10, where 10 represents your normal experience of being in a place;
- 2.
- During your experience, did you often think to yourself that you were actually in the virtual environment? Please rate it on a scale of 0 to 10, where 10 represents you almost felt you were actually in the virtual environment;
- 3.
- How well could you identify sounds? Please rate it on a scale of 0 to 10, where 10 represents you could clearly identify different kinds of sounds;
- 4.
- How well could you localize sounds? Please rate it on a scale of 0 to 10, where 10 represents you could easily detect the location of each sound.
The first two questions were taken from the SUS questionnaire. The first question focuses on assessing how closely the virtual environment resembles the real world, and the second question aims to evaluate the participants’ subjective impressions of their experience within the virtual environment. The last two questions were chosen from the presence questionnaire to evaluate the realism of the sound field of the virtual environment. The final presence score was the sum of the answers to these four questions. As the questions suggest, the higher the presence score, the greater the level of presence.
Thus, the subjective assessment of presence (represented by the presence score) and the objective measurement (represented by EEG) were both acquired. More detailed descriptions of the program selection, the experimental design, and the EEG apparatus can be found in [21].
The raw EEG data were preprocessed in MATLAB using a brain signal processing toolbox called EEGLAB [43] in the following steps. A bandpass filter of 1–50 Hz was first applied to the EEG data to remove the noise. The filtered data were further cleaned via a built-in plugin of EEGLAB called Clean Rawdata, to remove non-physiological artifacts (e.g., insufficient contact of electrodes with the head surface or sudden large movements). Then, physiological artifacts such as heart beat (ECG), eye movements (EOG), and muscle pulsations (EMG) were removed by running an independent component analysis (ICA) and deploying an automatic classification of artifactual ICA components plugin called MARA (“Multiple Artifact Rejection Algorithm”) [44,45].
Finally, the peak alpha frequency (PAF) was calculated using the “restingIAF package” [46]. This is an open-source package developed by Corcoran et al. for the estimation of individual alpha frequencies. This algorithm first calculates the power spectral density (PSD) of each channel and then deploys the Savitzky–Golay filter to smooth out the signal noise while preserving the main alpha peaks. Then, peaks within each channel are extracted and averaged based on their peak quality to obtain the final estimate of the peak alpha frequency [47].
3. Results
3.1. Experiment 1
First, data for 2 of the 18 participants were excluded since they reported being distracted during the experiment. Then, data for another 3 participants were excluded by the algorithm due to the strict criteria for estimating the PAF. The algorithm requires the following conditions to be met to produce a valid estimate of PAF: (1) the peak frequency must appear within the alpha band’s frequency range; (2) the peak power must exceed the minimum amount of normalized power estimated by the algorithm to qualify as a potential PAF candidate; (3) the peak’s height must exceed all other competitors by at least 20%; (4) at least three channels should yield valid PAF estimates, in order to calculate cross-channel averages [47]. Thus, 13 sets of valid data were collected, as shown in Table 1.

Table 1.
Presence scores and PAF estimates for Programs A and B in Experiment 1.
It can be observed that the presence scores for Program A were generally greater than those for Program B. A paired t-test was carried out, which showed that the difference in presence scores was significant at a significance level of 0.05 (p = 1.98 × ). In contrast, the PAF estimates for Program A were generally lower than those for Program B. The results of the paired t-test also demonstrated that the PAF estimates for Programs A and B were significantly different (p = 0.040). That is, when participants subjectively experienced higher levels of presence, they tended to show a lower PAF.
To further investigate the correlation between the change in presence score and PAF, a McNemar test was conducted. This is a non-parametric statistical test for paired data within the scope of chi-squared tests [48]. The data were first transformed into a dichotomous format, as shown in Table 2. The transformation rule was that if the presence score for Program A was greater than that for Program B, it would be marked as 1, and otherwise it would be marked as 0. Likewise, if the PAF for Program A was lower than that for Program B, it would be marked as 1. Please note that the transformation rules for presence score and PAF were different to account for their opposite change direction.
Table 2.
Data in the dichotomous format for the McNemar test.
In this way, the McNemar test was conducted and revealed no significant differences (p = 1.000). Furthermore, the Pearson correlation coefficient was 0.677 (p = 0.011). Both these results indicated that if the presence score for Program A was higher than that for Program B, it was highly likely that the PAF for Program A was lower than that for Program B. That is, using the presence score and the PAF to determine the level of presence yielded nearly the same results. Another statistical metric, Cohen’s kappa, could also be used. In general, this is used to determine whether different observers would reach the same conclusion. Kappa is standardized to a scale of −1 to 1. Kappa values of 1 indicate perfect agreement, kappa values of 0 indicate agreement equivalent to chance, and negative values indicate agreement less than chance [49]. The results showed kappa = 0.629 (p = 0.015), which indicated that there was an agreement between these two criteria (presence score and PAF) for determining the level of presence.
3.2. Experiment 2
In Experiment 2, data for one participant were initially ruled out since she stated herself that she could not discriminate between the two programs. Then, data for eight participants were excluded during the estimation of the PAF for the reason outlined in Section 3.1. Thus, 16 sets of valid data were collected, as shown in Table 3 (the dichotomous data are not shown in this table).
Table 3.
Presence scores and PAF estimates for Programs A and B in Experiment 2.
It can be observed from Table 3 that the trend that “presence score for Program A was higher than that for the other program, and the PAF for Program A was lower than that for the other program” from Experiment 1 also held true in Experiment 2, though it was not as evident as in Experiment 1. This accords with the fact that the difference between Programs A and C was smaller than that between Programs A and B; that is, Experiment 2 had a more stringent condition than Experiment 1.
A paired t-test was carried out and showed a significant difference in the presence score between the two programs (p = 0.016). The difference in the PAF between the two programs was substantial and close to significant (p = 0.051). Similarly, the correlation between the change in presence score and the PAF was examined using the McNemar test, and no significant difference was found (p = 1.000). The Pearson correlation coefficient was 0.590 (p = 0.016) and the value of kappa was 0.590 (p = 0.018). These results indicated that the correlation observed in Experiment 1 also applied to Experiment 2. That is, using the presence score (subjective measurement) and the PAF (objective measurement) to determine the level of presence yielded significantly similar results.
4. Discussion
In Section 3, it was found that an increase in the presence score was correlated with a decrease in the PAF. The underlying neurological mechanism of this correlation remains unclear. However, we found some clues that might shed light on research into this mechanism.
It was found in the previous study that an increase in the subjective presence level was correlated with an increase in the theta/beta ratio [21]. Neurologically, both the theta/beta ratio and the alpha-band oscillations have been demonstrated to be associated with attentional processes [24,50,51,52]. Wittmer and Singer [2] stated that a person’s presence in a virtual environment depends on them shifting their attention from the physical environment to the virtual environment. Hence, it is likely that changes in the theta/beta ratio and the PAF are closely related to changes in attention.
In addition, the theta/beta ratio was found to be negatively correlated with the PAF [53,54]. Combined with the results of [21] showing that the presence level is positively correlated with the theta/beta ratio, it can be deduced that the presence level is negatively correlated with the PAF, which is consistent with the findings of the present study. Furthermore, an increase in theta/beta ratio and a decrease in PAF were observed simultaneously in patients with attention deficit hyperactivity disorder (ADHD) [32,33], which further supports the results of this study. Considering that there are relatively few studies that investigate auditory presence exclusively, particularly using EEG, it is useful to note that the findings of these two studies are in agreement with each other.
It is interesting to note that an increase in PAF has been found to be associated with good performance [35,55,56] or an increase in cognitive load (or task demand) [38,39]. We assume by intuition that when the program that stimulated greater presence was played, the participants’ attention would rise and the cognitive load would also increase. However, the results would be just the opposite of those in this study if they were built on this assumption. We suppose this discrepancy arises from the difference between the brain’s top-down processing system and bottom-up processing system, which is reflected in the experimental design. Top-down processing is related to directed attention, which focuses on task-relevant information and inhibits the processing of non-essential information [57]. In the above-mentioned studies, the participants were required to complete tasks with various difficulties, where a better performance (i.e., better memory or shorter reaction time) should result from an increase in intentional attention. In other words, the causal relationship should be “the more attention assigned to the tasks, the higher the cognitive load, and consequently the higher the PAF”. Furthermore, alpha oscillations have been found to be associated with top-down processing [57,58], which may account for the relationship between PAF and task-relevant performance. On the other hand, bottom-up processing is related to involuntary attention (i.e., driven purely by the sensory input) [59]. As in the present study, there were no complicated tasks that required the participants to intentionally focus their attention in order to complete them. The change in presence should instead be the natural cause of the change in attention. This might explain the discrepancy between the results of this study and the previous studies. Nevertheless, the neurological mechanism of the change in EEG induced by presence should be investigated in future research.
5. Conclusions
The present study investigated the objective measurement of auditory presence using EEG, on the basis of the previous study. It was found in the previous study that an increase in the subjective presence level was correlated with an increase in the theta/beta ratio, while in this study it was found that an increase in the subjective presence level was correlated with a decrease in the peak alpha frequency (PAF). These results indicate that EEG is likely to reflect changes in the perceived presence level. Though limited with regard to the number of participants, these findings may shed light on research into the objective measurement of presence. Nevertheless, the neurological mechanism underlying the correlation between presence and EEG should be addressed in future work. In addition, future work should involve more participants and possibly develop a model of presence level estimation using EEG indices.
Author Contributions
Conceptualization, S.Z.; methodology, S.Z. and X.F.; software, S.Z.; formal analysis, S.Z.; investigation, S.Z. and X.F.; resources, X.F. and Y.S.; data curation, S.Z.; writing—original draft preparation, S.Z.; writing—review and editing, X.F. and Y.S.; visualization, S.Z.; supervision, Y.S.; project administration, Y.S.; funding acquisition, Y.S. All authors have read and agreed to the published version of the manuscript.
Funding
This work was supported by National Key R&D Program of China 2018YFB1403800.
Institutional Review Board Statement
The study was conducted according to the guidelines of the Declaration of Helsinki.
Informed Consent Statement
Informed consent was obtained from all subjects involved in the study.
Data Availability Statement
Not applicable.
Acknowledgments
The authors would like to thank all listeners who participated in the listening test.
Conflicts of Interest
The authors declare no conflict of interest.
Abbreviations
The following abbreviations are used in this manuscript:
| EEG | electroencephalography |
| PAF | peak alpha frequency |
| VR | virtual reality |
References
- Slater, M.; Usoh, M.; Steed, A. Depth of Presence in Virtual Environments. Presence Teleoperators Virtual Environ. 1994, 3, 130–144. [Google Scholar] [CrossRef]
- Witmer, B.G.; Singer, M.J. Measuring presence in virtual environments: A presence questionnaire. Presence Teleoperators Virtual Environ. 1998, 7, 225–240. [Google Scholar] [CrossRef]
- Slater, M.; Steed, A. A virtual presence counter. Presence Teleoperators Virtual Environ. 2000, 9, 413–434. [Google Scholar] [CrossRef] [Green Version]
- Schwind, V.; Knierim, P.; Haas, N.; Henze, N. Using presence questionnaires in virtual reality. In Proceedings of the 2019 CHI Conference on Human Factors in Computing Systems, Glasgow, UK, 4–9 May 2019; pp. 1–12. [Google Scholar]
- Martin Usoh, M.S.; Steed, A. Taking Steps: The Influence of a Walking Technique on Presence in Virtual Reality. Acm Trans.-Comput.-Hum. Interact. 1995, 2, 201–219. [Google Scholar] [CrossRef]
- Witmer, B.G.; Jerome, C.J.; Singer, M.J. The factor structure of the Presence Questionnaire. Presence Teleoperators Virtual Environ. 2005, 14, 298–312. [Google Scholar] [CrossRef]
- Slater, M.; McCarthy, J.; Maringelli, F. The influence of body movement on subjective presence in virtual environments. Hum. Factors 1998, 40, 469–477. [Google Scholar] [CrossRef] [Green Version]
- Kober, S.E.; Neuper, C. Using auditory event-related EEG potentials to assess presence in virtual reality. Int. J. Hum. Comput. Stud. 2012, 70, 577–587. [Google Scholar] [CrossRef]
- Dey, A.; Phoon, J.; Saha, S.; Dobbins, C.; Billinghurst, M. A Neurophysiological Approach for Measuring Presence in Immersive Virtual Environments. In Proceedings of the 2020 IEEE International Symposium on Mixed and Augmented Reality, ISMAR 2020, Porto de Galinhas, Brazil, 9–13 November 2020; pp. 474–485. [Google Scholar] [CrossRef]
- Kober, S.E.; Kurzmann, J.; Neuper, C. Cortical correlate of spatial presence in 2D and 3D interactive virtual reality: An EEG study. Int. J. Psychophysiol. 2012, 83, 365–374. [Google Scholar] [CrossRef]
- Clemente, M.; Rodríguez, A.; Rey, B.; Alcañiz, M. Assessment of the influence of navigation control and screen size on the sense of presence in virtual reality using EEG. Expert Syst. Appl. 2014, 41, 1584–1592. [Google Scholar] [CrossRef]
- Slater, M. How colorful was your day? Why questionnaires cannot assess presence in virtual environments. Presence 2004, 13, 484–493. [Google Scholar] [CrossRef]
- Sanchez-Vives, M.V.; Slater, M. From presence to consciousness through virtual reality. Nat. Rev. Neurosci. 2005, 6, 332–339. [Google Scholar] [CrossRef]
- Terkildsen, T.; Makransky, G. Measuring presence in video games: An investigation of the potential use of physiological measures as indicators of presence. Int. J. Hum. Comput. Stud. 2019, 126, 64–80. [Google Scholar] [CrossRef]
- Clemente, M.; Rodriguez, A.; Rey, B.; Alcañiz, M. Measuring presence during the navigation in a virtual environment using EEG. Stud. Health Technol. Inform. 2013, 191, 136–140. [Google Scholar] [PubMed]
- Jap, B.T.; Lal, S.; Fischer, P.; Bekiaris, E. Using EEG spectral components to assess algorithms for detecting fatigue. Expert Syst. Appl. 2009, 36, 2352–2359. [Google Scholar] [CrossRef]
- Wen, T.Y.; Aris, S.A.M. Electroencephalogram (EEG) stress analysis on alpha/beta ratio and theta/beta ratio. Indones. J. Electr. Eng. Comput. Sci. 2020, 17, 175–182. [Google Scholar] [CrossRef] [Green Version]
- Xu, J.; Zhong, B. Review on portable EEG technology in educational research. Comput. Hum. Behav. 2018, 81, 340–349. [Google Scholar] [CrossRef]
- Ramirez, R.; Vamvakousis, Z. Detecting emotion from EEG signals using the emotive epoc device. In Proceedings of the International Conference on Brain Informatics, Macau, China, 4–7 December 2012; Springer: Berlin/Heidelberg, Germany, 2012; pp. 175–184. [Google Scholar]
- Suto, J.; Jambor, Z. Music stimuli recognition from EEG signals with emotiv epoc headset. CEUR Workshop Proc. 2020, 2650, 309–317. [Google Scholar]
- Zhang, S.; Feng, X.; Shen, Y. Quantifying Auditory Presence Using Electroencephalography. Appl. Sci. 2021, 11, 10461. [Google Scholar] [CrossRef]
- Berger, H. Über das elektroenkephalogramm des menschen. Arch. Psychiatr. Nervenkrankh. 1929, 87, 527–570. [Google Scholar] [CrossRef]
- Adrian, E.D.; Matthews, B.H.C. The Berger rhythm: Potential changes from the occipital lobes in man. Brain 1934, 57, 355–385. [Google Scholar] [CrossRef]
- Klimesch, W. Alpha-band oscillations, attention, and controlled access to stored information. Trends Cogn. Sci. 2012, 16, 606–617. [Google Scholar] [CrossRef] [PubMed] [Green Version]
- Hanslmayr, S.; Sauseng, P.; Doppelmayr, M.; Schabus, M.; Klimesch, W. Increasing individual upper alpha power by neurofeedback improves cognitive performance in human subjects. Appl. Psychophysiol. Biofeedback 2005, 30, 1–10. [Google Scholar] [CrossRef] [PubMed]
- Angelakis, E.; Lubar, J.F.; Stathopoulou, S. Electroencephalographic peak alpha frequency correlates of cognitive traits. Neurosci. Lett. 2004, 371, 60–63. [Google Scholar] [CrossRef] [PubMed]
- Grandy, T.H.; Werkle-Bergner, M.; Chicherio, C.; Schmiedek, F.; Lövdén, M.; Lindenberger, U. Peak individual alpha frequency qualifies as a stable neurophysiological trait marker in healthy younger and older adults. Psychophysiology 2013, 50, 570–582. [Google Scholar] [CrossRef] [Green Version]
- Grandy, T.H.; Werkle-Bergner, M.; Chicherio, C.; Lövdén, M.; Schmiedek, F.; Lindenberger, U. Individual alpha peak frequency is related to latent factors of general cognitive abilities. Neuroimage 2013, 79, 10–18. [Google Scholar] [CrossRef] [PubMed] [Green Version]
- Coben, L.A.; Danziger, W.; Storandt, M. A longitudinal EEG study of mild senile dementia of Alzheimer type: Changes at 1 year and at 2.5 years. Electroencephalogr. Clin. Neurophysiol. 1985, 61, 101–112. [Google Scholar] [CrossRef]
- Smit, C.M.; Wright, M.J.; Hansell, N.K.; Geffen, G.M.; Martin, N.G. Genetic variation of individual alpha frequency (IAF) and alpha power in a large adolescent twin sample. Int. J. Psychophysiol. 2006, 61, 235–243. [Google Scholar] [CrossRef]
- Nunez, P.L.; Reid, L.; Bickford, R.G. The relationship of head size to alpha frequency with implications to a brain wave model. Electroencephalogr. Clin. Neurophysiol. 1978, 44, 344–352. [Google Scholar] [CrossRef]
- Bazanova, O.M.; Auer, T.; Sapina, E.A. On the efficiency of individualized theta/beta ratio neurofeedback combined with forehead EMG training in ADHD children. Front. Hum. Neurosci. 2018, 12, 1–13. [Google Scholar] [CrossRef] [Green Version]
- Lansbergen, M.M.; Arns, M.; van Dongen-Boomsma Martine, M.; Spronk, D.; Buitelaar, J.K. The increase in theta/beta ratio on resting-state EEG in boys with attention-deficit/hyperactivity disorder is mediated by slow alpha peak frequency. Prog.-Neuro-Psychopharmacol. Biol. Psychiatry 2011, 35, 47–52. [Google Scholar] [CrossRef]
- Osaka, M.; Osaka, N.; Koyama, S.; Okusa, T.; Kakigi, R. Individual differences in working memory and the peak alpha frequency shift on magnetoencephalography. Cogn. Brain Res. 1999, 8, 365–368. [Google Scholar] [CrossRef]
- Clark, C.R.; Veltmeyer, M.D.; Hamilton, R.J.; Simms, E.; Paul, R.; Hermens, D.; Gordon, E. Spontaneous alpha peak frequency predicts working memory performance across the age span. Int. J. Psychophysiol. 2004, 53, 1–9. [Google Scholar] [CrossRef]
- Köpruner, V.; Pfurtscheller, G.; Auer, L.M. Quantitative EEG in normals and in patients with cerebral ischemia. Prog. Brain Res. 1984, 62, 29–50. [Google Scholar] [PubMed]
- Ng, S.C.; Raveendran, P. EEG peak alpha frequency as an indicator for physical fatigue. In Proceedings of the 11th Mediterranean Conference on Medical and Biomedical Engineering and Computing 2007, Ljubljana, Slovenia, 26–30 June 2007; Springer: Berlin/Heidelberg, Germany, 2007; pp. 517–520. [Google Scholar]
- Haegens, S.; Cousijn, H.; Wallis, G.; Harrison, P.J.; Nobre, A.C. Inter-and intra-individual variability in alpha peak frequency. Neuroimage 2014, 92, 46–55. [Google Scholar] [CrossRef] [PubMed] [Green Version]
- Maurer, U.; Brem, S.; Liechti, M.; Maurizio, S.; Michels, L.; Brandeis, D. Frontal midline theta reflects individual task performance in a working memory task. Brain Topogr. 2015, 28, 127–134. [Google Scholar] [CrossRef] [Green Version]
- ESMA-3D Immersive Soundscape Recordings. Available online: https://zenodo.org/record/3549050#.Ye6VSfVBwlj (accessed on 24 January 2022).
- Hyunkook, L. Capturing 360° audio using an equal segment microphone array (ESMA). AES J. Audio Eng. Soc. 2019, 67, 13–26. [Google Scholar] [CrossRef]
- Emotiv Epoc X. Available online: https://www.emotiv.com/epoc-x/ (accessed on 24 January 2021).
- Delorme, A.; Makeig, S. EEGLAB: An open source toolbox for analysis of single-trial EEG dynamics including independent component analysis. J. Neurosci. Methods 2004, 134, 9–21. [Google Scholar] [CrossRef] [PubMed] [Green Version]
- Winkler, I.; Haufe, S.; Tangermann, M. Automatic classification of artifactual ICA-components for artifact removal in EEG signals. Behav. Brain Funct. 2011, 7, 1–15. [Google Scholar] [CrossRef] [Green Version]
- Winkler, I.; Brandl, S.; Horn, F.; Waldburger, E.; Allefeld, C.; Tangermann, M. Robust artifactual independent component classification for BCI practitioners. J. Neural Eng. 2014, 11, 35013. [Google Scholar] [CrossRef] [Green Version]
- Corcoran, A.W.; Alday, P.M.; Schlesewsky, M.; Bornkessel-Schlesewsky, I. restingIAF Package. Available online: https://github.com/corcorana/restingIAF (accessed on 24 January 2022).
- Corcoran, A.W.; Alday, P.M.; Schlesewsky, M.; Bornkessel-Schlesewsky, I. Toward a reliable, automated method of individual alpha frequency (IAF) quantification. Psychophysiology 2018, 55, e13064. [Google Scholar] [CrossRef] [Green Version]
- McNemar, Q. Note on the sampling error of the difference between correlated proportions or percentages. Psychometrika 1947, 12, 153–157. [Google Scholar] [CrossRef] [PubMed]
- Viera, A.J.; Garrett, J.M. Understanding interobserver agreement: The kappa statistic. Fam. Med. 2005, 37, 360–363. [Google Scholar] [PubMed]
- Angelidis, A.; van der Does, W.; Schakel, L.; Putman, P. Frontal EEG theta/beta ratio as an electrophysiological marker for attentional control and its test-retest reliability. Biol. Psychol. 2016, 121, 49–52. [Google Scholar] [CrossRef] [PubMed]
- Putman, P.; Verkuil, B.; Arias-Garcia, E.; Pantazi, I.; van Schie, C. EEG theta/beta ratio as a potential biomarker for attentional control and resilience against deleterious effects of stress on attention. Cogn. Affect. Behav. Neurosci. 2014, 14, 782–791. [Google Scholar] [CrossRef]
- Klimesch, W. EEG alpha and theta oscillations reflect cognitive and memory performance: A review and analysis. Brain Res. Rev. 1999, 29, 169–195. [Google Scholar] [CrossRef]
- Finley, A.; Angus, D.; van Reekum, C.; Davidson, R.; Schaefer, S. Age, theta/beta ratios, and individual peak alpha frequency in older adults. Psychophysiology 2020, 57, S58. [Google Scholar]
- Finley, A.J.; Angus, D.J.; Van Reekum, C.M.; Davidson, R.; Schaefer, S.M. Periodic and Aperiodic Contributions to Theta-Beta Ratios Across Adulthood. PsyArXiv 2021. [Google Scholar] [CrossRef]
- Angelakis, E.; Stathopoulou, S.; Frymiare, J.L.; Green, D.L.; Lubar, J.F.; Kounios, J. EEG neurofeedback: A brief overview and an example of peak alpha frequency training for cognitive enhancement in the elderly. Clin. Neuropsychol. 2007, 21, 110–129. [Google Scholar] [CrossRef]
- Jin, Y.I.; O’HALLORAN, J.P.; Plon, L.; Sandman, C.A.; Potkin, S.G. Alpha EEG predicts visual reaction time. Int. J. Neurosci. 2006, 116, 1035–1044. [Google Scholar] [CrossRef]
- Cooper, N.R.; Croft, R.J.; Dominey, S.J.J.; Burgess, A.P.; Gruzelier, J.H. Paradox lost? Exploring the role of alpha oscillations during externally vs. internally directed attention and the implications for idling and inhibition hypotheses. Int. J. Psychophysiol. 2003, 47, 65–74. [Google Scholar] [CrossRef]
- Klimesch, W.; Sauseng, P.; Hanslmayr, S. EEG alpha oscillations: The inhibition–timing hypothesis. Brain Res. Rev. 2007, 53, 63–88. [Google Scholar] [CrossRef] [PubMed]
- Ganis, G.; Kosslyn, S.M. Multiple mechanisms of top-down processing in vision. In Representation and Brain; Springer: Berlin/Heidelberg, Germany, 2007; pp. 21–45. [Google Scholar]
Publisher’s Note: MDPI stays neutral with regard to jurisdictional claims in published maps and institutional affiliations. |
© 2022 by the authors. Licensee MDPI, Basel, Switzerland. This article is an open access article distributed under the terms and conditions of the Creative Commons Attribution (CC BY) license (https://creativecommons.org/licenses/by/4.0/).