
X-ray Micro CT Based Characterization of Pore-Throat Network for Marine Carbonates from South China Sea

Abstract
1. Introduction
2. Microfacies Analysis
3. X-ray Micro-CT Scanning Test
3.1. Test Samples
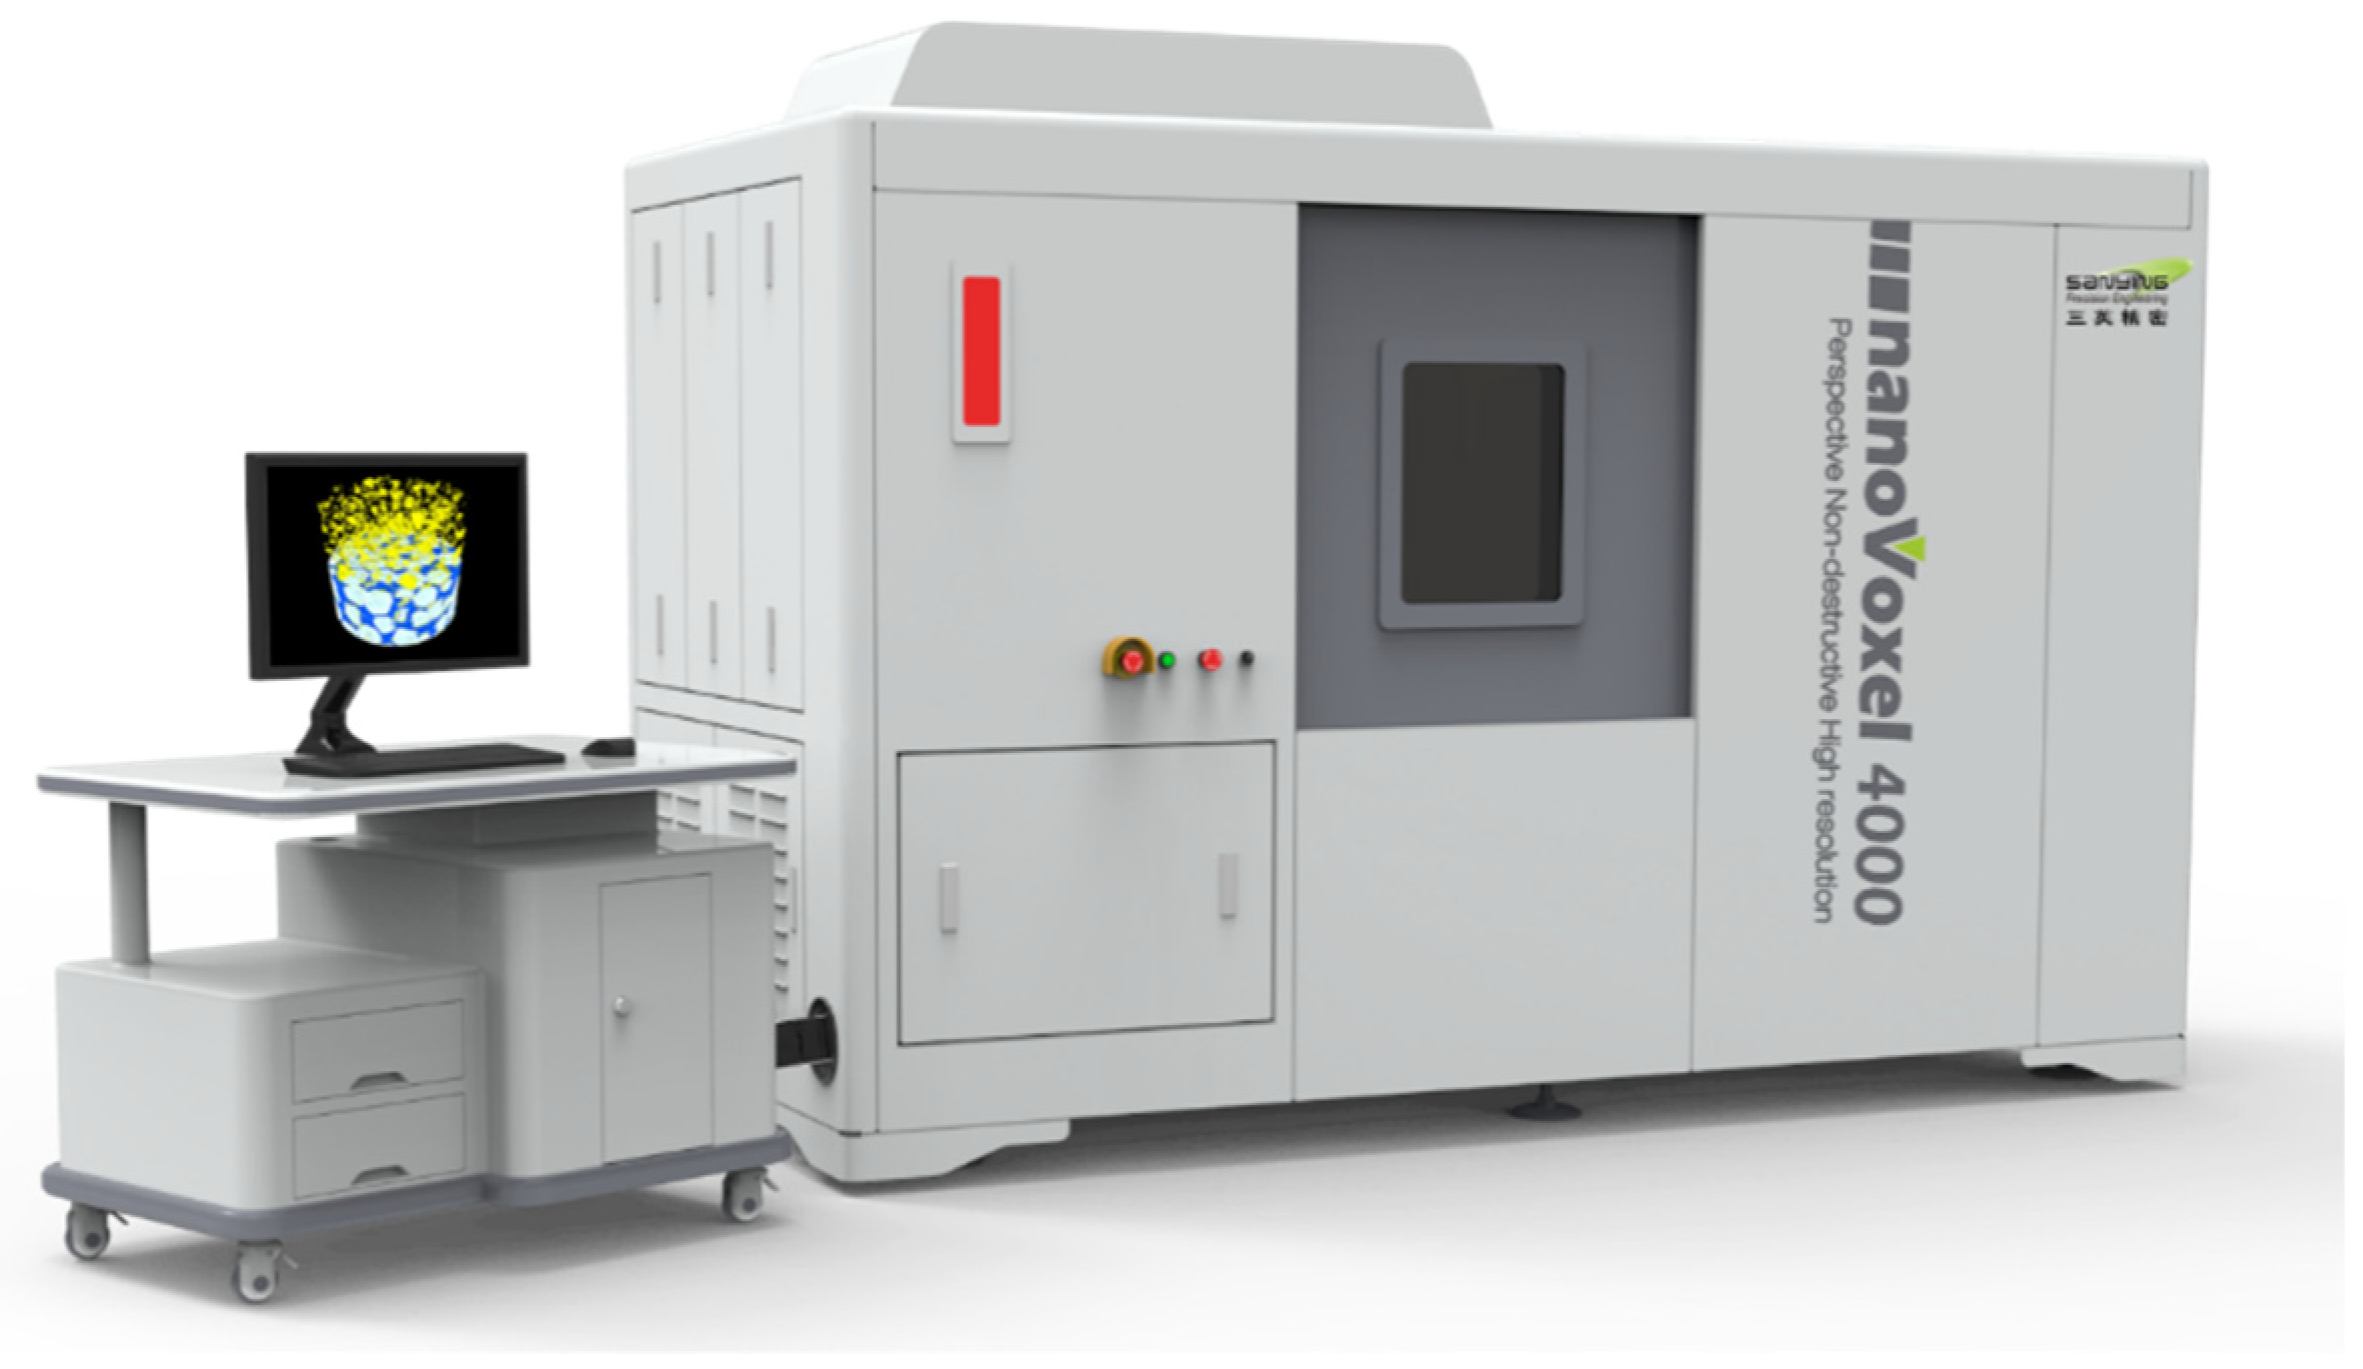
3.2. Equipment and Test Condition
3.3. Test Principle
3.4. Cross Sectional Porosity
4. Microstructural Analysis
4.1. 3D Reconstruction and Analysis
4.2. Digital Core Analysis
4.3. Pore Scale Network Model
5. Quantitative Analysis of Pore-Throat Network
5.1. Quantitative Analysis of Pore
5.1.1. Pore Radius
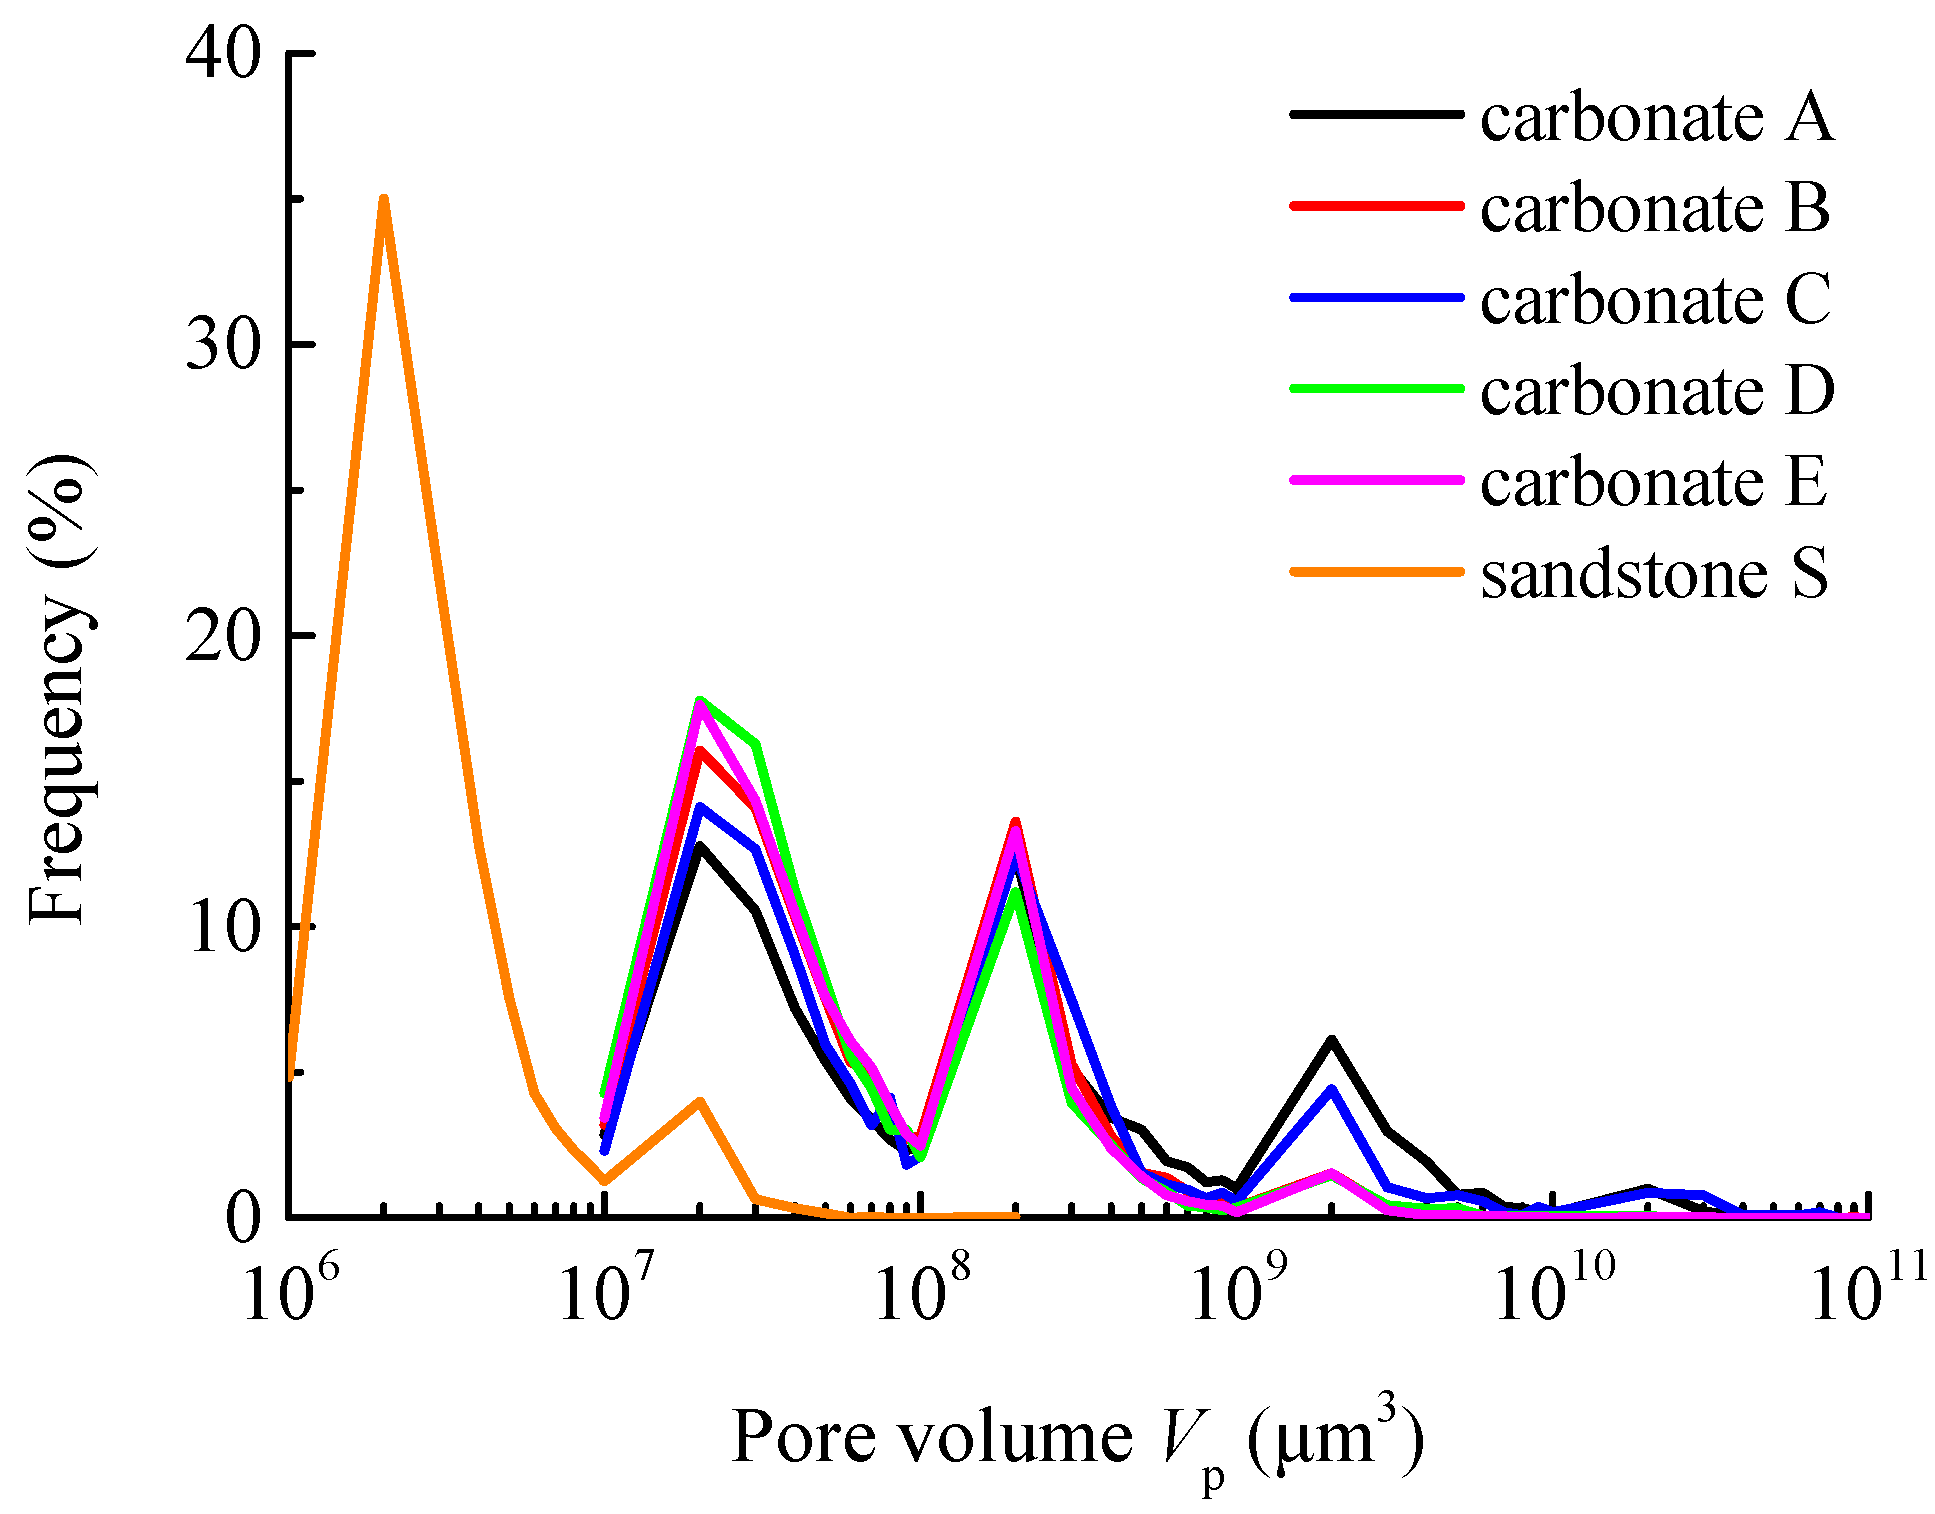
5.1.2. Pore Volume
5.1.3. Pore Shape Factor
5.2. Quantitative Analysis of Throat
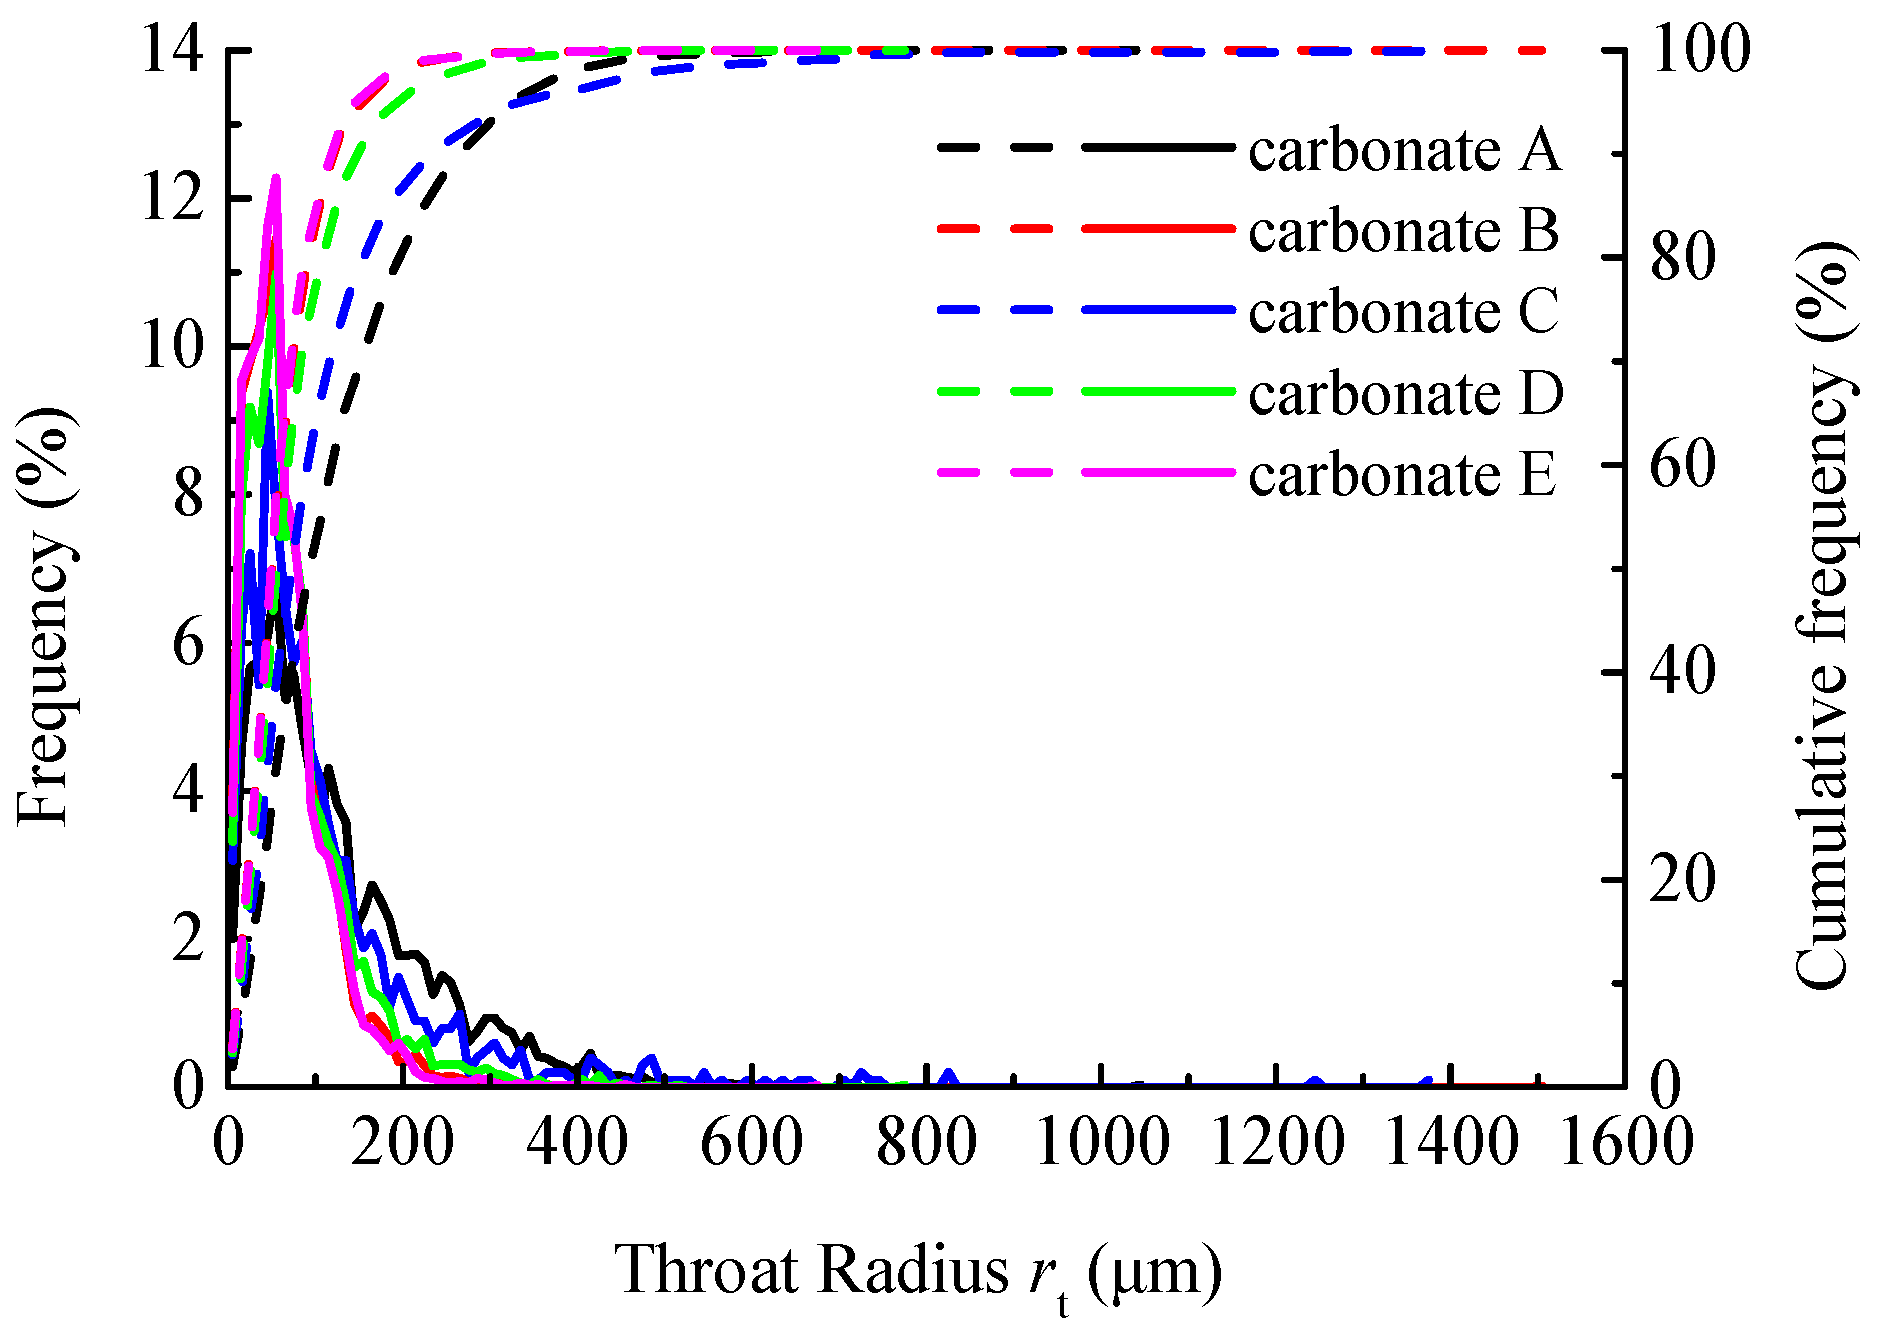
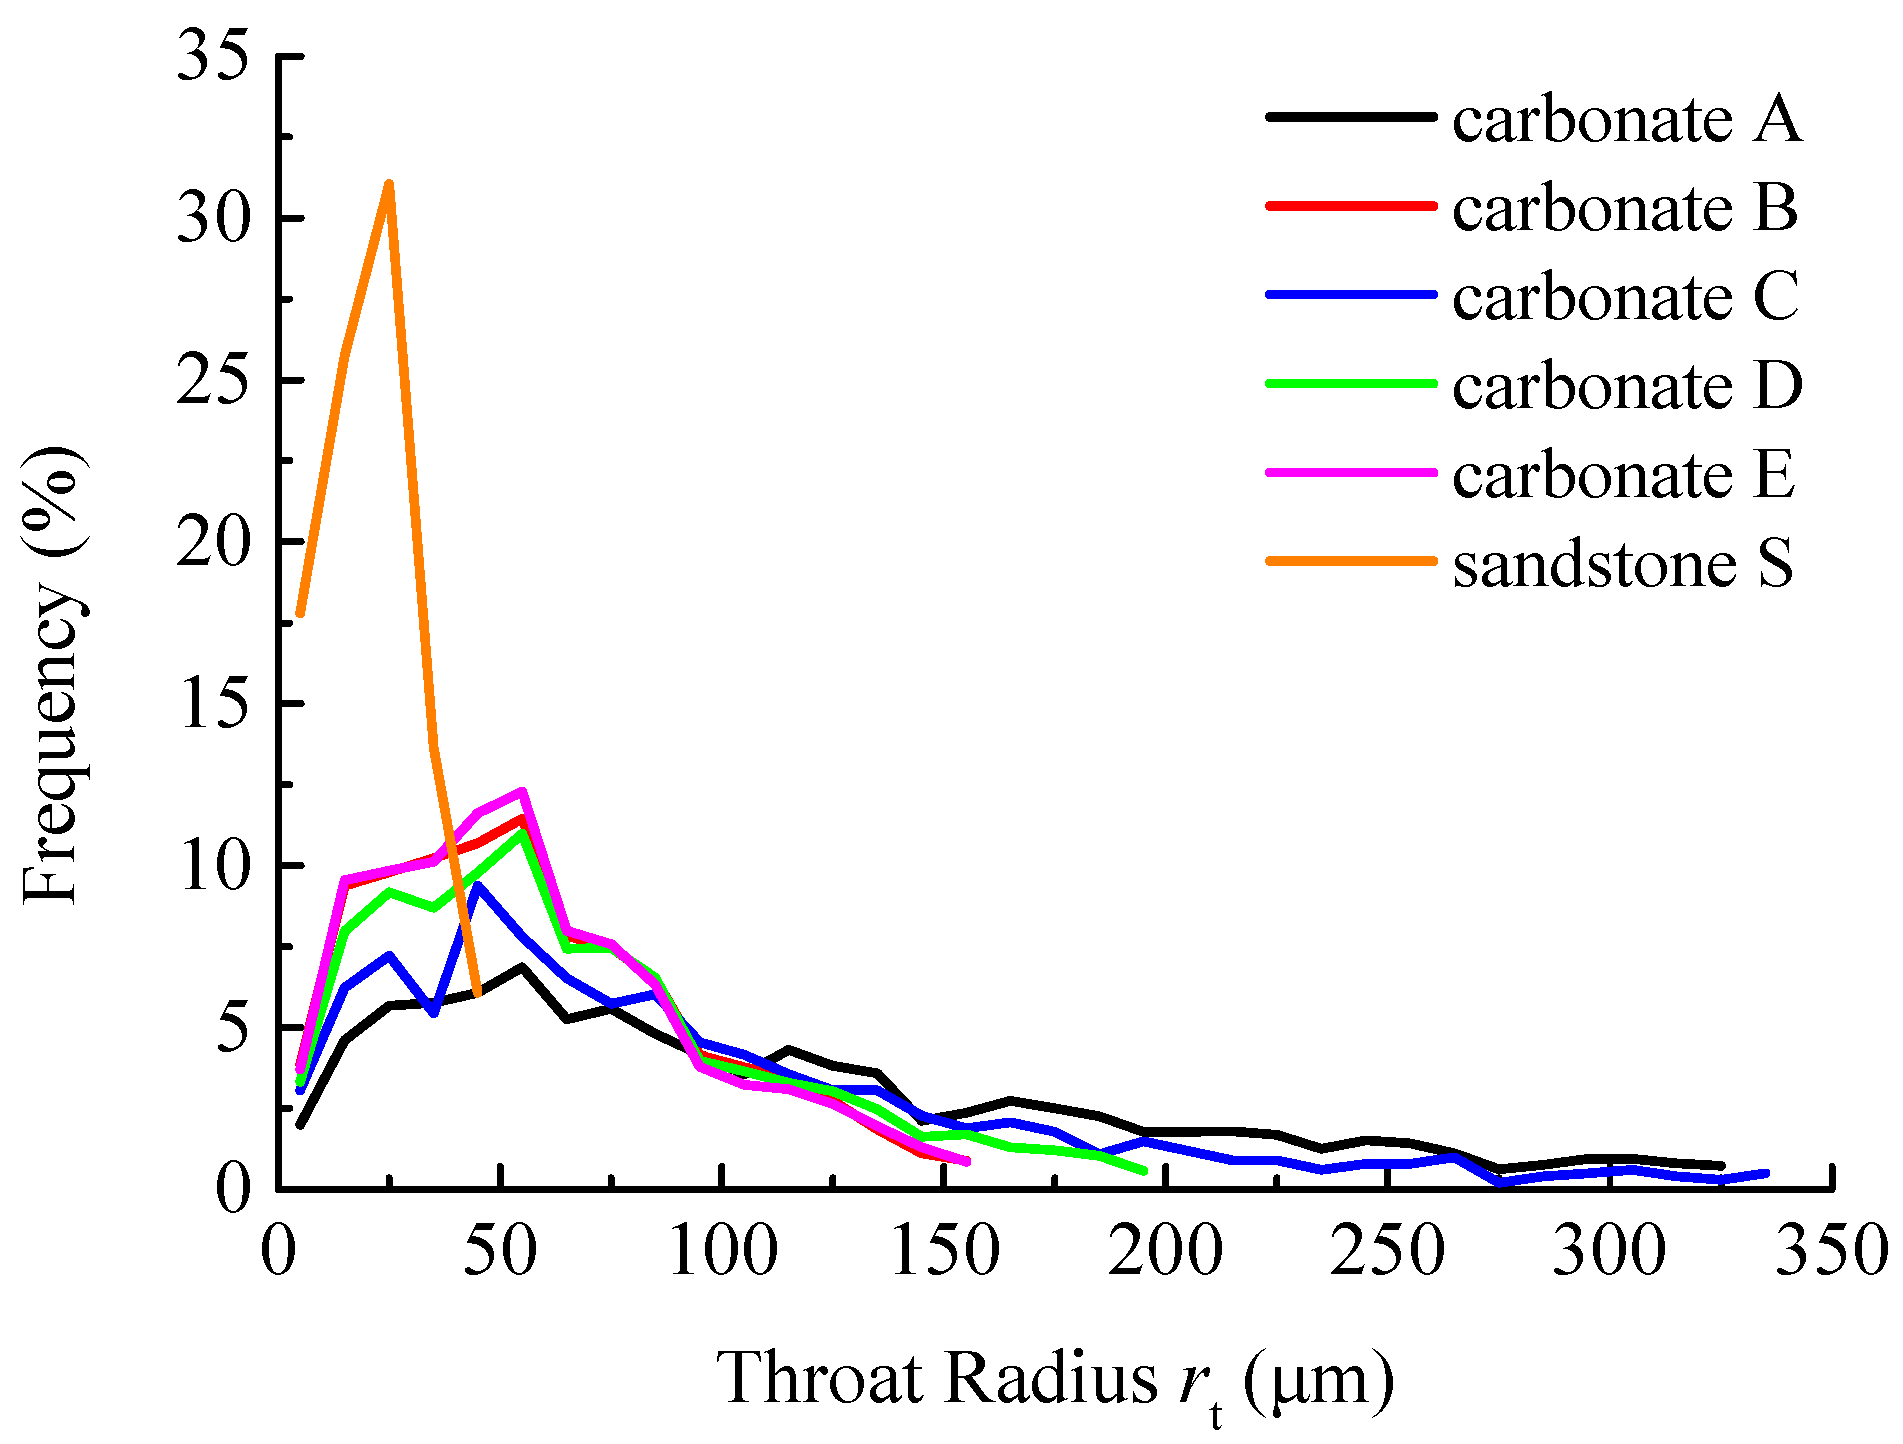
5.2.1. Throat Radius
5.2.2. Throat Volume
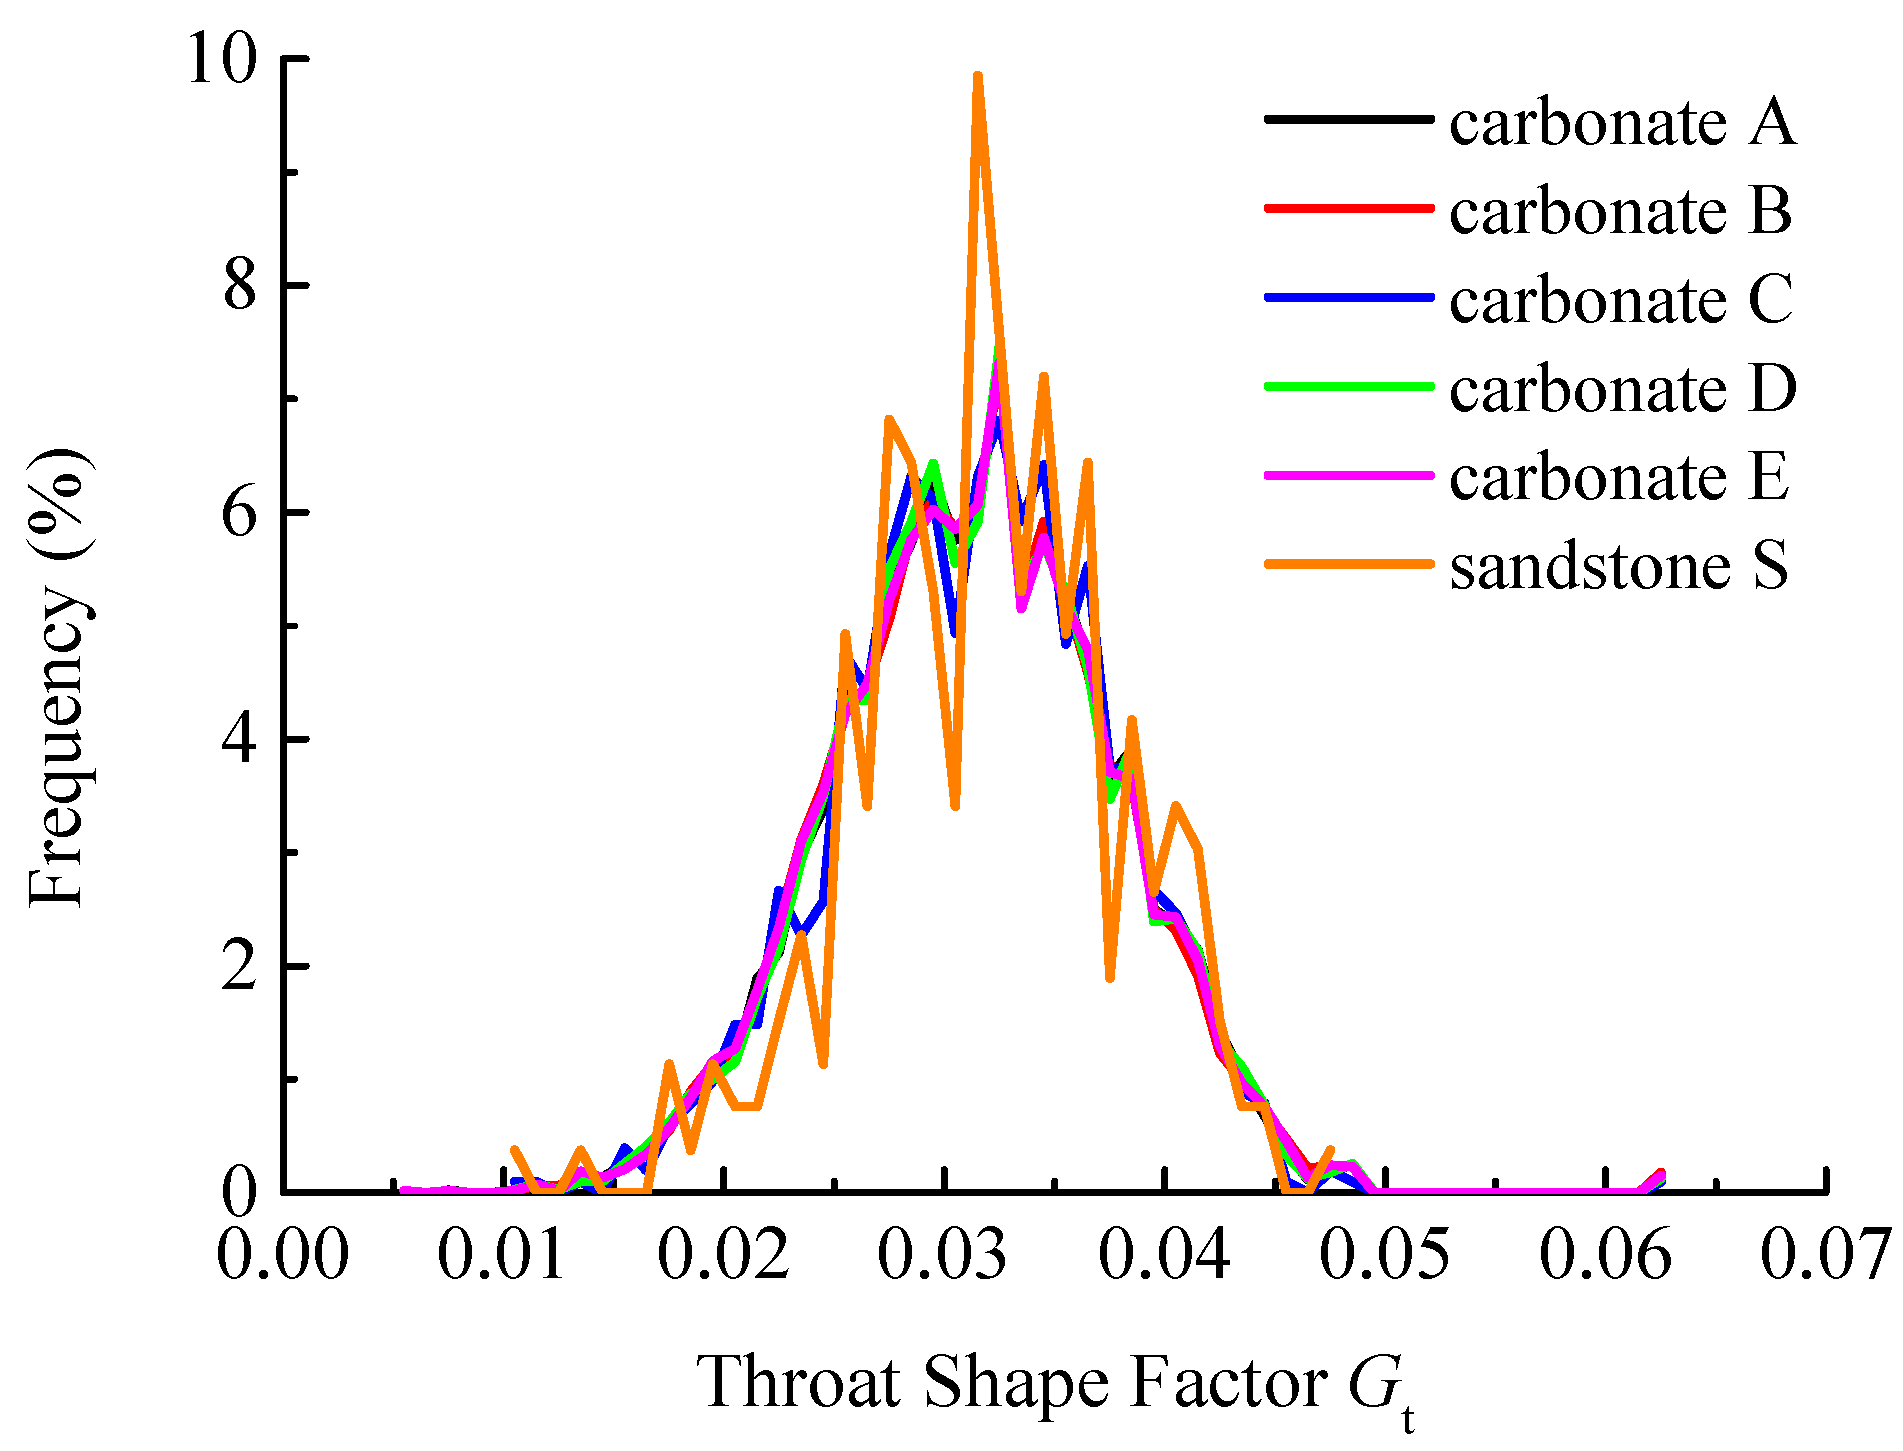
5.2.3. Throat Shape Factor
5.2.4. Coordination Number
6. Conclusions
Author Contributions
Funding
Data Availability Statement
Acknowledgments
Conflicts of Interest
References
- Ehrlich, R.; Kennedy, S.K.; Crabtree, S.J.; Cannon, R.L. Petrographic image analysis; I, Analysis of reservoir pore complexes. J. Sediment. Res. 1984, 54, 1365–1378. [Google Scholar] [CrossRef]
- Anselmetti, F.S.; Luthi, S.; Eberli, G.P. Quantitative characterization of carbonate pore systems by digital image analysis. AAPG Bull. 1998, 82, 1815–1836. [Google Scholar] [CrossRef]
- Liu, C.; Shi, B.; Zhou, J.; Tang, C.S. Quantification and characterization of microporosity by image processing, geometric measurement and statistical methods: Application on SEM images of clay materials. Appl. Clay Sci. 2011, 54, 97–106. [Google Scholar] [CrossRef]
- Xie, S.Y.; Cheng, Q.M.; Ling, Q.C.; Li, B.; Bao, Z.Y.; Fan, P. Fractal and multifractal analysis of carbonate pore-scale digital images of petroleum reservoirs. Mar. Pet. Geol. 2010, 27, 476–485. [Google Scholar] [CrossRef]
- Zhu, C.Q.; Chen, H.Y.; Meng, Q.S.; Wang, R. Microscopic characterization of intra-pore structures of calcareous sands. Rock Soil Mech. 2014, 35, 1831–1836. [Google Scholar] [CrossRef]
- Du, Y.J.; Jiang, N.J.; Liu, S.Y.; Jin, F.; Singh, D.N.; Puppala, A.J. Engineering properties and microstructural characteristics of cement-stabilized zinc-contaminated kaolin. Can. Geotech. J. 2014, 51, 289–302. [Google Scholar] [CrossRef]
- Wildenschild, D.; Sheppard, A.P. X-ray imaging and analysis techniques for quantifying pore-scale structure and processes in subsurface porous medium systems. Adv. Water Resour. 2013, 51, 217–246. [Google Scholar] [CrossRef]
- Arns, C.H.; Bauget, F.; Limaye, A.; Sakellariou, A.; Senden, T.J.; Sheppard, A.P.; Sok, R.; Pinczewski, V.; Bakke, S.; Berge, L.I.; et al. Pore scale characterisation of carbonates using X-ray microtomography. In Proceedings of the SPE Annual Technical Conference and Exhibition, Houston, TX, USA, 26–29 September 2004. [Google Scholar] [CrossRef]
- Coenen, J.; Tchouparova, E.; Jing, X. Measurement parameters and resolution aspects of micro X-ray tomography for advanced core analysis. In Proceedings of the International Symposium of the Society of Core Analysts, Abu Dhabi, United Arab Emirates, 5–9 October 2004. [Google Scholar]
- Blunt, M.J.; Bijeljic, B.; Dong, H.; Gharbi, O.; Iglauer, S.; Mostaghimi, P.; Paluszny, A.; Pentland, C. Pore-scale imaging and modelling. Adv. Water Resour. 2013, 51, 197–216. [Google Scholar] [CrossRef]
- Zeng, L.B.; Jiang, J.W.; Yang, Y.L. Fractures in the low porosity and ultra-low permeability glutenite reservoirs: A case study of the late Eocene Hetaoyuan formation in the Anpeng Oilfield, Nanxiang Basin, China. Mar. Pet. Geol. 2010, 27, 1642–1650. [Google Scholar] [CrossRef]
- Zhao, H.; Zhao, Y.X. An automatic loading system for rock core testing with an industrial CT scanner. Pet. Sci. 2011, 8, 490–493. [Google Scholar] [CrossRef][Green Version]
- Fonseca, J.; O’sullivan, C.; Coop, M.R.; Lee, P.D. Quantifying the evolution of soil fabric during shearing using scalar parameters. Geotechnique 2013, 63, 818–829. [Google Scholar] [CrossRef]
- Wang, Y.; Li, X.; Zhang, B.; Wu, Y.F. Meso-damage cracking characteristics analysis for rock and soil aggregate with CT test. Sci. China-Technol. Sci. 2014, 57, 1361–1371. [Google Scholar] [CrossRef]
- Wang, Y.; Miller, J.D. Current developments and applications of micro-CT for the 3D analysis of multiphase mineral systems in geometallurgy. Earth-Sci. Rev. 2020, 211, 103406. [Google Scholar] [CrossRef]
- Wu, J.; Fan, T.L.; Gomez-Rivas, E.; Gao, Z.Q.; Yao, S.Q.; Li, W.H.; Zhang, C.J.; Sun, Q.Q.; Gu, Y.; Xiang, M. Impact of pore structure and fractal characteristics on the sealing capacity of Ordovician carbonate cap rock in the Tarim Basin, China. Mar. Pet. Geol. 2019, 102, 557–579. [Google Scholar] [CrossRef]
- Raeini, A.Q.; Blunt, M.J.; Bijeljic, B. Direct simulations of two-phase flow on micro-CT images of porous media and upscaling of pore-scale forces. Adv. Water Resour. 2014, 74, 116–126. [Google Scholar] [CrossRef]
- Cnudde, V.; Boone, M.N. High-resolution X-ray computed tomography in geosciences: A review of the current technology and applications. Earth-Sci. Rev. 2013, 123, 1–17. [Google Scholar] [CrossRef]
- Wu, Y.Q.; Tahmasebi, P.; Lin, C.Y.; Zahid, M.A.; Dong, C.M.; Golab, A.N.; Ren, L.H. A comprehensive study on geometric, topological and fractal characterizations of pore systems in low-permeability reservoirs based on SEM, MICP, NMR, and X-ray CT experiments. Mar. Pet. Geol. 2019, 103, 12–28. [Google Scholar] [CrossRef]
- Fan, X.Q.; Wang, G.W.; Li, Y.F.; Dai, Q.Q.; Song, L.H.; Duan, C.W.; Zhang, C.G.; Zhang, F.S. Pore structure evaluation of tight reservoirs in the mixed siliciclastic-carbonate sediments using fractal analysis of NMR experiments and logs. Mar. Pet. Geol. 2019, 109, 484–493. [Google Scholar] [CrossRef]
- Weger, R.J.; Eberli, G.P.; Baechle, G.T.; Massaferro, J.L.; Sun, Y.F. Quantification of pore structure and its effect on sonic velocity and permeability in carbonates. AAPG Bull. 2009, 93, 1297–1317. [Google Scholar] [CrossRef]
- Zhu, C.Q.; Liu, H.F.; Zhou, B. Micro-structures and the basic engineering properties of beach calcarenites in South China Sea. Ocean Eng. 2016, 114, 224–235. [Google Scholar] [CrossRef]
- Liu, H.F.; Zhu, C.Q.; Wang, R.; Cui, X.; Wang, T.M. Characterization of the interface between concrete pile and coral reef calcarenite using constant normal stiffness direct shear test. Bull. Eng. Geol. Environ. 2021, 80, 1757–1765. [Google Scholar] [CrossRef]
- Liu, H.F.; Zhu, C.Q.; Zheng, K.; Ma, C.H.; Yi, M.X. Crack Initiation and Damage Evolution of Micritized Framework Reef Limestone in the South China Sea. Rock Mech. Rock Eng. 2021, 54, 5591–5601. [Google Scholar] [CrossRef]
- Choquette, P.W.; Pray, L.C. Geologic nomenclature and classification of porosity in sedimentary carbonates. AAPG Bull. 1970, 54, 207–250. [Google Scholar] [CrossRef]
- Ulusay, R. (Ed.) The ISRM Suggested Methods for Rock Characterization, Testing and Monitoring: 2007–2014; Springer International Publishing: Cham, Switzerland, 2015. [Google Scholar] [CrossRef]
- Fatt, I. The network model of porous media. Trans. AIME 1956, 207, 144–181. [Google Scholar] [CrossRef]
- Dong, H.; Fjeldstad, S.; Alberts, L.; Roth, S.; Bakke, S.; Øren, P.E. Pore network modelling on carbonate: A comparative study of different micro-CT Network extraction methods. In Proceedings of the International Symposium of the Society of Core Analysts, Abu Dhabi, United Arab Emirates, 18–22 October 2008. [Google Scholar]
- Øren, P.E.; Bakke, S. Process based reconstruction of sandstones and prediction of transport properties. Transp. Porous Media 2002, 46, 311–343. [Google Scholar] [CrossRef]
- Silin, D.B.; Jin, G.; Patzek, T.W. Robust determination of the pore space morphology in sedimentary rocks. In Proceedings of the SPE Annual Technical Conference and Exhibition, Denver, CO, USA, 5–8 October 2003. [Google Scholar] [CrossRef]
- Silin, D.; Patzek, T. Pore space morphology analysis using maximal inscribed spheres. Phys. A Stat. Mech. Its Appl. 2006, 371, 336–360. [Google Scholar] [CrossRef]
- Al-Kharusi, A.S.; Blunt, M.J. Network extraction from sandstone and carbonate pore space images. J. Pet. Sci. Eng. 2007, 56, 219–231. [Google Scholar] [CrossRef]
- Dong, H.; Blunt, M.J. Pore-network extraction from micro-computerized-tomography images. Phys. Rev. E 2009, 80, 036307. [Google Scholar] [CrossRef] [PubMed]
- Mason, G.; Morrow, N.R. Capillary behavior of a perfectly wetting liquid in irregular triangular tubes. J. Colloid Interface Sci. 1991, 141, 262–274. [Google Scholar] [CrossRef]
- Yu, K.F. Introduction to the Science of Coral Reefs; Science Press: Beijing, China, 2018. [Google Scholar]


| Rock Sample | Carbonate | Sandstone | ||||
|---|---|---|---|---|---|---|
| A | B | C | D | E | S | |
| Height (mm) | 104.45 | 99.47 | 99.57 | 99.44 | 99.46 | 99.91 |
| Diameter (mm) | 50.22 | 49.24 | 49.22 | 49.35 | 49.13 | 48.57 |
| Rock Sample | Carbonate | Sandstone | ||||
|---|---|---|---|---|---|---|
| A | B | C | D | E | S | |
| Pore network (%) | 23.41 | 7.71 | 9.32 | 8.51 | 7.35 | 1.06 |
| Solid (%) | 76.59 | 92.29 | 90.68 | 91.49 | 92.65 | 98.94 |
| Rock Sample | Carbonate | Sandstone | ||||
|---|---|---|---|---|---|---|
| A | B | C | D | E | S | |
| Porosity of REV1 (%) | 19.91 | 4.86 | 18.16 | 7.30 | 12.01 | 0.43 |
| Porosity of REV2 (%) | 23.99 | 8.58 | 7.59 | 5.85 | 6.73 | 0.83 |
| Porosity of REV3 (%) | 28.48 | 5.13 | 10.30 | 6.63 | 4.36 | 2.05 |
| Rock Sample | Carbonate | Sandstone | ||||
|---|---|---|---|---|---|---|
| A | B | C | D | E | S | |
| Number of pores | 4335 | 6001 | 1042 | 4651 | 6464 | 2708 |
| Number of throats | 4395 | 6167 | 1013 | 3889 | 5261 | 264 |
| Maximum radius of pore (μm) | 1573.95 | 1698.91 | 1374.45 | 1025.14 | 783.52 | 146.39 |
| Average radius of pore (μm) | 193.50 | 130.71 | 174.82 | 127.85 | 122.81 | 44.37 |
| Maximum radius of throat (μm) | 1044.66 | 1501.23 | 1372.71 | 776.15 | 670.09 | 91.18 |
| Average radius of throat (μm) | 127.04 | 66.25 | 114.26 | 77.11 | 64.55 | 23.57 |
| Maximum length of throat (μm) | 1783.67 | 1538.80 | 1615.36 | 1678.78 | 1123.81 | 155.19 |
| Average length of throat (μm) | 312.81 | 195.86 | 278.93 | 230.03 | 205.19 | 63.82 |
| Maximum pore–throat aspect ratio | 54.84 | 37.26 | 35.81 | 27.09 | 33.19 | 19.14 |
| Average pore–throat aspect ratio | 2.04 | 2.33 | 2.07 | 2.06 | 1.86 | 0.48 |
| Maximum volume of pore (μm3) | 6.04 × 10¹⁰ | 1.03 × 10¹¹ | 1.14 × 10¹¹ | 2.32 × 10¹⁰ | 2.08 × 10¹⁰ | 1.15 × 10⁸ |
| Average volume of pore (μm3) | 7.59 × 10⁸ | 1.94 × 10⁸ | 9.96 × 10⁸ | 1.70 × 10⁸ | 1.38 × 10⁸ | 3.68 × 10⁶ |
| Maximum volume of throat (μm3) | 5.55 × 10⁹ | 2.24 × 10⁹ | 8.61 × 10⁹ | 1.67 × 10⁹ | 2.52 × 10⁹ | 1.36 × 10⁷ |
| Average volume of throat (μm3) | 7.19 × 10⁷ | 1.79 × 10⁷ | 1.02 × 10⁸ | 2.07 × 10⁷ | 1.82 × 10⁷ | 6.94 × 10⁵ |
| Maximum coordination number | 28 | 48 | 23 | 27 | 29 | 3 |
| Average coordinate number | 1 | 1 | 1 | 1 | 1 | 0.1 |
Publisher’s Note: MDPI stays neutral with regard to jurisdictional claims in published maps and institutional affiliations. |
© 2022 by the authors. Licensee MDPI, Basel, Switzerland. This article is an open access article distributed under the terms and conditions of the Creative Commons Attribution (CC BY) license (https://creativecommons.org/licenses/by/4.0/).
Share and Cite
Liu, H.; Ma, C.; Zhu, C. X-ray Micro CT Based Characterization of Pore-Throat Network for Marine Carbonates from South China Sea. Appl. Sci. 2022, 12, 2611. https://doi.org/10.3390/app12052611
Liu H, Ma C, Zhu C. X-ray Micro CT Based Characterization of Pore-Throat Network for Marine Carbonates from South China Sea. Applied Sciences. 2022; 12(5):2611. https://doi.org/10.3390/app12052611
Chicago/Turabian StyleLiu, Haifeng, Chenghao Ma, and Changqi Zhu. 2022. "X-ray Micro CT Based Characterization of Pore-Throat Network for Marine Carbonates from South China Sea" Applied Sciences 12, no. 5: 2611. https://doi.org/10.3390/app12052611
APA StyleLiu, H., Ma, C., & Zhu, C. (2022). X-ray Micro CT Based Characterization of Pore-Throat Network for Marine Carbonates from South China Sea. Applied Sciences, 12(5), 2611. https://doi.org/10.3390/app12052611