1. Introduction
Smart Manufacturing System (SMS) is a vast field to be explored in the domain of Industry 4.0, even as it presents several advantages compared to conventional manufacturing systems. Thus, it is progressively being adopted by manufacturing industry players as a strategic method to enhance their performance, even when SMS is an expensive approach compared to the conventional system [
1]. Many studies have been done in the past to explore the technical aspects in the development of a new SMS [
1,
2,
3,
4,
5,
6,
7,
8,
9,
10,
11,
12,
13]. However, very limited studies have been conducted on investigating the configuration challenges when establishing new SMS [
7,
14,
15,
16] that requires pre-implementation planning and assessment. Specifying a correct SMS configuration prior to the costly implementation could assist industry players in planning and establishing a new SMS that minimizes the operational cost and time and improves efficient machine utilization.
In Industry 4.0, SMS is moving towards human-machine collaboration, and autonomous response is moving towards robot deployment to replace human intervention in smart manufacturing systems [
11]. Extensive research was conducted in terms of having proper test methods for this smart manufacturing. This sheds light on the importance of evolving smart manufacturing systems involving adequate intelligent aspects to operate autonomously without human intervention [
11,
16]. The smart manufacturing environment can be envisioned as an environment that allows communication between humans and machines, and the system’s success lies in the way the configuration is adopted.
Due to the increasing demand by consumers for continuously innovative and higher quality products and for affordable prices and product immediacy, market players constantly come under pressure to make well-informed decisions while establishing a new SMS that requires pre-implementation planning and assessment. This proper pre-implementation planning aspect has been given little attention, despite it being the core of the manufacturing success as former research works such as a hybrid simulation-based assessment and agent-based modeling framework for smart manufacturing systems (SMS) focused mainly on assisting decision-makers in designing better configurations based on the establishment of appropriate information messaging protocols between system components using hybrid simulation modeling [
7]. This assessment should be based on measured values using systematic approaches to stay ahead in the industry with high sustainability constantly. Clear and concise evaluation factors play key roles in any Smart Manufacturing System’s configurations as each contributes to the level of success of the manufacturing products. Therefore, identifying evaluation factors to develop a coherent evaluation framework aids decision-makers in selecting the correct configuration.
In this study, priority will be given to assessing the relationship between evaluation factors based on multiple configuration setups using the Fuzzy Logic approach instead of the Boolean Logic approach. Fuzzy Logic is an approach to computing based on decrees of truth in a similar way our brain works, whereas the Boolean Logic approach is focused more on probability theory. The Boolean Logic approach is limited to 0 or 1; however, the Fuzzy Logic approach provides the flexibility for decision making based on uncertainty or possibilities, which is what is needed for this research work as this research work is conducted to capture the possible outcome based on manipulated configurations [
17]. Unlike the Boolean approach, the Fuzzy Logic approach has the capability of reasoning and computing with perception-based information [
18,
19]. It can imitate an experience or mimic a human mind to produce the best results as per the reasoning proposed in the simulation. Fuzzy Logic provides an efficient way for designing a simulation based on various variable inputs that control the development for a proposed model [
20]. The fuzzy approach is best used to identify crucial factors influencing machine selection and machine reconfiguration in a manufacturing environment to allow efficient decision-making [
21]. Fuzzy Logic can be described as a human-like representation in software to produce almost accurate solutions when faced with unfamiliar tasks based on presented principles [
19,
20]. As proposed by Tom Drews, future research using the Fuzzy Logic approach can be conducted on additional aspects concerning the management of manufacturing systems [
22]. Therefore, the Fuzzy Logic approach is adapted for this research work on SMS configurations.
The significance of this study can be seen from various perspectives. Firstly, this research will enable researchers to be aware of the most critical factors influencing a manufacturing environment. Thus, more priority can be given to these identified factors in terms of any future studies. Secondly, the formulated evaluation framework will enable effective measurement of the factors based on multiple configurations. Lastly, the best configuration can be identified from the evaluation process proposed in this paper, which can assist manufacturers in making well-informed decisions, especially in cost estimations.
2. SMS Evaluation Factors
Several factors contributing to the evaluation of smart manufacturing systems have been identified from reviewing the literature as shown in
Table 1. The factors are quality, lead time, cost, productivity, and environmental impact. Besides, there are underlying indicators that directly control the factors. For example, the Quality factor is influenced by the design and the cost as per research in the past studies on this factor [
23,
24,
25,
26]. On the other hand, the Cost factor is influenced by the resources used, such as the materials, labor, machines, and tooling [
27,
28]. Lead time is being controlled by the product’s input, process, and transportation time [
17,
29]. Productivity is being influenced by the indicators such as Six Sigma, human factors, and engineering methods [
26,
27]. Lastly, Environmental Impact is being ruled out by various indicators such as compressed air, electricity for machining, metalworking factory, electricity for cooling, heating, and transportations [
28,
29].
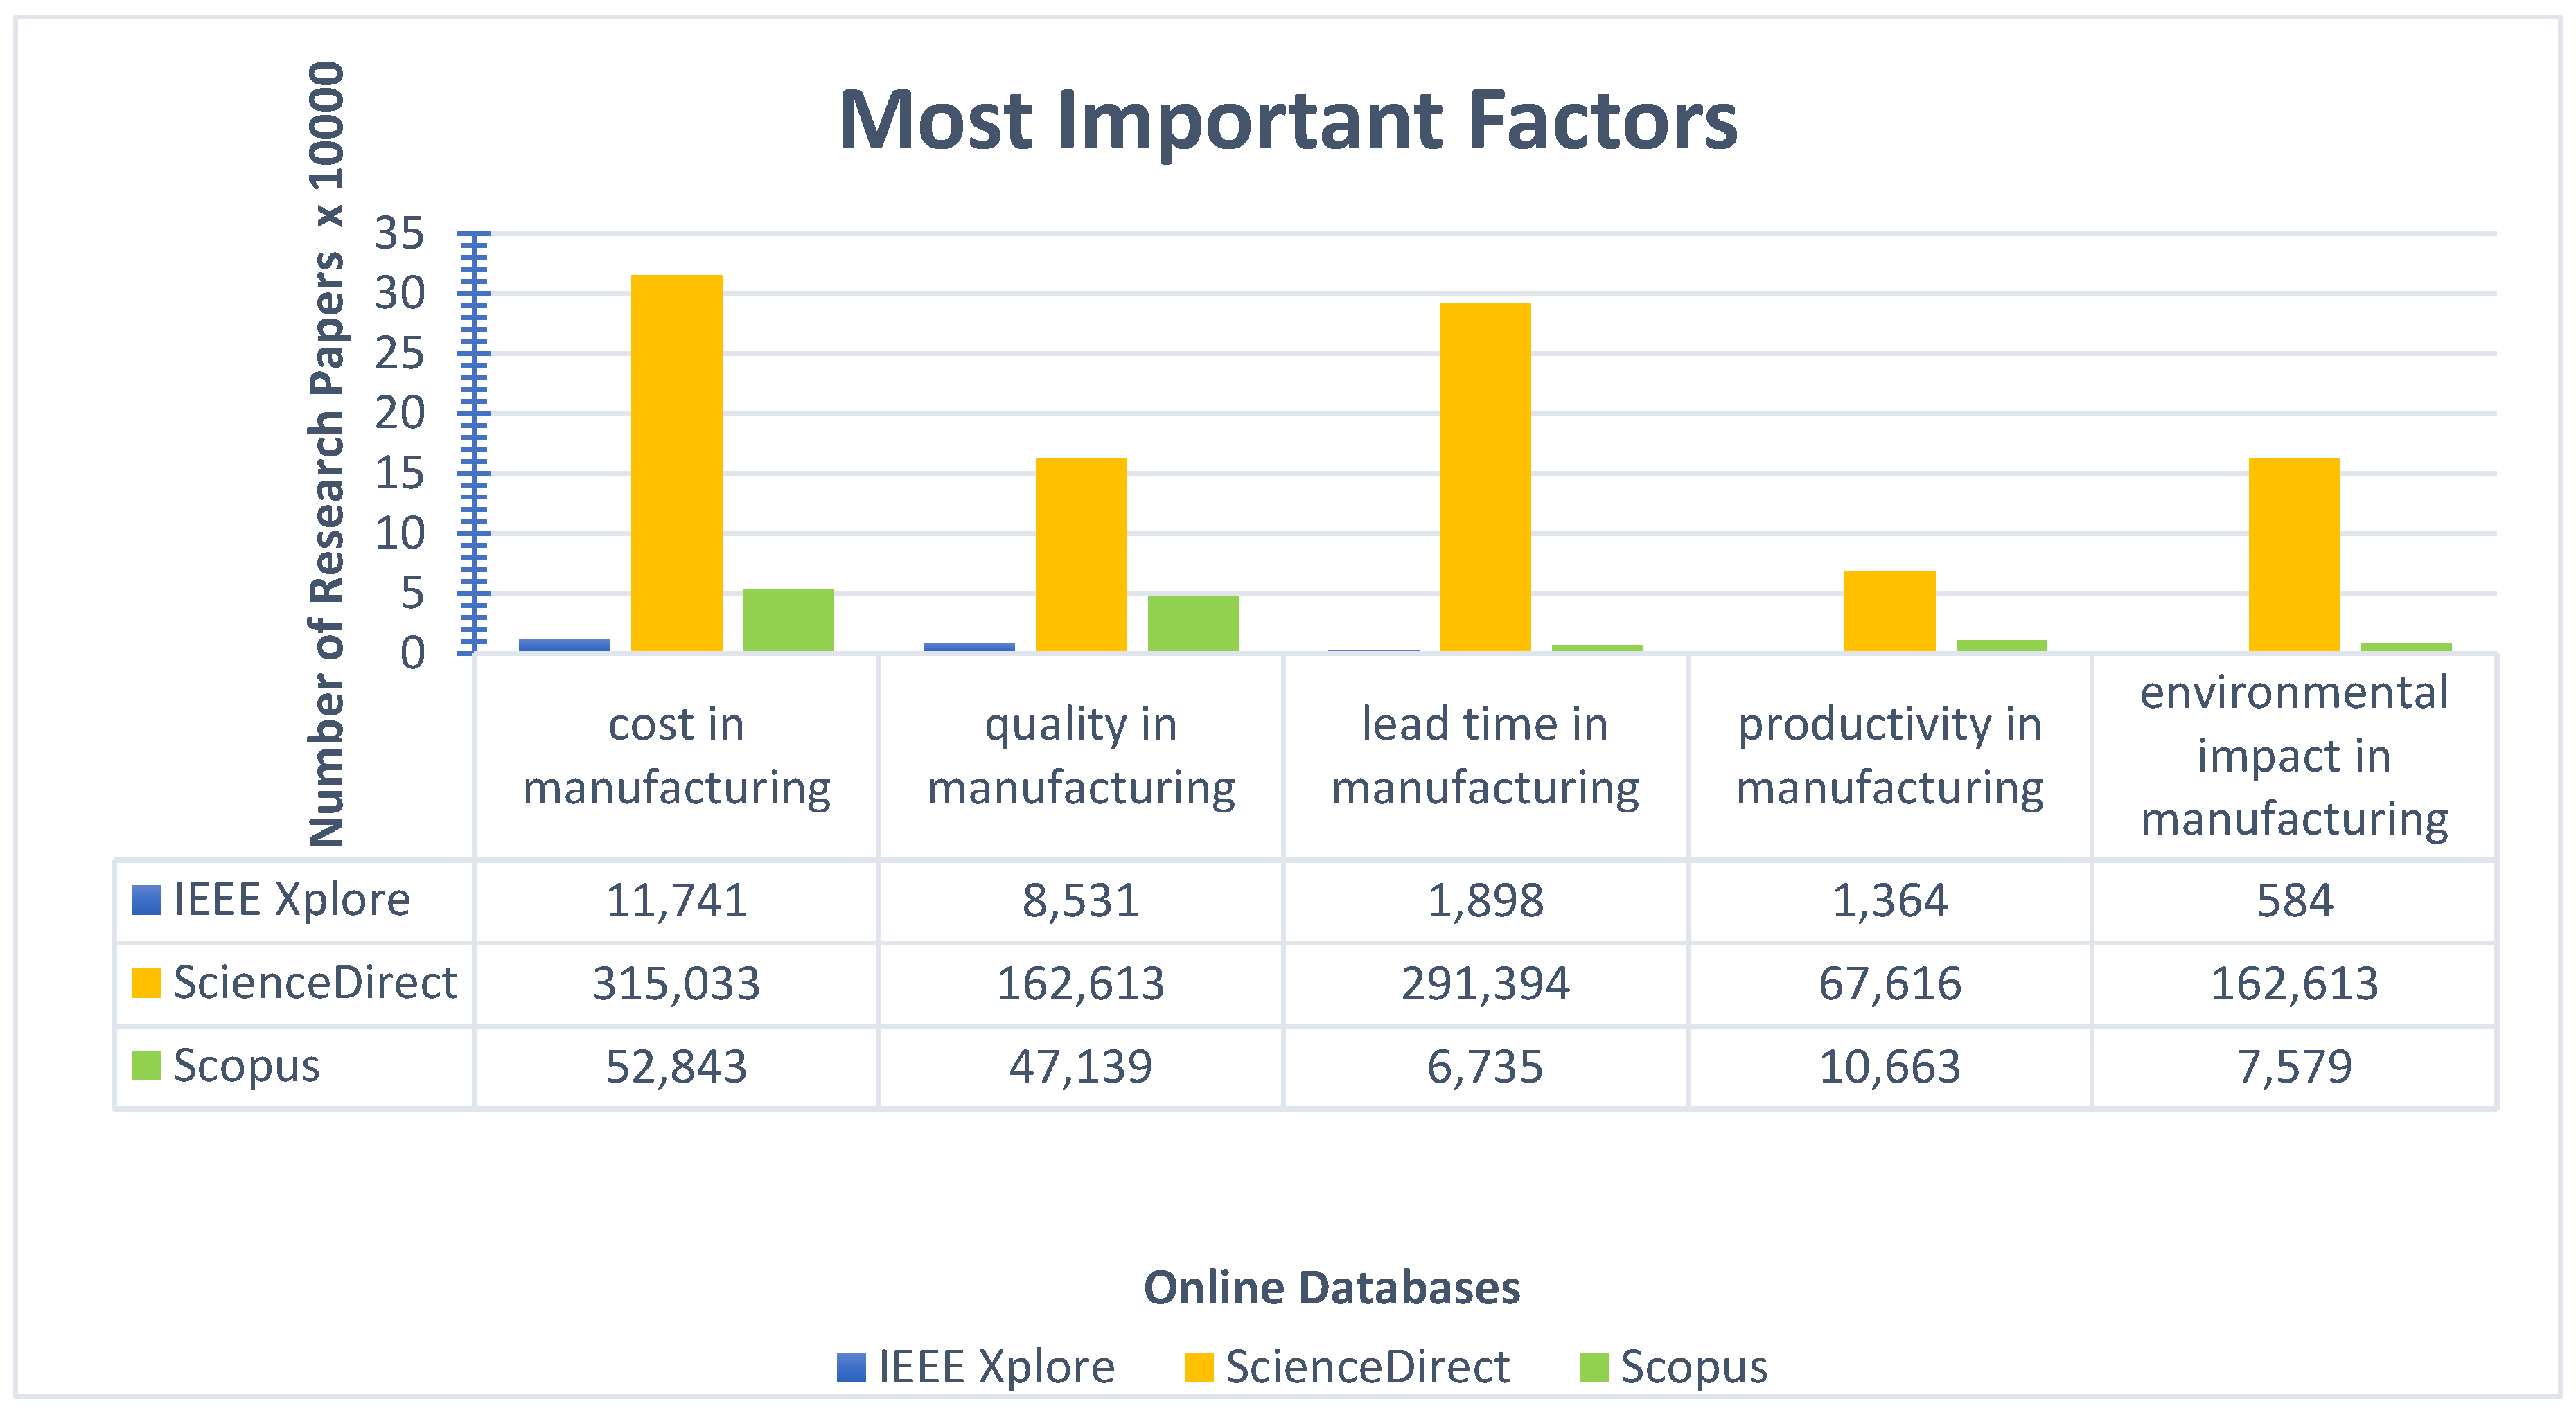
To determine the most critical factors (among the identified five factors) that substantially contribute to evaluating SMS configurations before implementation, we conducted a comprehensive search in three databases IEEE Xplorer, Science Direct, and Scopus. The search keywords are “Quality in manufacturing”, “Lead time in manufacturing”, “Cost in manufacturing”, “Productivity in manufacturing”, and “Environmental impact in manufacturing” are used. These keywords are used to identify the amount of research work performed in the past based on these factors. However, the research contents from the papers discovered based on these keywords were further studied in this research work. The duration taken was ten years, which is from the year 2011 until the year 2021. The reason for these ten years period is to identify the trend of transformation over a decade in the field of manufacturing, thus enabling us to recognize the key factors influencing this transformation process in the manufacturing industry.
As shown via the graphical display of
Figure 1, many research studies have been conducted on cost, then followed by quality, and Lead time, subsequently followed by Productivity and Environmental Impact, respectively. This sequence has been seen in the IEEE Xplore database based on the number of published research papers. In the Science Direct database, a similar trend is seen for Cost but Lead time overtakes quality, followed by Environmental Impact and Productivity sequentially. Based on the captured data from these three different online databases, it can be said that the cost of manufacturing is a key indicator in a manufacturing environment, followed by Quality and Lead time. Priority has been given to these three factors as compared to Productivity and Environmental Impact. Thus, this finding signifies the importance of Cost, Quality, and Lead time in manufacturing systems.
Besides the gap found in the formulation of the configuration evaluation factors, another gap that has been identified through this literature review is that studies lack clear measurement on the influence of each factor on another, which will directly impact the cost estimation of establishing a new SMS in the manufacturing industry [
30,
31,
32]. This research aims to bridge the gap by formulating a model that generates SMS configurations in order to measure the relationship in given configuration settings, which will be developed using the Fuzzy Logic approach. Besides, as shown statistically in
Figure 1, priority has been given to Cost, Quality, and Lead time factors. More studies have been conducted using these factors as a basis for the research related to the manufacturing industry. Therefore, these three chosen factors will be further analyzed using Fuzzy Logic.
3. The Proposed Evaluation Model
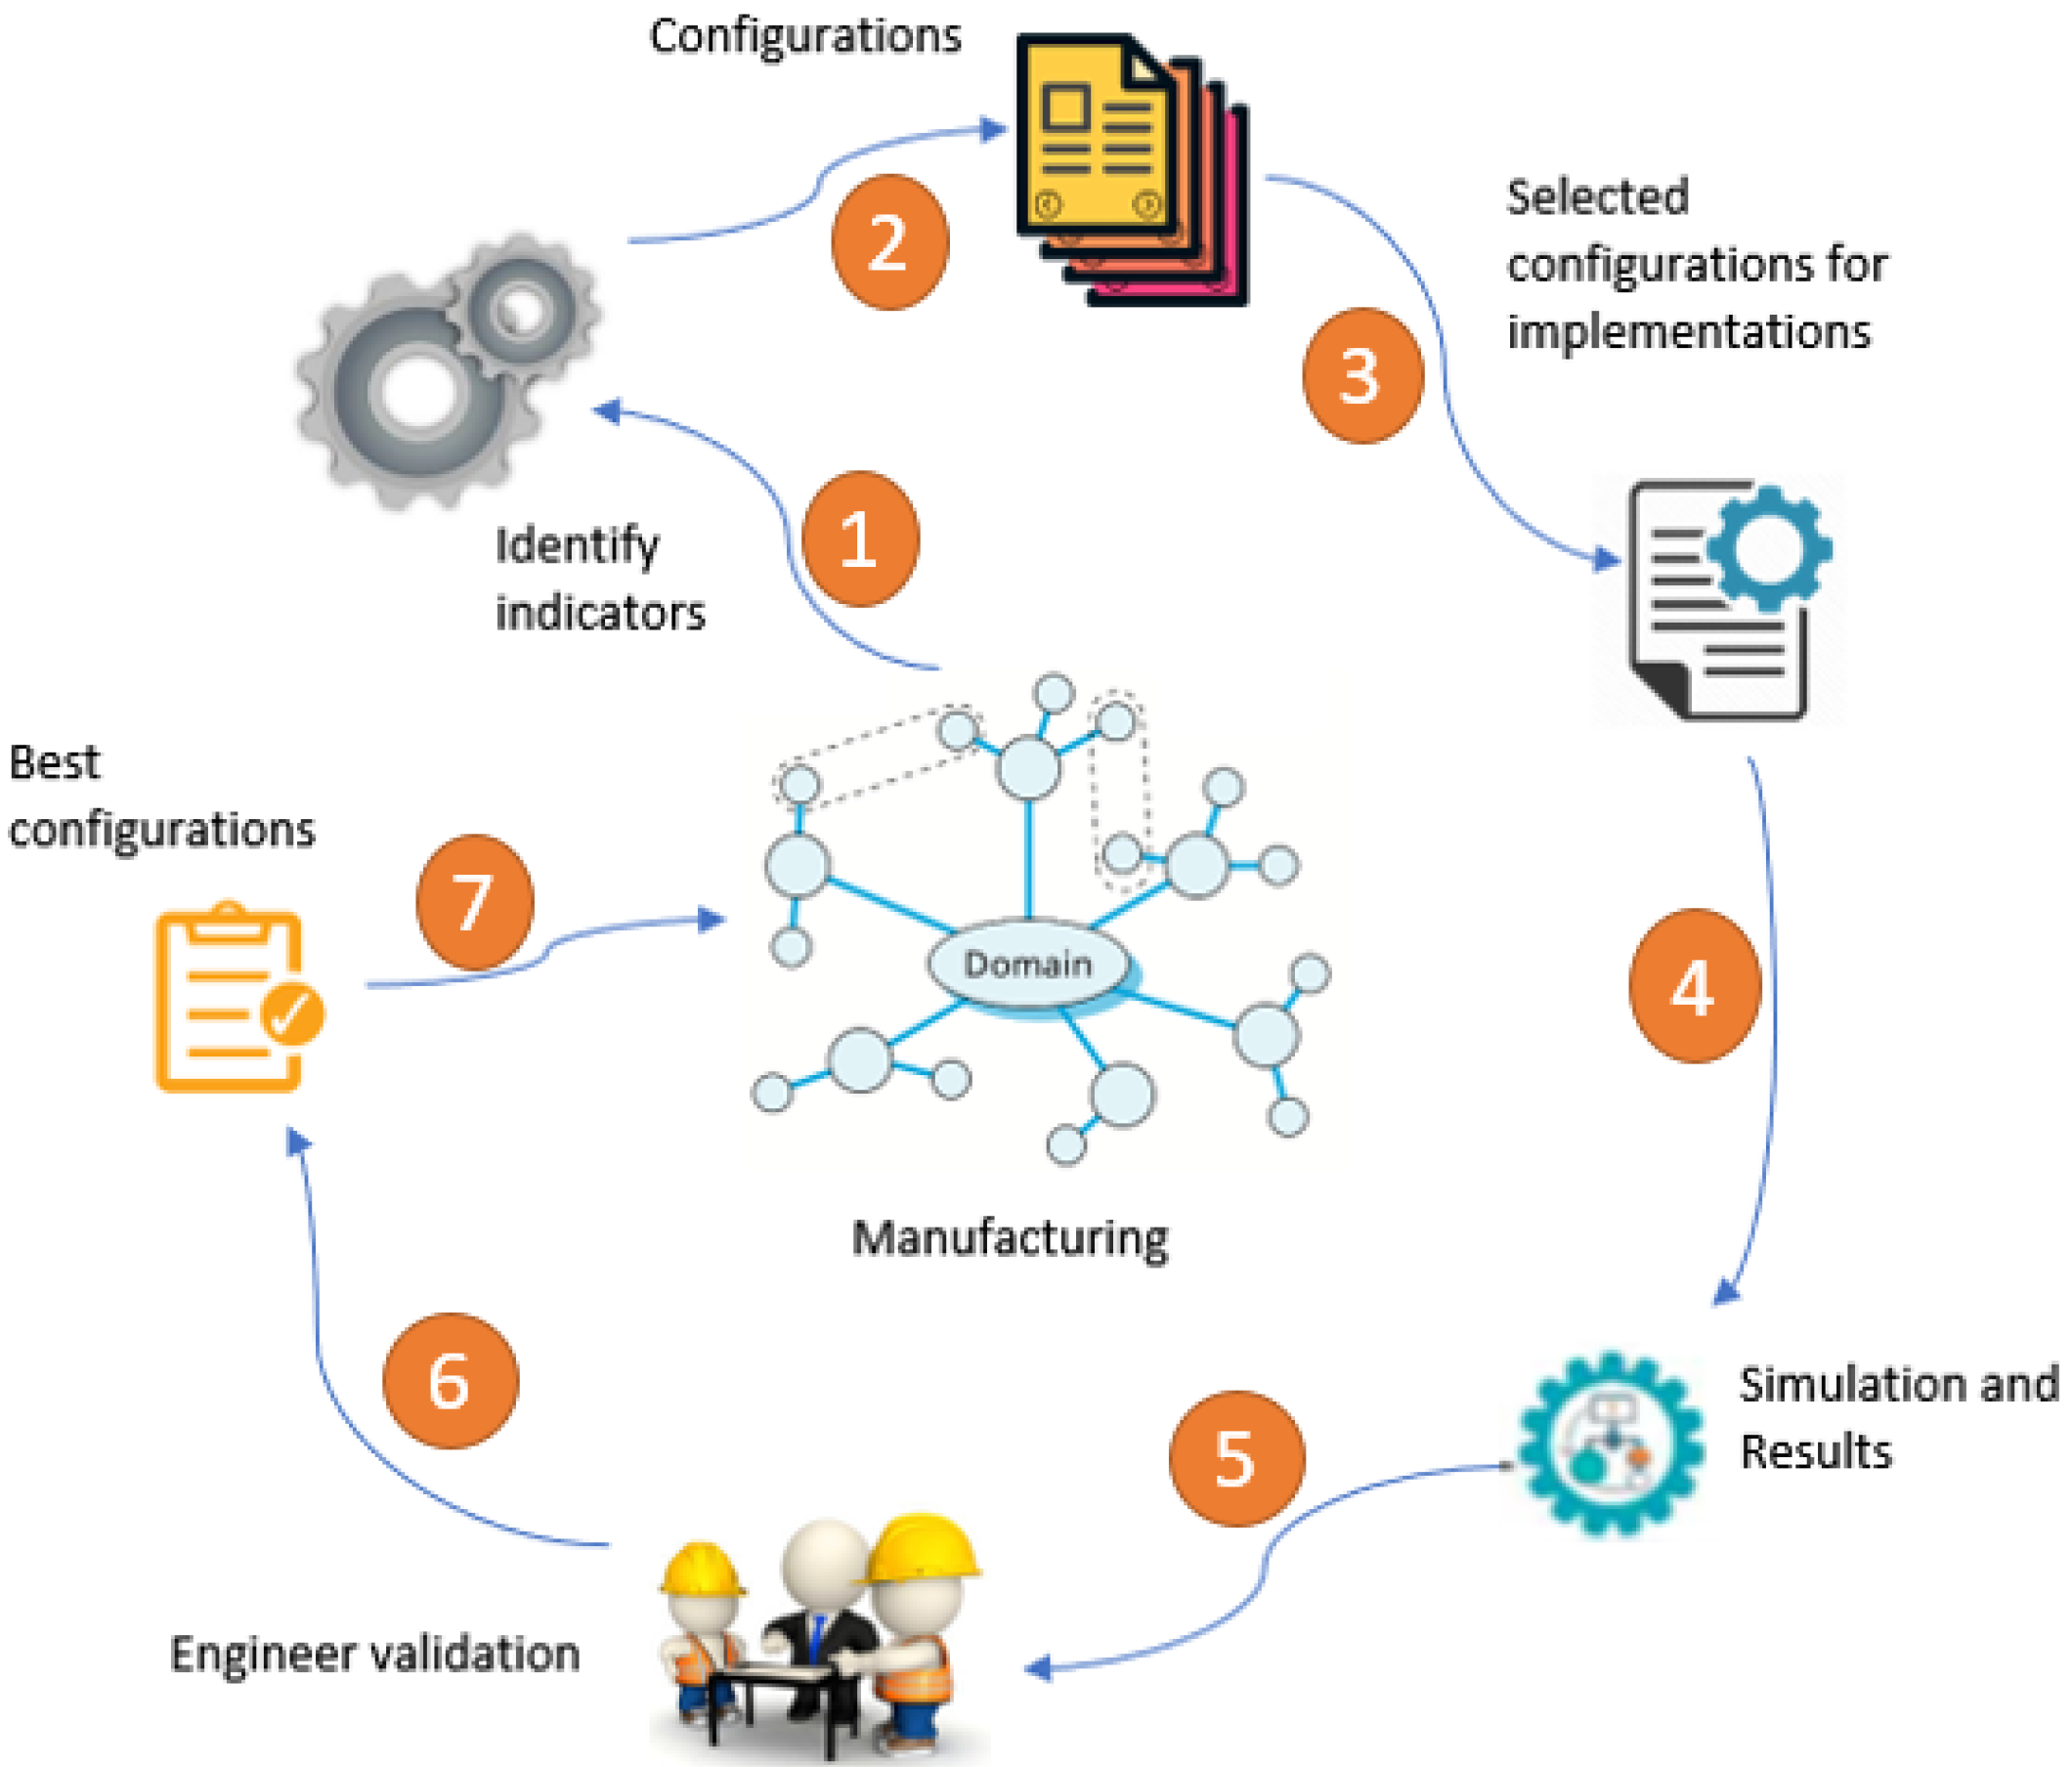
The main objective of the proposed model is to evaluate the available configurations using the proposed model in this study to recommend one of them for implementation.
Figure 2 explains the evaluation model further in detail. The factors are identified from the literature in the manufacturing domain. Few configuration setups are proposed from existing real cases. To evaluate the factors in proposition to the various setups, Lead time is used as the key factor. This factor is believed to be one of the influencing factors in the SMS configuration setup based on the literature review. The different results obtained for cost estimation based on how this factor affects other factors, such as cost and quality, are evaluated through multiple configuration testing. Subsequently, factors go through evaluation using Fuzzy Logic rules simulation. Finally, the results will be presented to the actual field engineers for validation purposes. Based on the engineers’ recommendation, the best configuration will be determined and proposed to be used in manufacturing setups. The sequence of the steps is denoted with sequential numbers, as shown in
Figure 2 below.
4. SMS Configurations Setup
This section explains how the inter-relation between factors is evaluated based on the conventional setups in manufacturing.
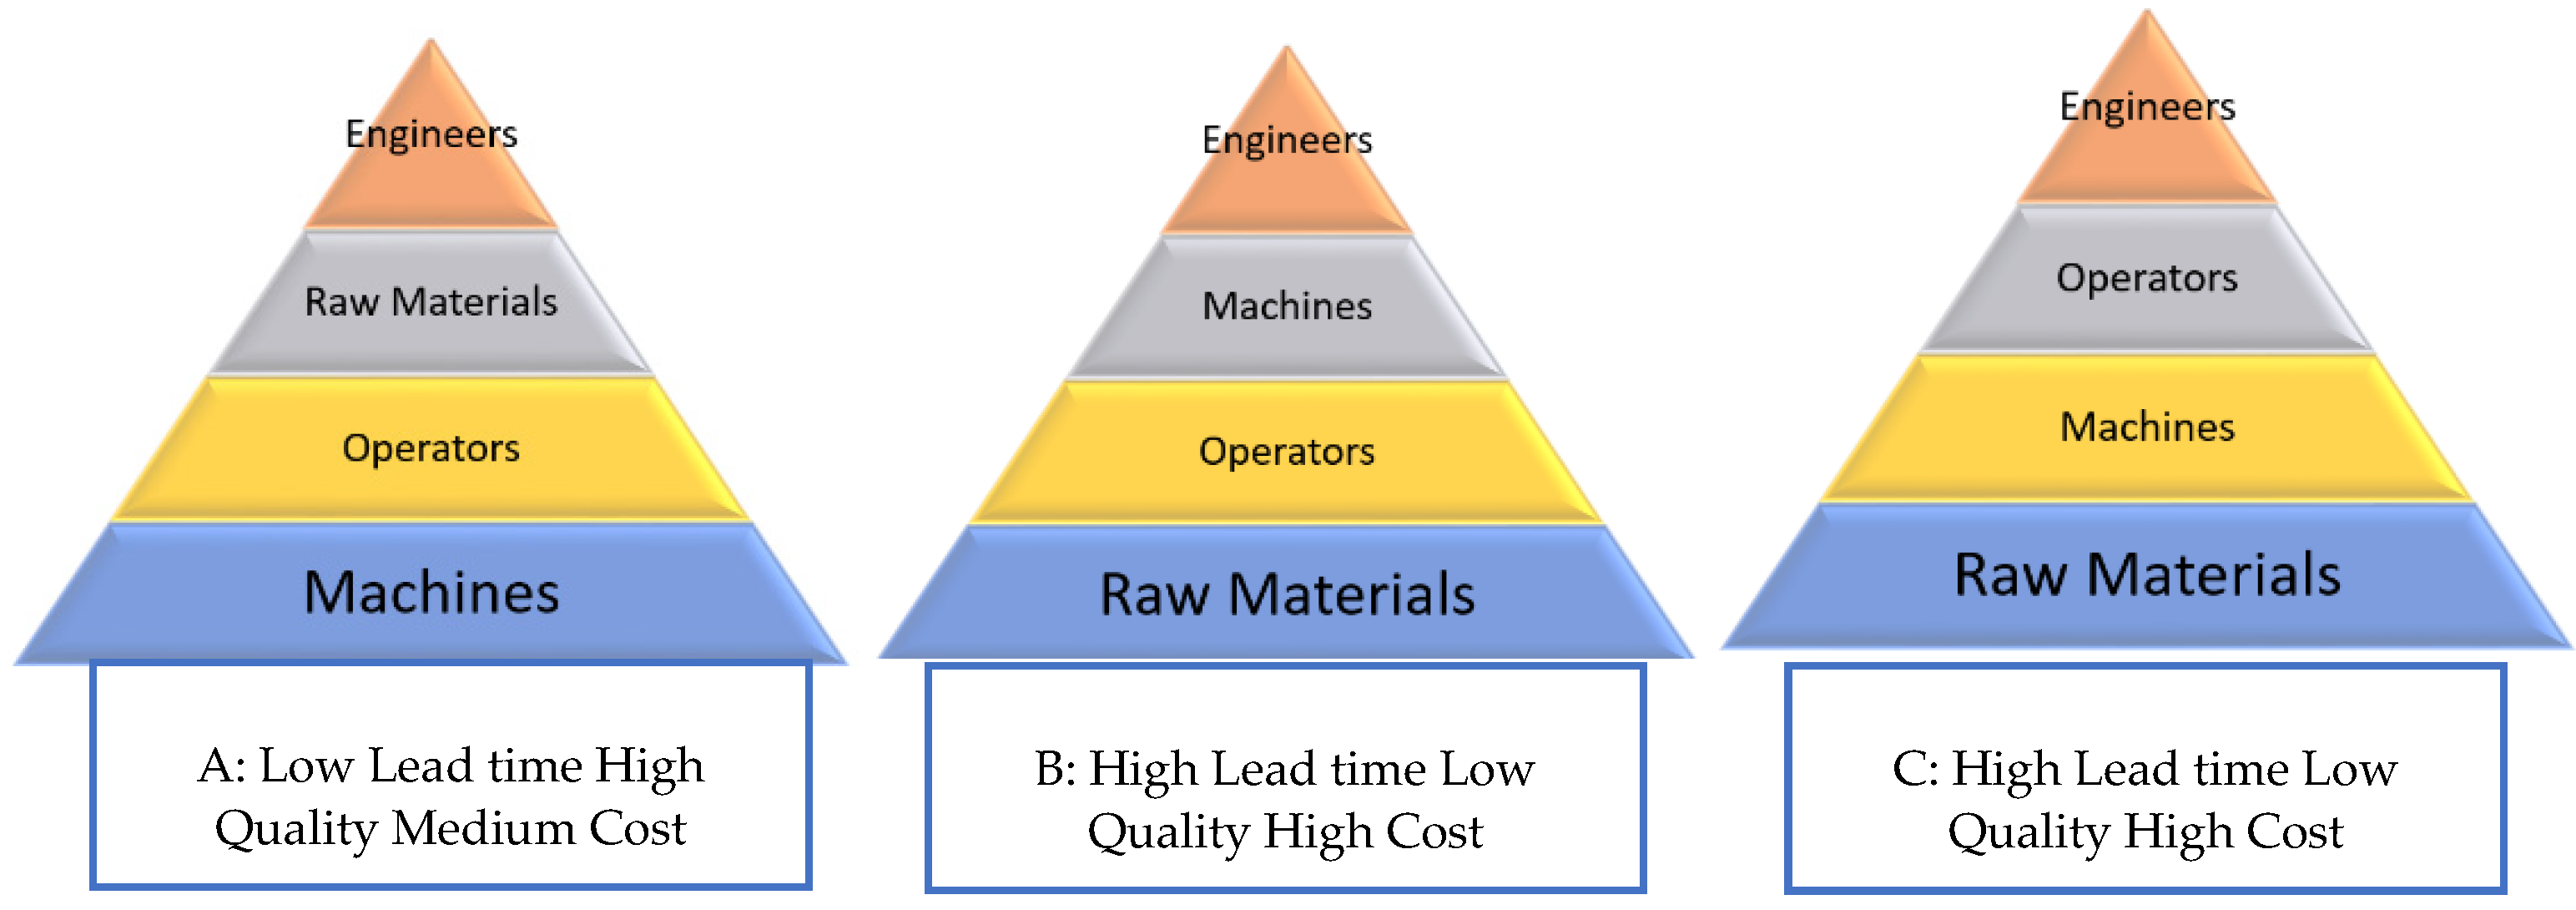
Figure 3 below shows various setups that can be seen in any manufacturing environment. These setups have direct implications on the Lead time, Quality, and Cost of the products. In setup A, the number of machines is higher than the number of raw materials, which will directly cause most of the machines to be unutilized. The lead time will be low as fewer products are processed; thus, the quality is assumed to be high with medium cost. In setup B, the number of raw materials is higher than the machines available to process it, and the number of operators who will operate the machines is also lower. Thus, this will cause the lead time to be high as the waiting period for each raw material will increase logically. The end product is assumed to be of low quality with high cost, as the cost that occurred to purchase raw materials has to be covered with the selling cost.
In setup C, the lead time will be high as the number of machines available to process the raw materials is extremely low. Thus, this will contribute to the low quality of products as some raw materials may get spoiled or even have to be disposed of to waste during the waiting period. The cost will be high in this case. These different setups are just the norm in any manufacturing industry, depending on the various circumstances that may arise at any given time. However, we will not only assess the impact of one factor on another by the following setups only, but we will also assess it from every possible logical value for each factor, using Lead time as the key indicator, in determining the impact it has on Low, Medium, and High value of Quality and Cost, respectively.
4.1. Fuzzy Logic Model for Criteria Evaluation
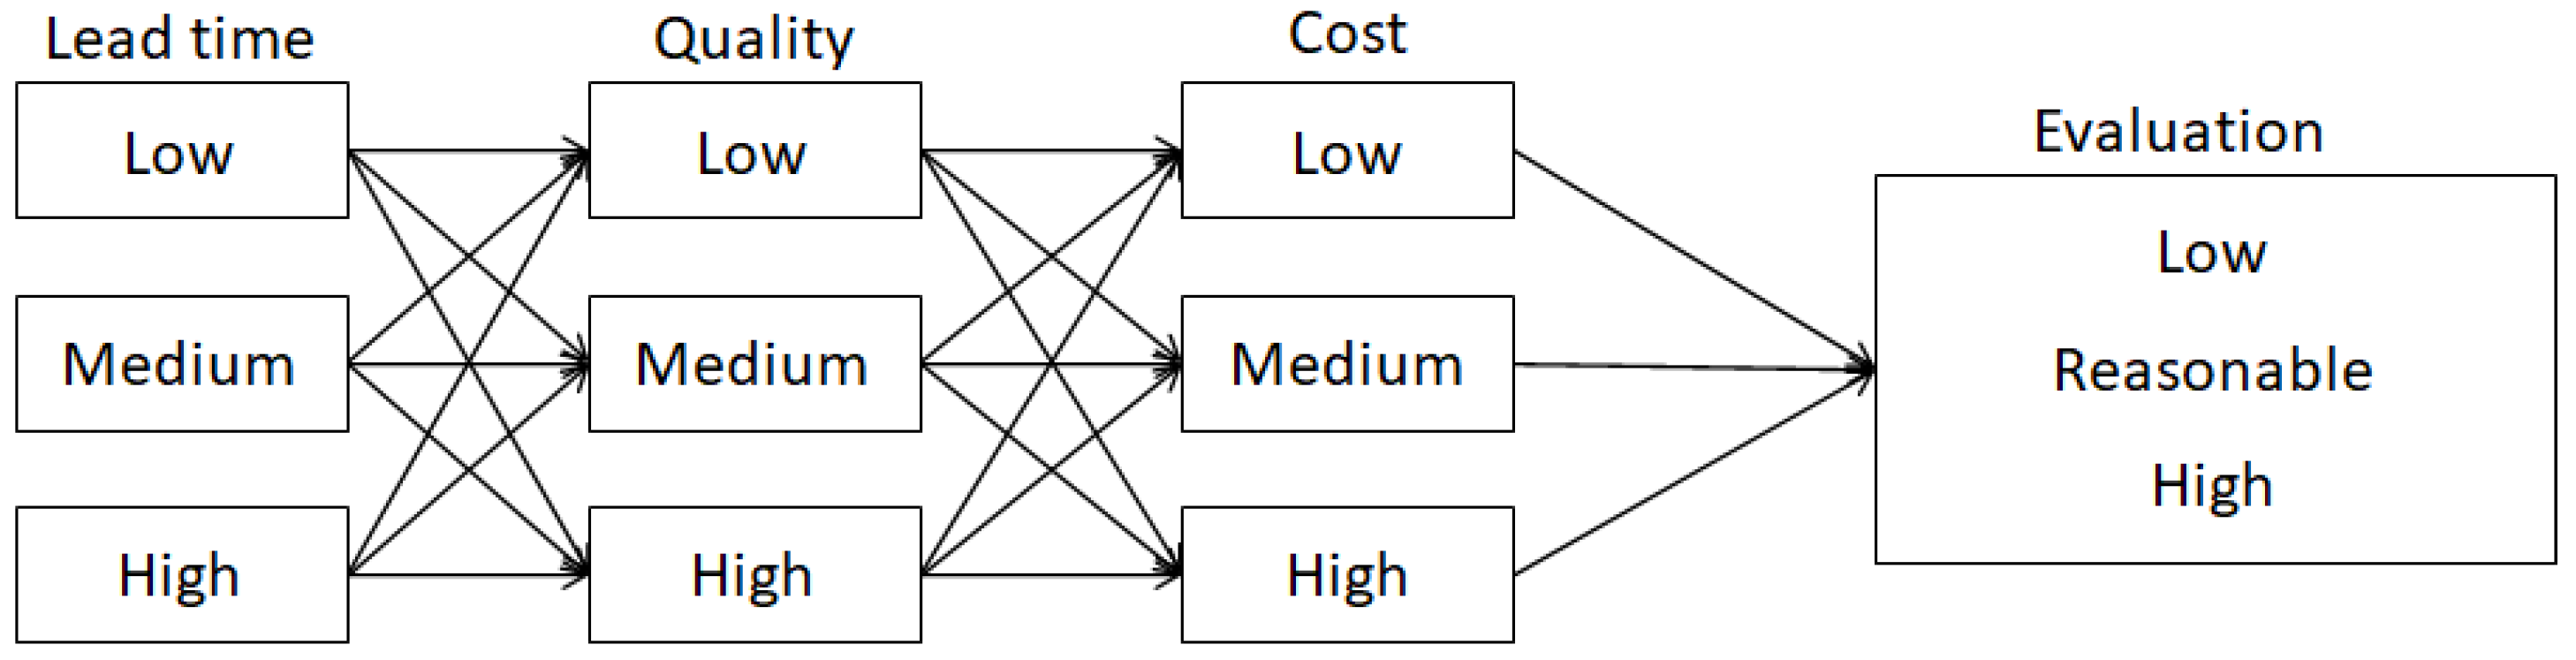
This section draws the evaluation configuration model using the Fuzzy Logic approach, as shown in
Figure 4. This high-level view of the Fuzzy Logic approach illustrates the possible hypothesis that can be considered for the different configuration types for the proposed evaluation model. Based on the measured hypothesis from the model, engineers can deduce the possible justification for the cost estimation.
Figure 4 shows how each value of Lead time will be further tested with each value of Quality and Cost to determine if the cost justification is based on Low, Reasonable and High value. The rules for Fuzzy Logic are derived from the above diagram for each factor, and this will be further explained in the next section.
4.2. Fuzzy Logic Configurations
This section will show the setup of the membership functions for each input and output variable. Then, the rules defined in Fuzzy Logic to determine the Cost Justification are shown, together with some sample results based on the prescribed rules and analysis, for three types of configurations with the Lead time value in a single Fuzzy Logic Model. Lead time as the Low, Medium, and High-value input variable will be the key variable to affect the other input variables towards the Cost Justification output.
4.2.1. The Setting of Membership Functions (MF)
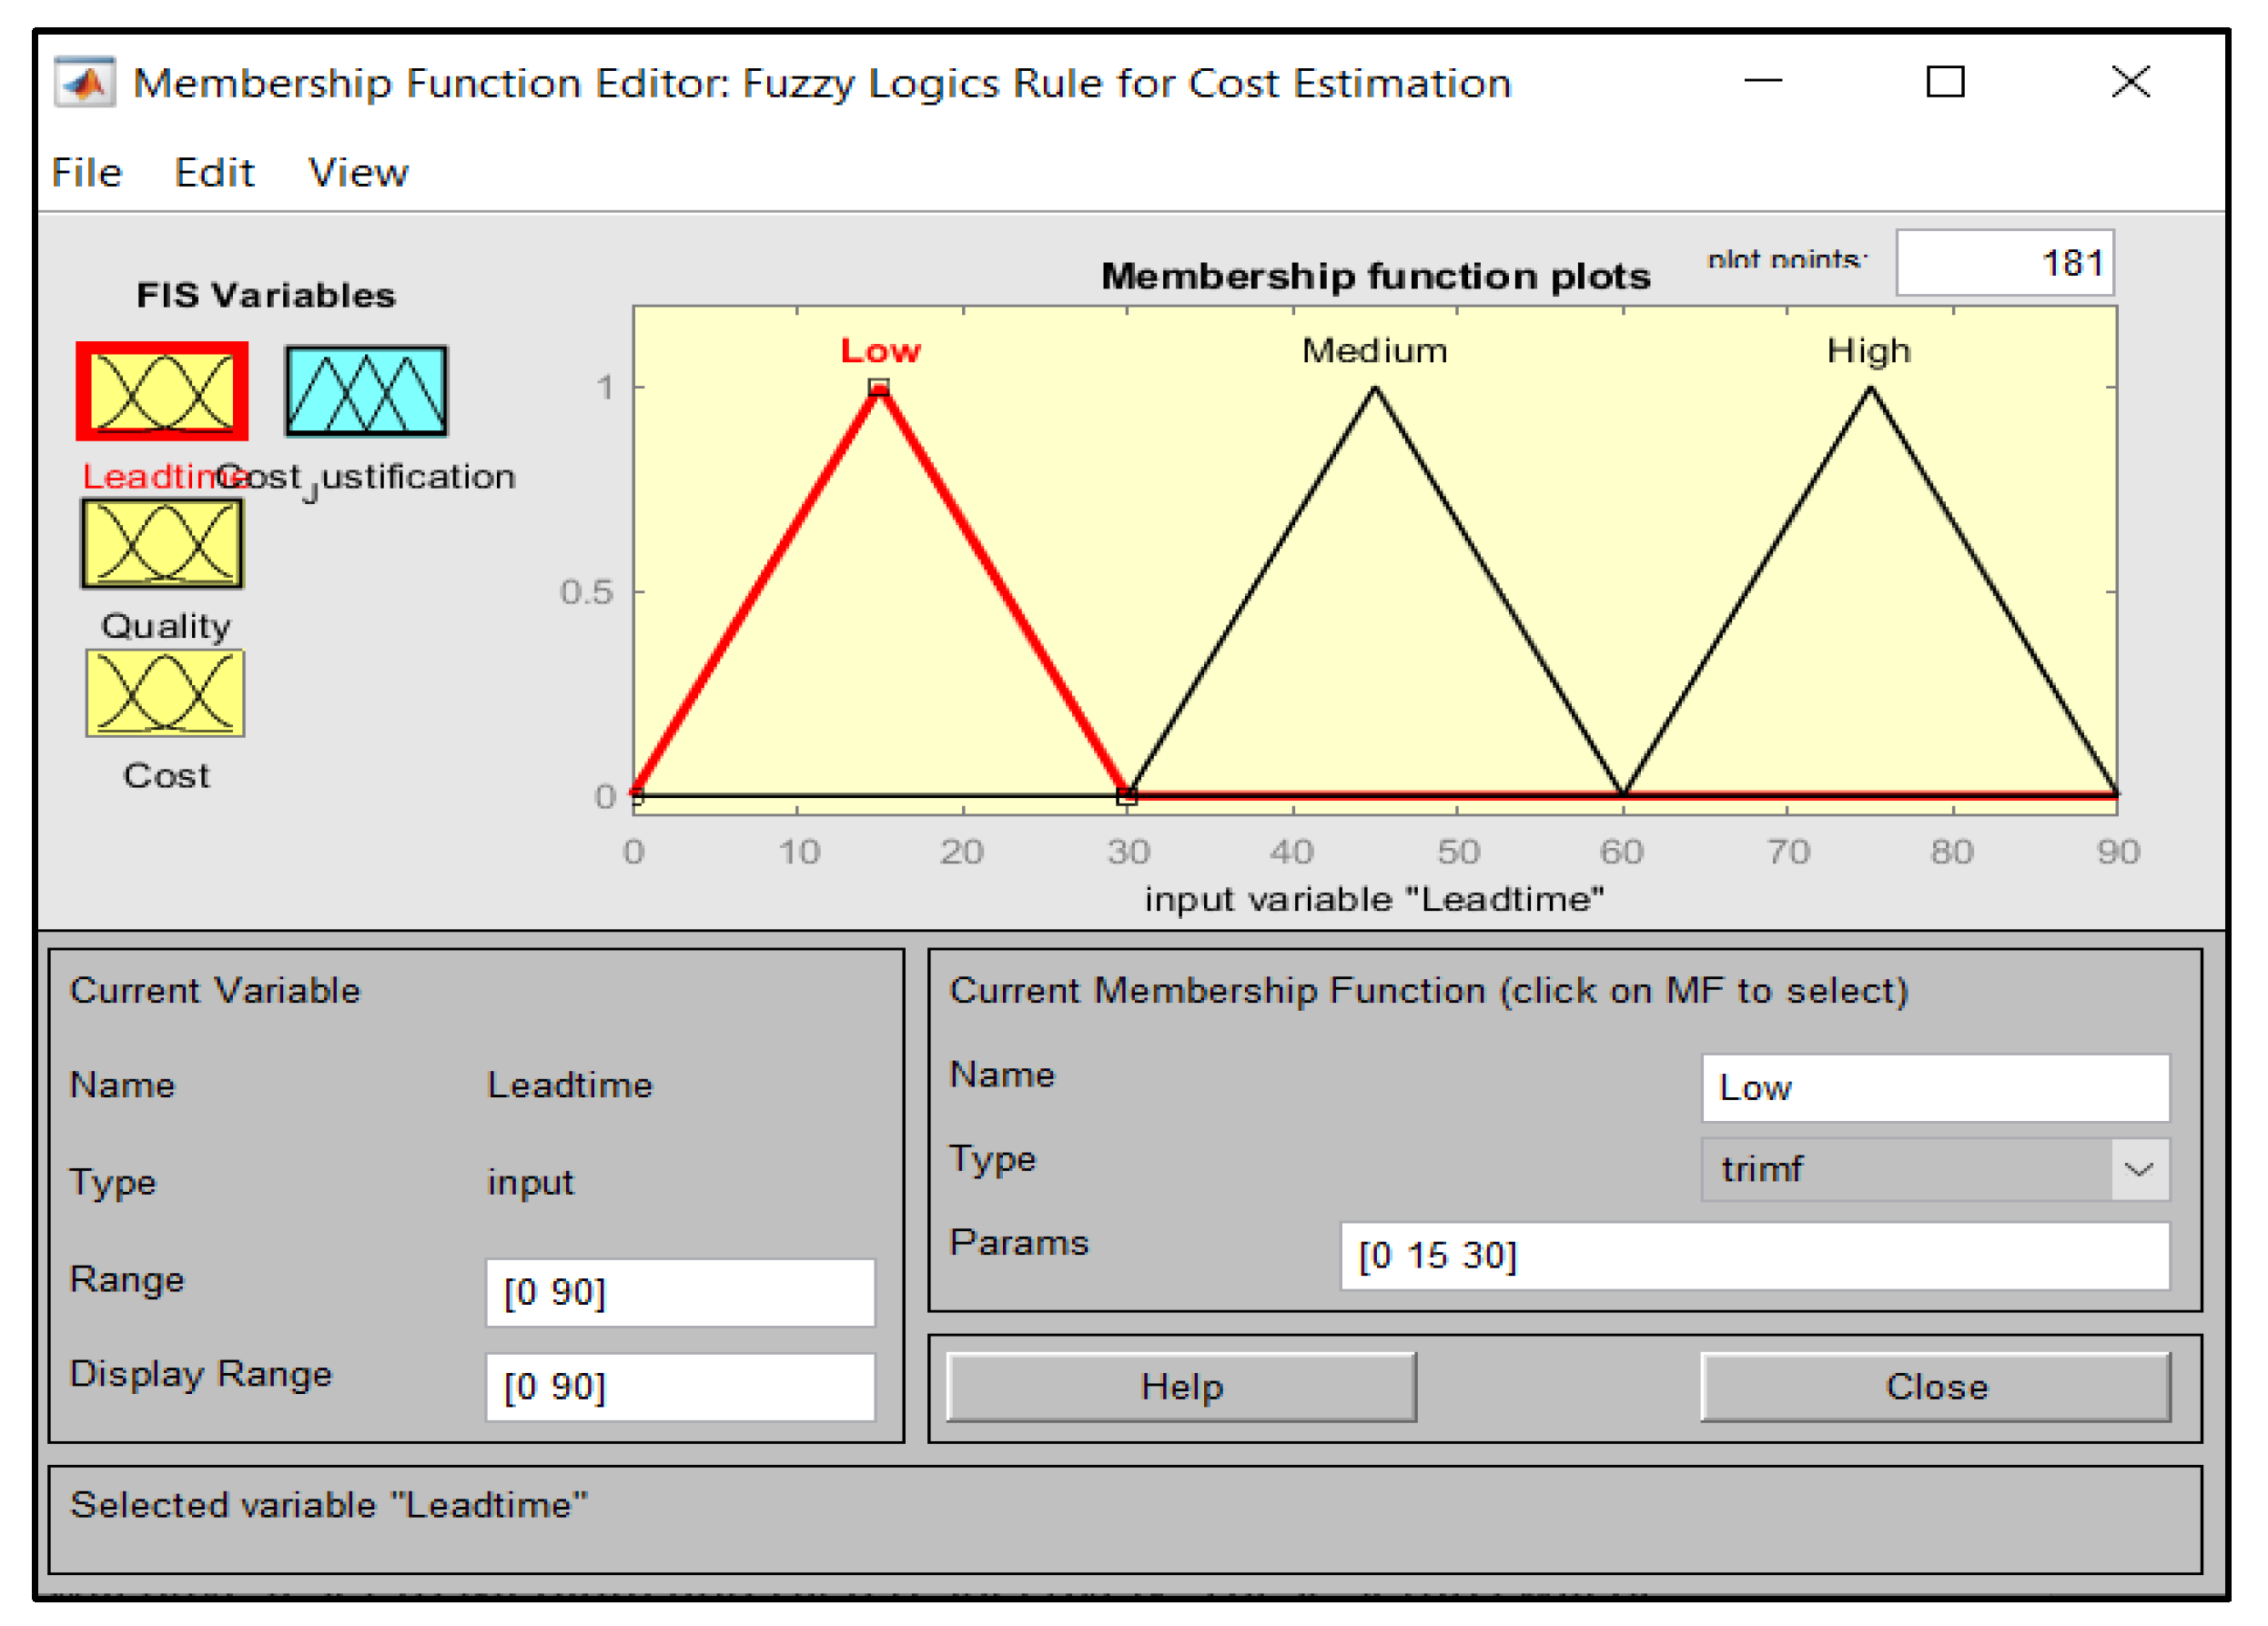
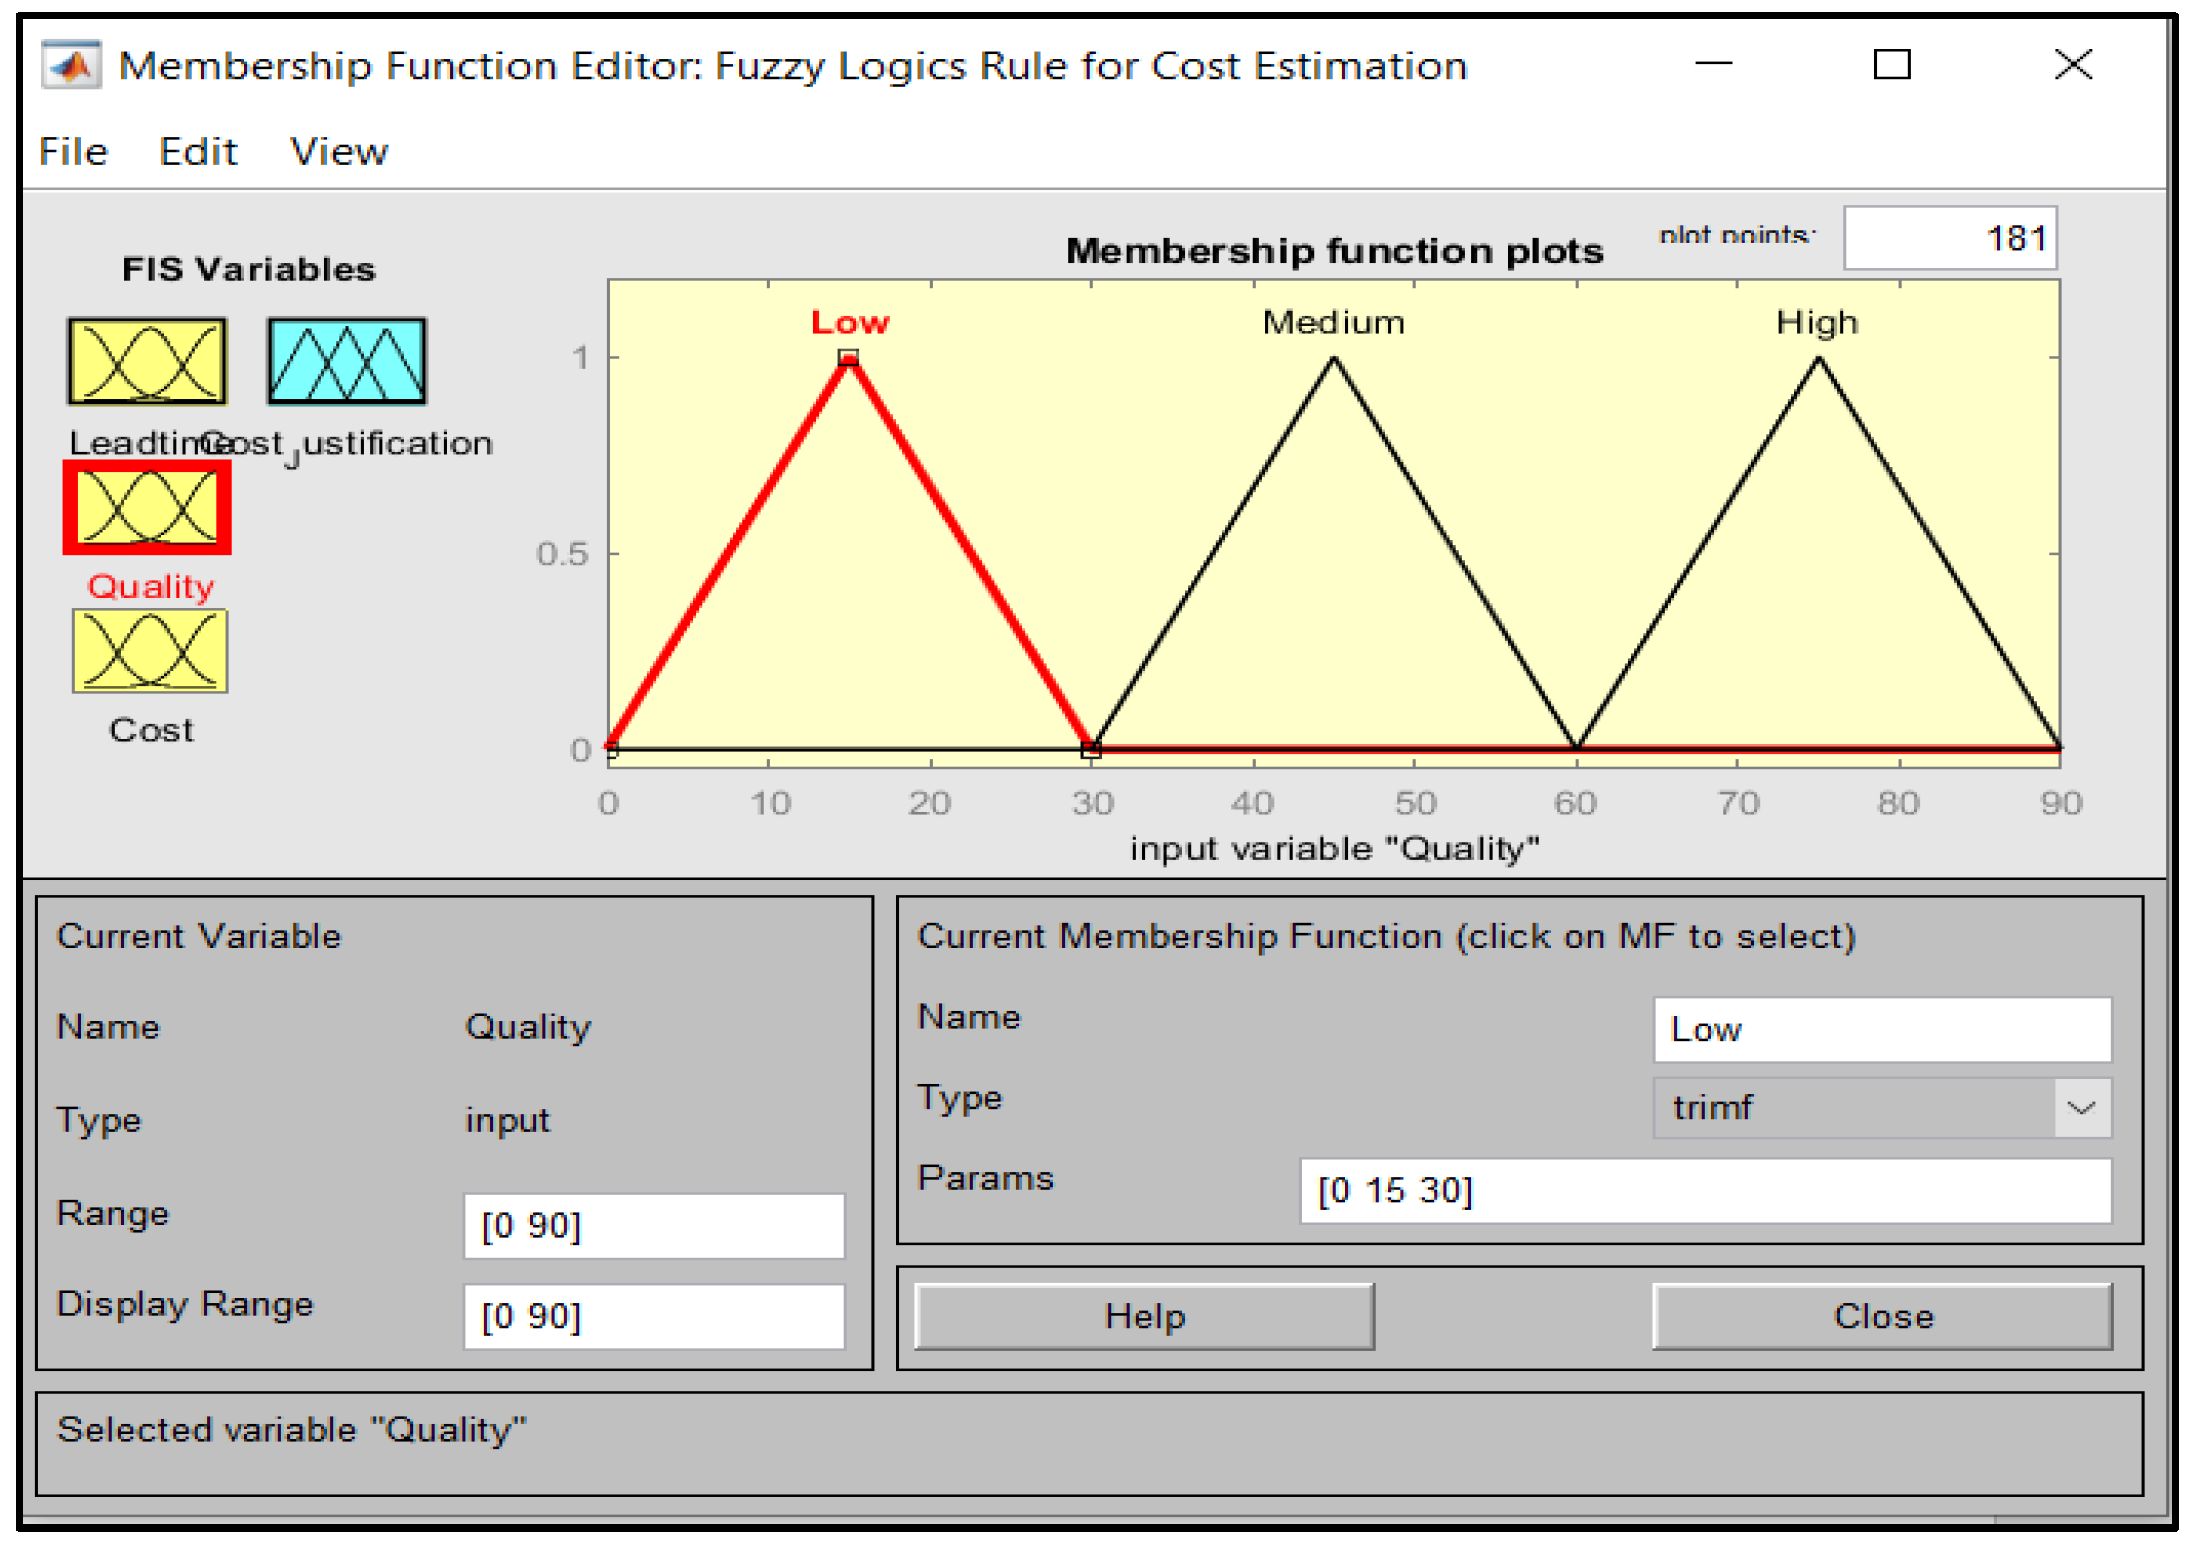
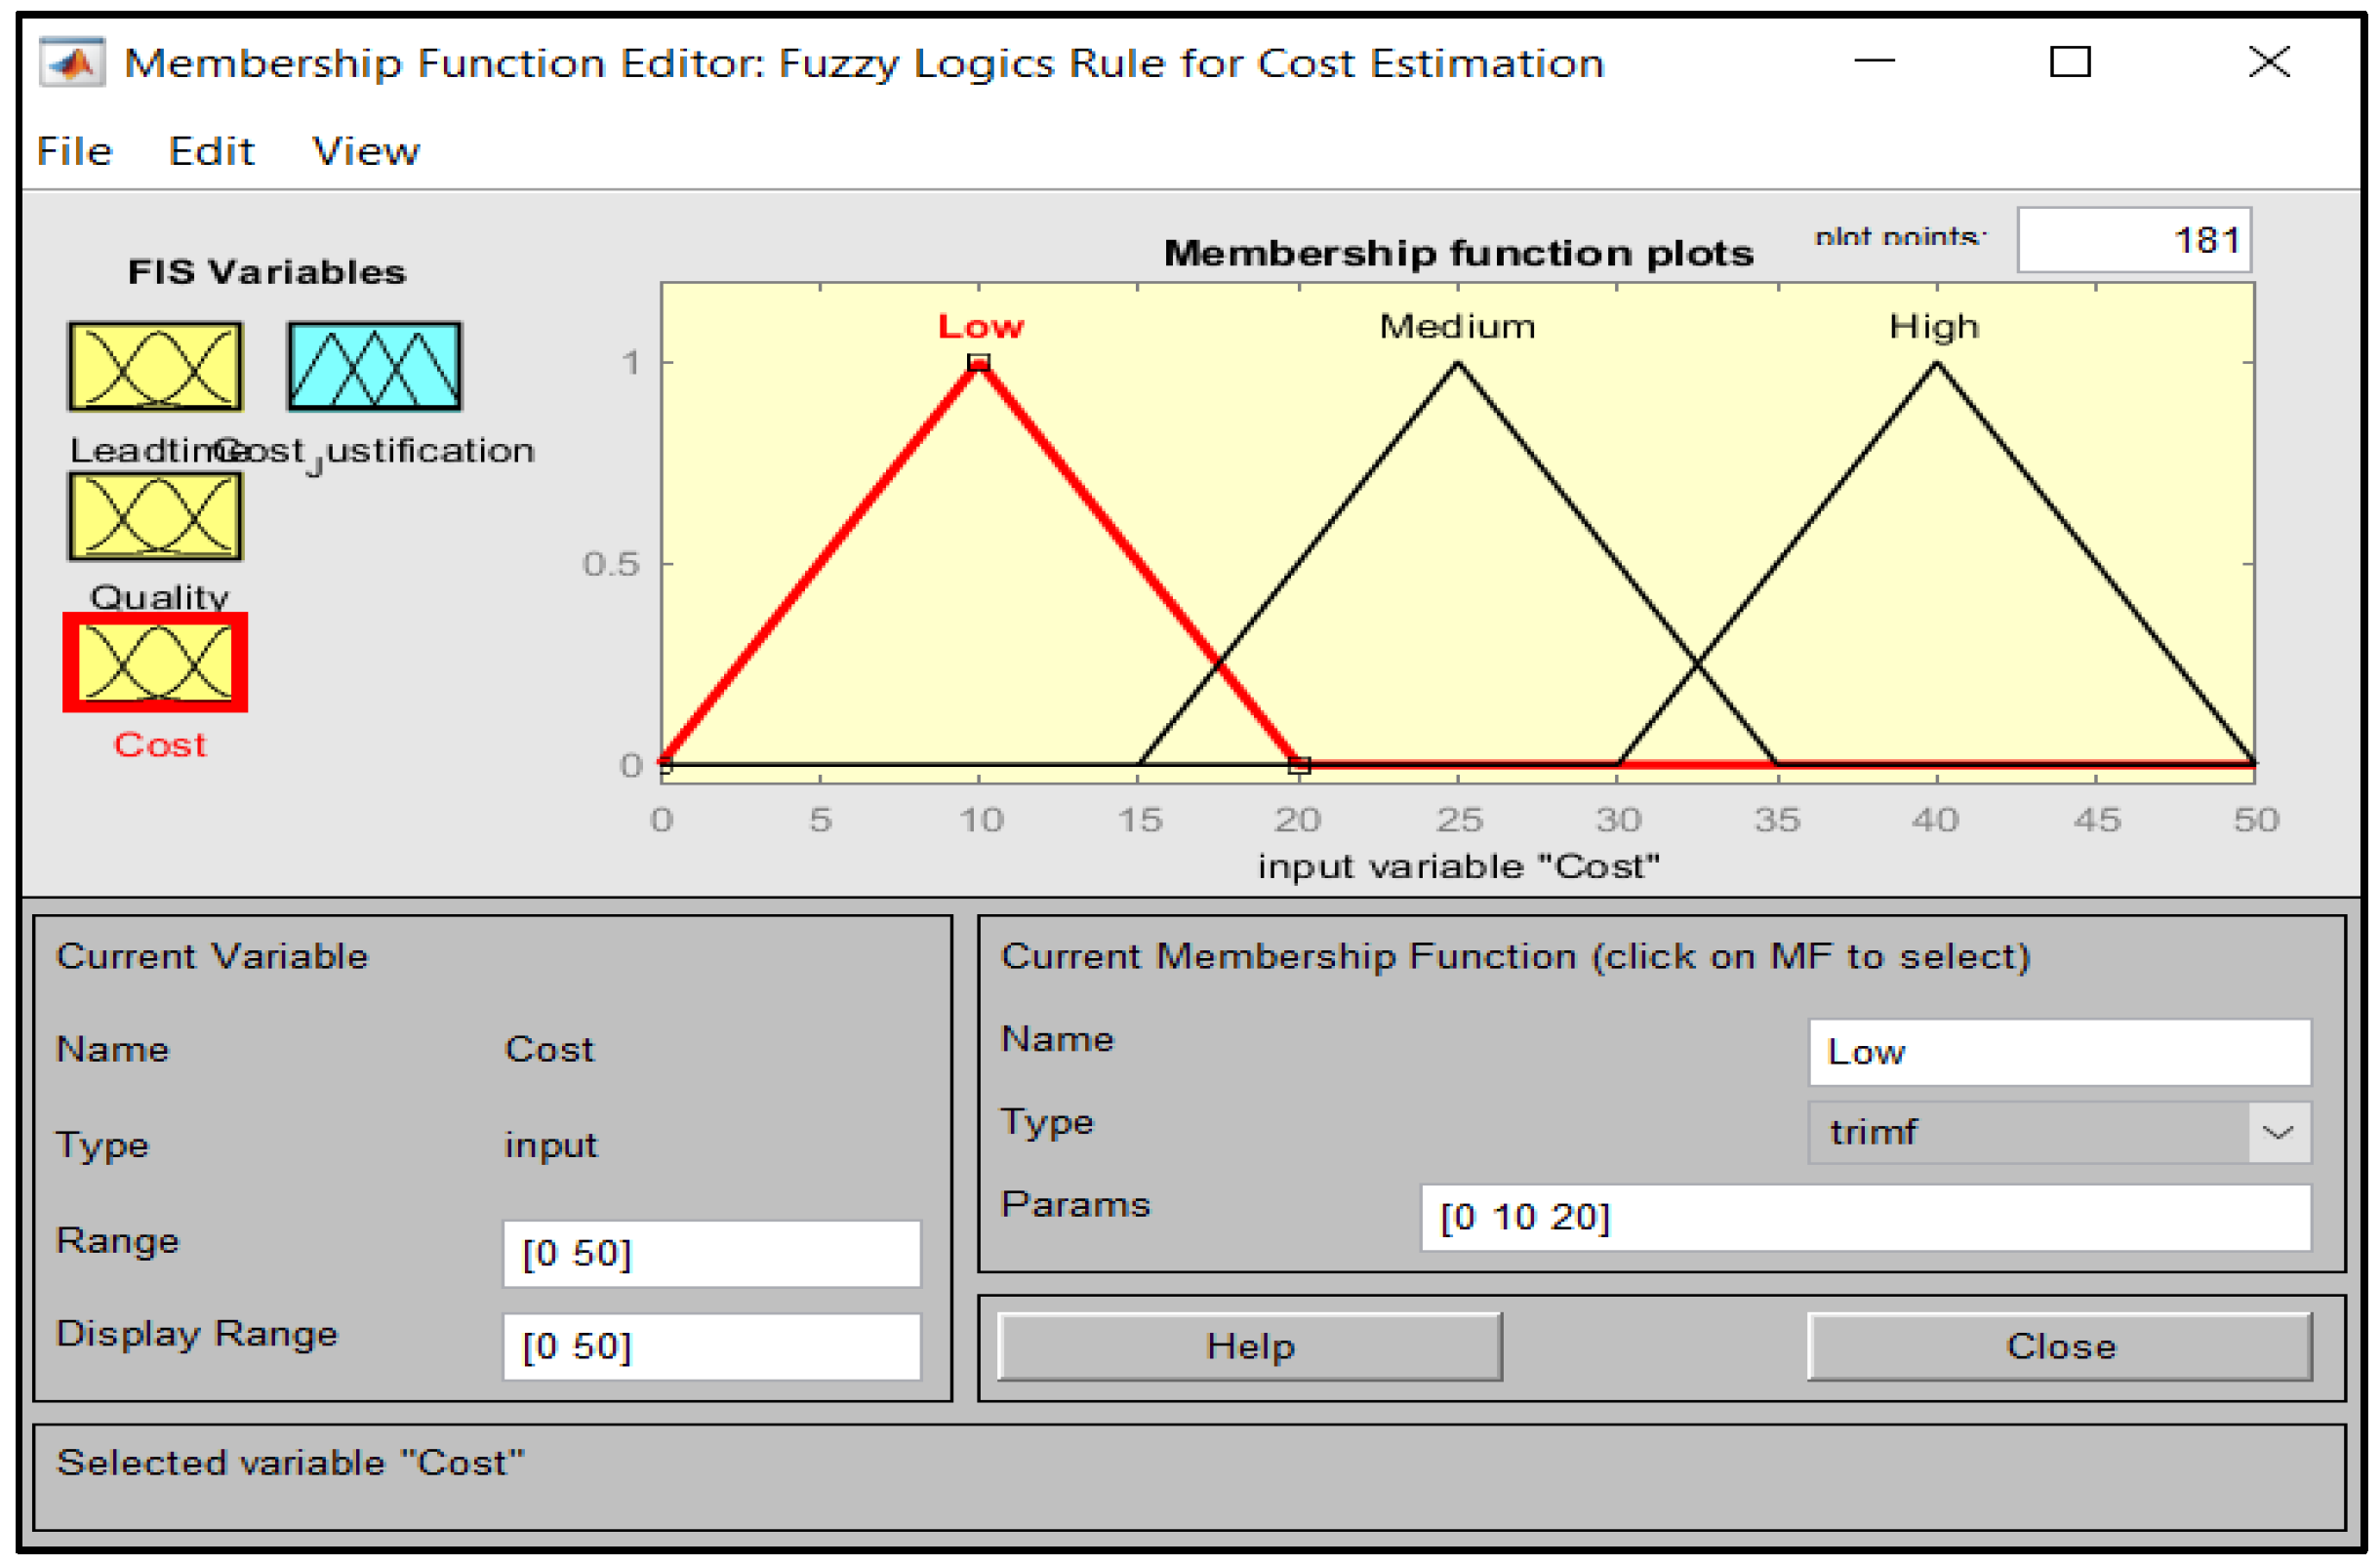
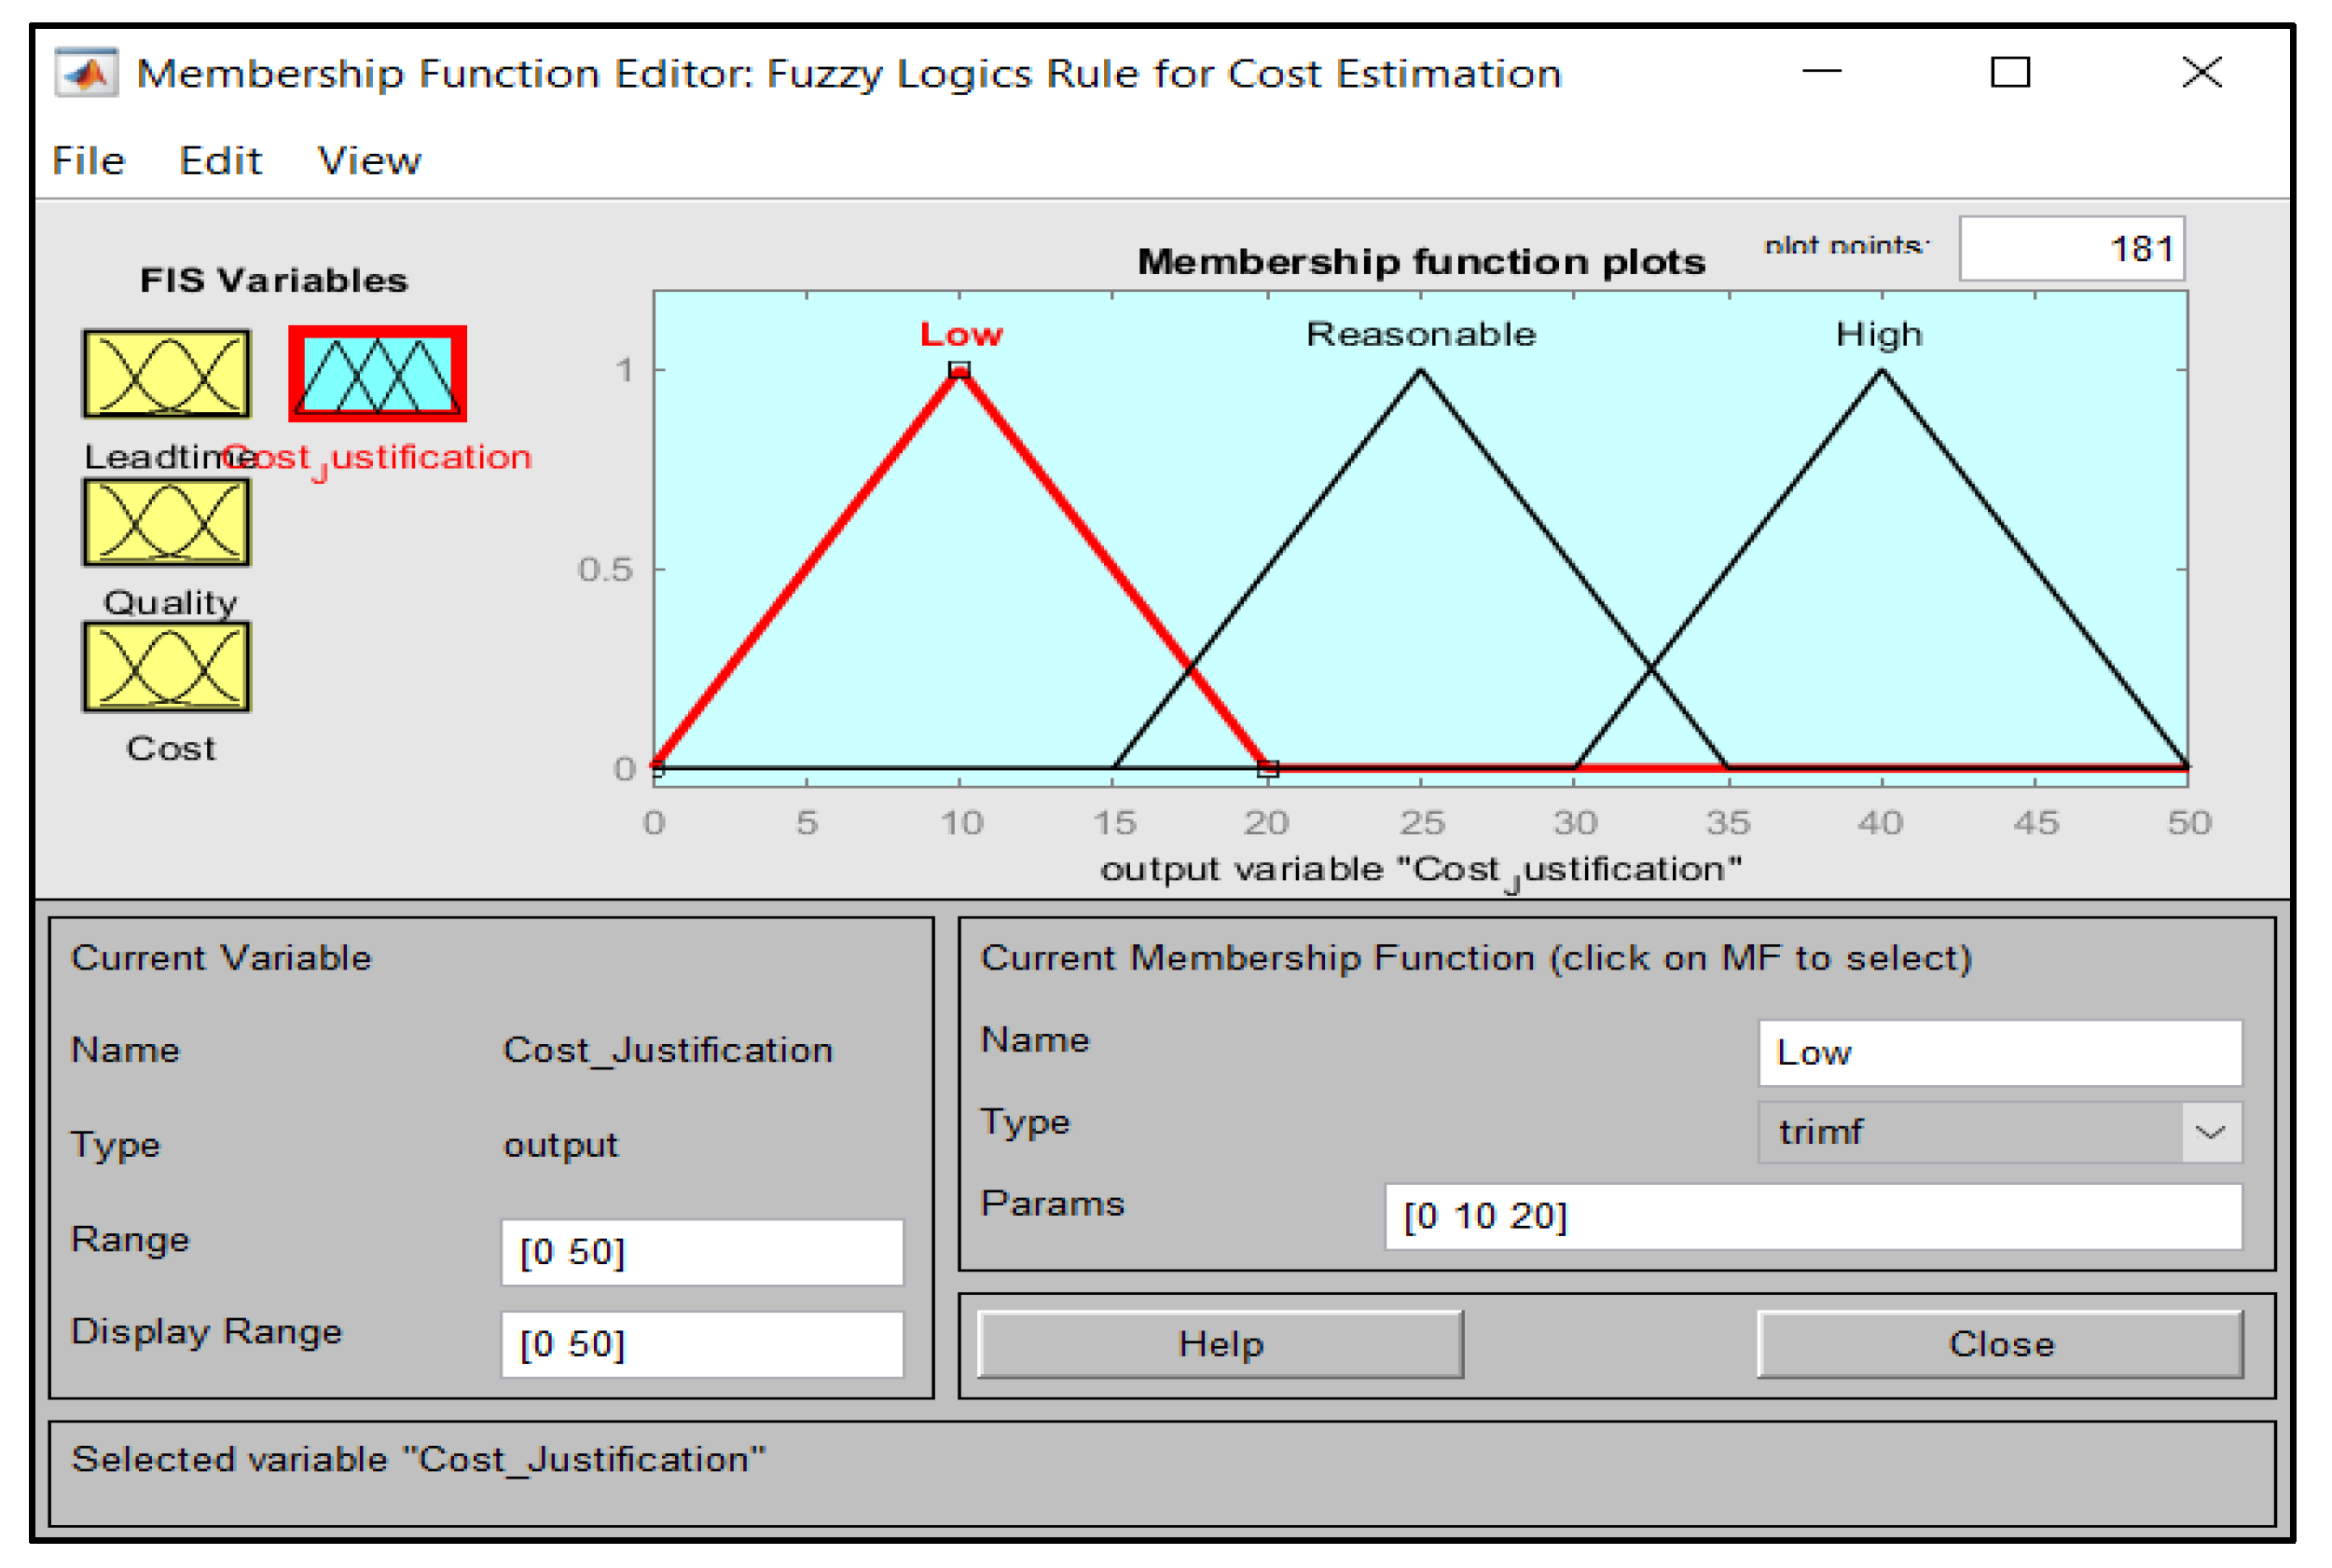
The data used in the fuzzification process are predicted or unsupervised data, which will be validated by engineers three later on using the developed model. Membership Functions are graphical representations used to define the values for each variable that will be later used to define the prediction model’s rules. The setup of the Membership functions for each input is shown below in
Figure 5,
Figure 6,
Figure 7, and
Figure 8, respectively. Lead time, Quality, and Cost are used as Inputs to determine the output which is the Cost Justification. For example, in
Figure 5 and
Figure 6 below, the range of values specified is from 0 to 90. This range was divided into categories to further classify the values for Low, Medium, and High, respectively. These range of values were chosen randomly to provide equal division for the three different value categories for Low, Medium, and High throughout the configurations, further validated by actual field engineers upon obtaining the final results corresponding to these specified values.
Table 2 and
Table 3 additionally display the categorization of these ranges of values used for the configurations.
Table 2 further shows the values configured for the input variables: Lead time, Quality, and Cost. In contrast,
Table 3 shows values used for the Cost Justification, which plays an output variable in the evaluation model.
4.2.2. Fuzzy Logic Configurations in Evaluation Scenarios
In this section, we discuss the configuration setups for all three types of configurations. The first configuration will have the Lead time set as the input variable as Low, while the second and third configuration will have it set to Medium and High, respectively. These setups will be measured together with Quality and Cost input, which impact the Cost Justification prediction. The measurement will be conducted as Low (L), Medium (M), and High (H) for the input variables while the output variable is set to be Low, Reasonable, and High, respectively. Technically, all these three configurations will be implemented using one Fuzzy Logic model, but each of the respective prediction rules is shown separately as three different types of configurations in the Figures below.
Figure 9,
Figure 10 and
Figure 11 show the setup used for the configurations.
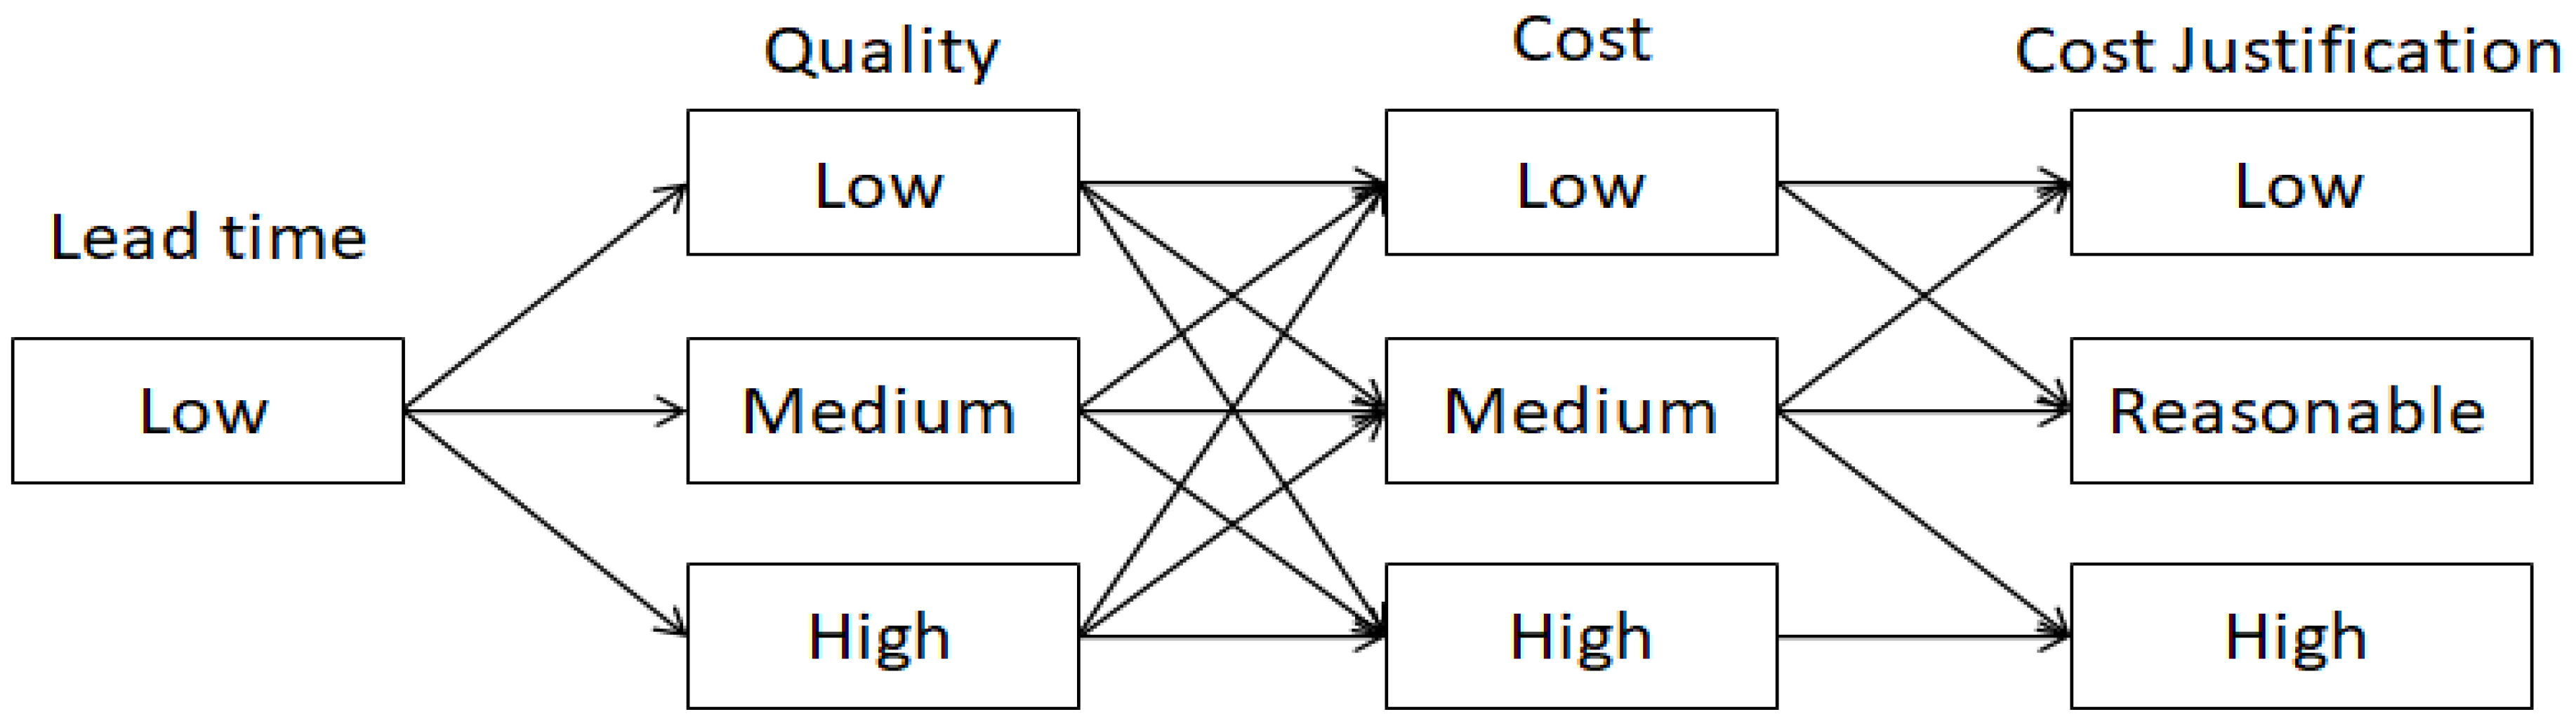
In this first configuration, as shown in
Figure 9, Low lead time value is paired with Low, Medium, and High value of quality, followed by Low, Medium, and High value of cost. The Cost Justification is ruled out based on prediction and will be further validated by an engineer later in this paper. Each arrow is used as a prediction rule to determine the Cost Justification. For example, when a Medium Quality product Medium Quality product accompanies a low Lead time accompanies a low Lead time, it can cause the Cost to be either Low, Medium, or High. Thus, the overall Cost with contributing factors will be justified as either is it classified as Low cost or Reasonable cost or considered as High cost. This will further assist manufacturing engineers in deciding on which kind of setup. As shown in
Figure 3 earlier, it will have this kind of indicator values and will further enable them to plan the setup based on the assessed cost justification for better results in the future.
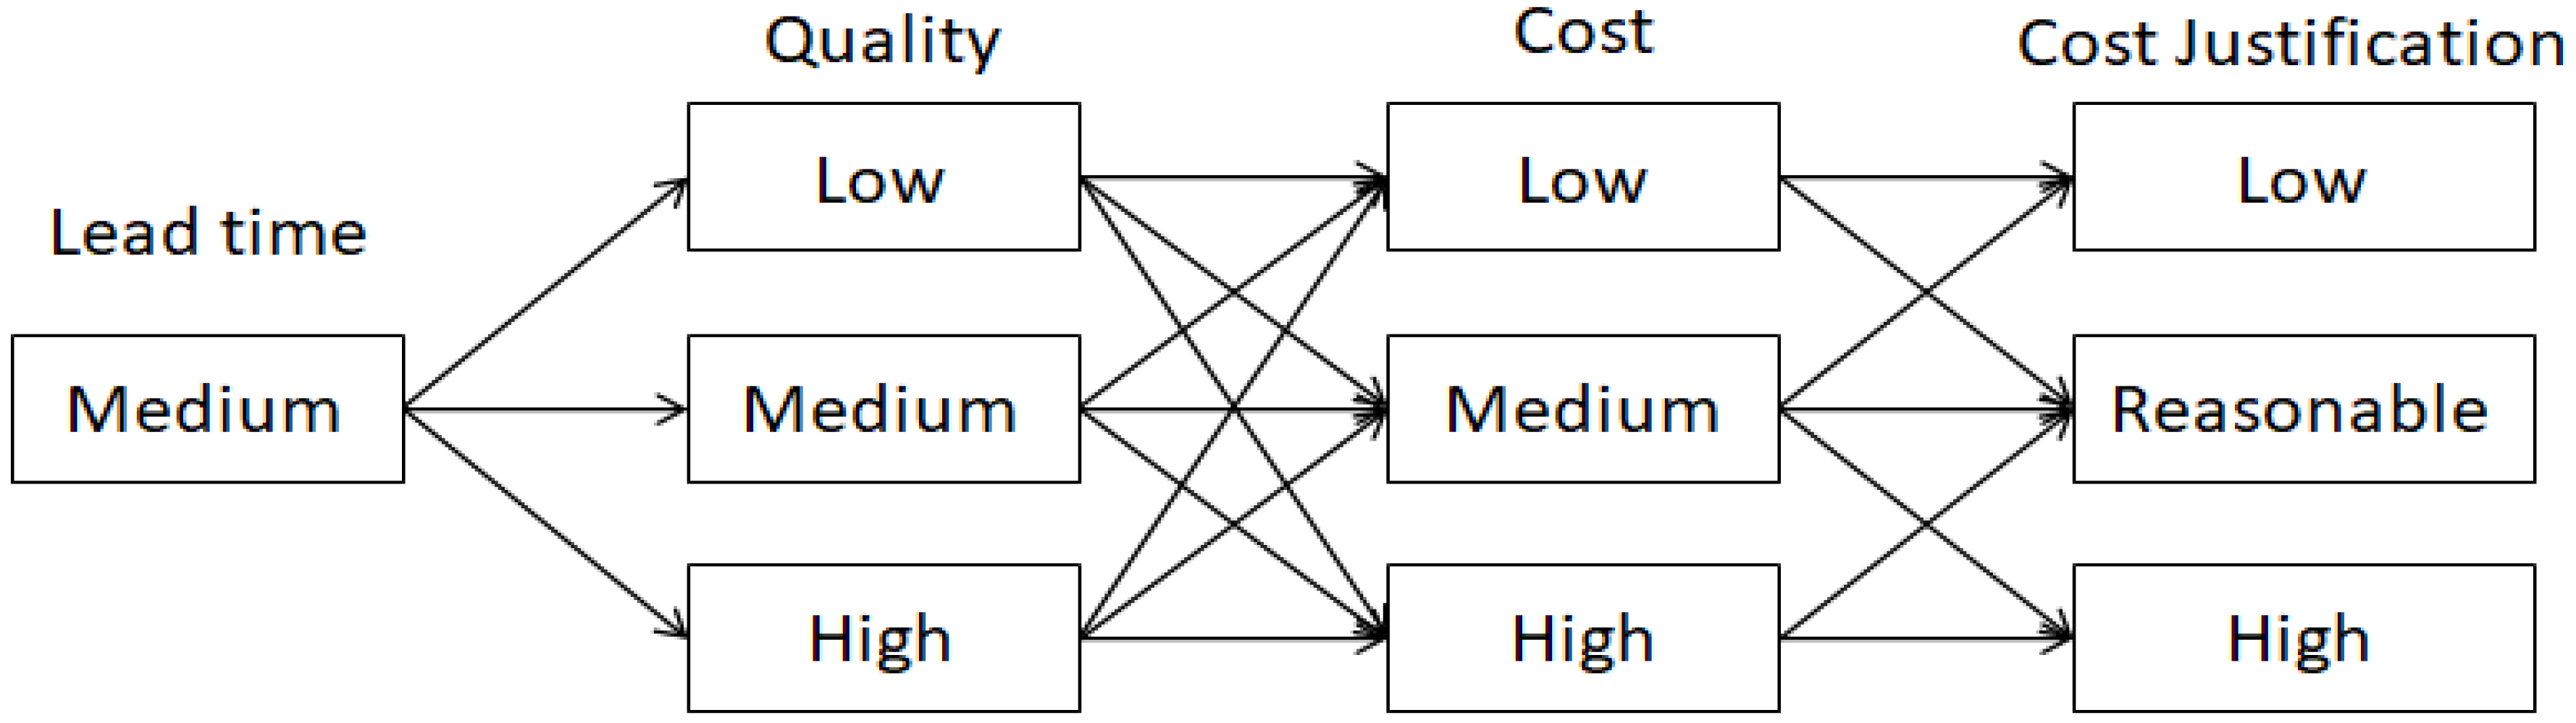
In the second configuration, as shown in
Figure 10 below, the medium lead time value is paired with low, medium, and high values of quality, followed by Low, Medium, and High values of cost. Each arrow is used as a prediction rule to determine the cost Justification. For instance, High-quality value is paired with low cost and medium lead time, which can be further justified as low cost or reasonable cost. This is ruled out based on prediction and will be further validated by an engineer later in this section.
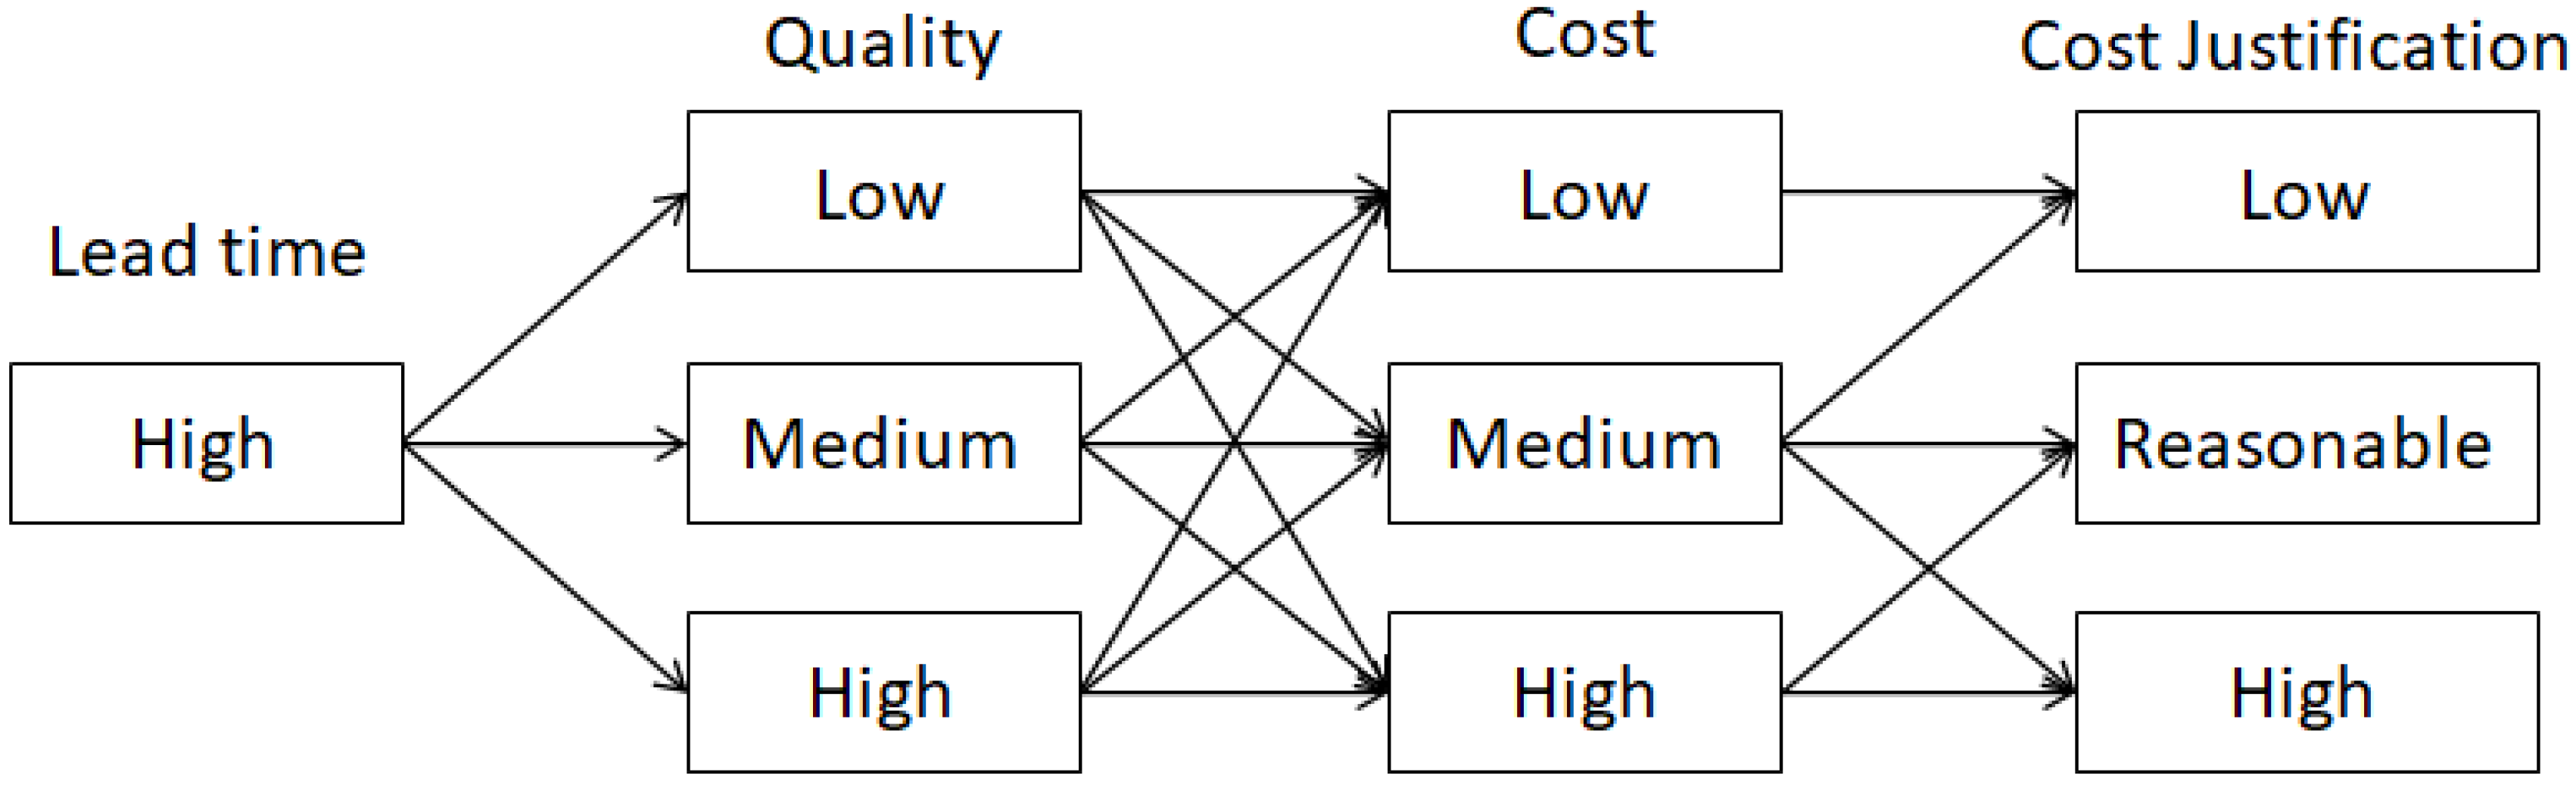
In the third configuration, High lead time value is paired with Low, Medium, and High value of quality, followed by Low, Medium, and High value of Cost. Each arrow is used as a prediction rule to determine the Cost Justification. For illustration, cost justification is supposed to be low or Reasonable if the Lead time is high, but the quality and Cost factors are medium. This is based on predictions using Fuzzy Logic rules. However, the validity of the cost justification will be validated by an engineer later in this section.
Figure 11 below shows the rules setup.
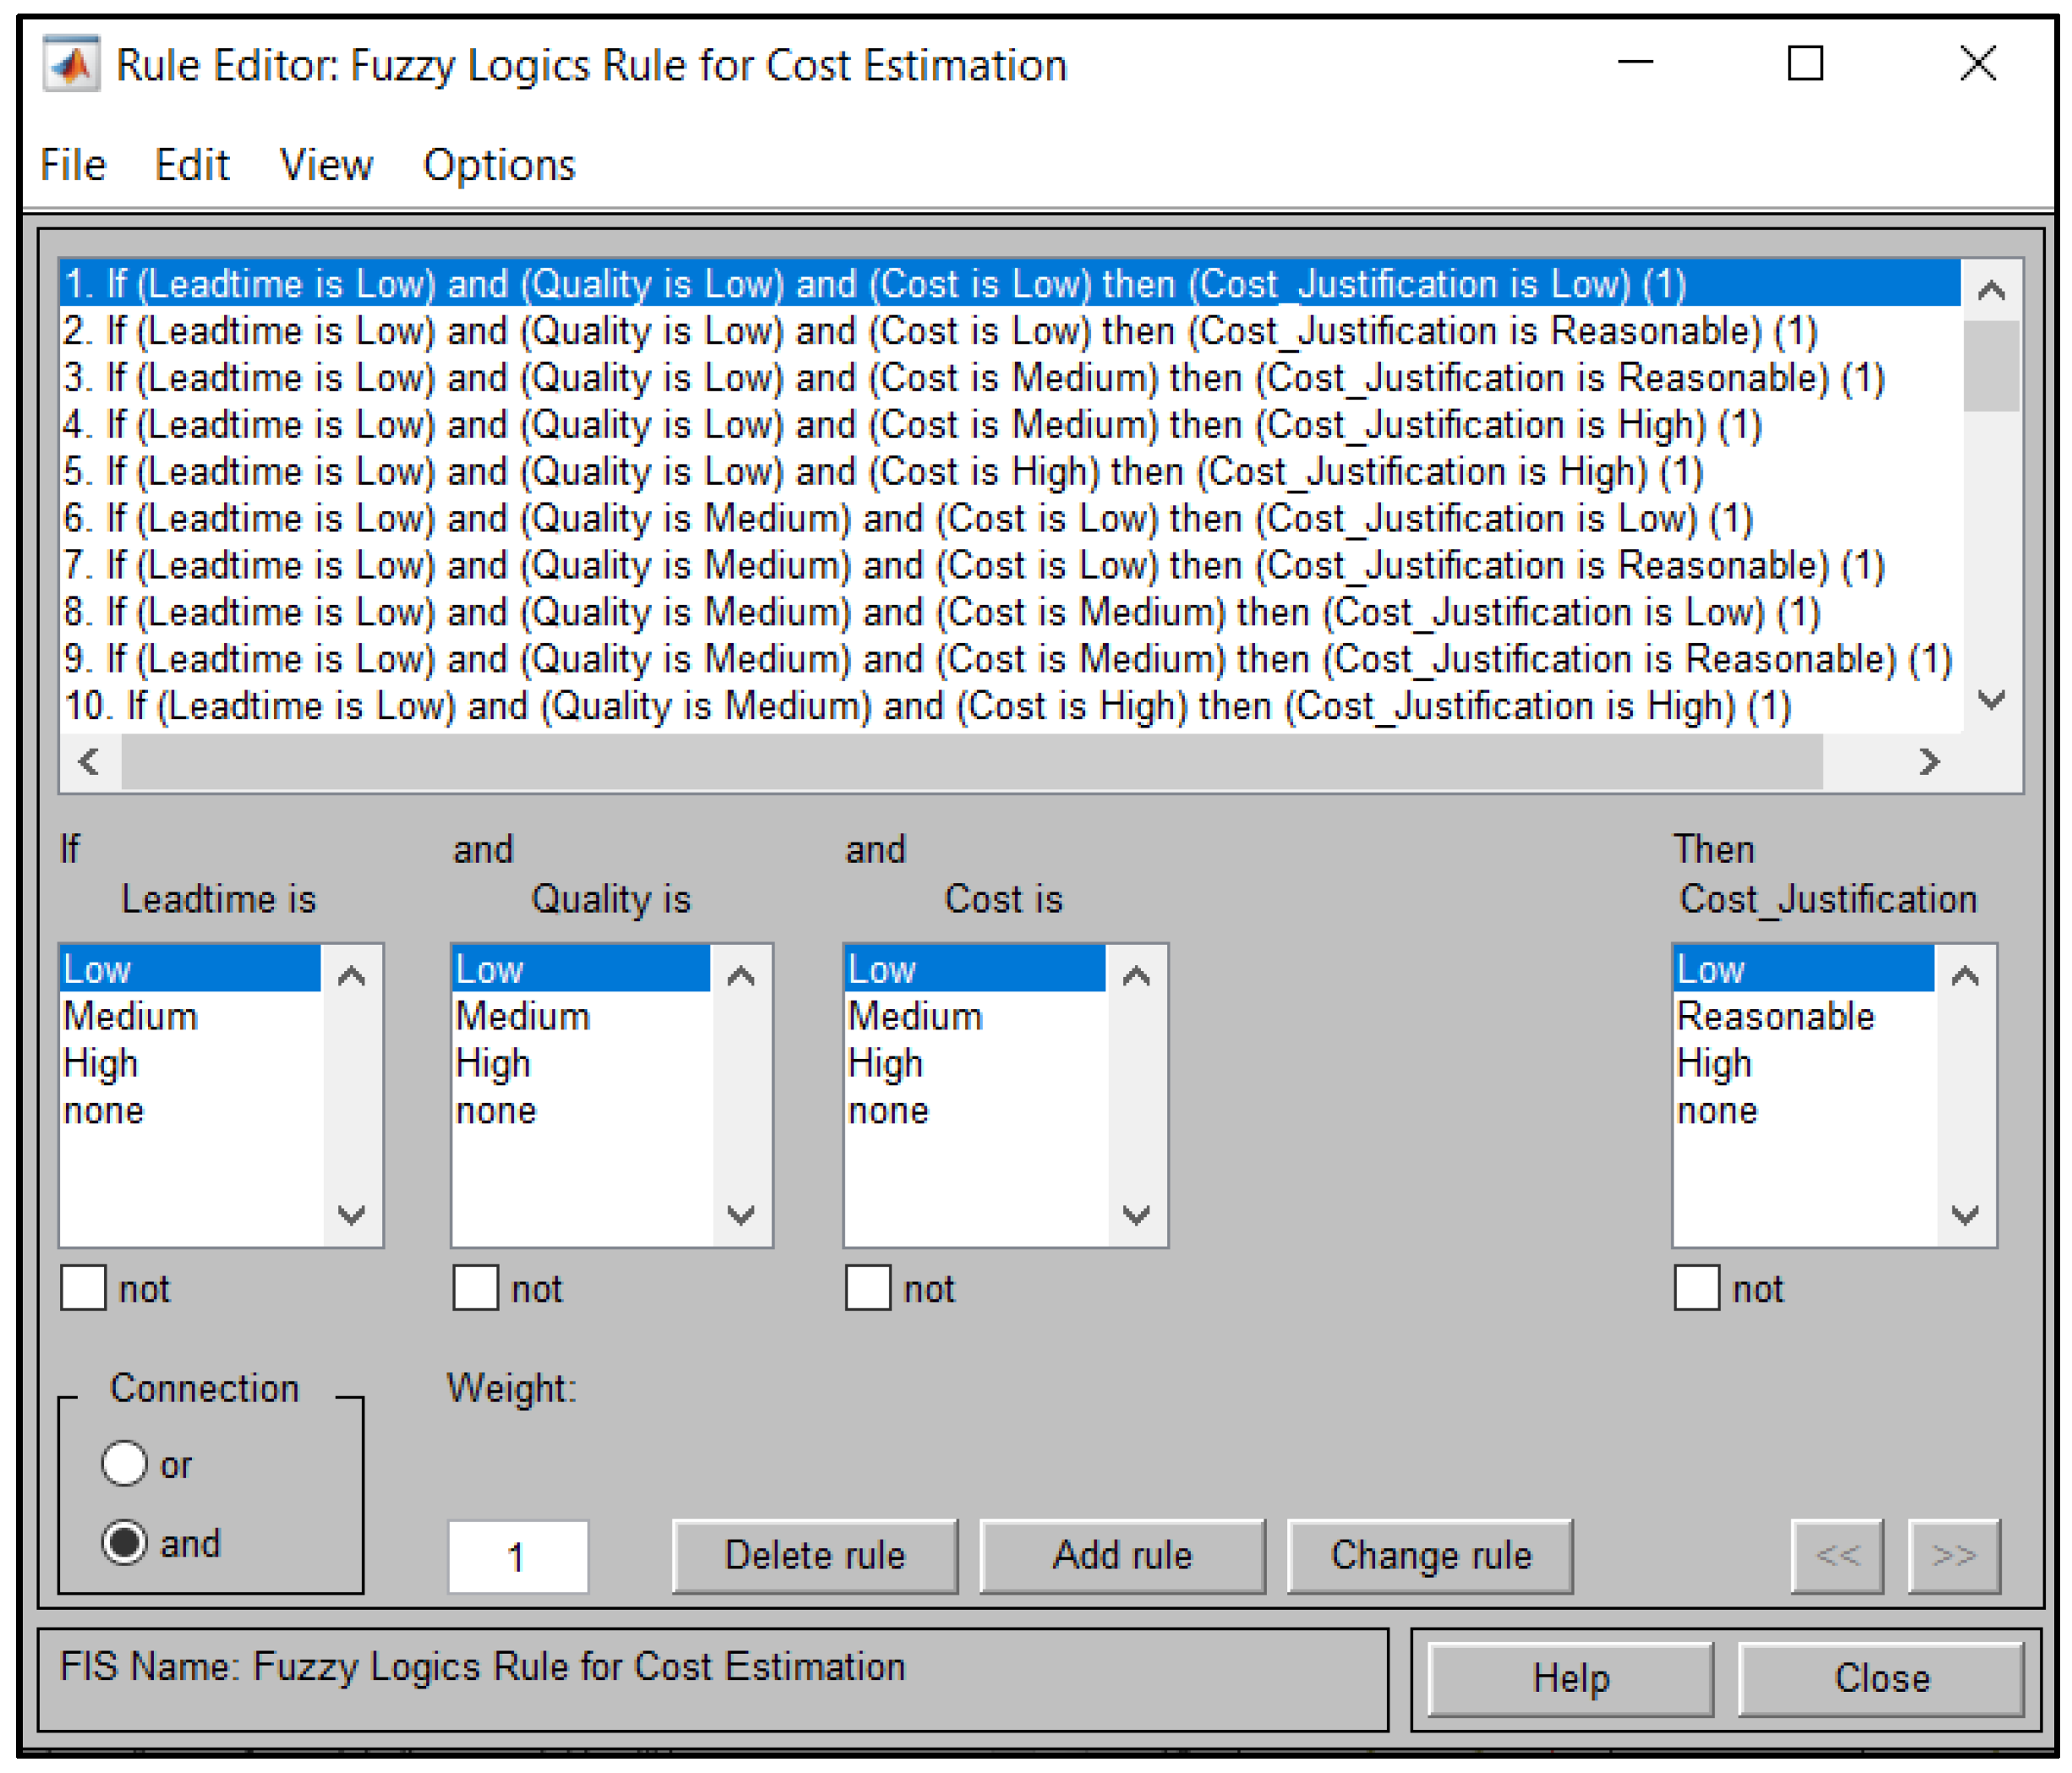
4.2.3. Rules Configuration in Fuzzy Logic Settings
A total of 38 rules were defined in the Fuzzy Logic setting based on derivation from
Figure 9,
Figure 10, and
Figure 11, respectively. All these configured rules were later evaluated based on multiple scenarios. These rules will be further evaluated by a field engineer based on the evaluation performed.
Figure 12 shows a snapshot of the rules’ configuration in the Fuzzy Logic editor. We have three inputs that have been matched using AND operator to determine the output value.
Figure 13 below shows the typical snapshot of Fuzzy rules configuration for lead time against cost to determine the Cost Justification, whereas
Figure 14 shows the typical snapshot of Fuzzy rules configuration for Lead time against quality to choose the cost justification.
4.3. Testing and Validation
Sample results for each type of configuration are shown in this section. However, the results are not limited to what is shown here only, as each rule can be tested with this model to obtain the best result. This section will use nine test scenarios to better understand the configuration setups and their respective cost justifications. Each configuration setup will have three different test scenarios; thus, three different configuration setups contribute to nine different test scenarios that an engineer will validate.
Table 4 below serves as a guide for the values’ category set for each configuration throughout the testing.
4.3.1. First Configuration
In this First Configuration, we will test out three types of different scenarios.
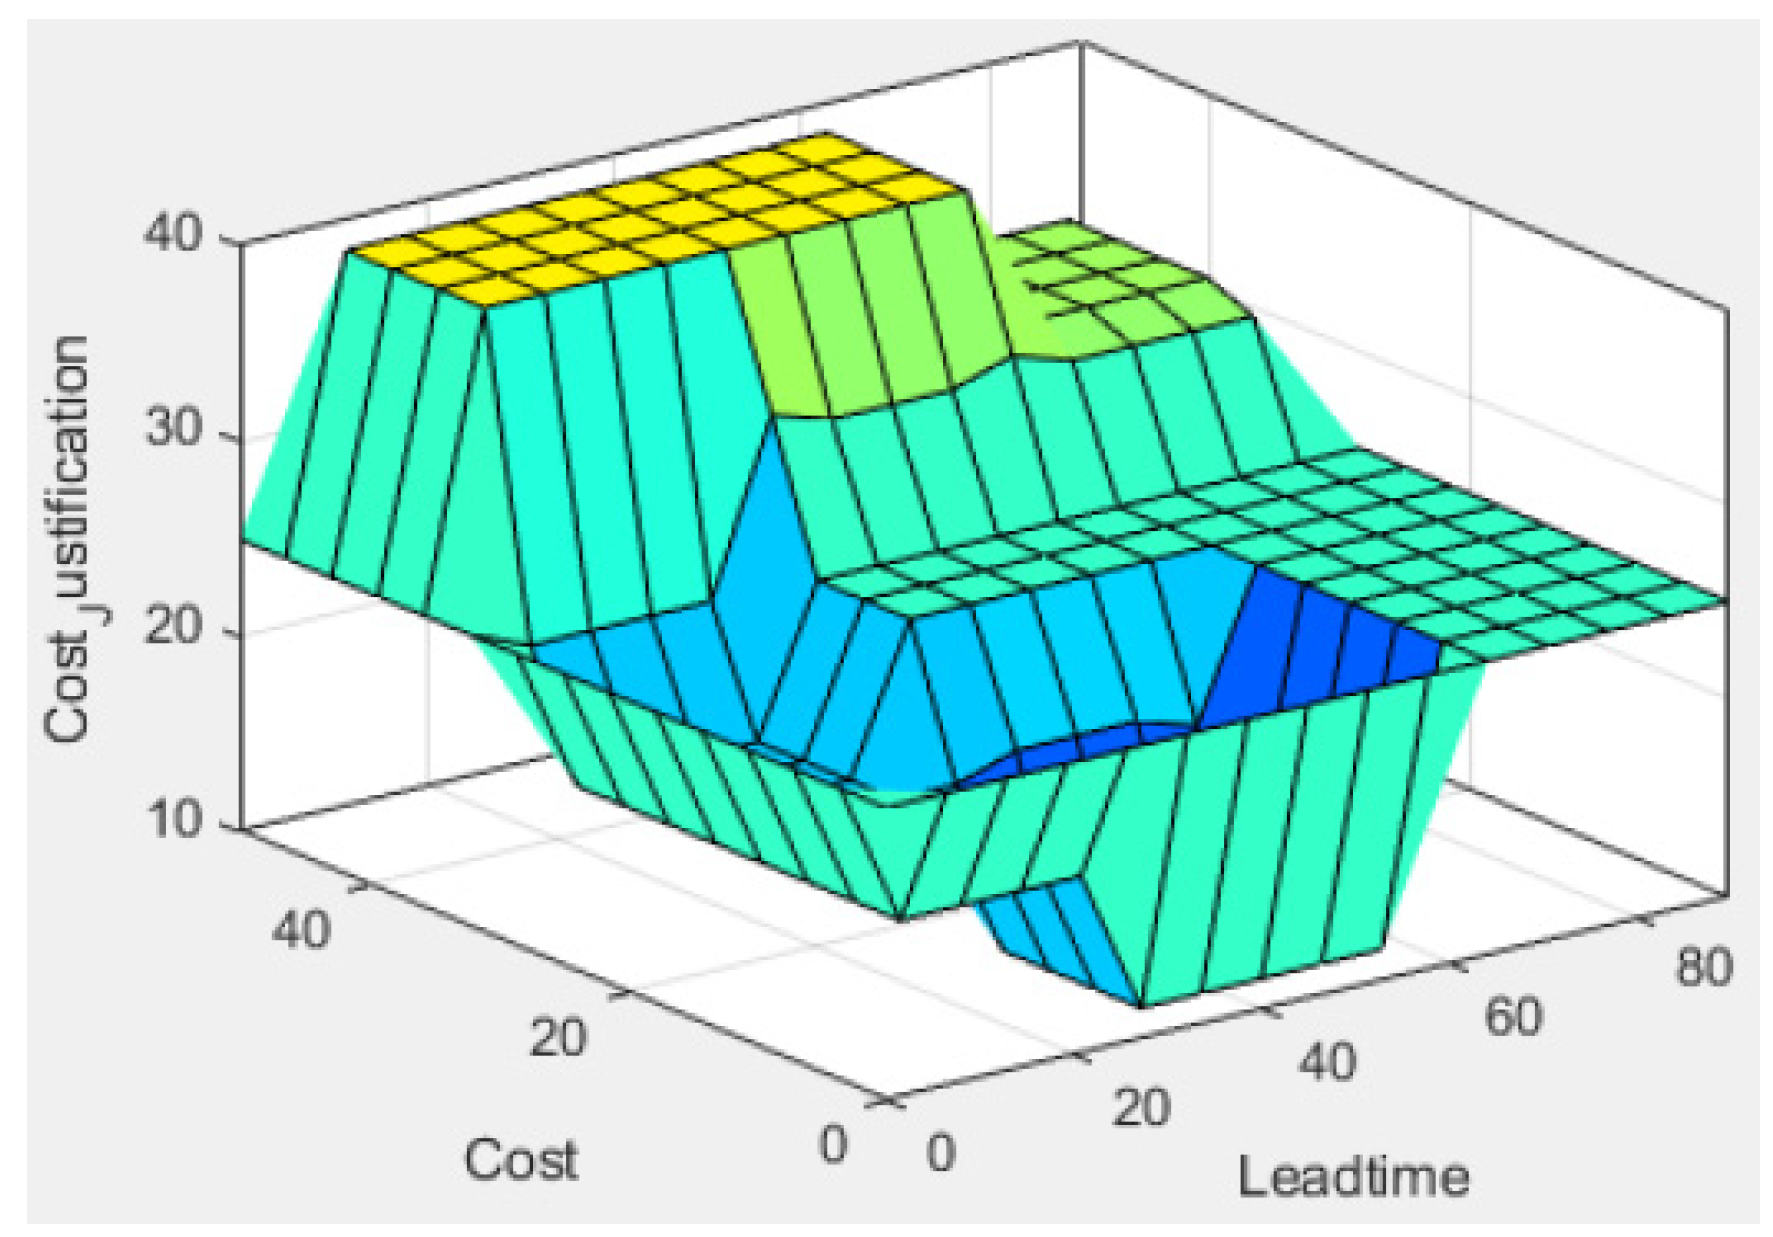
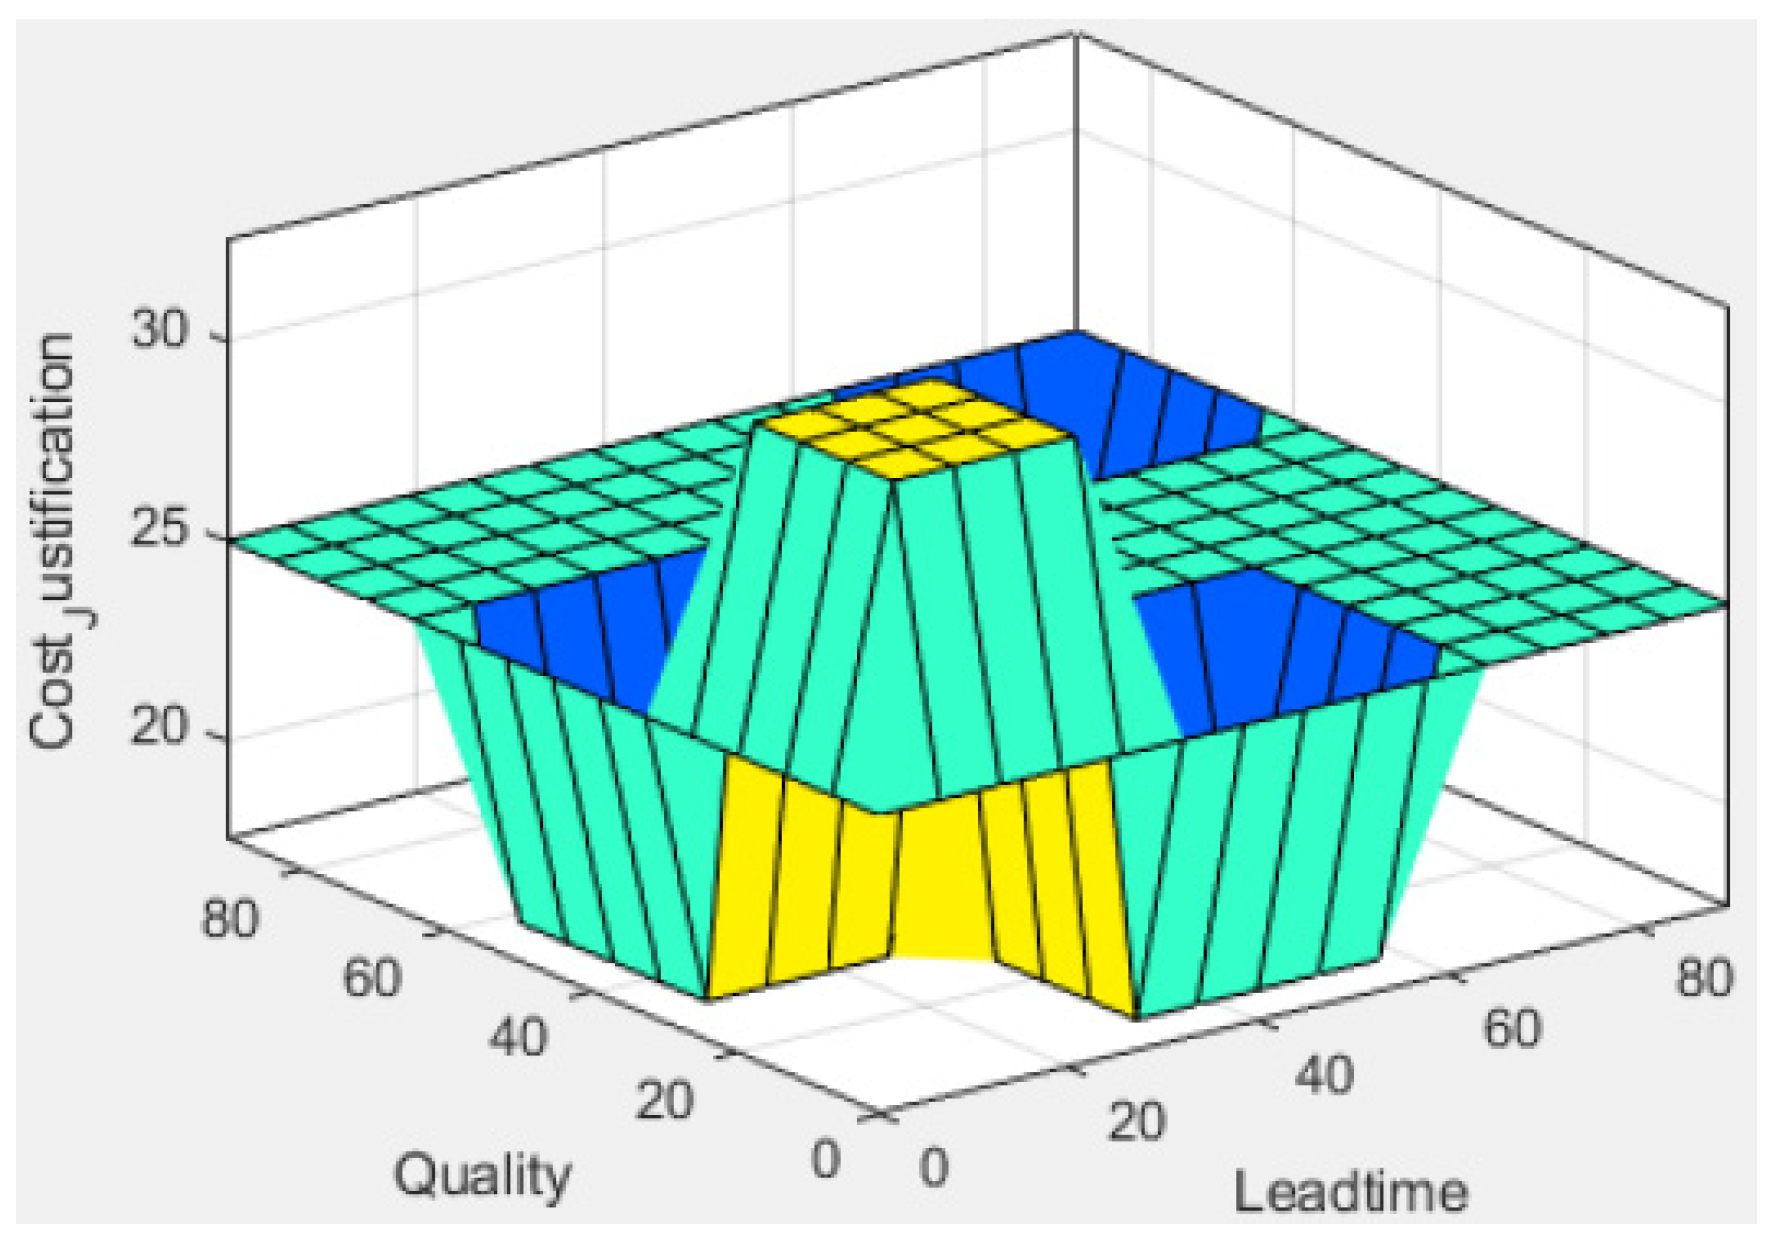
Table 4 shows the values specified for our test experiments with Lead time as Low value. For all three different test scenarios, a static value of 12.7 was used to indicate the lead time as low. Then, quality was analyzed with 77.4 as high value, 13.9 as low value and 46.3 as the medium value respectively, followed by cost as 23.7, which was a medium value, then 42.9 as high value and 8.51 as low value, respectively.
As shown in
Table 5, cost justification of 25, 40 and 17.5 were obtained, which indicates that Scenario 1 is considered reasonable, followed by Scenario 2 results as high cost and scenario 3 result as low or reasonable cost, respectively.
4.3.2. Second Configuration
In this Second Configuration, we will test out three types of different scenarios.
Table 6 shows the values specified for our test experiments with Lead time as a medium value in the second configuration. For all three different test scenarios, a static value of 47.3 was used to indicate the Lead time as a medium value. Then, quality was analyzed with 71.5 as high value, 19.4 as low value and 49.2 as the medium value, respectively, followed by cost as 24.1, which was a medium value, then 35.4 as high value and 17 as in between low value and medium value, respectively.
As shown in
Table 6, cost justification of 25, 40, and 16.1 were obtained, which indicates that Test 1 is deemed to be reasonable, followed by Test 2 result as high cost and Test 3 result as low or reasonable cost, respectively.
4.3.3. Third Configuration
In this Third Configuration, we test out three types of different scenarios.
Table 7 shows the values specified for our test experiments with Lead time as a high value in the second configuration. For all three different test scenarios, a static value of 75.7 was used to indicate the Lead time as a high value. Then, quality was analyzed with 75.5 as high value, 8.72 as low value, and 81.3 as high value again, respectively, followed by cost as 28.3, which was a medium value, then 38.9 as high value 45.5 as high value, correspondingly.
As shown in
Table 7, cost justification of 17.5, 40, and 25 were obtained, which indicates that Test 1 is considered to be below, followed by Test 2 result as high cost and Test 3 result as reasonable cost, respectively.
4.3.4. Final Summary Results and Validation by Field Engineers
Figure 15 displays the total summary of tests conducted and their respective results. Nine tests were conducted using the Fuzzy Logic configuration model that was developed using MATLAB, as shown in
Figure 15. Each of the three different types of configurations was evaluated by three different scenarios for each configuration, respectively. The values used for each configuration testing are specified in
Table 5,
Table 6, and
Table 7, respectively. As shown in the bar chart below, each configuration test consists of a pairing of Lead time with Quality and Cost under three different settings, respectively. Firstly, Lead time is set to be low in the first configuration and paired with Quality and Cost, followed by medium Lead time with Quality and Cost, and high Lead time with Quality and Cost, respectively. The values of quality and Cost were also set up under the settings of Low, Medium, and High in each configuration alternatively. The factors which acted as the input values, cost Justification variable was used as the output, and the values of Cost and Cost Justification were set to be similar. Lead time and quality were given the same range of values for Low, Medium, and High, whereas Cost and Cost Justification was set with a similar range for Low, Medium, or Reasonable and High. Lead time, Quality and Cost are indicated with the clustered columns, while the stacked line with blue markers indicates the final output for cost justification. C1 T1 represents Configuration 1 Test 1, and the rest of the clustered column naming follows suit in the bar chart. From the chart, the Cost Justification is shown to be Low or Reasonable if a low Lead time is paired with high quality and low cost as seen in C1 T3, and if medium Lead time is paired with medium Quality and low or medium Cost, as shown in C2 T3. Next, this happens if a high Lead time is matched with high quality and low cost as displayed in C3 T1.
On the other hand, as shown in C1 T1, C2 T1 and C3 T3, the Cost is justified as reasonable if low Lead time is tested with high Quality and medium Cost. Medium Lead time is tested with high Quality and medium or slightly high Cost. Finally, high Lead time is tested with high quality and high cost, respectively, in these configurations. Furthermore, cost is justified as high as shown in C1 T2, C2 T2 and C3 T2, respectively, as the Lead time is set to be of low with low quality but high cost. Medium Lead time is paired with low Quality and high Cost, and high Lead time is matched with low quality, accompanied by high cost.
The bar chart above enables the results and the tested configurations to be visualized in a better way to get a clearer picture of which setup is the best. In the next section, the validation made by actual field engineers on these configurations’ types will be discussed further.
4.3.5. Result Validation by Field Engineers
In this section, the validation performed by field engineers on each of the submitted test results is discussed further. A total of nine test configurations and results were submitted to field engineers for validation and feedback purposes. A summary of the feedback is shown in
Table 8.
As shown in
Table 8, field engineers have strongly agreed on the test configuration and result from Configuration 1 Test 2 and Test 3, Configuration 2 Test 2, and Configuration 3 Test 2 (C1 T2, C1 T3, C2 T2, C3 T2), respectively. This agreement from field engineers proves that the configurations used for these test cases are suitable for use in the manufacturing production environment. Engineers have mixed responses for Configuration 2 Test 3 and Configuration 3 Test 3 (C2 T3, C3 T3), respectively, as Engineer 1 has chosen to be neutral. In contrast, Engineer 2 and Engineer 3 have disagreed and strongly agreed on the configurations’ results.
In the case of Configuration 1 Test 1 (C1 T1) and Configuration 2 Test 1 (C2 T1), engineers have stated their agreement with the results with either strong agreement or just basic agreement, as shown in the table above. On the other hand, the engineers recorded a trend of disagreement for the Configuration 3 Test 1 (C3 T1), as it may not be a practical configuration based on field expertise. This configuration was set up using high lead time, high quality, and medium cost. The final cost justification was considered to be low based on the set Fuzzy rules. However, engineers have disagreed on this, as even though the product may be of good quality, the high lead time used will cause a high final cost. This is also influenced by the resources and materials used during the increased lead time process duration. Based on the validation by the engineers, it is proven that this evaluation model by using Fuzzy Logic Rules has an accuracy of 83.7%, as shown in the table above. This has been achieved by summarizing all the obtained results and feedback from actual field engineers.
5. Discussion
Based on the initial test setups that we configured and the test results obtained from those configuration settings, up to the engineer’s validation on the test results, we can say that the Fuzzy Logic rules that were initially configured based on logical assumptions are close to accuracy. Only one test result was disagreed with by field engineers as this would produce a high cost for final cost justification in an actual setting. From all the tests performed and achieved results, it is shown how much each of the tested indicators impacts other factors in any smart manufacturing system (SMS) configurations. Therefore, engineers in any manufacturing industry must determine the best configuration setup for any production process in the manufacturing environment. This is important as we can see that different arrangements could lead to different values for Lead time, Quality, and Cost, which would directly impact the cost justification of the final product. For example, if in any manufacturing setup where the Lead time will become high, this will affect the quality of the product and the production cost, affect the quality of the product and the production cost, and directly impact the cost justification of the final product. As shown in
Figure 3 earlier, for a sample of different manufacturing setups, these will have different values for each factor. For instance, under the setup where the number of raw materials that need to be processed is higher than the number of machines and operators available to process them, the Lead time is expected to become high as the waiting time for each of the raw materials to be processed will increase, thus causing some of the raw materials to be expired and be disposed of, which will increase the production cost again, but the quality of the product itself may turn out to be low quality as it was put on hold in the queue for a more extended period. In this type of setting, the final cost justification is expected to be high as tested and shown in Configuration 3 Test 2 (C3 T2), where the Lead time and Cost are set as high value, accompanied by a low value for Quality. Therefore, any decision-making is best accompanied with actual data and visualized simulation results to assist any manufacturing industry to make the best decision for the configurations needed to produce the best and most efficient result with high-quality products and reasonable cost justification. We have tested and validated in this section that fuzzy Logic-based simulation will contribute greatly to this decision-making process. As recommended during the test results’ validation by the actual field engineers, the production line in a manufacturing company requires low lead time, good or best quality, and low production cost in order to sell the final products at a low and reasonable cost. High lead time and high production cost will increase the final cost. Therefore, initial planning for the configuration setup can also prevent lead time from being compromised, as recommended during the validation. Manufacturers should adhere to the best configuration setups to achieve the best results. The developed evaluation model can play a significant role in this decision-making process as the satisfaction rate for this model has been proven to be more than 80%, which is considered close to accuracy in the actual manufacturing world.
6. Conclusions
This research was conducted to formulate an evaluation framework of a configuration for measuring the effectiveness of Smart Manufacturing Systems (SMS), thus, allow industry experts to make a well thought out decision making by using an evaluation configuration model which will utilize the Fuzzy Logic concept, to study the relationship between each of the identified and chosen factors on each other, in any SMS configurations in Industry 4.0. The factors were identified based on the literature reviews that were studied, and the factors with the most researched work in the past were chosen to be analyzed further by using the proposed evaluation model. Various test scenarios were conducted using the evaluation model with different configurations for each of the identified factors: Lead time, Quality, and Cost. The values of each factor were manipulated during each of the configuration tests to study the impact of each of the factors on each other, and eventually the final cost justification. The results of these various configurations using the Fuzzy Logic evaluation model were presented to actual field engineers from a semiconductor manufacturing industry for further validation and feedback. This research study has some minor limitations. The scope of the evaluation configuration model was only done based on the impact that Quality, Lead time and Cost have on each other and how they affect the final cost justifications. Indeed, in any given manufacturing industry, the Smart Manufacturing Systems (SMS) configuration is not limited to just these three factors, despite being the critical factors researched. Other factors which may not be contributing directly to the cost justification may also play a silent role in the decision-making. For example, other than these three identified factors, available Resources, Company cultures, and Global Economic factors may also be contributing factors to the decision-making of determining the best configuration type for SMS. Resources can be inclusive of the available machines, tools, products, or even available manpower expertise. Different levels of configurations of each of these resources can greatly affect the manufacturing industry’s production line significantly. Besides that, Company cultures may vary based on different manufacturers or even countries, thus causing various configuration models to be practiced in each manufacturer or country. Other than these, Global Economy factors may also affect the setup of the manufacturing environment tremendously. For instance, due to the global recession, the manpower or workforce may have to be reduced. Thus, the number of ordered products may also decline, and the number of machines or tools in the production line may be greatly reduced too, thus, affecting the overall production cost and final cost justification. The impact these other factors or factors have on SMS configurations has not been studied in this research work as this research primarily focused on Quality, Lead time, and cost factors and their impact on each other’s final cost justifications.
Therefore, for future work recommendations, it is highly recommended that the focus be shifted from the identified main factors. More research work is performed on the silent factors like available resources, company cultures, and global economic factors. The same evaluation configuration model developed in this research work can be further enhanced or a new model can be developed to include more criteria to study more of the other affected factors other than cost justification alone. For example, how global economic factors may force the manufacturing industry to reduce the workforce or manpower in the Smart Manufacturing System (SMS) configurations, or which type of workforce groups will be most impacted due to these management decisions can be further measured and evaluated in future research works. To conclude, this research has significantly contributed to the semiconductor industry by allowing SMS industry experts to be able to make well-thought-out decisions based on evaluation results, mainly by identifying the most important and influencing factors, thus enabling the effective measurement of factors and their respective relationship with each other in terms of cost estimations. Additionally, field engineers could also identify the best configuration approach based on tested configurations and validations. It has been proven that high lead time and high production costs will increase the final cost in the manufacturing industry. Thus, initial planning for the configuration setup is crucial as this will help to prevent the lead time from being compromised. Exclusively, this research has staged a framework or guideline for the industry to follow suit and adapt for future research work related to the SMS field.


