Article

Performance Evaluation of Silane in Concrete Bridge Decks Using Transmission X-ray Microscopy

1
Charles E. Via, Jr. Department of Civil and Environmental Engineering, Virginia Polytechnic Institute and State University, Blacksburg, VA 24061, USA
2
Department of Civil and Environmental Engineering, Oklahoma State University, Stillwater, OK 74078, USA
3
Department of Civil and Environmental Engineering, University of Tennessee, Knoxville, TN 37996, USA
*
Author to whom correspondence should be addressed.
Appl. Sci. 2022, 12(5), 2557; https://doi.org/10.3390/app12052557
Submission received: 25 January 2022 / Revised: 22 February 2022 / Accepted: 25 February 2022 / Published: 28 February 2022
(This article belongs to the Special Issue Advanced Eco-Efficient Concrete)

Abstract

:
The corrosion of steel reinforcement in concrete structures is a most widespread problem. Silane is commonly used as a surface treatment material to reduce the entry of moisture containing harmful chemicals into the concrete matrix, thereby restricting corrosion. There is not a standard test method to evaluate the long-term performance of such sealers when applied on concrete. Moreover, the literature does not have a definitive conclusion on the performance of silanes. In this work, transmission X-ray microscopy (TXM) and optical imaging were used to investigate the mass transport properties and silane thickness of field samples treated with silane to gain insight into the performance of silane coatings. Quantitative measurements using optical staining techniques showed that the average measured silane thickness for all 14 projects was 2.5 mm. The TXM results revealed that, on average, the samples with silane coatings exhibited 8.5 times less penetration of outside chemicals, at a depth of 2 mm, as compared to uncracked samples without silane coatings. This work shows that silanes are a useful and practical tool to significantly reduce the permeability of in-service concrete and resist corrosion.

1. Introduction

Concrete structures have many durability problems associated with their service life due to cracking and external fluid penetration [1,2,3,4,5,6]. The vulnerability of concrete structures further increases due to material deterioration phenomena occurring over the structural lifetime, primarily fluid transportation into concrete. These fluids may contain harmful ionic species, exposing the concrete to corrosion of steel elements (reinforcement bars of reinforced concrete or prestressing strands of prestressed concrete girders), alkali–silica reactions, sulfate attacks, bulk freezing and thawing damage, and salt scaling [3,7,8,9,10,11]. By resisting the penetration of these harmful ionic species, the durability of concrete structures can be increased [3,12,13]. Increasing the concrete durability is a practical approach toward sustainability [14]. Using protective coatings to decrease the fluid penetration could be a cost-effective strategy to increase the durability and prolong the service life of concrete, for which filling or lining the pores with a hydrophobic surface is a common approach [3,7,15,16]. Silanes and siloxanes are the main constituents in most penetrating sealants available on the market [17].
Silane with monomeric silicon is commonly used as a coating material to reduce fluid penetration into the concrete matrix. It consists of chemicals that contain at least one hydrolytically stable carbon–silicon bond. The organic groups of the silane are bound to the silicon atoms by carbon–silicon bonds, and they coat the surface of the pores with a nonpolar, low-surface-energy, and hydrophobic lining [7,17,18]. This coating acts as a barrier that mitigates water penetration, but allows vapor transport from the concrete [7,19]. To ensure uniform and deeper penetration of silane into the concrete, silanes are dissolved in a solvent, such as water or alcohol. The amounts of active ingredients and the penetration depth of the carrier into the concrete mainly determine the performance of silanes [7,17,18,19,20,21].
Using silane to repair concrete is an effective method of reducing the ingress of external fluids into concrete [22,23,24,25]. Although numerous studies have been completed on silane coating materials or sealers, the results of laboratory and field tests have generally been varied or nonconclusive [22,26,27,28,29]. This variability may be due to using different test procedures because a standard test method has not been developed to evaluate the long-term performance of such sealers when applied on concrete. It has also been shown that sealer performance is sensitive to the environment, substrate, sealer chemical properties, and application variables [28]. In 2019, the Oklahoma Department of Transportation (ODOT) reported that silane coatings are not resisting water penetration and the reasons are unknown [30]. This suggests that silane coatings are not effective, and this puts the long-term performance of the bridge in question. Moreover, only a small collection of information exists for the field performance of silane treatments [31,32,33]. In addition, applying silane does not alter the porosity of the concrete. Therefore, porosity measurements cannot evaluate the efficiency of silane. Another study showed that porosity is not a useful parameter for evaluating the properties of a cementitious system against fluid transport [34]. This suggests that the efficiency of silane should be studied with a technique that considers different mass transport mechanisms, porosity, pore interconnectivity, and chemical binding. Therefore, the aim of this study was to utilize a direct observation technique to rapidly identify the protective effectiveness of silane coatings to reduce ion penetration and figure out the reasons for the poor performance of silane in some projects as reported by the ODOT. Other studies have successfully used X-ray absorption spectroscopy (XAS) to probe the chemical speciation of trace elements in cementitious materials and other substrates [35,36]. There are other techniques such as transmission X-ray microscopy (TXM) that can quantitatively probe the penetration of a tracer into a cementitious system. Therefore, this study uses a direct test method via the TXM technique to investigate the protective effectiveness of silane coatings to reduce ion penetration compared to concrete that is not treated with silane from in-service bridge decks using a quantitative approach. TXM is a novel measurement technique that has been used by other researchers for the investigation of transport properties of different systems [3,37,38,39,40,41,42], but it has not been applied for sealer-coated samples to study and quantify the effectiveness of silanes in reducing salt ingress in order to improve the long-term performance of concrete structures. Other studies that have used X-ray imaging techniques tried to study the presence of silane or to study the penetration depth of the sealers without quantitatively comparing the mass transport properties of coated and uncoated concretes [5,43,44,45]. This study proposed a simple way to measure the penetration depth of silane. Moreover, other studies have shown that TXM is a reliable test method that is faster and more reliable than the titration test method [3,46]. Therefore, the experimental program implemented in this research can be considered as an alternative to the test method of National Cooperative Highway Research Program (NCHRP) Report 244 [22]. Another study recommended that direct field measurements represent the best method to evaluate sealer performance [20]. Therefore, this study, by applying a direct observation method to field samples that were in service in bridge decks, gives more insight into the effectiveness of silane coatings. The results of this study, along with the strategies offered in [11], can be a helpful guide for state DOTs to gain preliminary insight into the structural conditions of existing bridge decks and then plan an effective repair practice in a reasonable, safe, and costly effective manner.

2. Materials and Methods

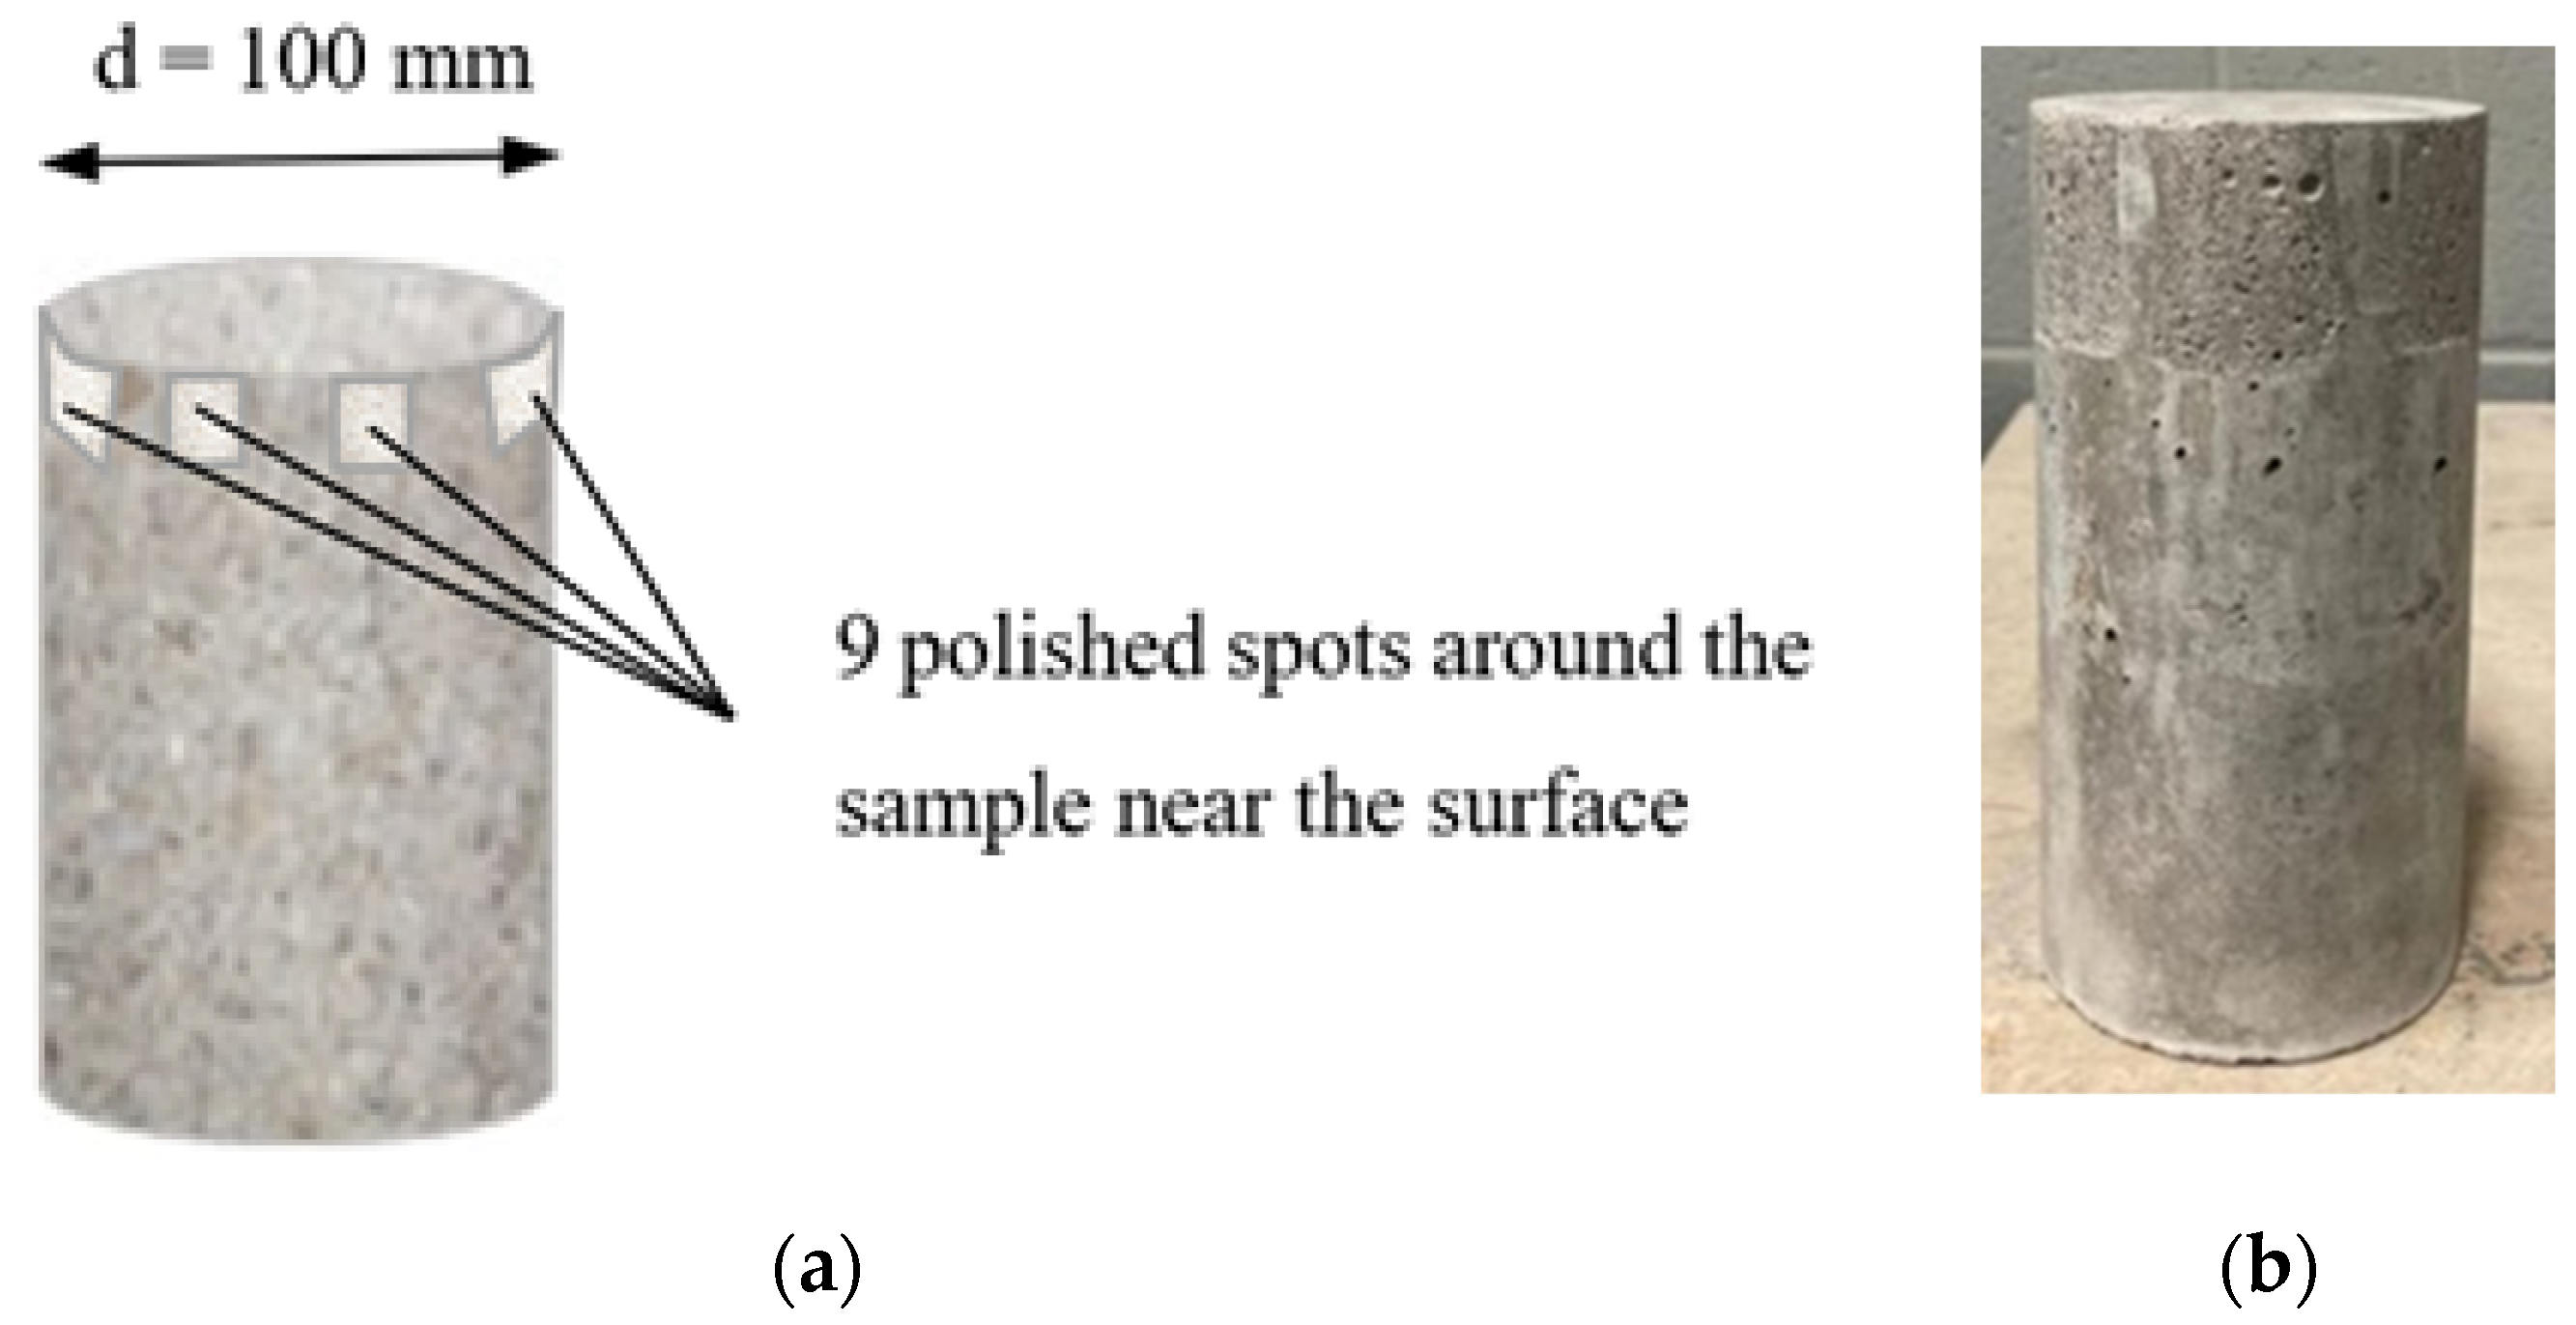
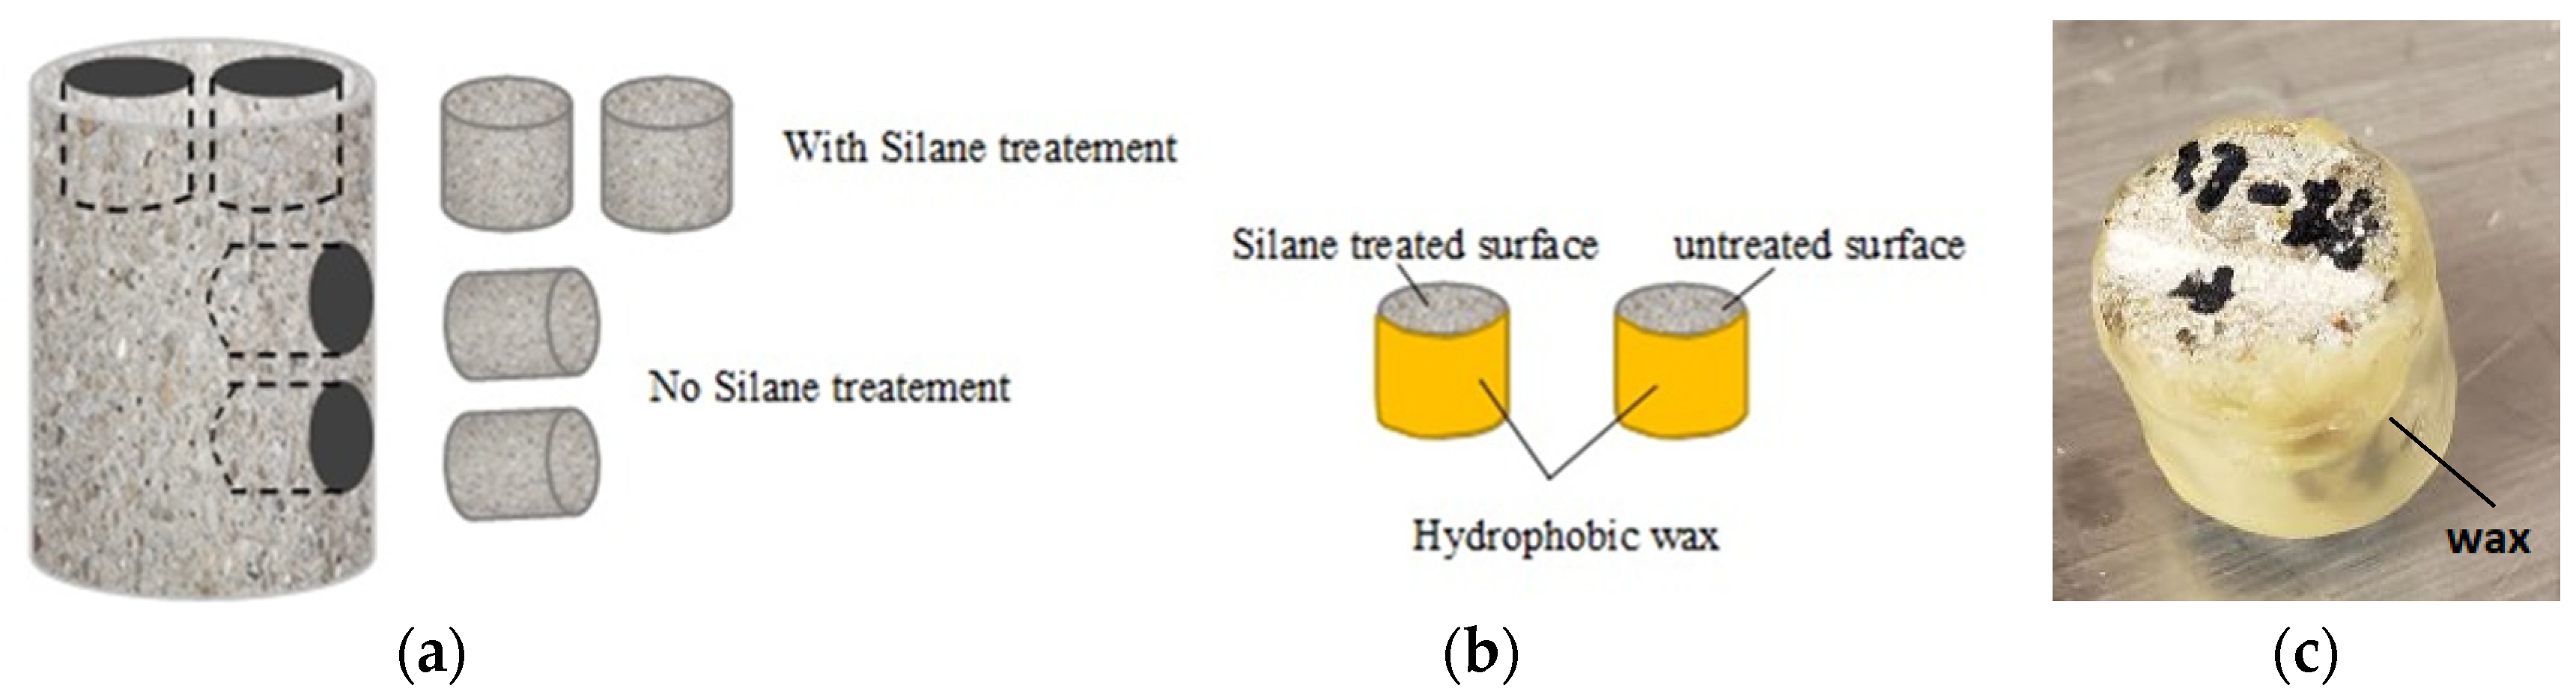
2.1. Sample Acquisition

This study was performed on concrete field samples that were in service for 1 year in some bridge decks in Oklahoma, USA. The bridge decks were not exposed to any external environmental stresses such as sulfate attacks or chloride attacks. Cylindrical samples approximately 100 mm in diameter and variable lengths were cored from 14 different bridge decks. One core (100 mm diameter, variable length) was collected from each location. The mixture designs are provided in Appendix A. These mixtures had a water-to-cementitious-material ratio between 0.41 and 0.44. Half of the mixtures (seven mixtures) used a 20% replacement of Class C fly ash by mass, and the others used only Portland cement. Each mixture contained water reducers and air-entraining agents. The silane was applied approximately 1 year after the bridge was in service. This is common practice for the Oklahoma Department of Transportation (ODOT).

2.2. Depth of Silane Penetration
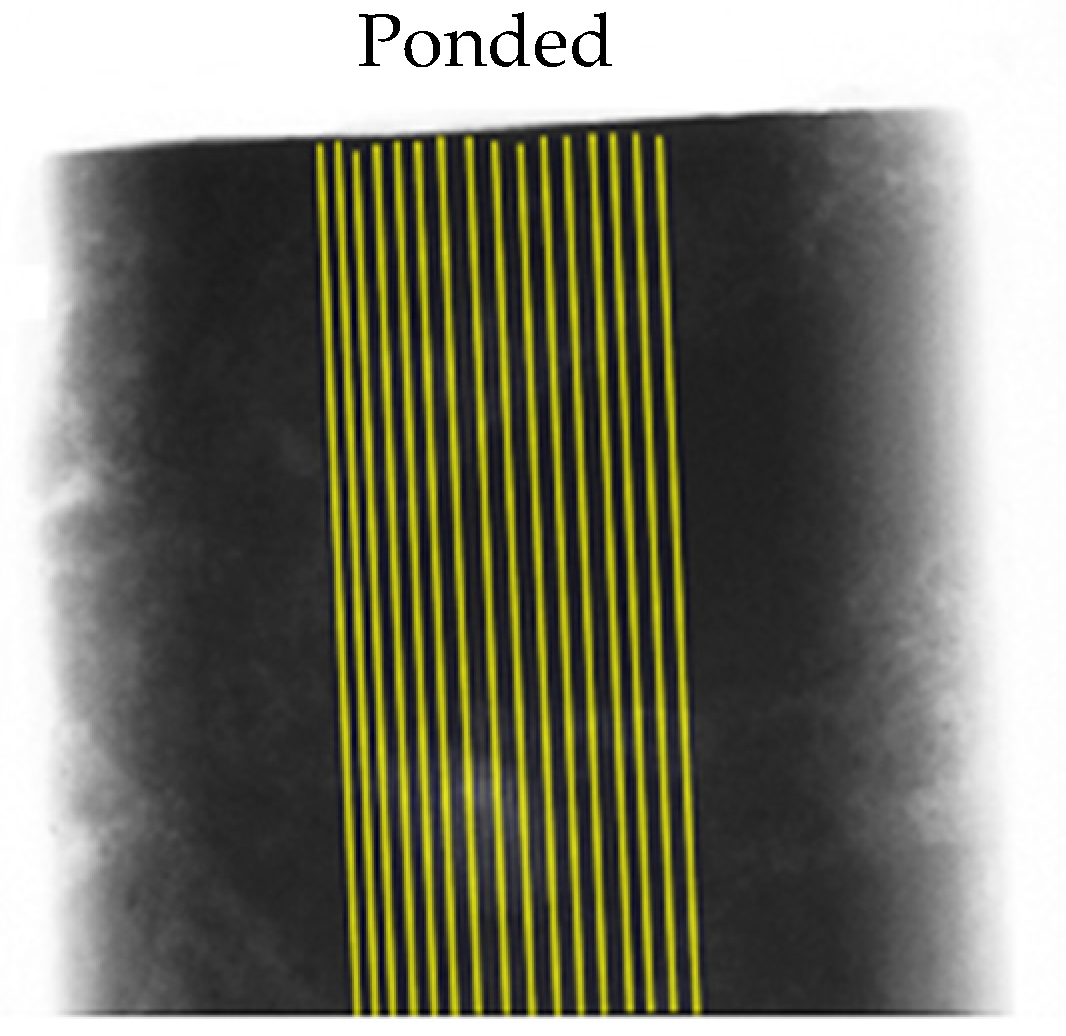
The test procedure recommended by the Alberta Transportation and Utilities (AT&U) was identified as a widely used method for finding the effective depth of sealant penetration [17]. In this study, a simple way was implemented to visually inspect the depth of silane penetration. The sides of all 14 collected samples were prepared for investigation at nine random spots on the perimeter of each sample. Each spot was prepared by polishing the sample with 120 grit sandpaper for 5 min to remove any laitance from the samples, as shown in Figure 1. The exposed surface of all 14 samples was stained with a dye at the nine polished spots. The dye changes the color of the concrete where it penetrates. This was shown to be a satisfactory manner to map the presence of silane in past work [7]. Next, pictures of the samples were taken with a digital microscope at each polished spot, and then images were processed to determine the depth of silane.
The profile of the silane coating was marked along with the depth of the penetration at five equally spaced locations, as shown in Figure 2. This led to 45 measurements (9 spots × 5 measurements at each spot) for each of the 14 cores. The silane penetration depth for each sample was then calculated by finding the mean and standard deviation of the 45 measurements.

2.3. Diffusion Test

NCHRP Report 244 [22] is one of the widely used documents for following and testing laboratory silane quality. This study tried to use a direct observation method to evaluate the effectiveness of the silane. The diffusion test method explained in this study is an alternative to the test method represented in NCHRP Report 244.
From each of the 14 samples, four cores of 19.05 mm (3/4 in) diameter were extracted: two cores from the finished surface coated with silane and two cores from the side without silane. An overview is shown in Figure 3a. These cores were also inspected to be sure that they did not contain a large aggregate near their surface as this would interfere with the diffusion measurement. If this occurred, then another core was taken. Next, the cores were oven-dried at 50 °C until less than 0.03% weight change in 24 h was observed. A constant mass was reached in 5 days. After this, the average degree of saturation (DoS) of all the cores was recorded equal to 2.05% ± 0.48%. Next, the sides of the cores except the surface were coated with a hydrophobic wax to force the outside fluid to penetrate the unwaxed surface. An overview of this is shown in Figure 3b,c. After waxing, a PVC hexagonal nut was attached to the bottom of the samples. This nut was matched with the hexagonal stage of the X-ray machine to load the samples in a consistent manner.
The diffusion test in this study used a potassium iodide (KI) tracer on top of the unwaxed surface of the samples. X-rays were used to take images before and after applying KI on top of the samples to study the one-directional mass transport into the samples for 28 days [3,5,47]. In this test, the gravity and moisture movement in the samples were in the same direction. Since TXM can capture materials with high electron density, potassium iodide (KI) was chosen to be used as the penetrating tracer. The iodide in the KI strongly absorbs X-ray waves due to its high electron density. Furthermore, iodide and chloride ions are similar in size (iodide’s radius is 206 pm versus chloride’s radius of 167 pm) which can provide valuable insights into the chloride diffusion mechanism of cement-based materials [3]. Moreover, another study proved that the concentration profile and diffusion coefficients obtained from the intrusion of iodide can represent the intrusion of chloride into a cement-based system [3]. The concentration of the KI solution was chosen equal to 0.6 mol/L to get enough contrast between the sample and the solution in the radiograph images. This matches previous procedures used to study the diffusion coefficient of cementitious systems [3].
Graphical representations of the absorbed X-rays are known as radiographs. Radiographs taken from the original samples before starting the experiment are known as reference radiographs, and these are compared with radiographs taken from the same samples at times after starting the experiment by applying KI solution to the samples. The concept behind this technique is that, when a solution with a high electron density penetrates a sample, the penetrated depths in the radiographs look darker in comparison to the reference radiograph before KI was placed on the surface. A profile of the concentration of iodine versus the depth of the sample can be produced by using calibration curves, as described in future sections. From the concentration profile the apparent diffusion coefficient, surface concentration, and depth of penetration can be calculated. The apparent diffusion coefficient combines the fluid transport mechanisms of diffusion, absorption, convection, and chemical binding in one term.
A Skyscan 1172 μCT scanner with the settings summarized in Table 1 was used to conduct the experiments and capture radiographs at the desired intervals. More details on the TXM method are provided in Appendix B. To start the diffusion test, samples were transferred to separate cells, which were filled with a 0.6 mol/L KI solution. The salt solution was kept on the samples for 28 days. In this period, the KI solution was changed every 5 days to keep the concentration constant. During the experiment, the cells were covered to prevent any evaporation and change in the solution concentration. All samples were kept at room temperature (23 °C) during the experiment. The samples were scanned at a number of time periods up to 28 days after ponding to get the secondary radiographs. Results represented in this paper were extracted from radiographs taken after 28 days of ponding.
To analyze and compare the taken radiographs, a software programming code with minimal user intervention was prepared in Matlab to apply local displacements on each image and align the secondary radiographs with the reference radiograph of each individual sample. Then, the central region of the samples with an approximate width of 100 pixels (0.88 mm) was used to find the average gray value at each depth, as shown in Figure 4. The center region was used to eliminate artefacts caused by a nonuniform cross-section. The obtained gray value profiles for each timeseries radiograph were subtracted from the gray value profile obtained from the reference images to quantify the changes in gray values because of mass transport in the samples. The Beer–Lambert law (Equation (1)) [41,42] was used to determine the subtracted gray values in attenuation at different depths of each sample.
(Δµ)x = ln (Iref)x − ln (It)x,
where (Iref)x is the transmitted X-ray intensity (gray value) at depth x on the reference profile, and (It)x is the transmitted X-ray intensity at the same depth at other intervals.
To convert the calculated attenuations to concentration, calibration curves were applied. Calibration curves plotted concentration vs. attenuation. To develop the calibration curves, standard samples made with known iodide concentrations added to the mixtures during mixing were used. These standard samples were scanned with the setup provided in Table 1. After scanning the standard samples, the attenuation correlated to each concentration was calculated. Ultimately, a curve was fitted to the obtained spots to obtain an equation which converts the attenuation to the concentration. By using the obtained equation, concentration profiles correlated to different durations of ponding were plotted for each sample. In these profiles, the ion concentration in terms of the weight percentage of the paste was calculated and plotted against the depth. The obtained concentration profiles give information about the concentration at each depth, and the slope of the profiles gives an idea about the rate of penetration. This work used the concentration of iodide at a given depth as a method to quantitatively compare the different samples. The diffusion coefficients were not used because these values for the silane-treated samples were nearly zero.

2.4. X-ray Computed Microtomography (XCT)

Computed tomography scanning is well known in medical diagnostic examinations. XCT is a powerful nondestructive method to investigate the 3D microstructure of materials. In this method, a sample is loaded between an X-ray source and a detector. Similar to TXM, as the sample is exposed to X-rays, some are absorbed by the sample and others pass through the sample to reach the detector. Images are captured at many different viewing angles. These images are used to make a 3D image called a tomograph. Like the gray values in the TXM radiographs, the voxel values in the tomograph represent materials with different chemical consistency and density. Different voxel values help to identify aggregates, paste, cracks, air voids, or other constituents within the concrete.
For this study, a ZEISS XRADIA 410 with the setting shown in Table 2 was used to scan samples. The XMReconstructor software was used to reconstruct the 2D radiographs and produce 2D cross-section slices. An open-source platform named “Fiji” [48] was used to stack all 2D slices and make the 3D model.

3. Results and Discussion

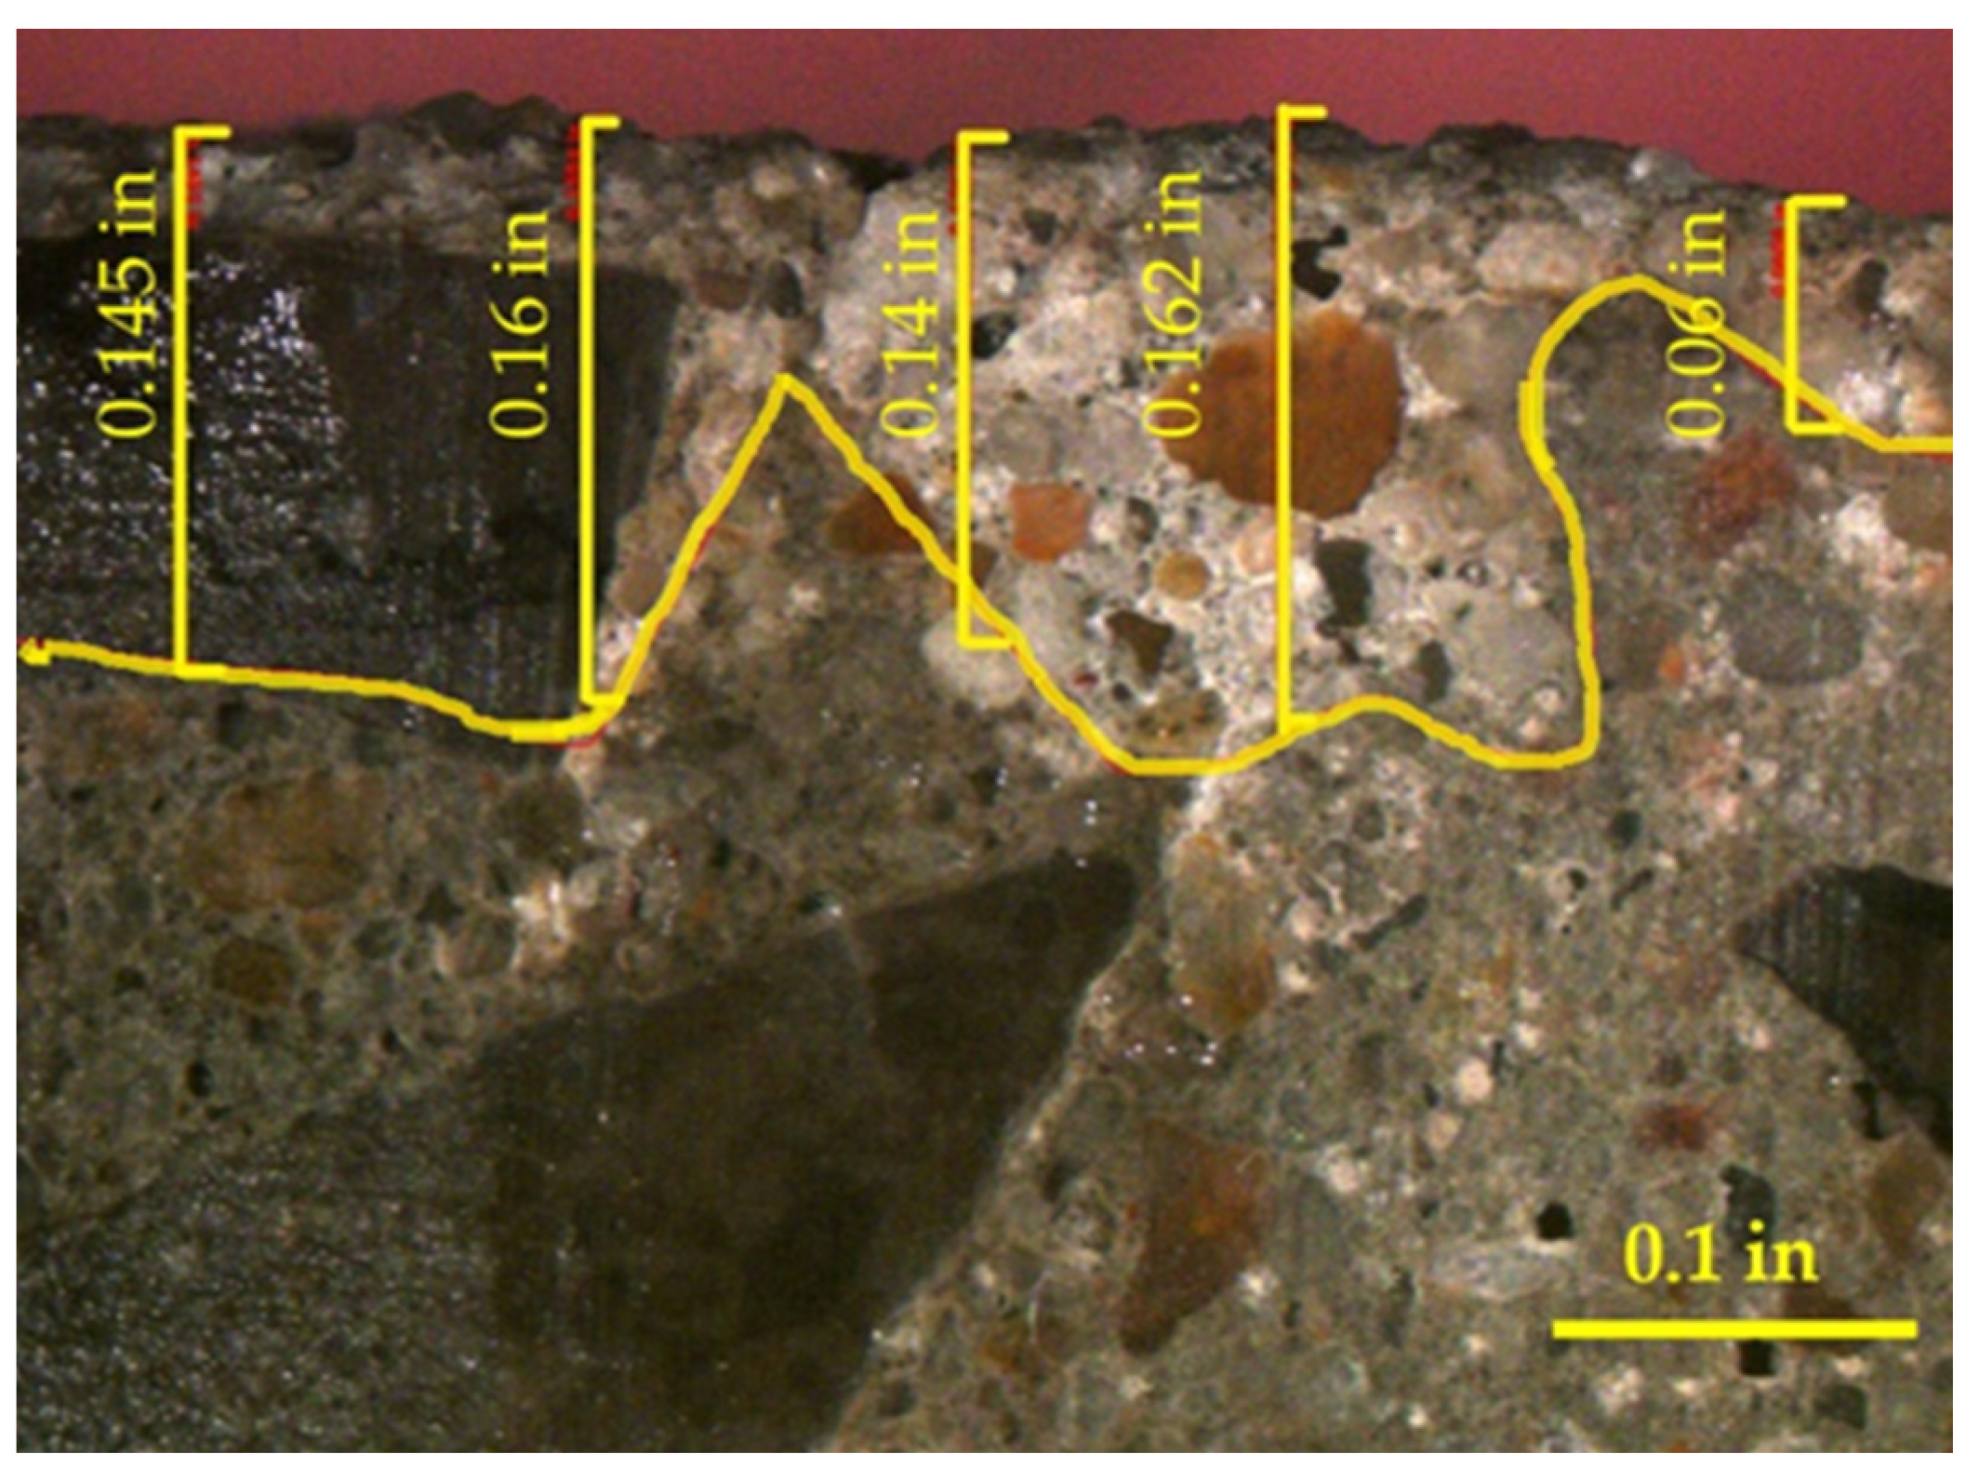
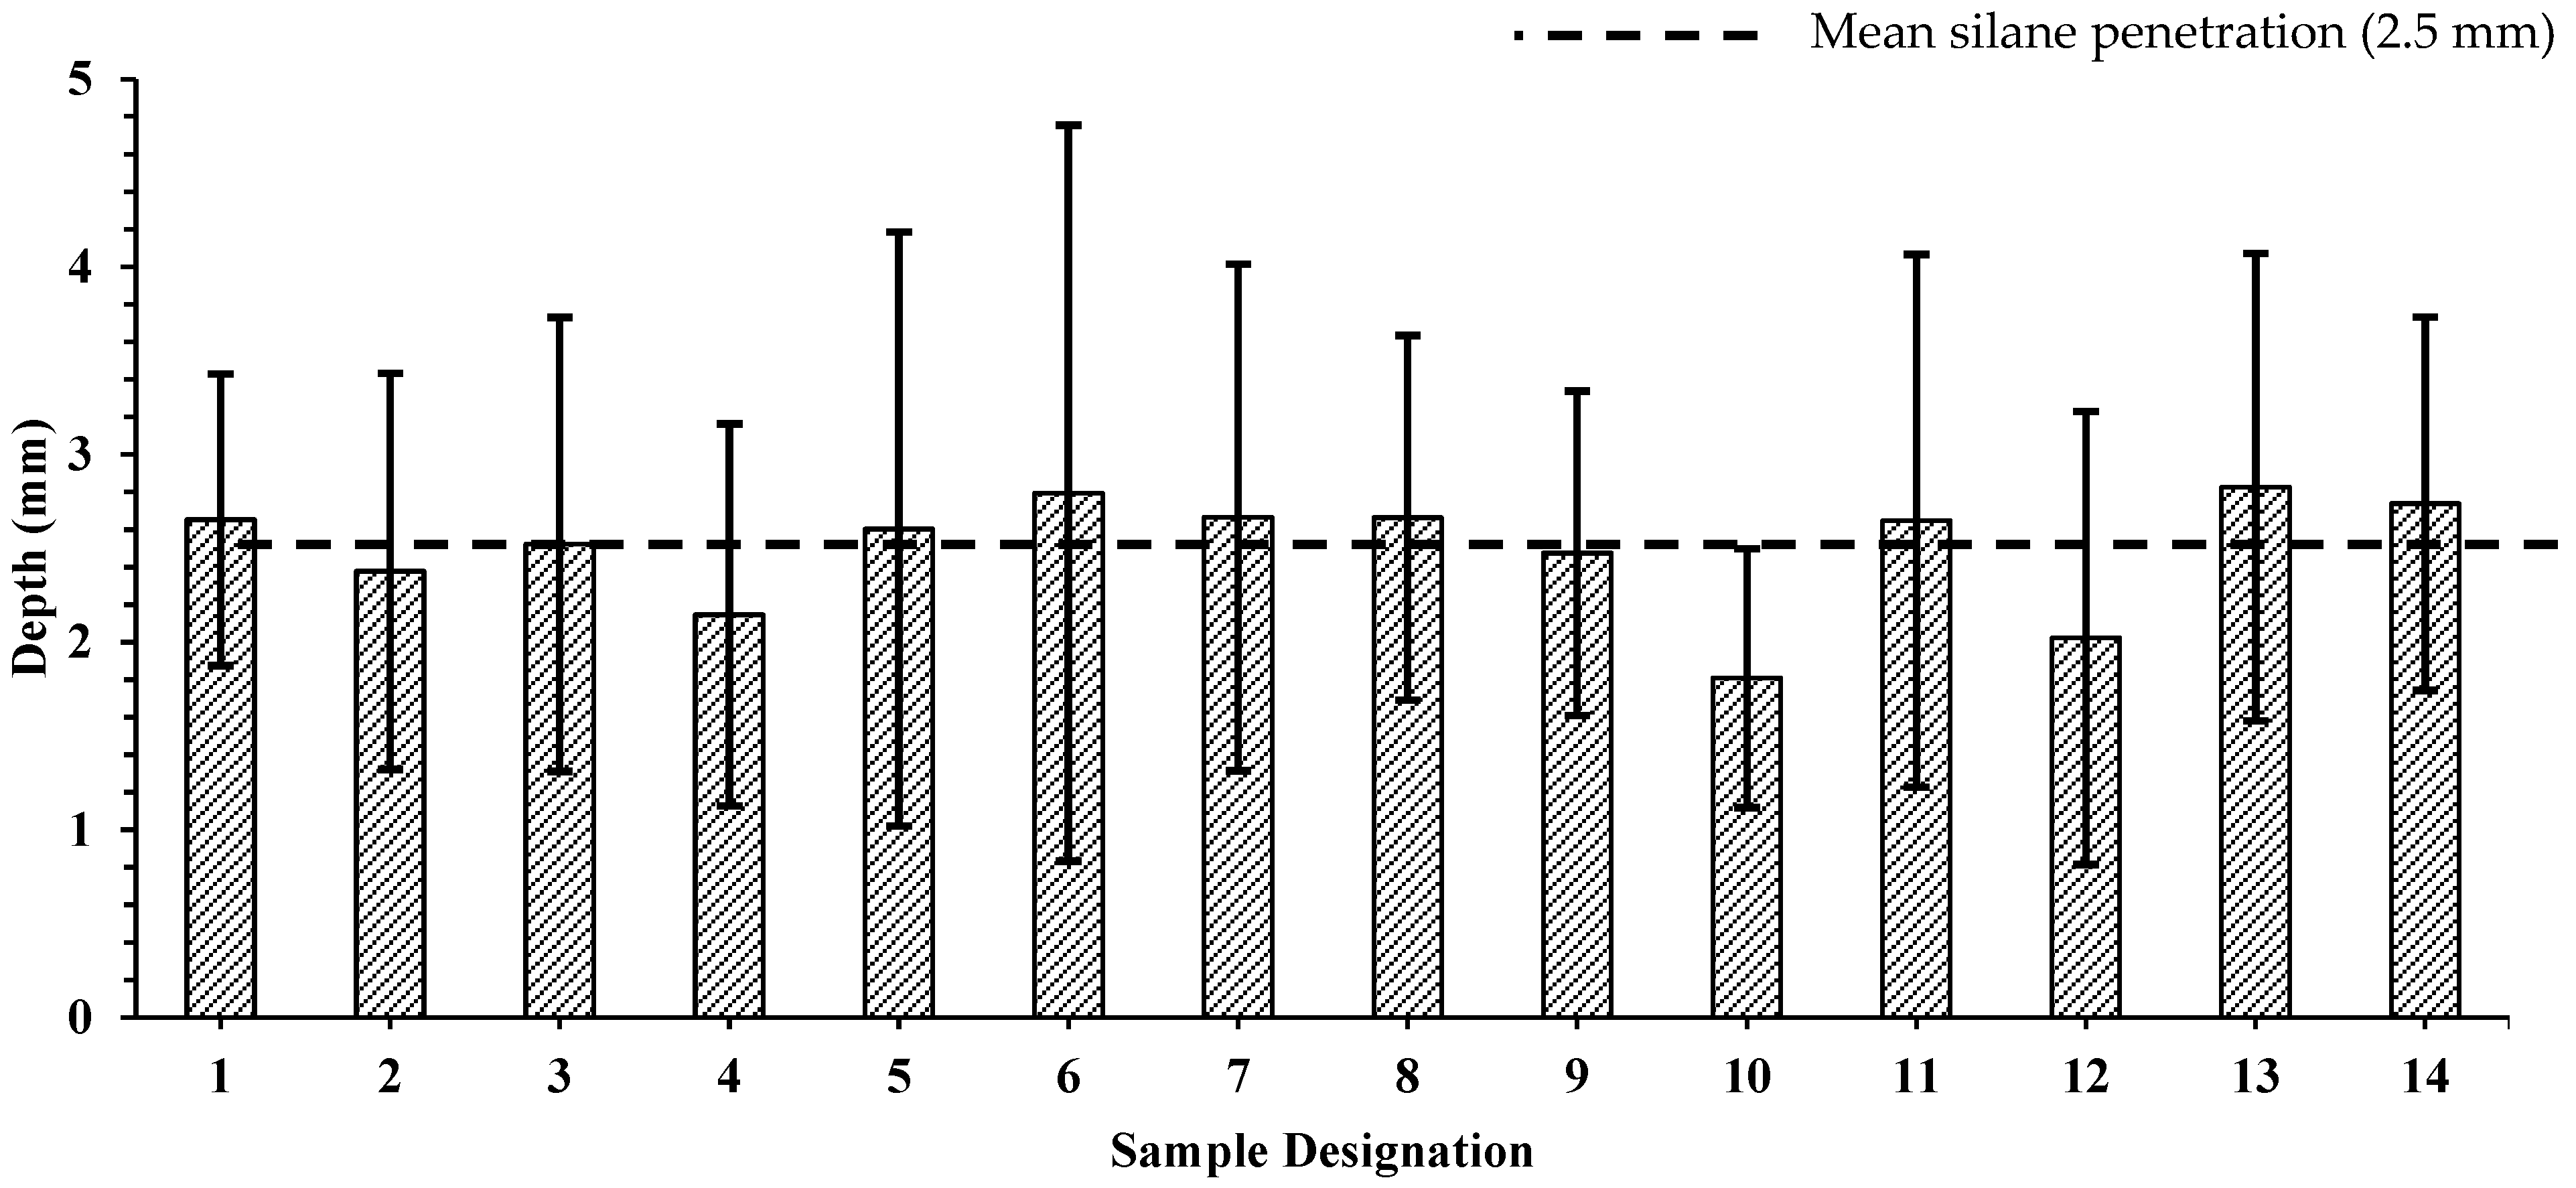
3.1. Depth of Silane Penetration

The mean depth for each sample is shown in Figure 5 along with error bars showing one standard deviation. The mean value of the 14 samples was found to be approximately 2.5 mm. The high variation shown for each sample signifies that the silane did not penetrate uniformly at each studied location. The penetration depth of silane depends on different parameters such as the surface tension of silane, which is mostly the driving force for the capillary transport, the viscosity of the silane liquid, the contact time, the type of solvent, and the chemical reactivity of silane.

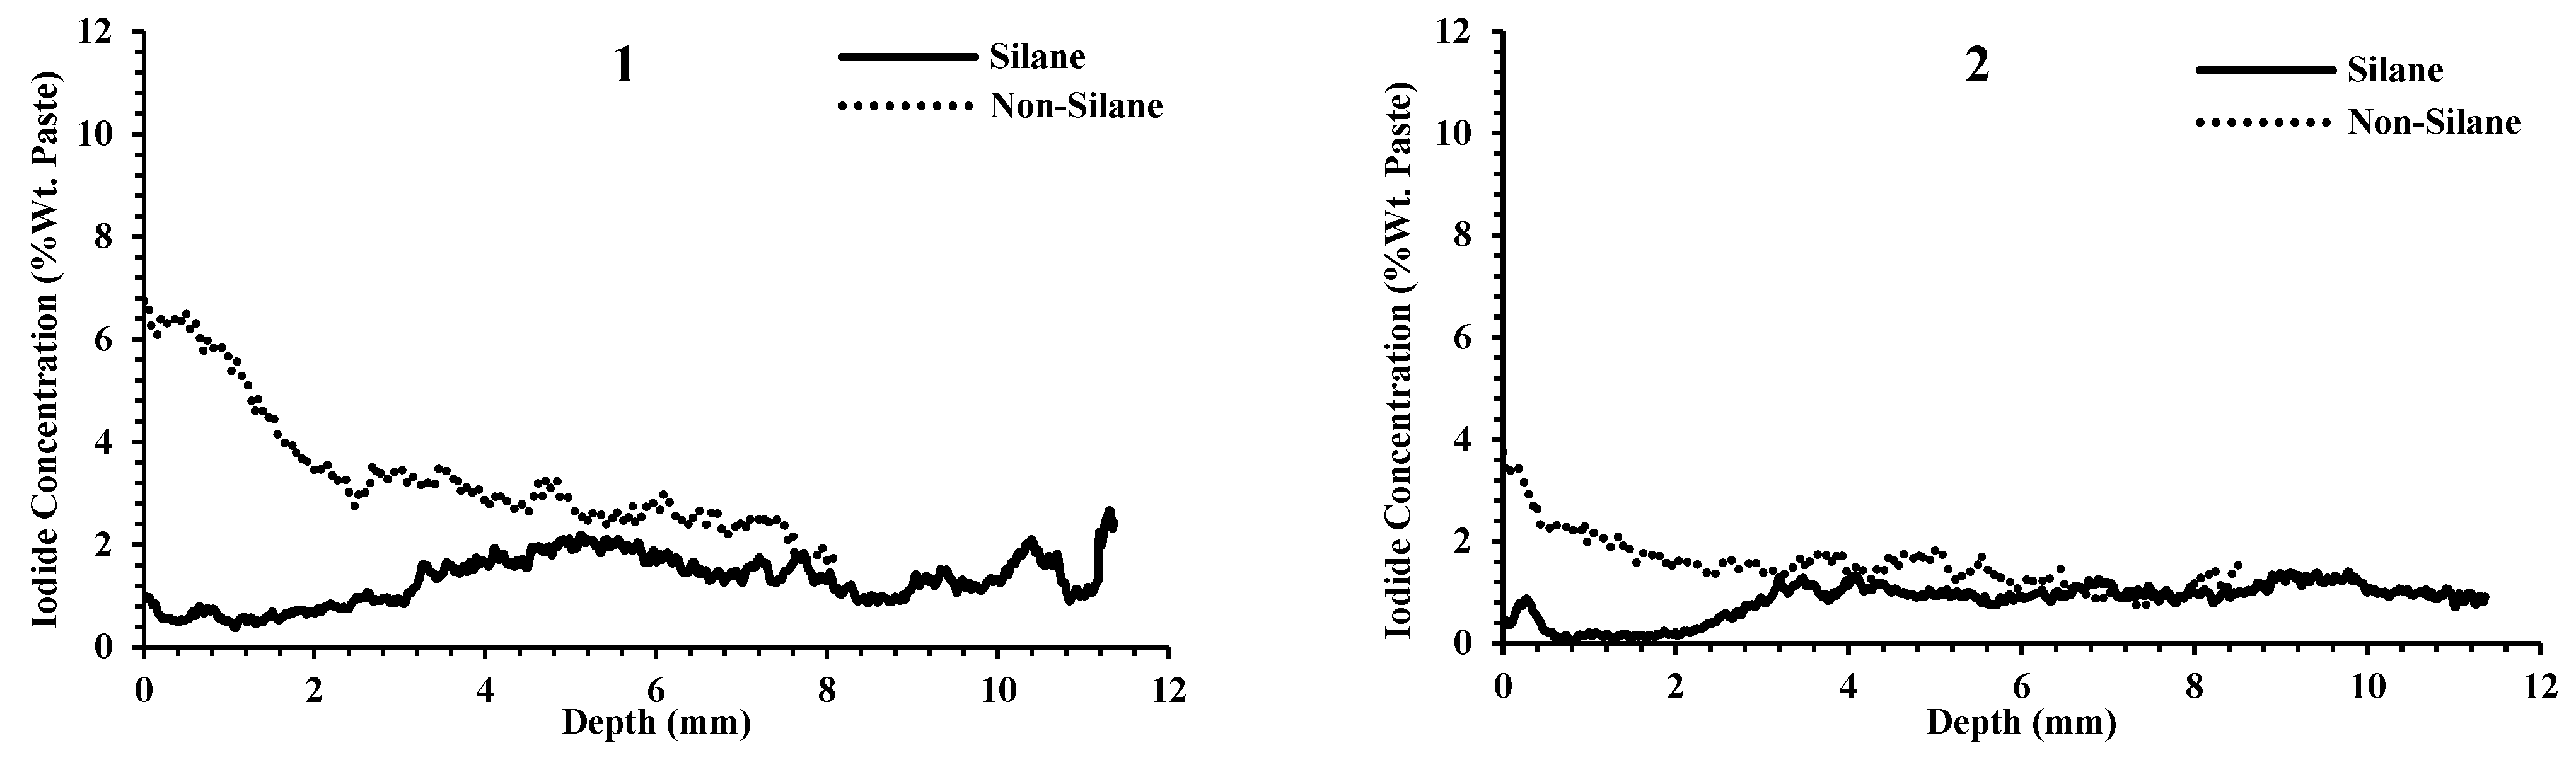
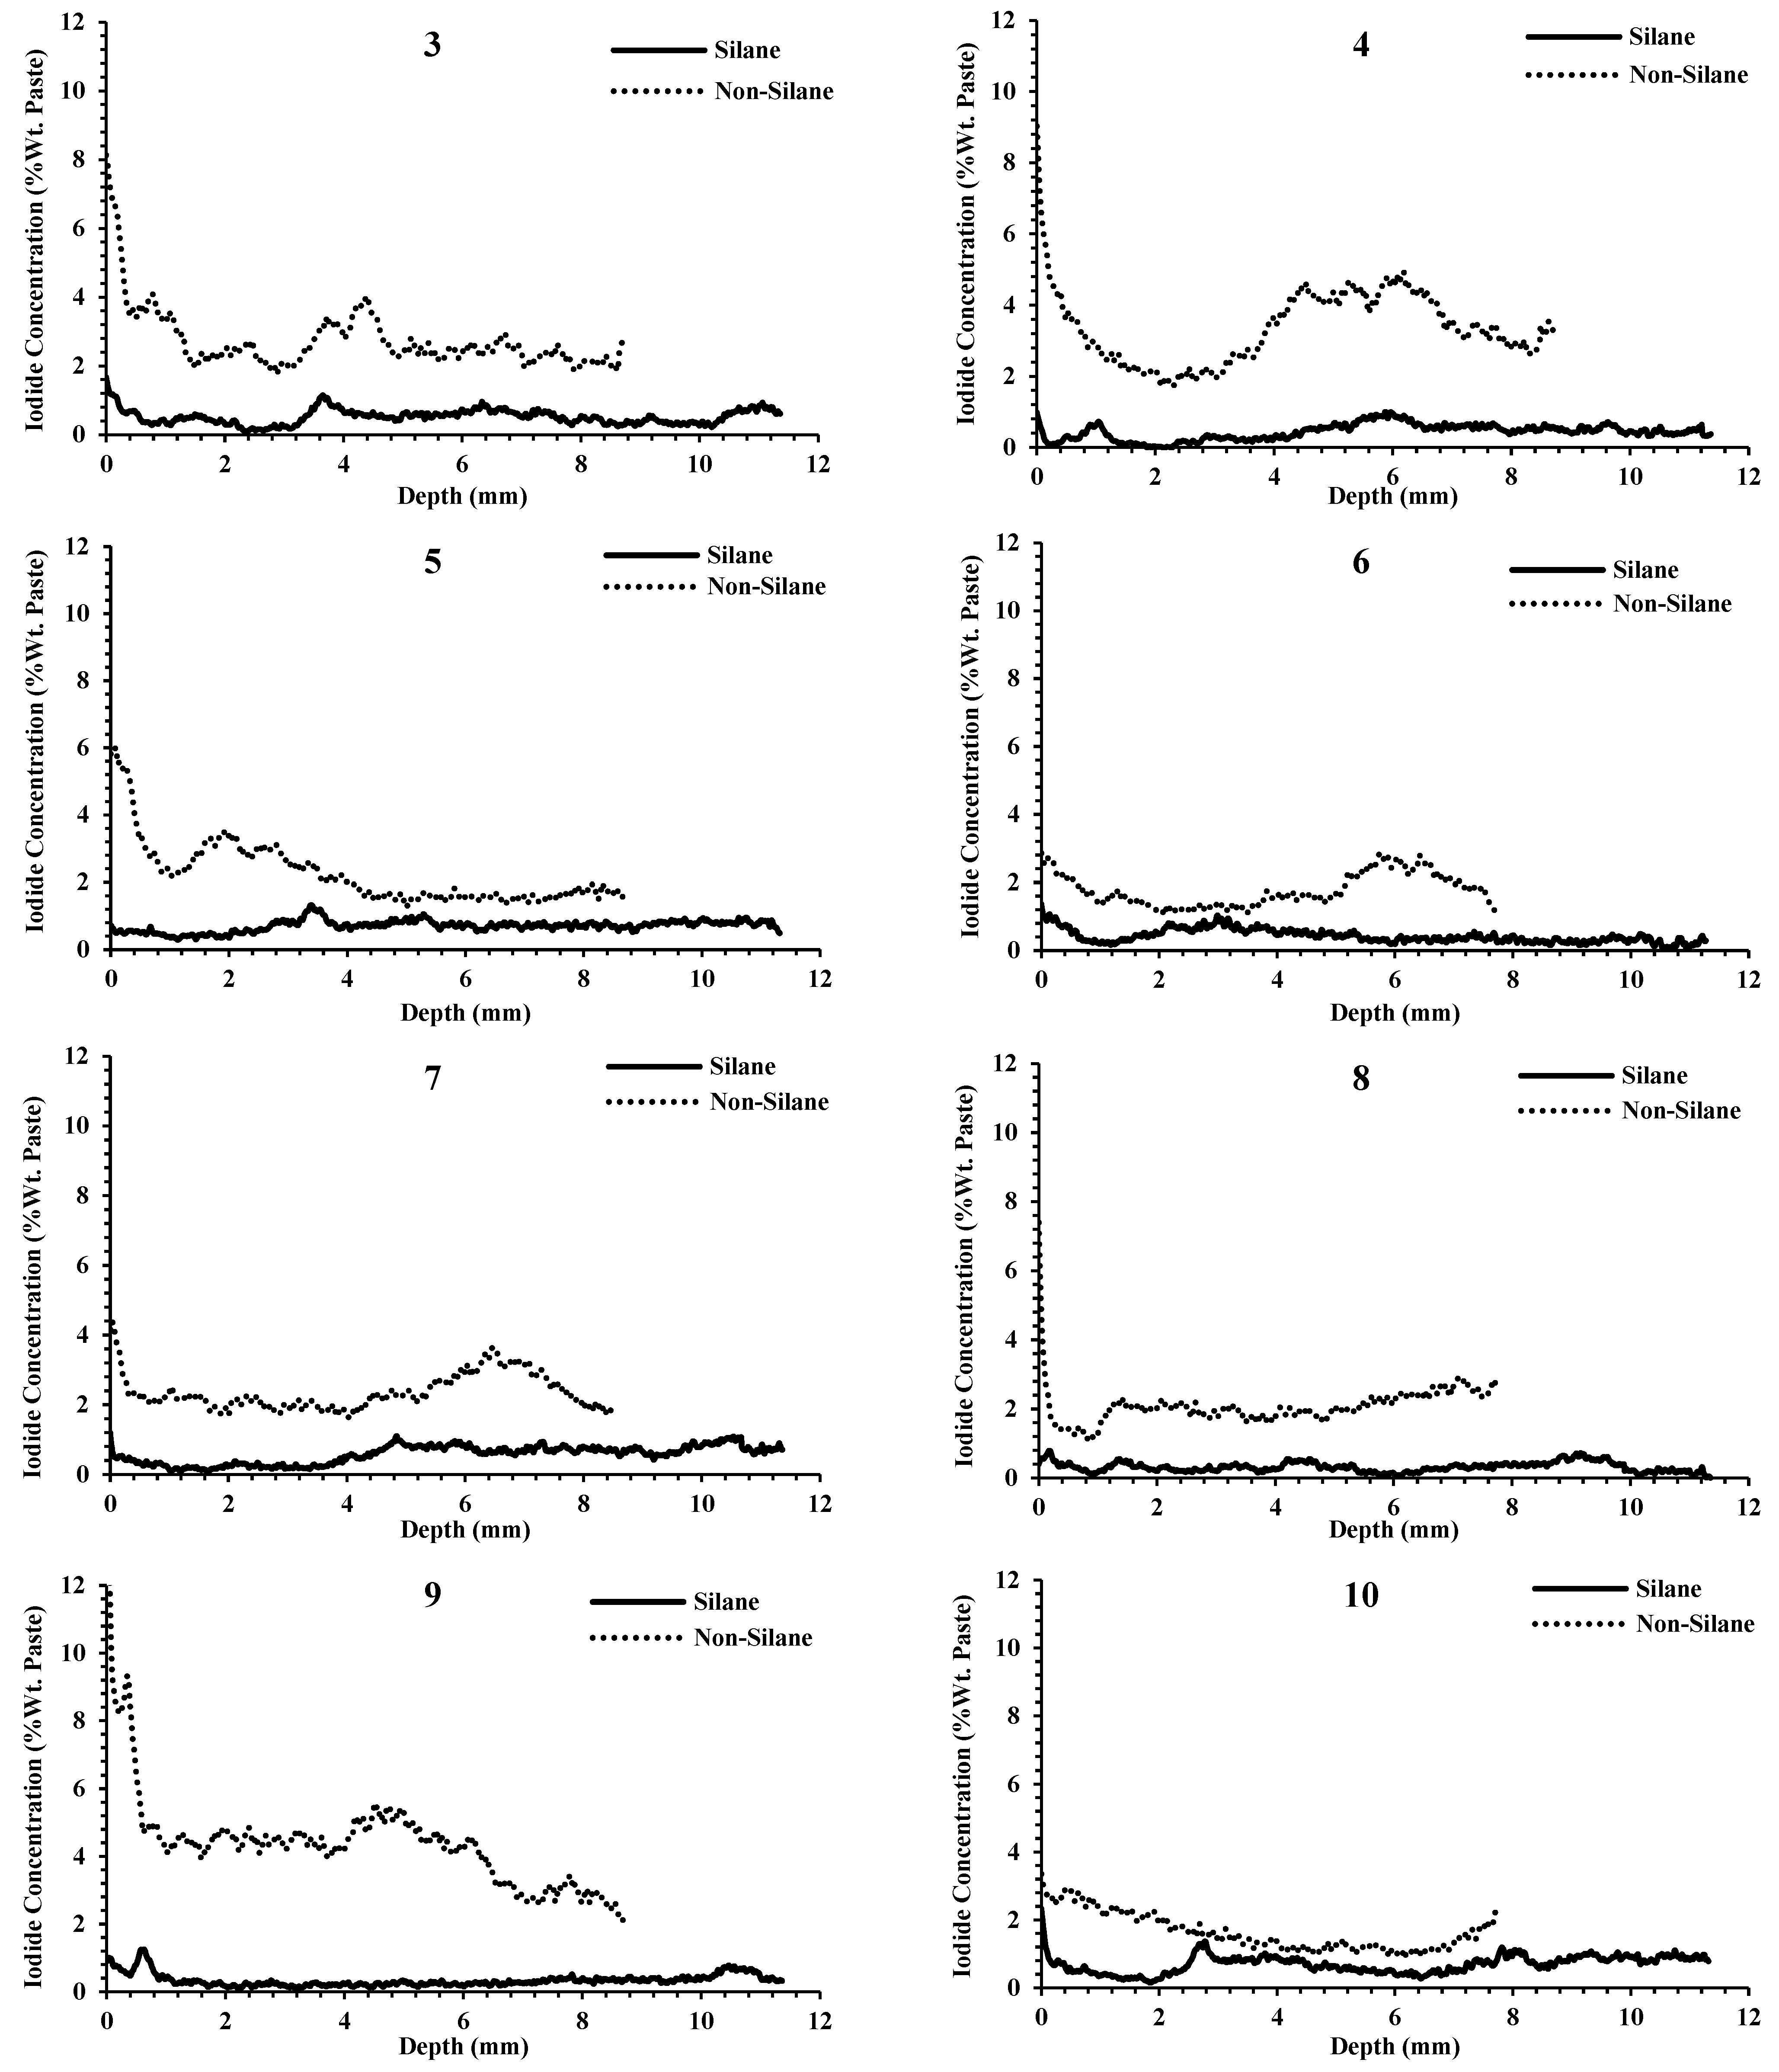
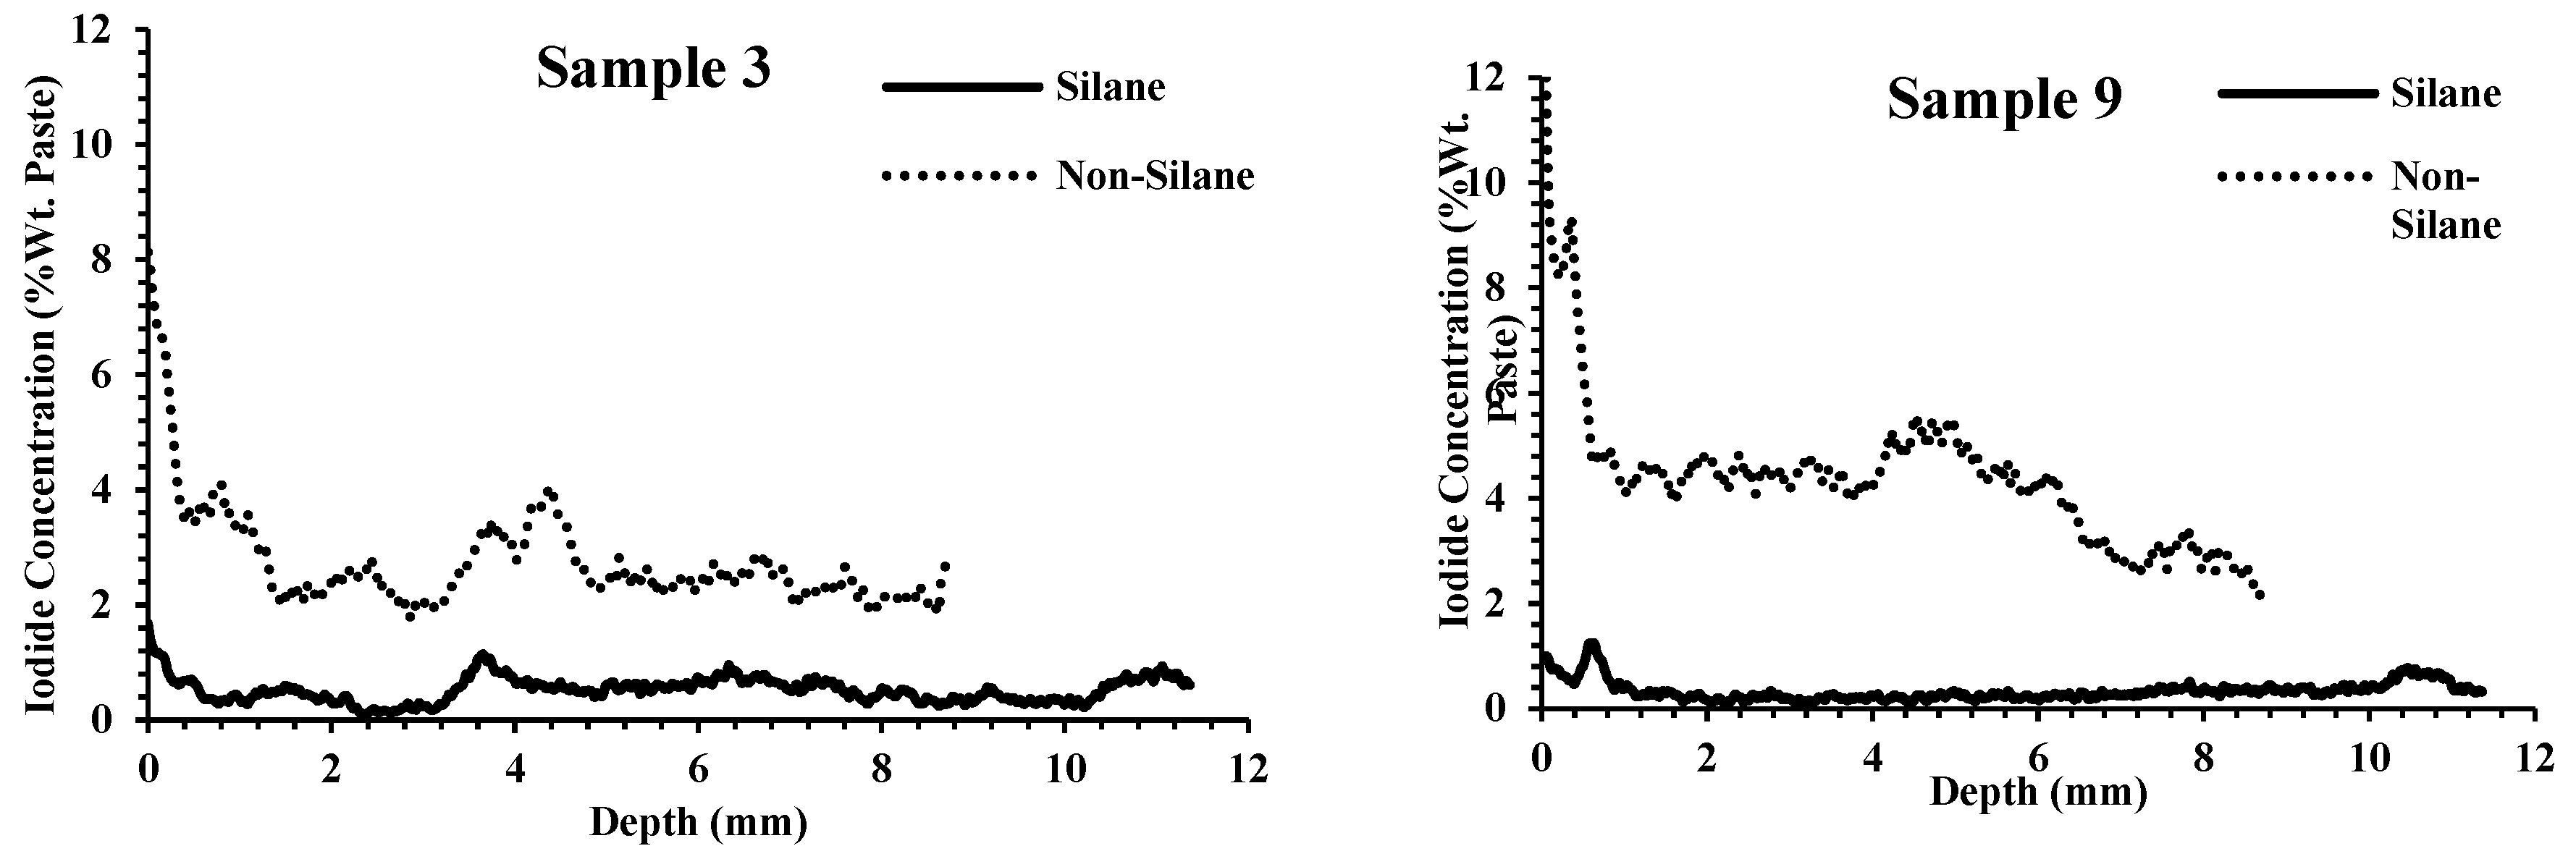
3.2. Resistance of Outside Chemical Penetration

Figure 6 shows typical concentration profiles for samples with and without silane. The iodide concentration profiles are the average from two samples for each project and two directions for each sample (a total of four concentration profiles). In each case, the measurement of the concrete without silane showed 2× to 4× the amount of iodide concentration at a comparable depth. Additional data for the other 14 locations are included in Appendix C.
Figure 7 compares the iodide concentrations of all samples at a fixed depth of 2 mm for both silane and non-silane samples. A depth of 2 mm was chosen as the silane was found to penetrate to this depth in all samples investigated.
The average of the iodide concentration from all samples without silane at a depth of 2 mm was 2.7%, while the average value for silane-treated samples at the same depth was 0.3%. These average values are shown with horizontal lines in Figure 7. This means that, on average, the outside salt solution penetrated 9× higher into the depth of samples without silane compared to those that were coated with silane. This is a drastic difference in the performance of 14 different bridge decks when the samples were treated with silane vs. when they were not treated.
For the non-silane samples, there existed a large variability among the samples. Some samples had iodide concentrations as low as 1% by weight, while some had concentrations greater than 4%. This may have been caused by the variation in the mixture design, casting practice, and curing methods employed for these samples.
The range of iodide concentration change for silane-treated samples was 0.03% to 0.66%. This shows that the variation of the iodide concentration was low. A possible reason is that silane is a surface treatment coating material which acts as a barrier. The results show that the effectiveness of the silane was not dependent on the initial quality of the concrete. For example, Sample 13 had the lowest penetration of iodine in the untreated sample, while Sample 9 had the highest penetration of iodine. Regardless of the initial penetration level, both samples had the same amount of iodide penetration after being treated with silane. This is an important finding as it shows that silane has the potential to improve a wide range of concrete quality. By considering Figure 5 and Figure 7 and by comparing Sample 4 (with silane penetration below the average) and Sample 1 (with the maximum silane penetration), it can be concluded that the performance of silane is not only related to the silane penetration but also some other factors such as surface preparation methods, application procedure, the influential environmental factors, and silane chemical properties. By comparing Samples 11 and 12, which had similar mix designs but different silane penetration depths, it can be concluded that, for a specific concrete, a greater depth of penetration provides better protection to concrete. Furthermore, by looking at the average values of iodide concentration for the treated and untreated samples, it can be concluded that silane can significantly reduce the penetration of outside chemicals of higher-permeability concrete.

3.3. Cracks

Figure 6 demonstrates horizontal concentration profiles with low values for silane-treated samples. For a few samples, the concentration profiles of the treated silane samples began to increase after depths of 2 mm. Two examples are shown in Figure 8. This means that, while silane was effective in protecting the first 2 mm, the salt solution was getting past the silane coating. This may have been caused by a crack in the silane coating or nonuniform performance by the silane.
To learn more, Sample 13 was investigated in more detail with XCT to investigate local abnormalities that might have allowed the solution to pass the surface coating. Investigations showed a crack in the red area of Figure 9 and Figure 10. This crack seems to have propagated from the surface to a depth of ~6.3 mm. This crack provided a path for the solution to penetrate beneath the coating. After the solution moved past the coating, the solution could diffuse through the paste and cause an increase in the iodide concentration. This shows that the cracks could compromise the silane coatings. This observation of how cracks impact the performance is not well documented in the literature. The proposed method provides a systematic process to investigate this phenomenon. The impact of crack width on the long-term performance of silane will be the subject of future work.

4. Conclusions

Samples from 14 concrete bridge decks treated with silane that were in service for 1 year were obtained. The depth of silane penetration and the ability of the silane to resist outside chemical penetration were investigated with optical staining and X-ray microscopy techniques. These results were compared to samples taken from the same concrete that was not treated with silane.
The following observations were made:
The average thickness of the silane coating for the 14 projects was 2.5 mm, and the silane reduced the penetration of outside chemicals on average 9× more than samples that were not treated with silane.
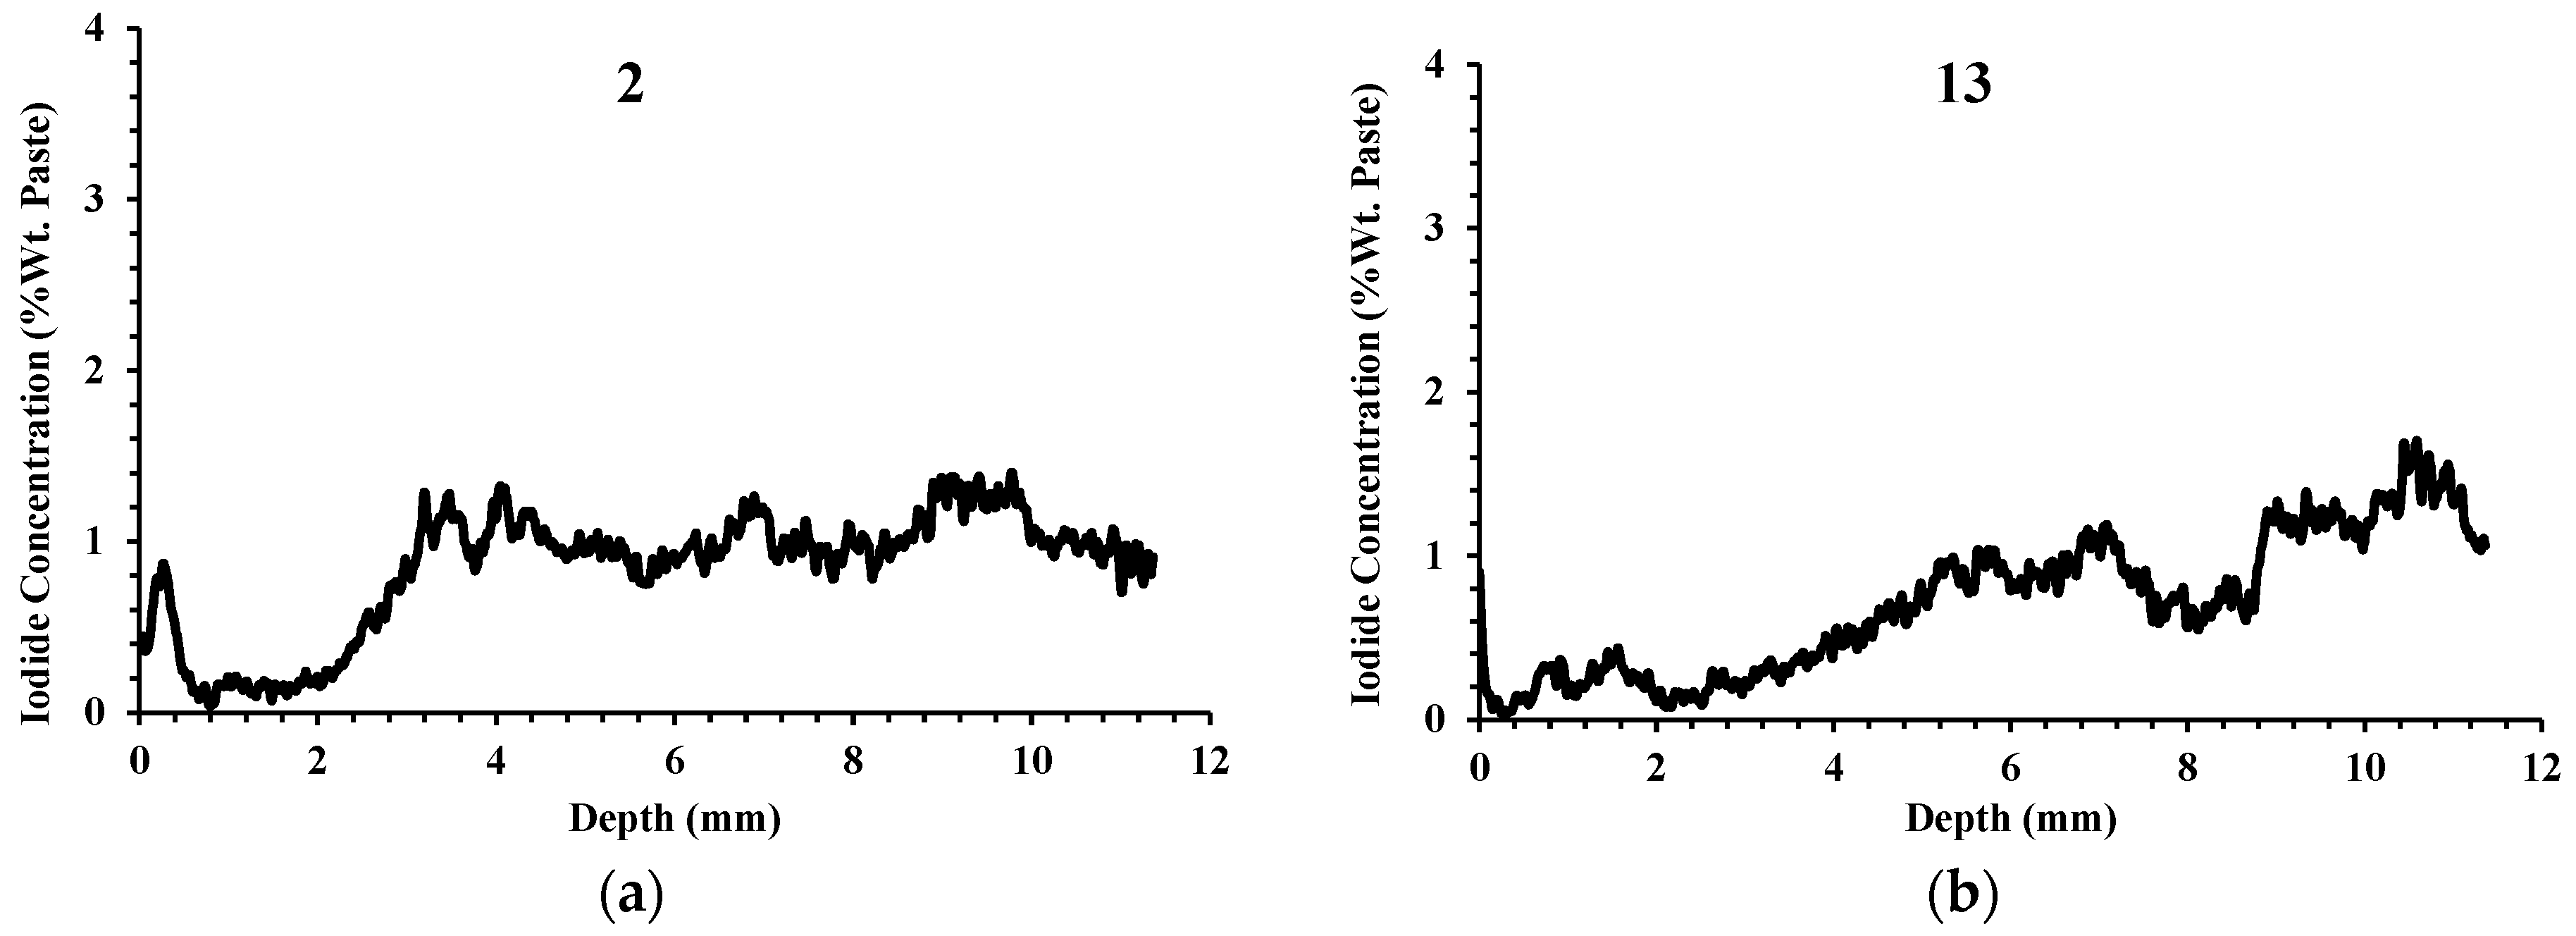
For the samples not coated with silane, there was large variability among the samples. At 2 mm in depth, some samples had iodide concentrations as low as 1% by weight and some had concentrations greater than 4%. Despite this high variability, the same concrete that was treated with silane showed low iodide concentration at 2 mm, varying between 0.03% and 0.66%.
Following the application of silane, a high reduction in chemical penetration occurred regardless of the ability of the nontreated concrete to resist chemical penetration. This shows the effectiveness of silane to resist chemical penetration for concretes with a wide range of qualities.
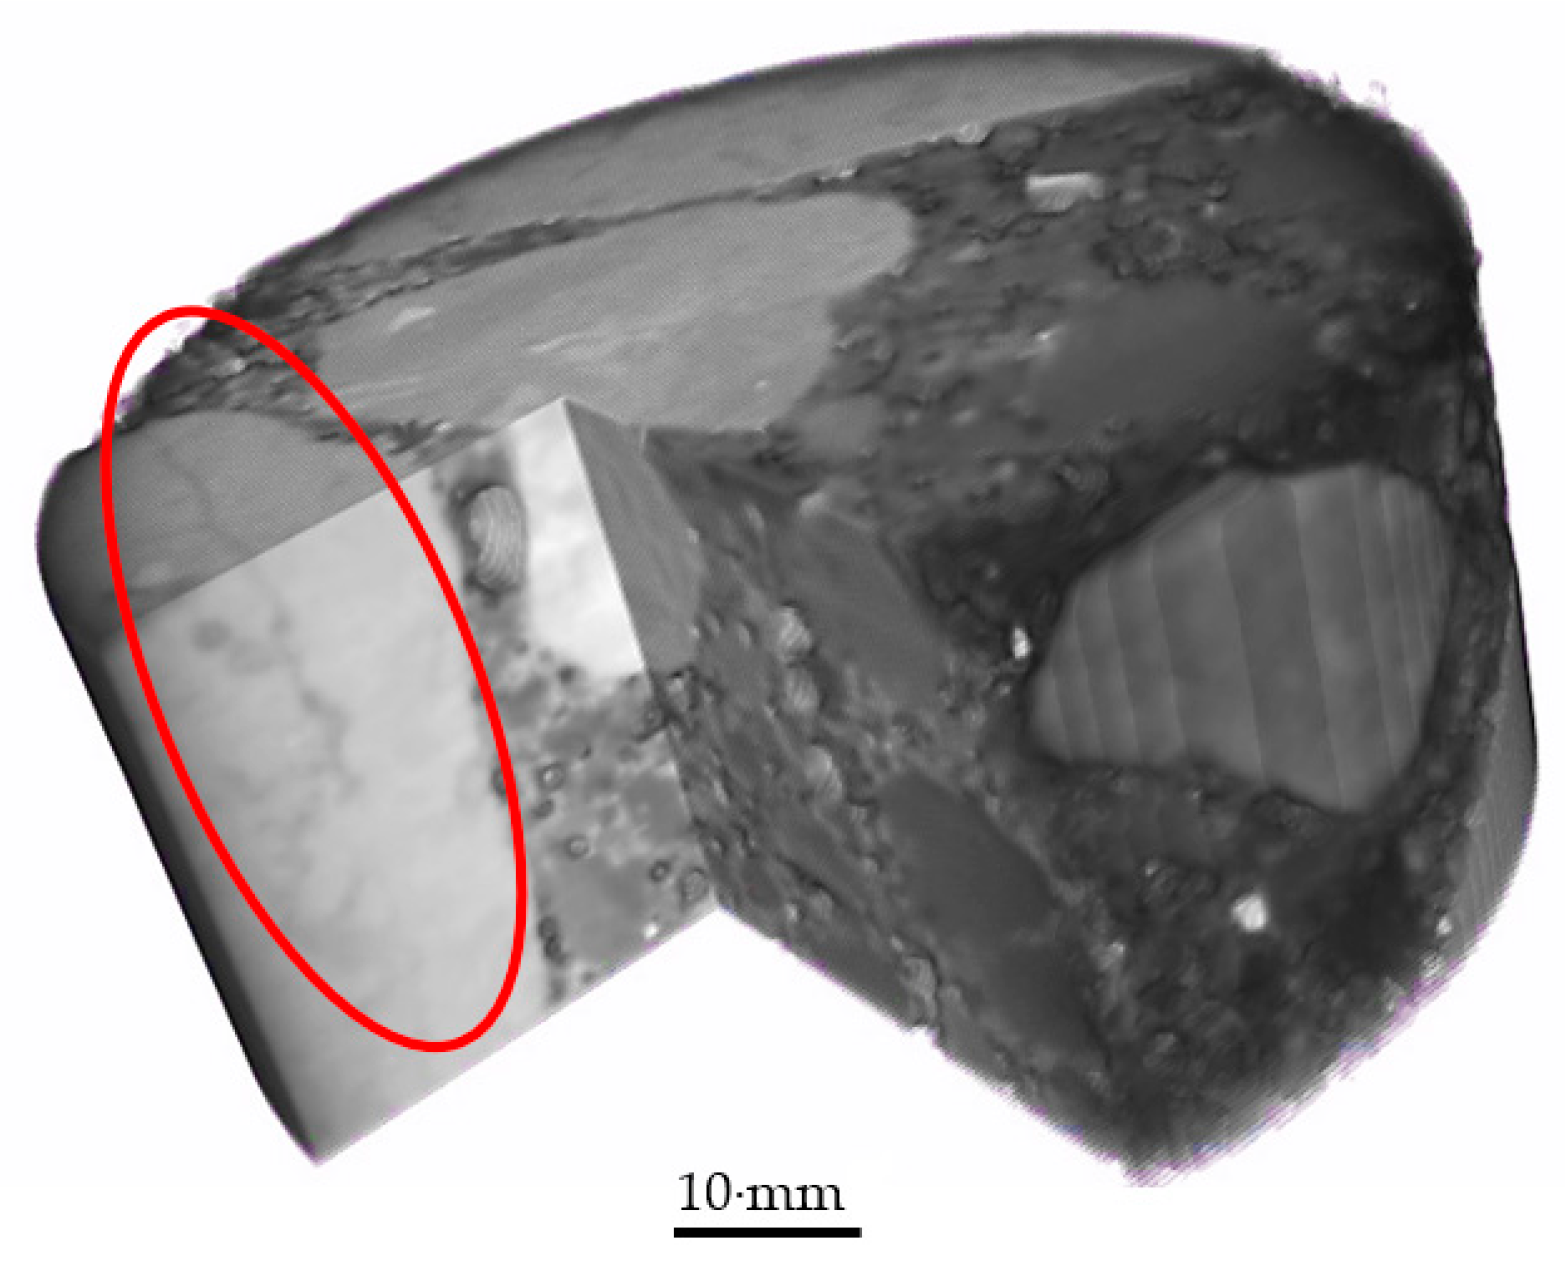
Outside chemicals were observed to penetrate past silane coatings when surface cracking was observed. This shows that cracks can compromise silane coatings. This will be an area of future study.
This work shows the usefulness of silane coatings for improving the durability of in-service concrete to outside chemical penetration only before surface cracking. This would benefit from a systematic laboratory study to control the concrete quality and then evaluate the depth of penetration and the effectiveness of the silane coating.

Author Contributions

Methodology, A.B., S.M.A., M.T.L. and N.J.D.; formal analysis, A.B.; investigation, A.B., S.M.A. and A.R.; data curation, A.B.; writing—original draft preparation, A.B. and S.M.A.; writing—review and editing, M.T.L. and N.J.D.; supervision, M.T.L. and N.J.D.; project administration, M.T.L. and N.J.D.; funding acquisition, M.T.L. and N.J.D. All authors read and agreed to the published version of the manuscript.

Funding

This research was funded by Oklahoma Department of Transportation (ODOT SP&R ITEM NUMBER 2287).

Institutional Review Board Statement

Not applicable.

Informed Consent Statement

Not applicable.

Data Availability Statement

The data presented in this study are available on request from the corresponding author.

Acknowledgments

The authors would like to thank Xiaodan (Sonia) Li for her help with XCT imaging.

Conflicts of Interest

The authors declare no conflict of interest.

Appendix A. Mixture Designs of All Samples

Table A1. Mixture designs of all samples.
SampleCoarse AggregateFine AggregateCementAir Content %Fly Ash (Type C)Water (kg/m3)Water Reducer (ASTM C-494 Type A/D)Air-Entrainer (ASTM C-260)w/b Ratio
NameSpecific Gravitykg/m3Specific Gravitykg/m3kg/m3Specific Gravitykg/m3TypeSpecific Gravitykg/m3Specific Gravitykg/m3
1#672.6910982.627313356NONE148A351.010.891.000.180.44
2#672.6910682.627093626NONE158A361.011.901.000.060.44
3#672.6910922.6273026862.6566.4147A371.011.131.000.060.44
4#672.6910742.6271829062.6572.4148A381.011.421.000.120.41
5Not Provided
6
7
8
9#672.6710682.627093626NONE158A361.011.901.000.060.44
10#672.6710722.6271429062.6572.4148A381.011.421.000.120.41
11#572.6510092.637772686.5 ± 1.52.6567.0148A35Not ProvidedNot Provided0.44
12#572.6510092.637772686.5 ± 1.52.6567.0148A350.44
13#572.6510202.637773356.5 ± 1.5NONE148A360.44
14#572.6510202.637773356.5 ± 1.5NONE148A370.44

Appendix B. Transmission X-ray Microscopy (TXM) Technique

A Skyscan 1172 μCT scanner with the settings summarized in Table 1 was used to conduct the experiments and take radiographs at the desired intervals. In this machine, each sample was loaded on a fixed stage between the X-ray source and the detector. When X-rays hit the loaded sample, some of the X-rays are absorbed by the sample while others pass through the sample to reach to the detector. The detector produces simple grayscale radiographs on the basis of the received X-rays. Each pixel in the taken radiographs has a gray value between “0” which represents pure black and “255” which represents pure white. Values in between make up the different shades of gray. In the captured radiographs, materials with higher density are darker (have low gray values) and materials with lower density are brighter (have high gray values). When a solution with high electron density penetrates a sample, the penetrated depths get lower gray values and, consequently, become darker because of the free, absorbed, and bound ions. To check the gray value change at different depths in this method, subsequent radiographs of each individual sample taken at different days after ponding are compared to the correspondent reference radiograph. To compare the radiographs of each sample, all the radiographs taken at other intervals should be identical to their reference radiograph. To obtain consistent radiographs at different intervals for each sample, it is necessary to scan a constant side of the samples. For this purpose, an appropriate stage was designed to fix the position of the samples in the X-ray scanner. This stage forces the user to load the sample in a constant manner and scan the same side of the samples at each considered interval. Keeping the direction constant becomes more important when concrete samples are being investigated.

Appendix C. Silane and Non-Silane Profiles of All Samples

The iodide concentration profiles are shown in Figure A1, averaged from two samples for each project and two directions for each sample (a total of four concentration profiles). The dashed line represents the data of cores taken from the side without any silane treatment, while the solid lines show the data for the silane-treated samples. In Figure A1, it can be observed that the application of silane decreased the iodide concentration and was effective in keeping the outside chemicals from penetrating. In some cases, the concentration values at greater depths for silane and non-silane samples came very close. In some of the samples such as 1, 2, 3, 7, 12, 13, and 14, it can be observed that the concentration values were low for silane samples near the surface; however, as the depth increased, the concentration profiles increased and approached those of non-silane samples.
Figure A1. Iodide concentration profiles of all 14 samples.
Applsci 12 02557 g0a1aApplsci 12 02557 g0a1bApplsci 12 02557 g0a1c

References

  1. Koch, G.H.; Brongers, M.; Thompson, N.G.; Virmani, Y.P.; Payer, J.H. Corrosion Cost and Preventive Strategies in the United States. March 2002. Available online: https://rosap.ntl.bts.gov/view/dot/40697 (accessed on 25 March 2019).
  2. Khanzadeh-Moradllo, M.; Meshkini, M.H.; Eslamdoost, E.; Sadati, S.; Shekarchi, M. Effect of Wet Curing Duration on Long-Term Performance of Concrete in Tidal Zone of Marine Environment. Int. J. Concr. Struct. Mater. 2015, 9, 487–498. [Google Scholar] [CrossRef] [Green Version]
  3. Khanzadeh Moradllo, M.; Hu, Q.; Ley, M.T. Using X-ray imaging to investigate in-situ ion diffusion in cementitious materials. Constr. Build. Mater. 2017, 136, 88–98. [Google Scholar] [CrossRef]
  4. Ley, T.M.; Sudbrink, B.; Kotha, H.; Materer, N.; Applett, A. Expected Life of Silane Water Repellant Treatments on Bridge Decks (FHWA-OK-12-08). 2012. Available online: https://trid.trb.org/view/1237835 (accessed on 25 March 2019).
  5. Ley, M.T.; Materer, N.F.; Sudbrink, B.; Khanzadeh Moradllo, M.; Hu, Q.; Ley, M.T.; Davis, J.M.; Materer, N.F.; Apblett, A. Imaging the presence of silane coatings in concrete with micro X-ray fluorescence. Cem. Concr. Res. 2017, 92, 121–127. [Google Scholar] [CrossRef]
  6. Ray, I.; Gong, Z.; Davalos, J.F.; Kar, A. Shrinkage and cracking studies of high performance concrete for bridge decks. Constr. Build. Mater. 2012, 28, 244–254. [Google Scholar] [CrossRef]
  7. Khanzadeh Moradllo, M.; Sudbrink, B.; Ley, M.T. Determining the effective service life of silane treatments in concrete bridge decks. Constr. Build. Mater. 2016, 116, 121–127. [Google Scholar] [CrossRef]
  8. Basham, K.; Meredith, J. Measuring water penetration. Mag. Mason. Constr. 1995, 8, 539–543. [Google Scholar]
  9. Mehta, P.K. Durability of Concrete—Fifty Years of Progress? Spec. Publ. 1991, 126, 1–32. [Google Scholar] [CrossRef]
  10. Portland Cement Association. Types and Causes of Concrete Deterioration; Portland Cement Association: Skokie, IL, USA, 2002. [Google Scholar]
  11. De Domenico, D.; Messina, D.; Recupero, A. A Combined Experimental-Numerical Framework for Assessing the Load-Bearing Capacity of Existing PC Bridge Decks Accounting for Corrosion of Prestressing Strands. Materials 2021, 14, 4914. [Google Scholar] [CrossRef]
  12. Lu, S.; Landis, E.N.; Keane, D.T. X-ray microtomographic studies of pore structure and permeability in Portland cement concrete. Mater. Struct. 2006, 39, 611–620. [Google Scholar] [CrossRef]
  13. Dean, S.W.; Sant, G.; Weiss, J. Using X-ray Absorption to Assess Moisture Movement in Cement-Based Materials. J. ASTM Int. 2009, 6, 1–15. [Google Scholar] [CrossRef]
  14. Hasan, N. Durability and Sustainability of Concrete: Case Studies for Concrete Exposures; Springer Nature: Berlin/Heidelberg, Germany, 2020; ISBN 3030515737. [Google Scholar]
  15. Bentur, A.; Berke, N.; Diamond, S. Steel Corrosion in Concrete: Fundamentals and Civil Engineering Practice; CRC Press: Boca Raton, FL, USA, 1997. [Google Scholar]
  16. Khanzadeh Moradllo, M.; Shekarchi, M.; Hoseini, M. Time-dependent performance of concrete surface coatings in tidal zone of marine environment. Constr. Build. Mater. 2012, 30, 198–205. [Google Scholar] [CrossRef]
  17. Attanayaka, U.; Ng, S.; Aktan, H. Criteria and Benefits of Penetrating Sealants for Concrete Bridge Decks; Michigan Department of Transportation: Lansing, MI, USA, 2002. [Google Scholar]
  18. Anderson, R.; Arkles, B.; Larson, G. Silicon Compounds Register and Review, Petrarch Product Catalog; Petrarch Systems, Inc.: Bristol, PA, USA, 1987. [Google Scholar]
  19. Carter, P.D. Evaluation of Dampproofing Performance and Effective Penetration Depth of Silane Sealers in Concrete. Spec. Publ. 1994, 151, 95–118. [Google Scholar] [CrossRef]
  20. Bush, T.D., Jr.; Kamel, A.A.; Kalluri, P.A. Influence of Field Variables on Laboratory Performance of Silane Treated Concrete. ACI Mater. J. 1997, 94, 193–202. [Google Scholar] [CrossRef]
  21. Kerkhoff, B. Effects of Substances on Concrete and Guide to Protective Treatments; Portland Cement Association: Skokie, IL, USA, 2007. [Google Scholar]
  22. Pfeifer, D.W.; Scali, M.J. Concrete Sealers for Protection of Bridge Structures; Transportation Research Board: Washington, DC, USA, 1981. [Google Scholar]
  23. Medeiros, M.; Helene, P. Efficacy of surface hydrophobic agents in reducing water and chloride ion penetration in concrete. Mater. Struct. 2007, 41, 59–71. [Google Scholar] [CrossRef]
  24. Medeiros, M.H.F.; Helene, P. Surface treatment of reinforced concrete in marine environment: Influence on chloride diffusion coefficient and capillary water absorption. Constr. Build. Mater. 2009, 23, 1476–1484. [Google Scholar] [CrossRef]
  25. Dunn, J.R. Performance of Concrete Bridge Deck Sealers; University of Alabama: Tuscaloosa, AL, USA, 2015. [Google Scholar]
  26. Ren, Z.J. Influence of Water Repellent Treatment on Corrosion of Steel in Concrete with Chloride Ingress. Adv. Mater. Res. 2012, 368–373, 2430–2436. [Google Scholar] [CrossRef]
  27. McCarthy, M.J.; Giannakou, A.; Jones, M.R. Comparative performance of chloride attenuating and corrosion inhibiting systems for reinforced concrete. Mater. Struct. Constr. 2004, 37, 671–679. [Google Scholar] [CrossRef]
  28. Cady, P.D. Sealers for Portland Cement Conrete Highway Facilities; Transportation Research Board: Washington, DC, USA, 1994. [Google Scholar]
  29. Cairns, J.; Melville, C. The effect of concrete surface treatments on electrical measurements of corrosion activity. Constr. Build. Mater. 2003, 17, 301–309. [Google Scholar] [CrossRef]
  30. Oklahoma Department of Transportation. State Planning and Research Work Program FFY 2020. 2019. Available online: https://oklahoma.gov/content/dam/ok/en/odot/documents/research/2020-spr-workbook.pdf (accessed on 22 August 2020).
  31. Christodoulou, C.; Goodier, C.I.; Austin, S.A.; Webb, J.; Glass, G.K. Long-term performance of surface impregnation of reinforced concrete structures with silane. Constr. Build. Mater. 2013, 48, 708–716. [Google Scholar] [CrossRef] [Green Version]
  32. Dai, J.G.; Akira, Y.; Wittmann, F.H.; Yokota, H.; Zhang, P. Water repellent surface impregnation for extension of service life of reinforced concrete structures in marine environments: The role of cracks. Cem. Concr. Compos. 2010, 32, 101–109. [Google Scholar] [CrossRef]
  33. Weyers, R.E.; Zemajtis, J.; Drumm, R.O. Service Lives of Concrete Sealers; Transportation Research Board: Washington, DC, USA, 1995; Available online: https://trid.trb.org/view/452552 (accessed on 22 August 2020).
  34. Behravan, A.; Ley, M.T.; Rywelski, A.; Berke, N. Changes in the rate of ion penetration of alternative cementitious materials with time. Mater. Des. 2021, 197, 109236. [Google Scholar] [CrossRef]
  35. Scheidegger, A.M.; Vespa, M.; Grolimund, D.; Wieland, E.; Harfouche, M.; Bonhoure, I.; Dähn, R. The use of (micro)-X-ray absorption spectroscopy in cement research. Waste Manag. 2006, 26, 699–705. [Google Scholar] [CrossRef] [PubMed]
  36. Johnson, P.S.; Huang, C.; Kim, M.; Safron, N.S.; Arnold, M.S.; Wong, B.M.; Gopalan, P.; Himpsel, F.J. Orientation of a Monolayer of Dipolar Molecules on Graphene from X-ray Absorption Spectroscopy. Langmuir 2014, 30, 2559–2565. [Google Scholar] [CrossRef] [PubMed]
  37. Bentz, D.P.; Quenard, D.A.; Kunzel, H.M.; Baruchel, J.; Peyrin, F.; Martys, N.S.; Garboczi, E.J. Microstructure and transport properties of porous building materials. II: Three-dimensional X-ray tomographic studies. Mater. Struct. Constr. 2000, 33, 147–153. [Google Scholar] [CrossRef]
  38. Darma, I.S.; Sugiyama, T.; Promentilla, M.A.B. Application of X-ray CT to study diffusivity in cracked concrete through the observation of tracer transport. J. Adv. Concr. Technol. 2013, 11, 266–281. [Google Scholar] [CrossRef] [Green Version]
  39. Roels, S.; Carmeliet, J. Analysis of moisture flow in porous materials using microfocus X-ray radiography. Int. J. Heat Mass Transf. 2006, 49, 4762–4772. [Google Scholar] [CrossRef]
  40. Bentz, D.P.; Hansen, K.K. Preliminary observations of water movement in cement pastes during curing using X-ray absorption. Cem. Concr. Res. 2000, 30, 1157–1168. [Google Scholar] [CrossRef]
  41. Cavé, L.; Al, T.; Xiang, Y.; Vilks, P. A technique for estimating one-dimensional diffusion coefficients in low-permeability sedimentary rock using X-ray radiography: Comparison with through-diffusion measurements. J. Contam. Hydrol. 2009, 103, 1–12. [Google Scholar] [CrossRef]
  42. Tidwell, V.C.; Meigs, L.C.; Christian-Frear, T.; Boney, C.M. Effects of spatially heterogeneous porosity on matrix diffusion as investigated by X-ray absorption imaging. J. Contam. Hydrol. 2000, 42, 285–302. [Google Scholar] [CrossRef] [Green Version]
  43. Chen, S.C.; Huang, R.; Hsu, H.M.; Zou, S.Y.; Teng, L.W. Evaluation of penetration depth and protective effectiveness of concrete-penetrating sealer materials. J. Mar. Sci. Technol. 2016, 24, 244–249. [Google Scholar] [CrossRef]
  44. Teng, L.W.; Lin, W.T.; Chen, J.; Cheng, A.; Hsu, H.M. The Component Analysis of Penetration Sealer Materials. Adv. Mater. Res. 2014, 842, 74–77. [Google Scholar] [CrossRef]
  45. Teng, L.W.; Huang, R.; Hsu, H.M.; Chen, J.; Chao, S.J.; Chen, S.H. The Research of Concrete Sealer Penetrating Depths. Adv. Mater. Res. 2014, 1025–1026, 703–708. [Google Scholar] [CrossRef]
  46. Moradllo, M.K.; Sudbrink, B.; Hu, Q.; Aboustait, M.; Tabb, B.; Ley, M.T.; Davis, J.M. Using micro X-ray fluorescence to image chloride profiles in concrete. Cem. Concr. Res. 2017, 92, 128–141. [Google Scholar] [CrossRef]
  47. Khanzadeh Moradllo, M.; Ley, M.T.; Moradllo, M.K.; Ley, M.T. Quantitative measurement of the influence of degree of saturation on ion penetration in cement paste by using X-ray imaging. Constr. Build. Mater. 2017, 141, 113–129. [Google Scholar] [CrossRef] [Green Version]
  48. Schindelin, J.; Arganda-Carreras, I.; Frise, E.; Kaynig, V.; Longair, M.; Pietzsch, T.; Preibisch, S.; Rueden, C.; Saalfeld, S.; Schmid, B. Fiji: An open-source platform for biological-image analysis. Nat. Methods 2012, 9, 676–682. [Google Scholar] [CrossRef] [PubMed] [Green Version]
Figure 1. (a) Polished spots on a typical sample near the surface to measure the silane penetration depth; (b) a cored sample from a bridge deck after polishing.
Applsci 12 02557 g001
Figure 2. Silane coating profile under a digital microscope with measurements at nine polished spots (1 in = 25.4 mm).
Applsci 12 02557 g002
Figure 3. (a) Extraction of 25 mm diameter cores from each cylinder; (b) application of wax; (c) a real sample after applying a hydrophobic wax around the sample.
Applsci 12 02557 g003
Figure 4. Considered region for data analysis in each radiograph.
Applsci 12 02557 g004
Figure 5. Average depth of silane penetration for all samples.
Applsci 12 02557 g005
Figure 6. Iodide concentration profiles of Samples 3 and 9.
Applsci 12 02557 g006
Figure 7. Comparison of silane vs. non-silane samples at 2 mm depth.
Applsci 12 02557 g007
Figure 8. Examples of two cracked samples (a) concentration profiles in sample 2; (b) concentration profiles in sample 13.
Applsci 12 02557 g008
Figure 9. The 2D observation of a microcrack on an aggregate in one of the silane samples (yellow lines show the cutoff region in the 3D image shown in Figure 10).
Applsci 12 02557 g009
Figure 10. The 3D observation of a microcrack on the aggregate in one of the silane samples.
Applsci 12 02557 g010
Table 1. Settings used in TXM technique.
ParameterTXM Setting
Pixel size (mm)8.8
Voltage (keV)100
Current (mA)100
Filter0.5 mm Al + Cu
Acquisition time8 s
Chamber conditionAir
Table 2. XCT can settings.
ParameterSetting
Resolution (µm/pixel)15.29
Source energy (keV)110
Current (µA)90
Optical magnification0.4×
Number of projections1014
Exposure time (s)2.5
Total scan time4 h
Publisher’s Note: MDPI stays neutral with regard to jurisdictional claims in published maps and institutional affiliations.

