Abstract
There are different missing flight data due to various reasons in the process of acquisition and storage, especially in general aviation, which cause inconvenience for flight data analysis. Effectively explaining the relationship between flight data parameters and selecting a simple and effective method for fitting and correcting flight data suitable for engineering applications are the main points of the paper. Herein, a convenient and applicable approach of missing data correction and fitting based on the least squares polynomial method is introduced in this work. Firstly, the polynomial fitting model based on the least squares method is used to establish multi-order polynomial by existing flight data since the order of the least squares polynomial has a direct impact on the fitting effect. The order is too high or too small, over-fitting or deviation will occur, resulting in improper data. Therefore, the optimization and selection of the model order are significant for flight data correction and fitting. Because the flight data of the aircraft engine exhaust gas temperature (EGT) are often lost because of the immature detection technology, a series of the multi-order polynomial are established by the relationship of aircraft engine exhaust gas temperature and Revolutions Per Minute (RPM). Case study results confirm the optimal model order is four for the fitting and correction of aircraft engine exhaust temperature, and the least squares polynomial method is applicable and effective for EGT flight data correction and fitting based on RPM data.
1. Introduction
Flight data is playing an increasingly important role in data-driven civil aviation safety management, especially in the application of flight operation quality assurance (FOQA) [1], aircraft fault diagnosis [2], runway safety analysis [3], airline safety management [4], flight performance analysis [5], which strongly promotes the construction of smart civil aviation, the big data applications play an increasingly important role [6,7,8,9]. During the flight, the aircraft QAR (quick access recorder) and FDR (flight data recorder) record all the performance and status parameters of various equipment and related components, such as operating parameters, flight real-time communication data, and other data. QAR database system is a comprehensive monitoring system that records and processes the operating state parameters of aircraft, engines, and electronic and electrical equipment. Therefore, flight data provides an applicable and convenient way to obtain flight information and has become the main approach of capturing flight safety information for pilot crew and aircraft health monitor. In the process of collecting and recording flight data, some data are lost at a certain point due to various reasons, which will result in a breakpoint in the data curve. This lost flight number is named the missing data; mechanical failures and random disturbances often result in some missing flight data, which always occur in general aviation. Especially, airplane vibration or shock severely often leads to the data logging sensor failing in general aviation. There are many other unclear reasons leading to the loss of flight data, which will make the analysis of aircraft operating performance and accident diagnosis more difficult. Therefore, it is necessary and meaningful to conclude an effective and practical method for correction and fitting of the missing flight data.
Many scholars have carried out a series of studies on flight data analysis and applied research. Puranik and colleagues [10] had applied machine learning technology and other technologies to flight data analysis in general aviation, applied flight data to identify and isolate abnormal operations, implemented an important driving force for aviation safety based on data-driven. Yildirim and Kurt [11] used neural networks and other methods in engine fault diagnosis and aircraft health management, and excellent results have been achieved. Francisco and colleagues [12] had applied a data mining technique for the generation of an information system’s data model, which helps regulate the flight time and pilot scheduling. Reynolds and colleagues [13] had made the effective management for air traffic control and pilots via flight data analysis. Kumar [14] provided a novel approach for non-linear aerodynamic modeling by GPR-based flight data. Combined with high altitude QAR flight data, the pilot’s maneuvering behavior was analyzed [15]. Lu [16] offered fault-tolerant control (FTC) systems for aircraft safety in case there are malfunctions in the IMU sensors monitoring flight data. Sartor [17] used the Bayesian network for flight landing data analysis. Simon [18] presents an algorithm that automatically identifies and extracts steady-state engine operating points from engine flight data. It calculates the mean and standard deviation of select parameters contained in the incoming flight data stream. Shenghan Zhou [19] make the four landing states divided by three flight parameter variables, including a touchdown, vertical acceleration, and distance to go, and establish pattern recognition based on a BP neural network is used to establish the landing state prediction model and used the genetic algorithm to initialize the model parameter. Revised the Markov chain to improve the model for higher prediction precision establish the landing safety prediction model by integrating pattern recognition and Markov chain with flight data. Massimo and colleagues [20] present new perspectives on the application of Artificial Intelligence (AI) solutions to process Spacecraft (S/C) flight data in order to augment currently used operational S/C health monitoring and diagnostics systems. Yao Li [21] used the Cessna172 flight simulator for flight data extraction to obtain an aerodynamic model, based on the idea of machine learning, a recurrent neural network was used to process multi-dimensional non-linear flight test data, and a real-time recursive learning algorithm was proved to be suitable for dynamic training, and some scholars have conducted combining multiple classifiers for the quantitative rank of abnormalities in-flight data, and applied in-flight data monitoring, flight control behavior analysis [22,23,24]. In terms of flight data analysis and application research, make the outlier detections with uncertain data from flight data for pilot performance and maintenance assessment [25,26].
Many scholars have carried out a series of studies on linear and non-linear flight data fitting and correction, and the provision of various flight data correction and fitting methods shows important value, but he convenient and applicable methods are still worth discussing, especially in the research of correlation and prediction analysis two types of key flight data parameters between the engine exhaust temperature (EGT) and the revolutions per minute (RPM). Effectively explaining the relationship between flight data EGT and RPM also selecting a simple and effective method for fitting and correcting flight data suitable for engineering applications are the main points of the paper. For the fitting and correction of the missing flight data, the common and applicable methods include the extrapolation method of the least squares method, polynomial regression model method, and differential integrated moving average autoregressive method. The extrapolation method of the least square method is the most common method, which applies in engineering fields. Due to its convenience and practicability, the least square method has rich and mature applications in the field of engineering data processing and has a very strong method application universality. For the data of aircraft engine exhaust temperature is often lost or numerical deviation because of the immature detection technology in the general aviation, the polynomial fitting method based on least squares method is used to fit and correct the missing flight data for the relationship of aircraft engine exhaust temperature (EGT) and aircraft engine revolutions per minute (RPM). Conclusively, the algorithm is fitted and corrected with the example of aircraft engine speed data to fit and correct the missing flight data and seek out the most suitable fitting polynomial order through the numerical calculation of the fitting equation of the polynomial and the minimum deviation analysis.
2. Algorithm Principle
According to the given data point, the so-called fitting curve is set by the least square method—the curve changes with the variation trend of the data point. In the process of establishing multi-order polynomial fitting curves, the orders of functions are diverse; different orders of the model polynomial will induce different fitting effects. When the order of fitting for general aviation flight data is too low or too high, different general aviation flight data noise will break into the model. The optimum order of fitting curves for the EGT and RPM needs to be selected. If there is a more precise relationship between variables such as y = a1 × x1 + a2 × x2 + a3 × x3+ a4 × x4 + a5 × x5 +…+ an × xn, the observed value of the variable is equal to the obtained regression value . Figure 1 shows the process of missing flight data fitting and correction.
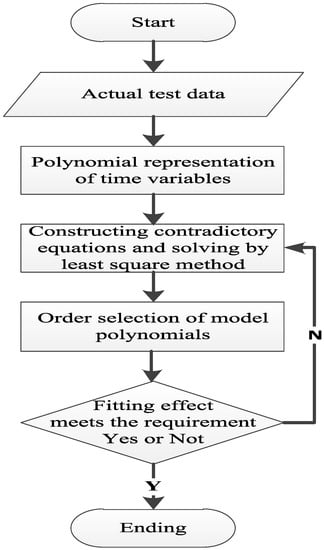
Figure 1.
Process of missing flight data fitting and correction.
3. Polynomial Fitting Model Based on Least Squares Method
Make the actual detected value be , by order polynomial of RPM variable:
It is assumed that there are currently detection data with equal time intervals, which are , and the interval is , assuming that the corresponding time point of the initial measurement point is , then the corresponding time point of the measurement points is , it can be derived from Equation (1).
We can attain:
Let:
Substitute in Equation (4), so we attain:
It can be seen that this is a contradiction equation and solved by the least squares method.
And so that:
From the above equations, it can derive the equations for the points, and the order polynomial roughly derives the data estimate at time :
When , Equation (11) is changed to estimate the fitted data without the detected amount with the current value data. When , it is the first, second, and third more successive estimation point. The data point at the point in time. Since the predicted deviation gradually increases away from the current data segment, the estimated deviation is gradually increased, so usually seeking out the most suitable fitting polynomial order through the numerical calculation of the fitting equation of the polynomial and the minimum deviation analysis.
4. Calculation Model and Order Selection
Different orders of model polynomials will produce different fitting effects, and we also know that the order is too high and over-fitting will occur and bring data noise to the model. Starting from the basis of statistical analysis, if the difference between the quantity and its degree of freedom under the estimation parameter is not large, the order is considered to be moderate, that is, when the dates detected of fitted by the order polynomial is completed, the obtained parameter estimation is put into the following equation to derive the amount of .
For a modest order, its quantity must have the degree of freedom as the expected value. Therefore, starting from , from small to large, the amount of each order is derived. The distance between and is determined. In the process of realistic derivation, using the mean square error test, and the corresponding formula is:
When the mean square error reaches a minimum, the value of is the best order.
5. Case Study
Taking the trainer aircraft CESSNA172R of the Civil Aviation Flight University of China as the research object, the engine of CESSNA172R is produced by the American Textron Lycoming engine manufacturer. The engine model is I0-360-L2A, its health management system is the GARMIN1000 system, and the data is obtained from the sensors on the aircraft. Generated, and the GARMIN1000 system is responsible for collecting and summarizing. The collection of engine data is mainly based on reading, saving, and backup by an on-board download after the flight over. There are 12 parameters related to the engine, and the meaning of each parameter is shown in Table 1. Random captures 20 partial raw flight data engine revolutions per minute (RPM) data and exhaust gas temperature (EGT) of a general aviation aircraft in cruise state shown in Table 2, the engine revolutions per minute (RPM) data as the monitoring data without trend item shows the normal flight training. According to those data, five fitting curves are drawn in Figure 2, Figure 3, Figure 4 and Figure 5. Herein we set Y1, Y2, Y3, Y4 to represent the value of EGT1, EGT2, EGT3, EGT4, respectively, and X represents the value of RPM, for increasing the conciseness of multi-order polynomial, Z was employed here Z = (X − 1.1 × 10³)/20. According to the Polynomial Least Squares Analysis fitting method, the multi-order fitting equation relationship between EGT (Y) and RPM (X) was established, respectively. In order to make the equation expression between Y and X more concise, the parameter Z is introduced here, where Z = (X − 1.1 × 10³)/20; in fact, Z still represents RPM (X).

Table 1.
Flight data engine data structure.
Table 2.
Partial raw flight data RPM and four different EGT.
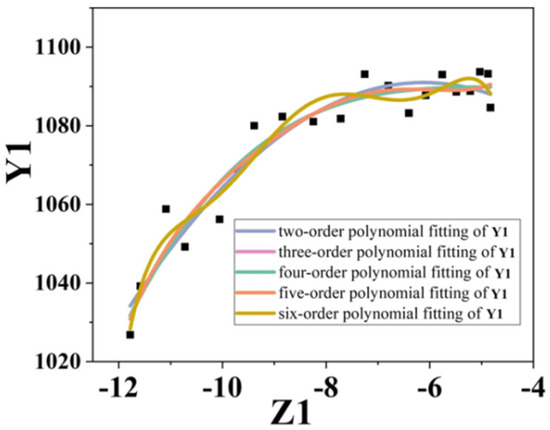
Figure 2.
Five different polynomial fitting curves for RPM(Z) and EGT1(Y1).
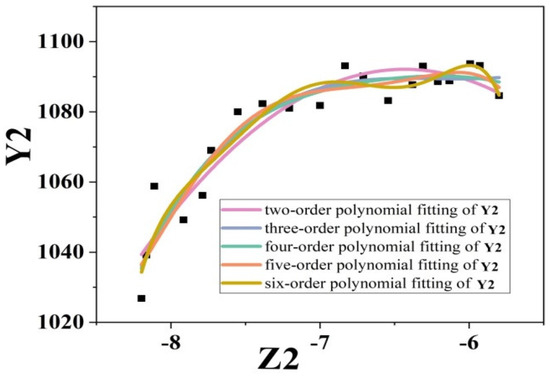
Figure 3.
Five different polynomial fitting curves for RPM (Z) and EGT2 (Y2).
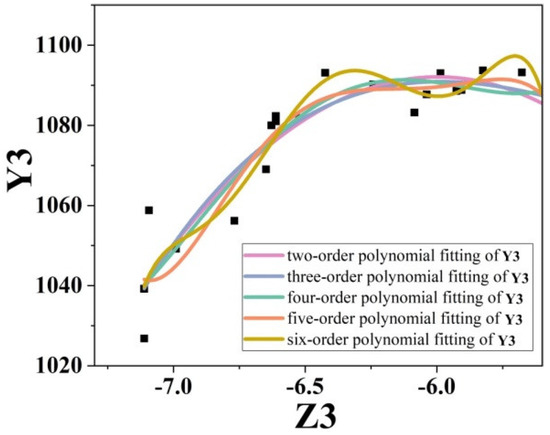
Figure 4.
Five different polynomial fitting curves for RPM(Z) and EGT3(Y3).
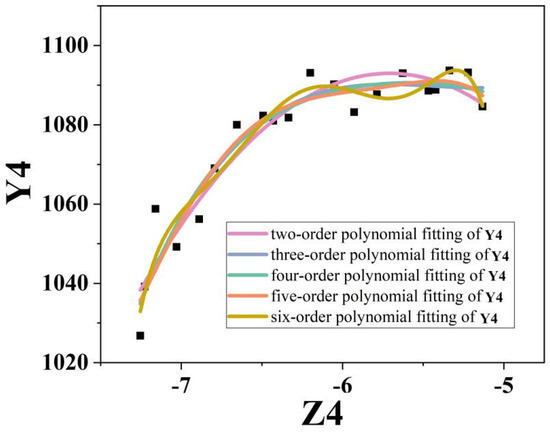
Figure 5.
Five different polynomial fitting curves for RPM (Z) and EGT4(Y4).
We use the squares polynomial fitting method to fit these known numerical scatter plots, and the fitting multi-order polynomial results are listed following:
Y1 = 13 × Z2 + 58 × Z + 9.3 × 10²
Y1 = 1.1 × Z3 +15 × Z2 + 57 × Z + 9.3 × 10²
Y1 = -5.8 × Z4 − 15 × Z3 + 17 × Z2 + 95 × Z + 9.1 × 10²
Y1 = −15 × Z5−61 × Z4 − 40 × Z3 + 77 × Z2 +95Z + 9.1 × 10²
Y1 = −5.3 × Z6 − 37 × Z5 − 75 × Z4 − 15 × Z3 + 94 × Z2 + 87 × Z +9.1 × 10²
Y1 = 1.1 × Z3 +15 × Z2 + 57 × Z + 9.3 × 10²
Y1 = -5.8 × Z4 − 15 × Z3 + 17 × Z2 + 95 × Z + 9.1 × 10²
Y1 = −15 × Z5−61 × Z4 − 40 × Z3 + 77 × Z2 +95Z + 9.1 × 10²
Y1 = −5.3 × Z6 − 37 × Z5 − 75 × Z4 − 15 × Z3 + 94 × Z2 + 87 × Z +9.1 × 10²
To verify those multi-order polynomial results and find the optimum order, we select a real value (1069, 906.1), where Z = −3.66. According to the error results from Table 3, we can find four-order polynomial is the best.
Table 3.
The error of different multi-order polynomial for EGT1.
We use the squares polynomial fitting method to fit these known numerical scatter plots, and the fitting multi-order polynomial results are listed following:
Y2 = 5.2 × Z2 + 20 × Z + 9.6 × 10²
Y2 = 0.53 × Z3 + 6.3 × Z2 + 20 × Z + 9.5 × 10²
Y2 = −2.5 × Z4 − 6.2 × Z3 + 7.1 × Z2 + 26 × Z + 9.5 × 10²
Y2 = −5.3 × Z5 − 22 × Z4 − 15 × Z3 + 29 × Z2 + 34 × Z + 9.5 × 10²
Y2 = −1.2 × Z6 − 10 × Z5 − 25 × Z4 − 9.8 × Z3 + 32 × Z2 + 32 × Z + 9.5 × 10²
Y2 = 0.53 × Z3 + 6.3 × Z2 + 20 × Z + 9.5 × 10²
Y2 = −2.5 × Z4 − 6.2 × Z3 + 7.1 × Z2 + 26 × Z + 9.5 × 10²
Y2 = −5.3 × Z5 − 22 × Z4 − 15 × Z3 + 29 × Z2 + 34 × Z + 9.5 × 10²
Y2 = −1.2 × Z6 − 10 × Z5 − 25 × Z4 − 9.8 × Z3 + 32 × Z2 + 32 × Z + 9.5 × 10²
To verify those multi-order polynomial results and find the optimum order, we select a real value (1058.8, 937.76), where Z = −2.06. According to the error results from Table 4, we can find four-order polynomial is the best.
Table 4.
The error of different multi-order polynomial for EGT2.
We use the squares polynomial fitting method to fit these known numerical scatter plots, and the fitting multi-order polynomial results are listed following:
Y3 = 2.6 × Z2 + 11 × Z + 9.7 × 10²
Y3 = 0.074 × Z3 + 2.8 × Z2 + 11 × Z + 9.7 × 10²
Y3 = −0.9 × Z4 − 2.4 × Z3 + 3.1 × Z2 + 13 × Z + 9.7 × 10²
Y3 = −2.7 × Z5 − 11 × Z4 − 7 × Z3 + 14 × Z2 + 18 × Z + 9.7 × 10²
Y3 = −1.7 × Z6 − 9.7 × Z5 − 15 × Z4 + 1.1 × Z3 + 19 × Z2 + 15 × Z + 9.7 × 10²
Y3 = 0.074 × Z3 + 2.8 × Z2 + 11 × Z + 9.7 × 10²
Y3 = −0.9 × Z4 − 2.4 × Z3 + 3.1 × Z2 + 13 × Z + 9.7 × 10²
Y3 = −2.7 × Z5 − 11 × Z4 − 7 × Z3 + 14 × Z2 + 18 × Z + 9.7 × 10²
Y3 = −1.7 × Z6 − 9.7 × Z5 − 15 × Z4 + 1.1 × Z3 + 19 × Z2 + 15 × Z + 9.7 × 10²
To verify those multi-order polynomial results and find the optimum order, we select a real value (1058.8, 958.14), where Z = −2.06. According to the error results from Table 5, we can find a four-order polynomial that meets the forecast requirements well.
Table 5.
The error of different multi-order polynomial for EGT3.
We use the squares polynomial fitting method to fit these known numerical scatter plots, and the fitting multi-order polynomial results are listed following:
Y4 = 2.6 × Z2 + 11 × Z +9.7 × 10²
Y4 = 0.074 × Z3 + 2.8 × Z2 + 11 × Z + 9.7 × 10²
Y4 = −0.9 × Z4 − 2.4 × Z3 + 3.1 × Z2 + 13 × Z + 9.7 × 10²
Y4 = −2.7 × Z5 − 11 × Z4 − 7 × Z3 + 14 × Z2 + 18 × Z + 9.7 × 10²
Y4 = −1.7 × Z6 − 9.7 × Z5 − 15 × Z4 +1.1 × Z3 +19 × Z2 + 15 × Z + 9.7 × 10²
Y4 = 0.074 × Z3 + 2.8 × Z2 + 11 × Z + 9.7 × 10²
Y4 = −0.9 × Z4 − 2.4 × Z3 + 3.1 × Z2 + 13 × Z + 9.7 × 10²
Y4 = −2.7 × Z5 − 11 × Z4 − 7 × Z3 + 14 × Z2 + 18 × Z + 9.7 × 10²
Y4 = −1.7 × Z6 − 9.7 × Z5 − 15 × Z4 +1.1 × Z3 +19 × Z2 + 15 × Z + 9.7 × 10²
To verify those multi-order polynomial results and find the optimum order, we select a real value (1058.8, 956.81), where Z = −2.06. According to the error results from Table 6, we can find four-order polynomial is the best.
Table 6.
The error of different multi-order polynomial for EGT4.
6. Discussion
When comparing the error of different multi-order polynomial, it can be clearly seen that the missing data has been fitted closely. It shows that the least squares polynomial fitting method is simple and applicable, which can make up for the lack of data of the flying reference data and improve the accuracy and reliability of the data.
The least squares method can be used to easily obtain unknown data, and the sum of the squares of the errors between the obtained data and the actual data is minimized. It can also be used for curve fitting, and the least squares method is simple and effective. The RPM and EGT are used as examples to verify the feasibility of the least squares polynomial fitting model. With the confirmation of the relationship between RPM and EGT, the four-order polynomial is more suitable.
7. Conclusions
To prevent the affecting of missing flight data on flight information analysis, the polynomial fitting model based on the least squares method was employed to fit and correct the missing flight data. For the flight data of aircraft engine exhaust gas temperature (EGT) is often lost because of the immature detection technology, a series of multi-order polynomials are established by the relationship of aircraft engine exhaust gas temperature (EGT) and revolutions per minute (RPM). By comparing the error of every polynomial, the four-order polynomial has more obvious advantages for correction and fitting of flight Data EGT based on RPM, and it is verified that the polynomial least squares analysis method in correction and fitting civil aviation flight data EGT based on RPM is simpler and more effective than the previous method, has universal practicability, and has engineering application value in-flight data fitting and correction. Subsequent research will be applied to aircraft operation reliability assessment and pilot flight quality monitoring on the basis of filling and fitting data.
Author Contributions
Conceptualization, N.C. and Y.-C.S.; data curation, N.C. and Z.W.; methodology, N.C. and C.P.; formal analysis, N.C. and C.P.; writing—original draft preparation, N.C. All authors have read and agreed to the published version of the manuscript.
Funding
This research was funded by the National Natural Science Foundation of China, grant number U2033202; Key R&D Program of Sichuan Provincial Department of Science and Technology (22ZDYF2942); Safety Capability Fund Project of Civil Aviation Administration of China (2022J026).
Institutional Review Board Statement
Not applicable.
Informed Consent Statement
Not applicable.
Data Availability Statement
The data used to support the findings of this study are included within the article.
Acknowledgments
Not applicable.
Conflicts of Interest
The authors declare no conflict of interest.
References
- Wang, L.; Zhang, J.; Dong, C.; Sun, H.; Ren, Y. A method of applying flight data to evaluate landing operation performance. Ergonomics 2017, 62, 171–180. [Google Scholar] [CrossRef]
- Cui, H.J.; Guan, Y.; Chen, H.Y. Rolling element fault diagnosis based on VMD and sensitivity MCKD. IEEE Access 2021, 9, 120297–120308. [Google Scholar] [CrossRef]
- Barry, D.J. Estimating runway veer-off risk using a Bayesian network with flight data. Transp. Res. Part C Emerg. Technol. 2021, 128, 103180. [Google Scholar] [CrossRef]
- Oehling, J.; Barry, D. Using machine learning methods in airline flight data monitoring to generate new operational safety knowledge from existing data. Saf. Sci. 2019, 114, 89–104. [Google Scholar] [CrossRef]
- Aksoy, H.; Turgut, E.T.; Usanmaz, Ö. The design and analysis of optimal descent profiles using real flight data. Transp. Res. Part D Transp. Environ. 2021, 100, 103028. [Google Scholar] [CrossRef]
- Ran, X.J.; Zhou, X.B.; Lei, M.; Worawit, T.; Deng, W. A novel K-Means clustering algorithm with a noise algorithm for capturing urban hotspots. Appl. Sci. 2021, 11, 11202. [Google Scholar] [CrossRef]
- Cui, H.J.; Guan, Y.; Chen, H.Y.; Deng, W. A novel advancing signal processing method based on coupled multi-stable stochastic resonance for fault detection. Appl. Sci. 2021, 11, 5385. [Google Scholar] [CrossRef]
- Zhang, X.; Wang, H.; Du, C.; Fan, X.; Cui, L.; Chen, H.; Deng, F.; Tong, Q.; He, M.; Yang, M.; et al. Custom-molded offloading footwear effectively prevents recurrence and amputation, and lowers mortality rates in high-risk diabetic foot patients: A multicenter, prospective observational study. Diabetes Metab. Syndr. Obes. 2022, 15, 103–109. [Google Scholar] [CrossRef]
- Deng, W.; Zhang, X.; Zhou, Y.; Liu, Y.; Zhou, X.; Chen, H.; Zhao, H. An enhanced fast non-dominated solution sorting genetic algorithm for multi-objective problems. Inform. Sci. 2022, 585, 441–453. [Google Scholar] [CrossRef]
- Puranik, T.; Mavris, D.N. Identification of instantaneous anomalies in general aviation operations using energy metrics. J. Aerosp. Inf. Syst. 2020, 17, 51–65. [Google Scholar] [CrossRef]
- Yildirim, M.T.; Kurt, B. Aircraft gas turbine engine health monitoring system by real flight data. Int. J. Aerosp. Eng. 2018, 2018, 9570873. [Google Scholar] [CrossRef] [Green Version]
- Yildirim, M.T.; Kurt, B. Confidence interval prediction of ANN estimated LPT parameters. Aircr. Eng. Aerosp. Technol. 2019, 92, 101–106. [Google Scholar] [CrossRef]
- Martín, F.J.V.; Sequera, J.L.C.; Huerga, M.A.N. Using data mining techniques to discover patterns in an airline’s flight hours assignments. Int. J. Data Warehous. Min. 2017, 13, 45–62. [Google Scholar] [CrossRef]
- Reynolds, H.J.D.; Lokhande, K.; Kuffner, M.; Yenson, S. Human–systems integration design process of the air traffic control tower flight data manager. J. Cogn. Eng. Decis. Mak. 2013, 17, 273–292. [Google Scholar] [CrossRef]
- Kumar, A.; Ghosh, K. GPR-based novel approach for non-linear aerodynamic modelling from flight data. Aeronaut. J. 2018, 8, 1–14. [Google Scholar] [CrossRef]
- Lan, C.E.; Wu, K.; Yu, J. Flight characteristics analysis based on QAR data of a jet transport during landing at a high-altitude airport. Chin. J. Aeronaut. 2012, 25, 13–24. [Google Scholar] [CrossRef] [Green Version]
- Lu, P.; Eykeren, L.V.; Kampen, V.E.; Devisser, C.C.; Chu, P. Aircraft inertial measurement unit fault identification with ap-plication to real flight data. J. Guid. Control Dyn. 2015, 38, 2467–2473. [Google Scholar] [CrossRef]
- Sartor, P.; Becker, W.; Worden, K.; Schmidt, R.K.; Bond, D. Bayesian sensitivity analysis of flight parameters in a hard-landing analysis process. J. Aircr. 2016, 53, 1317–1331. [Google Scholar] [CrossRef] [Green Version]
- Simon, D.L.; Litt, J.S. A data filter for identifying steady-state operating points in engine flight data for condition monitoring applications. J. Eng. Gas Turbines Power 2011, 133, 191–200. [Google Scholar] [CrossRef]
- Zhou, S.; Zhou, Y.; Xu, Z.; Chang, W.; Cheng, Y. The landing safety prediction model by integrating pattern recognition and Markov chain with flight data. Neural Comput. Appl. 2019, 31, 147–159. [Google Scholar] [CrossRef]
- Tipaldi, M.; Feruglio, L.; Denis, P.; D’Angelo, G. On applying AI-driven flight data analysis for operational spacecraft model-based diagnostics. Annu. Rev. Control 2020, 49, 197–211. [Google Scholar] [CrossRef]
- Li, Y.; Si, H.; Zong, Y.; Wu, X.; Zhang, P.; Jia, H.; Xu, S.; Tang, D. Application of neural network based on real-time recursive learning and Kalman filter in flight data identification. Int. J. Aeronaut. Space Sci. 2021, 22, 1383–1396. [Google Scholar] [CrossRef]
- Smart, E.; Brown, D.; Denman, J. Combining multiple classifiers to quantitatively rank the impact of abnormalities in flight data. Appl. Soft Comput. 2012, 12, 2583–2592. [Google Scholar] [CrossRef] [Green Version]
- Walker, G. Redefining the incidents to learn from: Safety science insights acquired on the journey from black boxes to flight data monitoring. Saf. Sci. 2017, 99, 14–22. [Google Scholar] [CrossRef]
- Wang, L.; Ren, Y.; Wu, C. Effects of flare operation on landing safety: A study based on ANOVA of real flight data. Saf. Sci. 2018, 102, 14–25. [Google Scholar] [CrossRef]
- Peck, M.W.; Scheraga, C.A.; Boisjoly, R.P. Assessing the relative efficiency of aircraft maintenance technologies: An application of data envelopment analysis. Transp. Res. Part A Policy Pract. 1998, 32, 261–269. [Google Scholar] [CrossRef]
Publisher’s Note: MDPI stays neutral with regard to jurisdictional claims in published maps and institutional affiliations. |
© 2022 by the authors. Licensee MDPI, Basel, Switzerland. This article is an open access article distributed under the terms and conditions of the Creative Commons Attribution (CC BY) license (https://creativecommons.org/licenses/by/4.0/).