Abstract
Geogrid-reinforced piled embankments (GRPEs) provide an economical and effective way to construct highways and railways on soft soil foundations. This paper proposed a new design method for GRPEs. The method was based on the soil arching and tensioned-membrane effects, the bearing capacity of the subsoil was considered as well. The originality of the proposed method lies in considering the stress history of the subsoil, and different over-consolidation ratios (OCRs) were used in calculating the settlement of subsoil. This design method, initially, established the vertical equilibrium of the unit body between the pile caps immediately above the subsoil. After that, the design charts were produced by solving the overall equilibrium equation from which engineers can intuitively obtain the maximum strain of reinforcement, and the tensile force can be used in the ultimate limit state analyses. The design method was then validated by three case studies, which showed good reliability with the maximum error being less than 18%. Parameter study results indicated that the maximum strain of reinforcement for the under-consolidated soil was 80–120% larger than that for normally consolidated soil and more than four times greater than that for over-consolidated soil.
1. Introduction
Geogrid-reinforced piled embankments (GRPEs) have been widely used in highway and railway projects built on soft soil foundations. The soil arching and tension membrane effects play an important role in the load transfer mechanism of GRPEs. A large number of experimental and numerical studies on this topic have been conducted by many researchers [1,2,3,4,5,6,7,8].
The bearing capacity of the subsoil should not be neglected in design, and it provides certain support to the upper embankment, although it usually has high compressibility, low shear strength, and a long consolidation time. Filz and Smith’s [9] method considered the influence of subsoil when calculating the deflection of geosynthetics under linear elastic conditions and demonstrated that the subsoil contributes to the support of the embankment’s residual load. Zhuang et al. [10] presented that subsoil has a major contribution to the overall vertical equilibrium of GRPEs. Zhuang and Ellis [7] demonstrated the nonnegligible bearing capacity of subsoil in long-term conditions, and the support of subsoil reduced the reinforcement tension. Therefore, a design that does not take into account the bearing capacity of the subsoil may become overly conservative. In addition, engineering practices have shown that soils with different stress histories have diverse strains under the same stress. Grammatikopoulou et al. [11] and Zhang et al. [12] noted that the stress history affects the soil stiffness, which in turn causes differences in soil settlement. Different stress histories would cause various consolidation coefficients of the subsoil [13], which determines the consolidation rate of the soil. Therefore, the stress history is an important factor in calculating the settlement of subsoil.
Many researchers have developed design methods to analyze the performance of GRPEs. However, the current design methods mainly target either one or some aspects of the load-transfer mechanism, and there is an absence of clear and comprehensive guidelines available for the design of GRPEs. British standard BS8006 [14,15] provides engineers with a relatively recognized design method for GRPEs, but the support of the subsoil was not considered. Van Eekelen et al. [16] and Zhuang and Ellis [5] analyzed and modified the BS8006 [14] in terms of the calculation method of the tensile force and the reinforcement sag for the 3D situation, respectively. The bearing capacity of the subsoil was, however, not taken into account in both approaches.
Russell et al. [17] proposed a design method for GRPEs and considered the bearing capacity of the subsoil. The method was used to estimate the magnitude of arching taking place in the embankment fill material and to calculate the tension in the reinforcement. Zhuang et al. [10] built a simplified model to simulate the GRPE. The model was then used to assess the contributions of the reinforcement and the subsoil. Zhuang and Wang [18] developed an analytical solution for GRPEs where the load-transfer mechanisms accounting for soil arching, tensioned-membrane effects of the reinforcement, and the role of the subsoil were investigated. Pham and Dias [19] presented a simplified model for the analysis of GRPEs considering subsoil consolidation. However, all the methods mentioned above ignore the effect of stress history on subsoil settlement. This was also the case in some other related studies (e.g., Deb and Mohapatra [20]; EBGEO [21]; Lu and Miao [22]; Van Eekelen et al. [23]; Zhang et al. [24]; Zhang et al. [25]; Pham [26]).
In addition, previous design methods were usually expressed in the form of complicated equations, to be solved by software or difficult mathematical operations, which entailed higher requirements for engineers and proved inconvenient for promoting the application. EBGEO [21] solved this problem by expressing the design methods through diagrams, based on the soil arching model proposed by Kempfert et al. [27,28] and Zaeske [29,30]. However, this method ignored the effect of reinforcement when determining the stress distribution in the embankment. The settlement of the subsoil also did not consider the influence of stress history.
In this paper, a new design method for GRPEs was developed under the framework of Hewlett and Randolph’s [2] soil arching model and the BS8006 [14] reinforcement method modified by Zhuang and Ellis [5,7]. Additionally, the design method incorporated the settlements of subsoil considering different stress histories. The vertical equilibrium of the unit body between the pile caps immediately above the subsoil was established, then the design charts were plotted with contour lines by solving the overall equilibrium equation. Engineers can obtain the maximum strain of reinforcement through the charts to perform the ultimate limit state analyses and verify whether the tensile strength of reinforcement meets the requirements of serviceability. These charts were easy to use and provided a guideline for engineering design.
2. Design Method Development
To develop the design method, the following assumptions were made:
- (a)
- The embankment fill is homogeneous, isotropic, and cohesionless.
- (b)
- The subsoil is made up of homogeneous, isotropic, and elastoplastic materials, while the pile is elastic.
- (c)
- The reinforcement is homogeneous and transversely isotropic.
- (d)
- The sag of the reinforcement is equal to the settlement of the subsoil.
- (e)
- The pile is an end-bearing pile. There is no friction between a pile and the surrounding subsoil.
- (f)
- The embankment fill, subsoil, and piles deform only vertically.
- (g)
- The settlement of the bearing stratum is 0 m, and piles are sufficiently rigid and undergo insignificant deformation.
2.1. Soil Arching
Hewlett and Randolph [2] conducted 3D model tests and presented a semicircular model (in 2D) or a hemispherical dome model (in 3D) to describe the arching as having a uniform thickness and no overlap. Here, the method assumed that the pressure acting on the subsoil was uniform. By analyzing the vertical equilibrium of the elements at the ‘crown’ of the soil arch (Figure 1), the equation was expressed as follows:
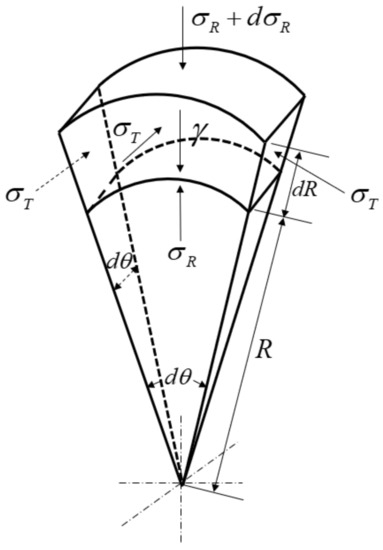
Figure 1.
Detail of an element of the soil arch at the crown of the dome.
In the limit, the ratio of tangential stress, , to the radial stress, , is
where is the unit weight of the embankment fill, is the Rankine passive coefficient of earth pressure, and is the friction angle of the embankment. Substituting Equation (2) into Equation (1) and replacing by ,
The surcharge at the surface of the embankment, q, is considered. The inner radius is and the outer radius is , which, respectively, corresponds to the stress and . Solving the differential equation (Equation (3)), subject to these boundary conditions, yields the following:
where is the stress acting on the inner surface of the dome at its crown, is the height of embankment, is the center-to-center pile spacing, and is the pile cap width. The acting point of corresponds to a height of above the base of the embankment. Thus, the total normal stress acting on the subsoil is as follows:
Under a soil arching condition, the total normal stress acting on the subsoil is given by Equation (5). Substituting Equation (5) into Equation (4) gives the following:
2.2. Effect of the Reinforcement
The reinforcement bridges the subsoil between the piles by membrane action (see Figure 2, where is the tensile force of reinforcement, and is the sag of the reinforcement, nothing that , is the settlement calculation of subsoil). The reinforcement is loaded by the surcharge of the embankment filled above it. The load carried by the reinforcement may be reduced by the soil arching developed in the embankment fills and decrease once the support of the subsoil prevails. There exists a relationship between the reinforcement sag and the reaction pressure induced by the subsoil. The subsoil reaction pressure roughly increases when the reinforcement sag rises, which degrades the effect of the reinforcement.
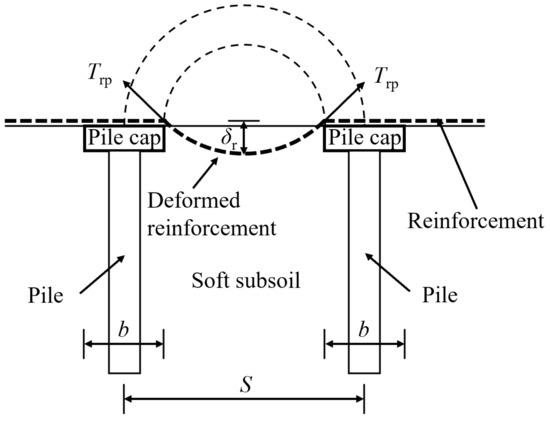
Figure 2.
Membrane action of reinforcement.
According to the Hewlett and Randolph approach in the 2010 and 2012 versions of BS8006 [14,15], the distributed load, , carried by the reinforcement between adjacent pile caps can be written as follows:
and
where is the nominal vertical stress acting on the reinforcement. Zhuang and Ellis [5] gave an expression of the tensile load in the reinforcement, , based on BS8006 [15], as follows:
where is the long-term secant stiffness of the reinforcement, noting that , in which represents the strain mobilized in the reinforcement. Zhuang and Ellis [5] pointed out that the equation of maximum sag in the reinforcement spanning between pile caps in BS8006 was assumed to be rather than the diagonal, which is times longer, and therefore, they revised the equation, which is shown as Equation (10).
After substituting Equation (9) into Equation (10), Equation (11) was obtained with rearrangement.
Zhuang and Ellis [5] concluded that in BS8006 [14] produced a better prediction than in BS8006 [15], and in the former version was adopted in this study, which eventually meant that could be expressed by Equation (12) as shown below.
2.3. Subsoil Settlements
The settlement of the subsoil increases the sag of the reinforcement in GRPEs. The soil arching of the embankment is possibly affected by the settlement of the subsoil, and thus, it may not be advantageous to ignore the subsoil settlement when the response of a GRPE is investigated. In practical engineering, the history of the stress ever experienced by the soil has a great influence on its settlement. Considering the stress history makes the settlement results of the subsoil more accurate.
The long-term stress history of the soil is usually characterized by the pre-consolidation pressure of the soil, which denotes the maximum consolidation pressure that the soil mass has been subjected to. The pre-consolidation pressure in soils is usually determined through the odometer test, during which a semilogarithmic one-dimensional consolidation curve (i.e., e–lgp in Figure 3) is acquired. Thereafter, the Casagrande [31] empirical graphing method is adopted to obtain the pre-consolidation pressure (see Figure 3).
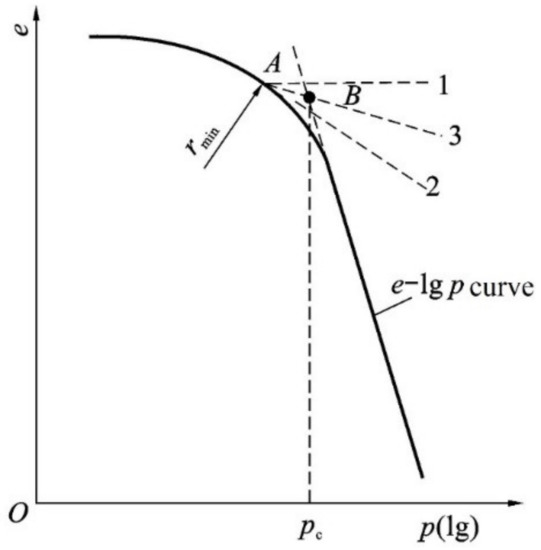
Figure 3.
Casagrande empirical graphing method.
The current overburden pressure imposed on natural soils may be greater than, equal to, or less than the pre-consolidation pressure, corresponding to the varied over-consolidation ratios, noting that OCR < 1, OCR = 1, and OCR > 1. The settlement calculation of the subsoil varies when varied stress histories are involved.
- (a)
- If OCR = 1, then
- (b)
- If OCR < 1,
- (c)
- If OCR > 1,when ,when ,
In Equations (13)–(16), is the vertical stress carried by the subsoil; is the height of the subsoil; is the unit weight of the subsoil; is the initial void ratio; is the compression index; is the recompression index; is the pre-consolidation pressure; and is the vertical additional stress coefficient under uniform rectangular load.
2.4. Overall Equilibrium
The innovation of this design method is to consider the settlement of the subsoil under different stress histories. In order to obtain the settlement of the subsoil, the vertical stress carried by the subsoil must be determined. In the GRPE, it can be calculated by combining the expressions of the soil arching and tension membrane effects.
Zhuang and Ellis [5] estimated the reinforcement tension in a piled embankment using the amended versions of British standard BS8006 [14,15]. However, the BS8006 [14,15] excluded the contribution from the subsoil beneath the embankment. Zhuang and Ellis [7] modified it by incorporating both the bearing capacity of the subsoil and the tensile reinforcement. Based on their studies and taking into account the unit body between the pile caps immediately above the subsoil (see Figure 4), we can express the vertical equilibrium equitation as shown in Equation (17):
where is the vertical stress acting on the base of the arching embankment, is the vertical stress carried by the reinforcement, and is the vertical stress carried by the subsoil.
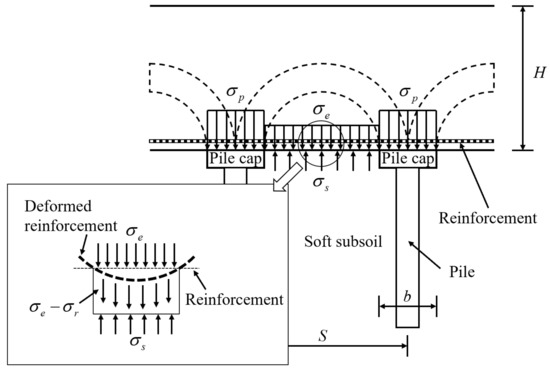
Figure 4.
Stress analysis of the GRPE.
Here, it is assumed that the sag of the reinforcement is equal to the settlement of the subsoil. With the surface settlement of the subsoil quantified by Equations (13)–(16), the vertical stress shared by the reinforcement was updated when substituting Equations (13)–(16) into Equation (12). After that, Equation (6) and the updated were substituted into Equation (17), and an equation for was then obtained (i.e., Equations (18)–(21)).
For normally consolidated soil, the equation of is given by
similarly, for the under-consolidated soil,
and for the over-consolidated soil,
or
2.5. Design Charts for the Analysis of Maximum Strain in Reinforcement
The maximum strain in the reinforcement can been given by design charts, which have the advantage of being more intuitive and easier to use.
The vertical stress carried by the subsoil, , can be acquired through iteration with the implicit solutions listed in Equations (18)–(21). The surface settlement of the subsoil, , was then calculated by substituting into Equations (13)–(16). The strain of the reinforcement, , was thereafter obtained with Equation (10).
The normally consolidated soil is presented here as an example, under which condition, is given by
The design charts are shown in Figure 5, plotting the maximum strain in the reinforcement (i.e., ) in ordinate versus a dimensionless term correlated to the vertical stress carried by the subsoil, shown in Equation (24), in abscissa.
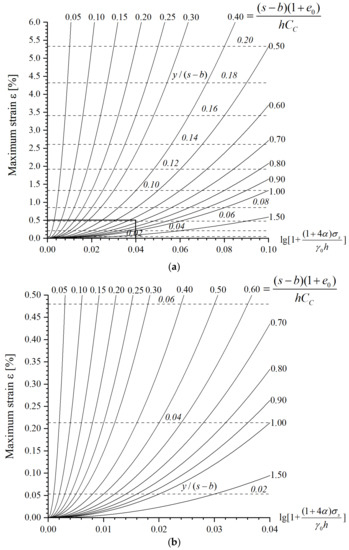
Figure 5.
Design charts for a GRPE with a normally consolidated subsoil; (a) Full-scale chart; (b) Enlarged chart.
In the design charts, the horizontal dotted line represents the settlement of the subsoil but normalized by the term ‘s–b’, which is, therefore, dimensionless. The contours show another dimensionless fraction somehow representing the coupling effects of the embankment geometry and the subsoil properties. It is an inverse of the square root of the first multiplier in Equation (23) as shown in Equation (25).
The maximum strain of the reinforcement can be obtained by substituting the values of Equations (24) and (25) into the charts. Similarly, Figure 6, Figure 7 and Figure 8 show the maximum strain curves of reinforcement for under-consolidated soil and over-consolidated soil. Among them, the over-consolidated soil was divided into two cases to discuss according to Equations (15) and (16). These charts are intended to provide a guideline for the design of practical engineering; engineers no longer need to do complex mathematical calculations.
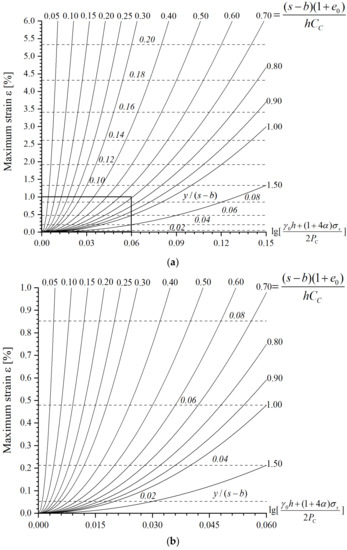
Figure 6.
Design charts for a GRPE with under-consolidated soil; (a) Full-scale chart; (b) Enlarged chart.
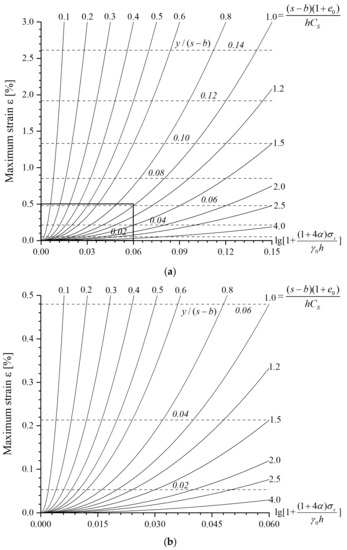
Figure 7.
Design charts for a GRPE with over-consolidated soil (); (a) Full-scale chart; (b) Enlarged chart.
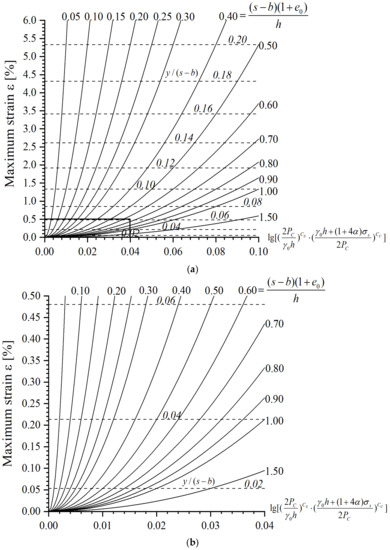
Figure 8.
Design charts for a GRPE with over-consolidated soil (); (a) Full-scale chart; (b) Enlarged chart.
2.6. Ultimate Limit State Analyses
Recommendations for the design of GRPE systems are given above; the design method not only gives the maximum strain but also can be used to perform the ultimate limit state analyses of reinforcement in GRPEs. The following two methods exemplify how the design charts can be used.
- (a)
- BS8006-recommended method
The maximum strain of the reinforcement was obtained from the charts. With the axial stiffness of the reinforcement, the maximum tensile force () in the reinforcement can then be obtained.
The maximum tensile force of the reinforcement should remain less than its allowable resistances:
where is the load partial factor, and represents the design value of the resistance of the reinforcement.
BS8006 [15] gives the formula to calculate the tensile load, , per meter run in the reinforcement induced by the distributed load, WT, as shown in Equation (28).
When substituting into Equation (28), replacing by , the distributed load, WT, acting across the reinforcement is then obtained. The minimum distributed load may be assumed to depend on the area coverage ratio of the pile caps relative to the pile spacing (b2/s2) and the relative height of the embankment, i.e., H/(s − b), which is the embankment height (H) normalized by the clear span between the piles (s − b). Irrespective of the arching theory, pile layout, and embankment geometry, the geosynthetic reinforcement needs to carry, at least, a practical minimum proportion (15%) of the embankment loading.
where the is the partial factor for soil unit weight, and is the partial load factor for an external surcharge.
- (b)
- EBGEO-recommended method
Linearizing the short-term load-extension curve for the reinforcement at = 2.5%, and simplifying the short-term stiffness of reinforcement to long-term,
where and are the long-term and short-term stiffness of the reinforcement, respectively. is the utilization factor of the reinforcement corresponding to = 2.5% in the short-term load-extension curve.
The tensile force in the reinforcement as a result of membrane action is given by Equation (31).
The reinforcement in the ultimate limit state was then analyzed. The tensile force in the reinforcement should remain less than its design resistance:
where is load partial factor, is the design value of additional effects in the reinforcement as a result of spreading force, and represents the design value of the resistance of reinforcement.
The adequate tensile strength of geosynthetic reinforcement is, thus, demonstrated. If adequate tensile strength cannot meet the requirement, and then the analysis must be repeated by altering embankment parameters or reinforcement type until the adequate tensile strength meets the requirements of serviceability.
3. Case Study
Three cases studies of piled embankments were used to verify the accuracy and reliability of the design method proposed in this paper in terms of the maximum strain of the reinforcement. The results were compared with EBGEO’s [21] and BS8006′s [15] methods.
3.1. Case 1
The construction of an embankment for the Ningbo Ring Road Expressway [32] was taken as case study no. 1. The construction site was located in a northern suburb of Ningbo, China. The index properties of the subsoil are shown in Table 1. The embankment was at a height of 4.6 m. The average unit weight of embankment fill was 19 kN/m3. The effective cohesion and friction angle of the fill was 11 kPa and 30°. The piles were placed in a square grid with a center-to-center spacing of 2.4 m. The pile caps had a width of 1.0 m. The tensile strength of the reinforcement was 90 kN/m in both the longitudinal and the transverse directions. The maximum allowable tensile strain of the reinforcement was 8%. Figure 9 shows the construction height of the embankment and the settlement of the subsoil.

Table 1.
Index properties of the subsoil.
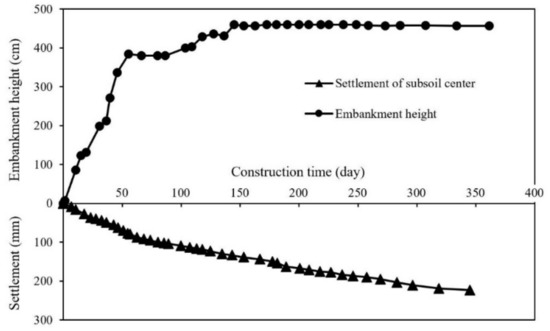
Figure 9.
Embankment versus time curve and settlement versus time curve.
3.2. Case 2
To explore the complex time-dependent interaction between the arching stresses and base of reinforcement settlement, the coupled load–deformation response of the subsoil was investigated using an analytical method by King et al. [33]. The information pertaining to the GRPE in their study is detailed in Figure 10, where γ is the average unit weight, φ is the friction angle of the embankment fill, and Cc is the compression index of the subsoil.
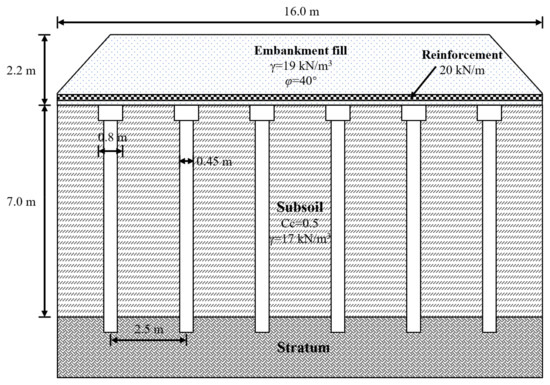
Figure 10.
Schematic diagram of piled embankment profile.
3.3. Case 3
The SJZA Expressway [34] connecting through Jiangsu, Zhejiang, Anhui, and Shanghai, with a total length of 89 km was used as case study no. 3. Briefly, K25 + 100 (denoted as D1 section) and K25 + 135 (denoted as D2 section) were selected for the field test. The index properties of the soil layers in the tests are shown in Table 2. The width of the embankment was 35.0 m, the embankment height was 4.0 m, and the slope was 1:1.5. The embankment filling was mainly composed of crushed stone mixed with sub-clay. The internal friction angle was 35°, and the average unit weight was 22 kN/m3. All piles were arranged in a triangle, the pile diameter was 0.3 m for the D1 section and 0.4 m for the D2 section surface. The pile center-to-center spacing was 2.0 m for the D1 section surface and 2.5 m for the D2 section surface. The pile lengths were 14.0 m each. The pile caps were square with a side length of 0.9 m for section D1 and 1.0 m for section D2. Figure 11 illustrates the pile layout of the test section. A layer of high-strength steel-plastic geogrid was laid on the top surface of the pile support plate, with a maximum elongation of 6% and a tensile strength of 120 kN/m.
Table 2.
Physical and mechanical indexes of the soil layer.
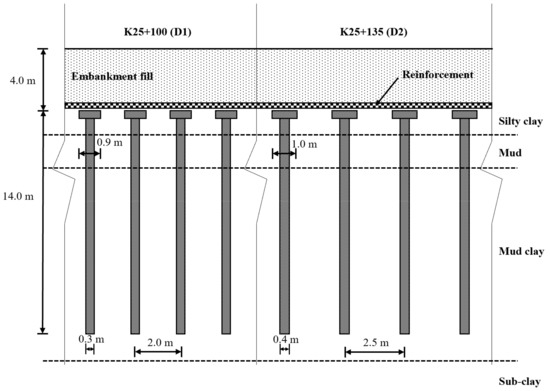
Figure 11.
The pile layout of the test section.
3.4. Comparison Results
The above three cases give the corresponding parameters of the GRPEs. The maximum strain of the reinforcement was estimated using the present method, BS8006′s [15] method, and EBGEO’s [21] method, respectively. For the design method proposed in this paper, the vertical stress carried by the subsoil was obtained by substituting the parameters into Equations (18)–(21), and then, the maximum strain of the reinforcement was directly obtained from Figure 5, Figure 6, Figure 7 and Figure 8. The results obtained were compared with the field test, which is detailed in Figure 12. It shows that EBGEO’s [21] method roughly underestimated the maximum strain of the reinforcement. The method of BS8006 [15] yielded a roughly larger maximum strain of the reinforcement as it excludes the contribution of subsoil. It can also be noted that the results of the proposed method were in better agreement with the results of field test when compared with the results yielded by EBGEO [21] and BS8006 [15]. The maximum deviation was less than 18%.
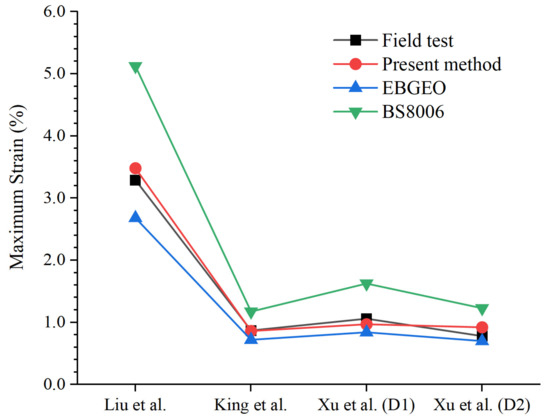
Figure 12.
Comparison of results for maximum strain of reinforcement.
4. Parameters’ Study
In the following sections, the GRPEs were analyzed using the proposed design method. The analysis of the factors affecting pile efficacy was conducted, and the influence of the subsoil stress history on the maximum strain of the reinforcement was investigated.
4.1. Pile Efficacy
In piled embankment structures, pile efficacy is usually defined to be the ratio of the stress carried by the pile over the total stress acting at the base of the embankment. The pile efficacy is an important quantification for the load transfer and the settlement calculation of GRPE. The pile efficacy may be affected by several factors, i.e., fill height, pile cap size, and pile spacing. Figure 13 shows the evolution of vertical stresses on the subsoil with the variation of pile spacings. It can be seen that the pile efficacy increased with the increase of the friction angle of the embankment fill and the increase of the ratio of pile cap width over pile spacing (i.e., b/s). The pile efficacy significantly improves with the increase of H/(s − b), which denotes a ratio of the embankment height over clear pile spacing, when H/(s − b) is less than 2.5. When H/(s − b) is greater than 2.5, the increase of pile efficacy becomes insignificant with the further increase of H/(s − b), during which soil arching may be completely triggered.
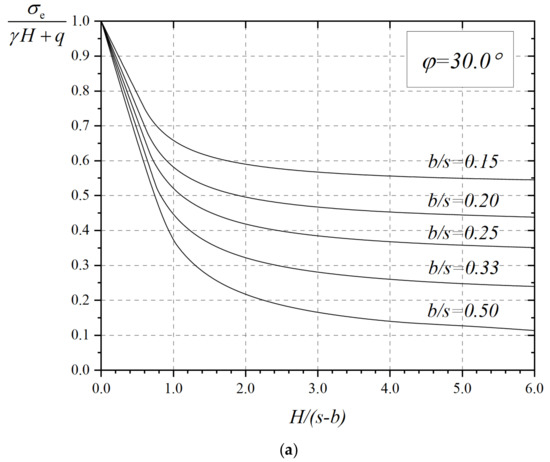
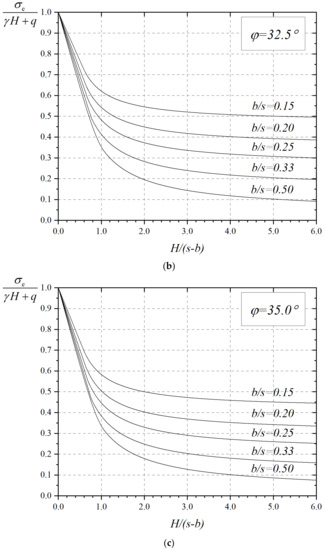
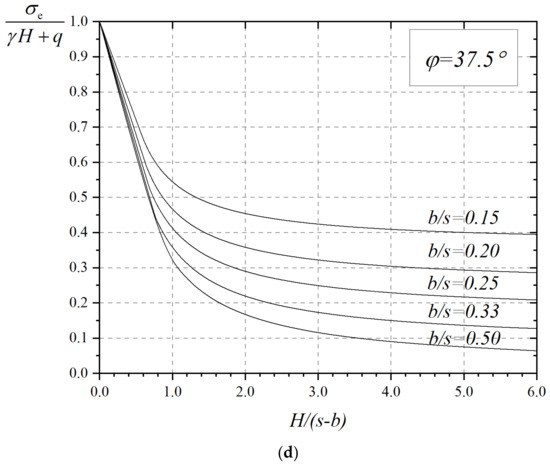
Figure 13.
Vertical stresses on the subsoil; (a) ; (b) ; (c) ; (d) .
4.2. The Influence of Stress History
Wang et al. [13] demonstrated that the effect of the stress history on the consolidation coefficient of the subsoil cannot be ignored. The variation of consolidation coefficients directly affects the final settlement of the subsoil and, thus, the bearing capacity of the subsoil. According to the load-transfer mechanism of GRPEs, the decrease of the subsoil’s bearing capacity may cause an increase of reinforcement strain.
Figure 14 shows the development of the maximum strain of the reinforcement along with the increase of the vertical stress in the subsoil under different stress histories. When performing the calculation, s = 2 m, b = 1.2 m, = 19 kN/m3, and h = 10 m were assumed. The compression indexes and the initial void ratios used in the calculations were extracted from the studies performed by He et al. [35]. The pre-consolidation pressure of over-consolidated and under-consolidated soil was assumed to be greater than and less than the average self-weight stress of the subsoil by 5 kPa, respectively, in the calculation.
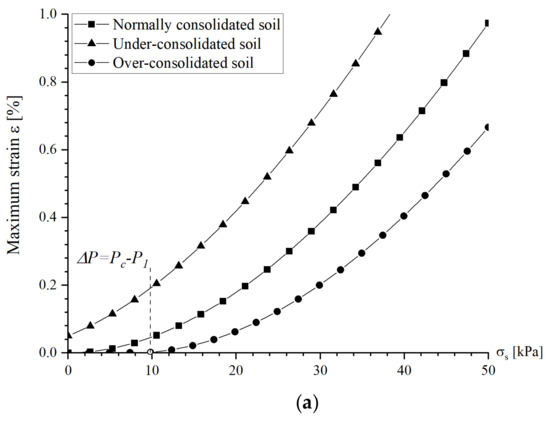
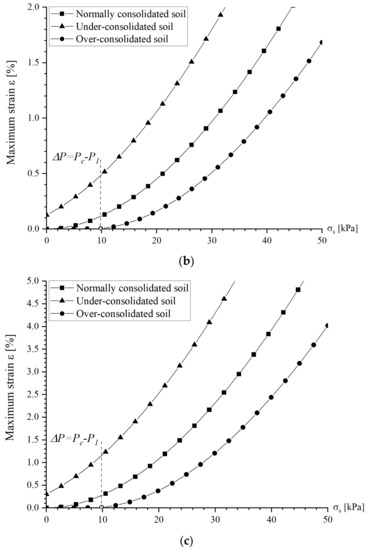
Figure 14.
The maximum strain of the reinforcement under different stress histories; (a) Cc = 0.1; Cs = 0.02; e0 = 0.51; (b) Cc = 0.2; Cs = 0.04; e0 = 0.90; (c) Cc = 0.4 Cs = 0.08; e0 = 1.46.
It can be seen that the maximum strain of the reinforcement increases gradually with increasing vertical stress. Under the same vertical stress, the reinforcement on under-consolidated soil has the largest strain—approximately, 80–120% larger than that of normally consolidated soil and more than four times greater than that of over-consolidated soil. The line of over-consolidated soil breaks at the moment when the compression index alters from Cs to Cc (see Figure 15). There is no doubt that the maximum strain of the reinforcement decreases with the decrease of the compression indexes.
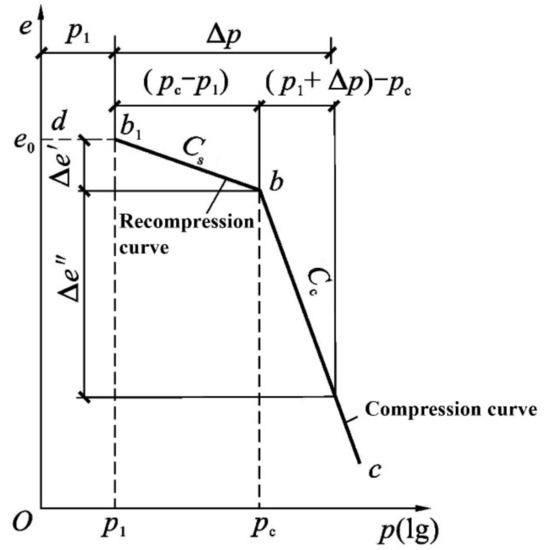
Figure 15.
e–lgp curve of over-consolidated soil.
5. Conclusions
A new design method was proposed, which aims to obtain the maximum strain of reinforcement in GRPE. This method was based on the Hewlett and Randolph’s [2] soil arching model and the BS8006 [14] reinforcement method modified by Zhuang and Ellis [5,7]. The innovation of the method lies in the fact that the settlements of the subsoil under different stress histories were incorporated. During the development of the design method, the sag of the reinforcement was assumed to be equal to the settlement of the subsoil. The maximum strain of reinforcement in GRPEs was accurately analyzed by considering the effect of different OCRs on subsoil settlement.
The method in this paper innovatively provides the design charts as a guideline for practical engineering. The vertical equilibrium of the unit body between the pile caps immediately above the subsoil, initially, was established. This means that the load acting on the base of the embankment was shared by the reinforcement and the subsoil. Then, the design charts were produced by solving the overall equilibrium equation. Therefore, engineers do not have to do complex mathematical calculations any longer. The maximum strain of the reinforcement can be easily obtained through the charts. This can then be used to evaluate the tensile strength and to perform the ultimate limit state analyses of reinforcement.
The design method was then validated by three case studies, which indicated good reliability of the method, producing an error that remained less than 18%. Parametric studies were carried out, and it was found that the stress history had a significant influence on the maximum strain of the reinforcement. The maximum strain of reinforcement on under-consolidated soil was 80–120% larger than that for normally consolidated soil and more than four times greater than that for over-consolidated soil under the same vertical stress.
Author Contributions
Conceptualization, S.H. and Y.Z.; methodology, S.H. and Y.Z.; software, S.H.; validation, S.H.; data curation, S.H.; writing—original draft preparation, S.H.; writing—review and editing, Y.Z., X.Z. and X.D.; visualization, S.H.; supervision, Y.Z. and X.D.; project administration, Y.Z.; funding acquisition, Y.Z. and X.Z. All authors have read and agreed to the published version of the manuscript.
Funding
This research was funded by the National Science Fund for Excellent Young Scholars of China (grant no. 51922029), the National Natural Science Foundation for General Program of China (grant no. 52178316), the Young Scholar of Science and Technology Committee of Shanxi Province (grant no. 20210302124110), and the Fundamental Research Funds for the Central Universities (grant no. 2242021k30051).
Institutional Review Board Statement
Not applicable.
Informed Consent Statement
Not applicable.
Data Availability Statement
Not applicable.
Conflicts of Interest
The authors declare no conflict of interest.
References
- Halvordson, K.A.; Plaut, R.H.; Filz, G.M. Analysis of geosynthetic reinforcement in pile-supported embankments. Part II: 3D cable-net model. Geosynth. Int. 2010, 17, 68–76. [Google Scholar] [CrossRef]
- Hewlett, W.J.; Randolph, M.F. Analysis of piled embankments. Ground Eng. 1988, 21, 12–18. [Google Scholar]
- Iglesia, G.R.; Einstein, H.H.; Whitman, R.V. Investigation of Soil Arching with Centrifuge Tests. J. Geotech. Geoenviron. Eng. 2014, 140, 04013005. [Google Scholar] [CrossRef]
- Terzaghi, K. Theoretical Soil Mechanics; Wiley: New York, NY, USA, 1943. [Google Scholar]
- Zhuang, Y.; Ellis, E. Finite-element analysis of a piled embankment with reinforcement compared with BS 8006 predictions. Géotechnique 2014, 64, 910–917. [Google Scholar] [CrossRef]
- Zhuang, Y.; Ellis, E.; Yu, H.S. Three-dimensional finite-element analysis of arching in a piled embankment. Géotechnique 2012, 62, 1127–1131. [Google Scholar] [CrossRef]
- Zhuang, Y.; Ellis, E. Finite-element analysis of a piled embankment with reinforcement and subsoil. Géotechnique 2016, 66, 596–601. [Google Scholar] [CrossRef] [Green Version]
- Zhuang, Y.; Wang, K.Y. Three-dimensional behavior of biaxial geogrid in a piled embankment: Numerical investigation. Can. Geotech. J. 2015, 52, 1629–1635. [Google Scholar] [CrossRef]
- Filz, G.M.; Smith, M.E. Net Vertical Loads on Geosynthetic Reinforcement in Column-Supported Embankments. In Proceedings of the Geo-Denver 2007, New Peaks in Geotechnics, Denver, CO, USA, 18–21 February 2007; pp. 1–10. [Google Scholar]
- Zhuang, Y.; Wang, K.Y.; Liu, H.L. A simplified model to analyze the reinforced piled embankments. Geotext. Geomembr. 2014, 42, 154–165. [Google Scholar] [CrossRef]
- Grammatikopoulou, A.; Zdravkovic, L.; Potts, D.M. The influence of previous stress history and stress path direction on the surface settlement trough induced by tunnelling. Géotechnique 2008, 58, 269–281. [Google Scholar] [CrossRef] [Green Version]
- Zhang, T.; Taylor, R.N.; Divall, S.; Zheng, G.; Sun, J.; Stallebrass, S.E.; Goodey, R.J. Explanation for twin tunnelling-induced surface settlements by changes in soil stiffness on account of stress history. Tunn. Undergr. Space Technol. 2019, 85, 160–169. [Google Scholar] [CrossRef]
- Wang, J.F.; Yuan, W.; He, K.; Zheng, P.X. Influence of stress history on consolidation coefficient of saturated soft soil. Earth Sci. 2020, 45, 4640–4648. (In Chinese) [Google Scholar]
- British Standard BS8006-1; Code of Practice for Strengthened/Reinforced Soils and Other Fills. British Standards Institution (BSI): London, UK, 2010.
- British Standard BS8006-1; Code of Practice for Strengthened/Reinforced Soils and Other Fills, incorporating corrigendum 1. British Standards Institution (BSI): London, UK, 2012.
- Van Eekelen, S.J.M.; Bezuijen, A.; Van Tol, A.F. Analysis and modification of the British Standard BS8006 for the design of piled embankments. Geotext. Geomembr. 2011, 29, 345–359. [Google Scholar] [CrossRef]
- Russell, D.; Naughton, P.J.; Kempton, G. A new design procedure for piled embankments. In Proceedings of the 56th Canadian Geotechnical Conference and the NAGS Conference, Winnipeg, MB, Canada, 29 September–1 October 2003; pp. 858–865. [Google Scholar]
- Zhuang, Y.; Wang, K. Analytical Solution for Reinforced Piled Embankments on Elastoplastic Consolidated Soil. Int. J. Geomech. 2017, 17, 06017010. [Google Scholar] [CrossRef]
- Pham, T.A.; Dias, D. A simplified model for the analysis of piled embankments considering arching and subsoil consolidation. Geotext. Geomembr. 2021. [Google Scholar] [CrossRef]
- Deb, K.; Mohapatra, S.R. Analysis of stone column-supported geosynthetic-reinforced embankments. Appl. Math. Model. 2013, 37, 2943–2960. [Google Scholar] [CrossRef]
- GGS. Recommendations for Design and Analysis of Earth Structures Using Geosynthetic Reinforcements—EBGEO; German Geotechnical Society: Berlin, Germany, 2011. [Google Scholar]
- Lu, W.; Miao, L. A simplified 2-D evaluation method of the arching effect for geosynthetic-reinforced and pile-supported embankments. Comput. Geotech. 2015, 65, 97–103. [Google Scholar] [CrossRef]
- Van Eekelen, S.J.M.; Bezuijen, A.; Van Tol, A.F. An analytical model for arching in piled embankments. Geotext. Geomembr. 2013, 39, 78–102. [Google Scholar] [CrossRef]
- Zhang, L.; Zhao, M.; Hu, Y.; Zhao, H.; Chen, B. Semi-analytical solutions for geosynthetic-reinforced and pile-supported embankment. Comput. Geotech. 2012, 44, 167–175. [Google Scholar] [CrossRef]
- Zhang, L.; Zhou, S.; Zhao, H. Coupling-Based Elastic Solution of Arching Evolution for GRPSE. J. Eng. Mech. 2021, 147, 06021005. [Google Scholar] [CrossRef]
- Pham, T.A. Design and analysis of geosynthetic-reinforced and floating column-supported embankments. Int. J. Geotech. Eng. 2021, 1–17. [Google Scholar] [CrossRef]
- Kempfert, H.G.; Zaeske, D. Interactions in reinforced bearing layers over partial supported underground. In Proceedings of the 12th European Conference for Soil Mechanics and Geotechnical Engineering (ECSMGE), Amsterdam, The Netherlands, 7–10 June 1999; pp. 1527–1532. [Google Scholar]
- Kempfert, H.G.; Stadel, M.; Zaeske, D. Berechnung von geokunststoffbewehrten Teagschichten über Pfahlelementen. Bautechnik 1997, 12, 818–825. [Google Scholar]
- Zaeske, D. Zur Wirkungsweise von Unbewehrten und bewehrten Mineralischen Tragschichten Über Pfahlartigen Gründungselementen; University of Kassel: Kassel, Germany, 2001. [Google Scholar]
- Zaeske, D. Berechnung und Wirkungsweise von unbewehrten und bewehrten mineralischen Tragschichten ueber punkt-und linienfoermigen Traggliedern. Bauingenieur 2002, 77, 80–86. [Google Scholar]
- Casagrande, A. The determination of pre-consolidation load and its practical significance. In Proceedings of the International Conference on Soil Mechanics and Foundation Engineering, Cambridge, MA, USA, 22–26 June 1936. [Google Scholar]
- Liu, H.; Kong, G.; Chu, J.; Ding, X. Grouted gravel column-supported highway embankment over soft clay: Case study. Can. Geotech. J. 2015, 52, 1725–1733. [Google Scholar] [CrossRef]
- King, D.J.; Bouazza, A.; Gniel, J.R.; Rowe, R.K.; Bui, H.H. Serviceability design for geosynthetic reinforced column supported embankments. Geotext. Geomembr. 2017, 45, 261–279. [Google Scholar] [CrossRef]
- Xu, Z.Z.; Chen, R.P.; Chen, Y.M. Study of in-situ data of pile-supported embankment with pile partially penetrated in soft soils. Chin. J. Rock Mech. Eng. 2009, 11, 2336–2341. (In Chinese) [Google Scholar]
- He, P.; Wang, W.D.; Xu, Z.H. Empirical correlations of compression index and swelling index for Shanghai clay. Rock Soil Mech. 2018, 39, 3773–3782. (In Chinese) [Google Scholar]
Publisher’s Note: MDPI stays neutral with regard to jurisdictional claims in published maps and institutional affiliations. |
© 2022 by the authors. Licensee MDPI, Basel, Switzerland. This article is an open access article distributed under the terms and conditions of the Creative Commons Attribution (CC BY) license (https://creativecommons.org/licenses/by/4.0/).