2.1. Numerical Analysis of External Water Pressure of Initial Support of Sub-Sea Tunnel
The F5 structural fracture zone section of the sub-sea tunnel in the Daqing section of Qingdao Metro Line 8 is the engineering background, based on the numerical calculation model, and according to the stratum and support structure design of this section, the external water pressure of sub-sea tunnel lining is calculated. This section is located in the slightly weathered to moderately weathered tuff stratum with joint development and the permeability coefficient of surrounding rock k
r = 0.6 m/d. The thickness of the grouting ring t
2 = 5 m and the permeability coefficient is considered as slightly weathered tuff, taking k
g = 0.01 m/d. The initial support is 0.3 m thick C25 shotcrete, the impermeability grade is P6 [
23], and its permeability coefficient k
i = 1.0 × 10
−8 m/d. The calculation results of external water pressure of model initial support are shown in
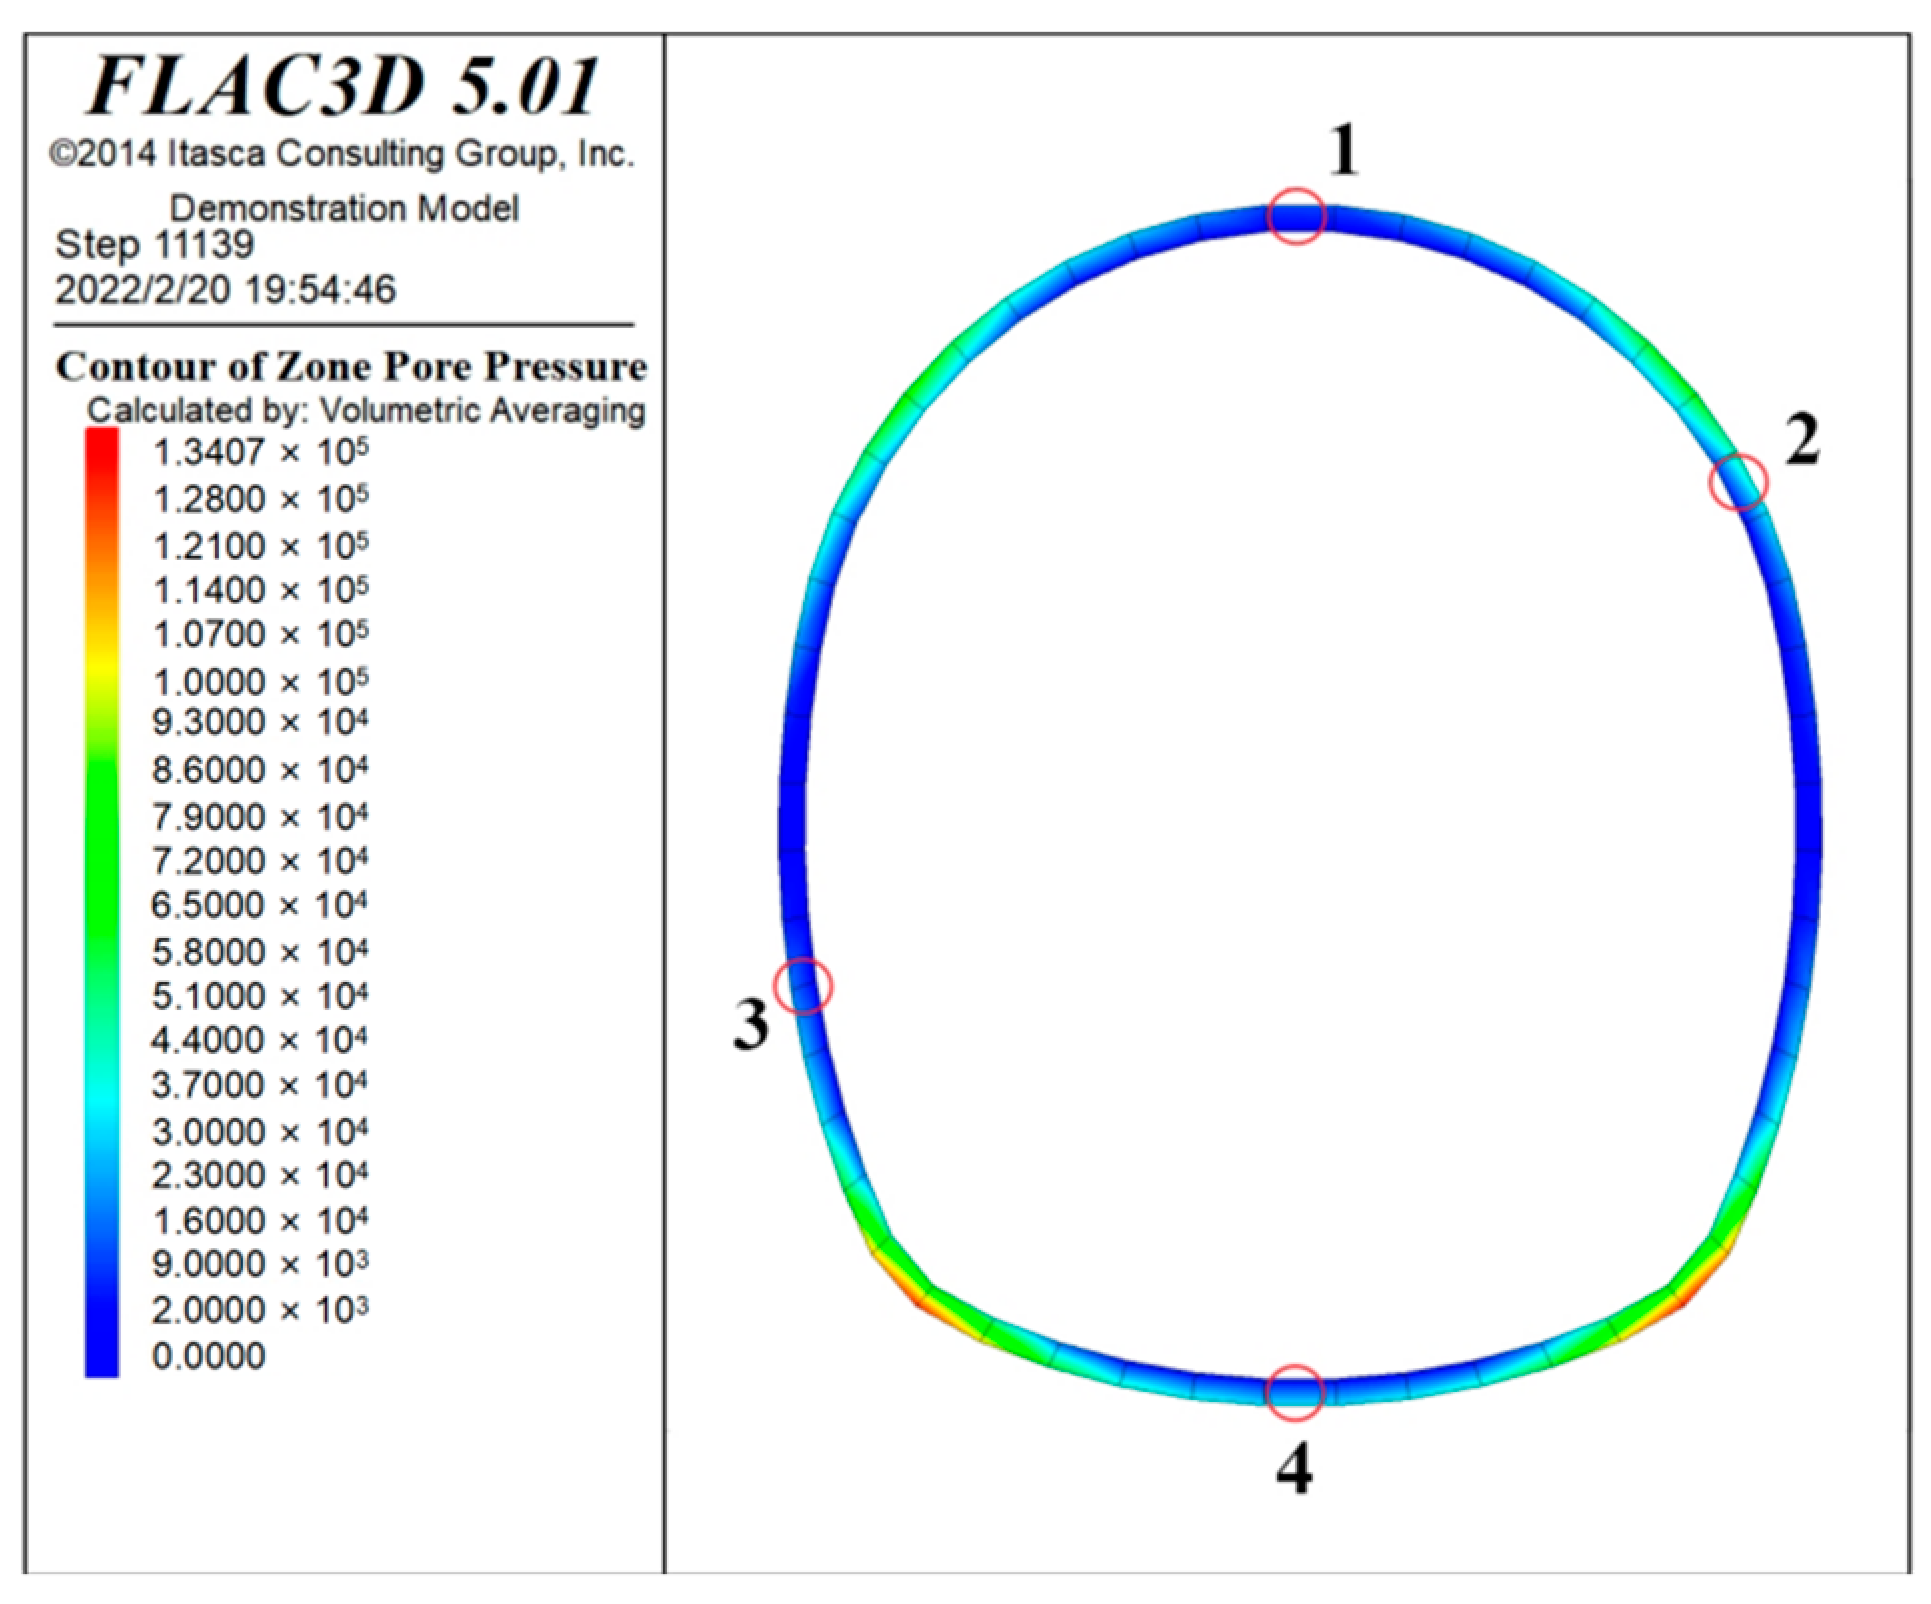
Figure 1, and the water pressure at the marked position in the figure is shown in
Table 1.
It can be seen from
Figure 1 and
Table 1 that under the condition of water blocking and drainage restriction, the external water pressure distribution of the initial support is uneven, and the maximum water pressure is 134 kPa. The total head at the vault of the tunnel is 52 m, and the water pressure at each part is less than 30% of the total head. It shows that the water pressure outside the tunnel lining is not hydrostatic pressure. The water pressure is different at different positions. The water pressures of monitoring points 1–4 are 11.53, 12.66, 18.74, and 31.54 kPa, respectively.
2.2. Field Test on External Water Pressure of Initial Support of the Sub-Sea Tunnel
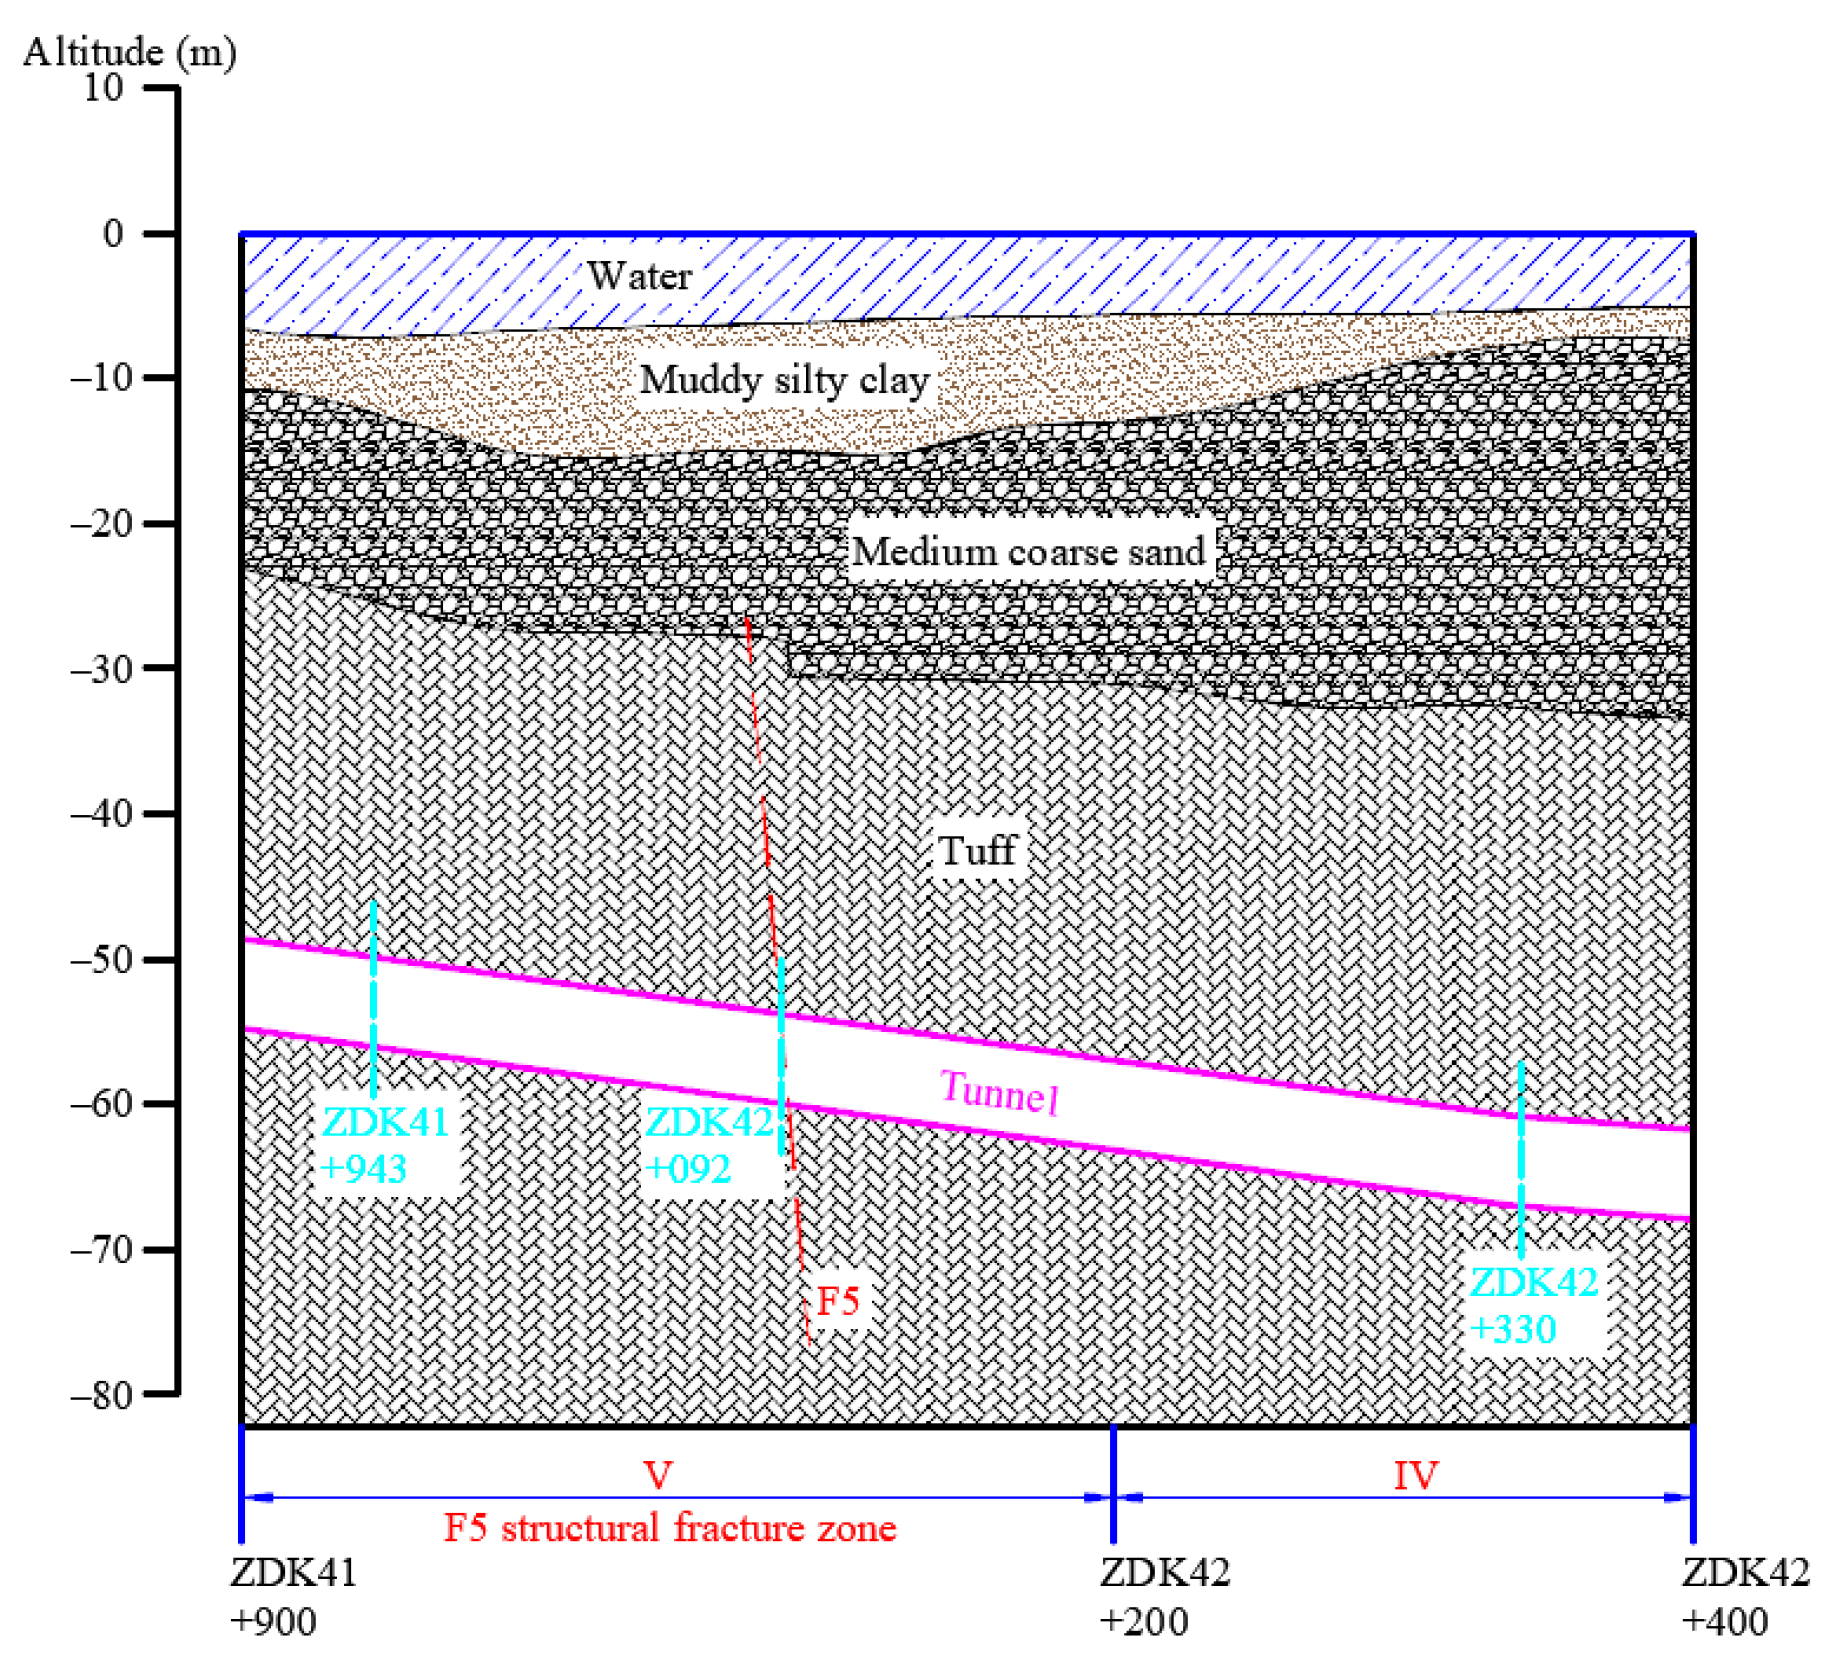
In order to verify the previous research on the external water pressure of the initial support of the sub-sea tunnel, the real-time on-site detection of the external water pressure of the initial support was carried out in the sea area of the Daqing section of Qingdao Metro Line 8. At the same time, to guide the construction, the monitoring sections are selected in the important and difficult construction section of the F5 structural fracture zone. A total of three monitoring sections are selected (see
Figure 2). In
Figure 2, F5 (red line) is an active fault, and the regional scope (ZDK41+990–ZDK42+200) is the area affected by the F5 fault. The surrounding rock in this area is broken under the influence of the F5 fault. The surrounding rock is grade IV–V, all of which are soft and broken surrounding rock. The classification of surrounding rock in
Table 2 refers to the Chinese tunnel design code [
23]. The total head height of the tunnel vault is 51–55 m. Pre-grouting water blocking measures are taken for all three sections. The statistics of the monitoring sections are shown in
Table 2. The physical and mechanical parameters of the surrounding rock are shown in
Table 3.
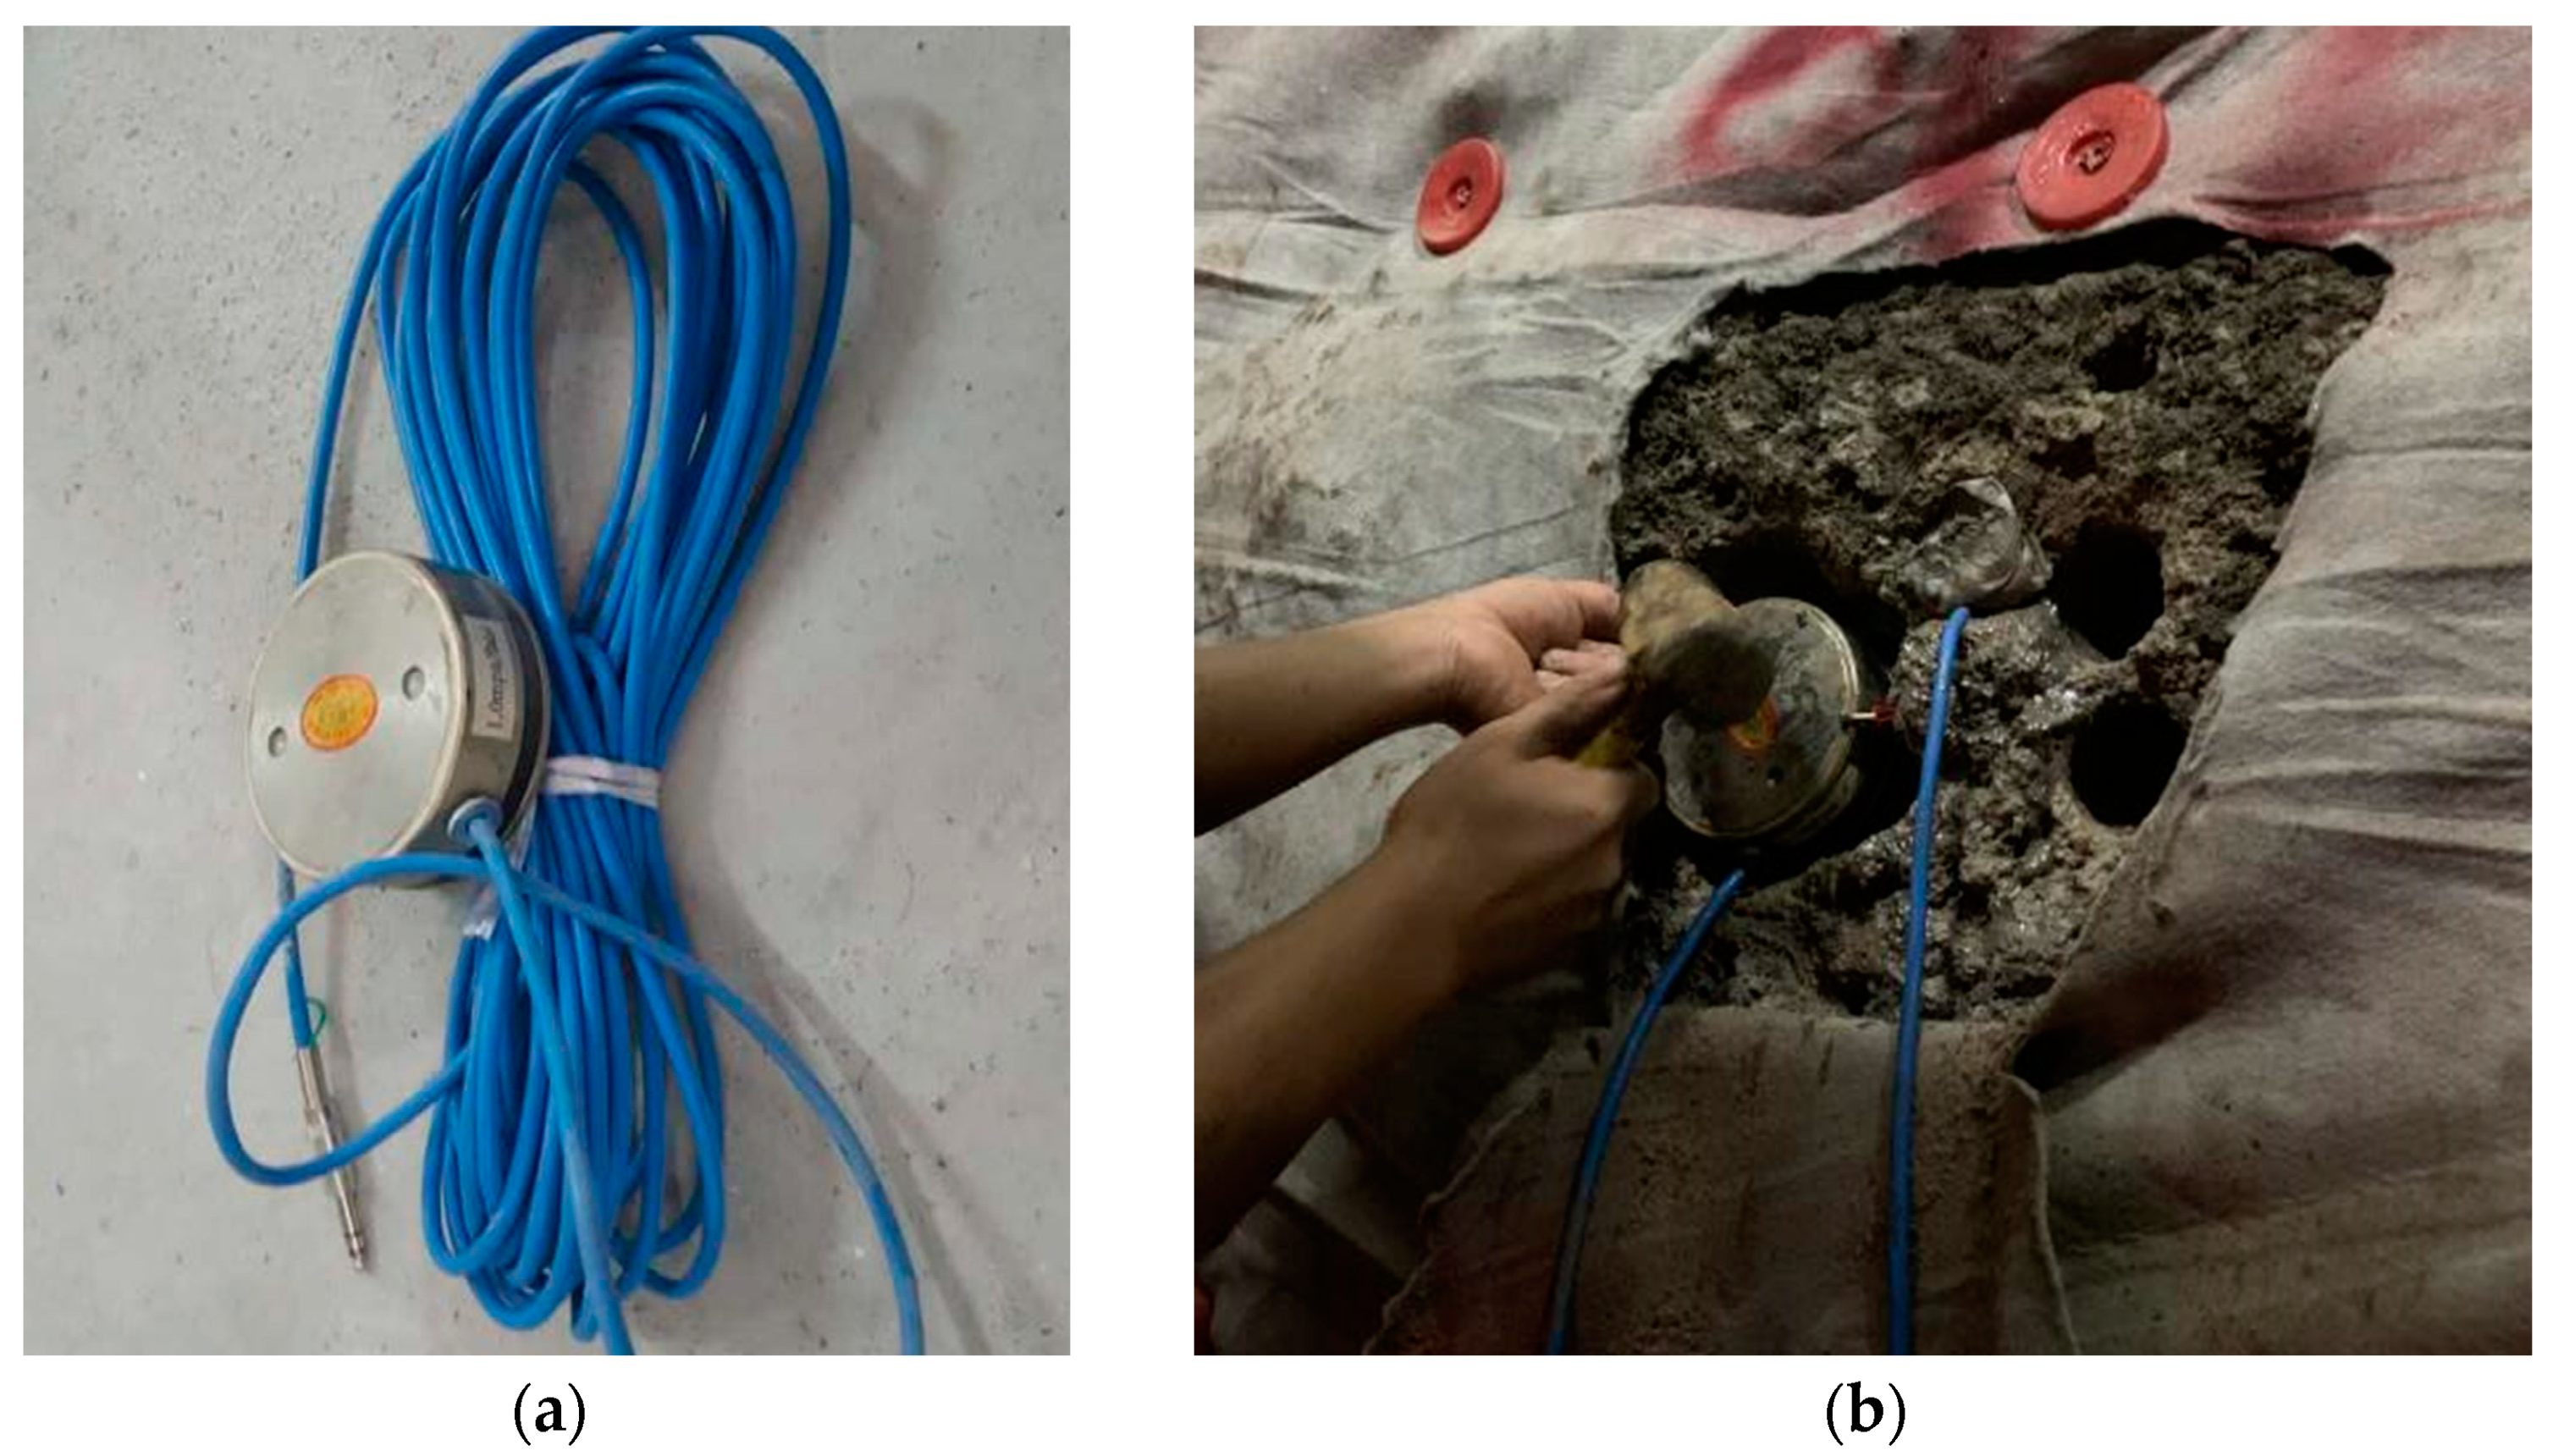
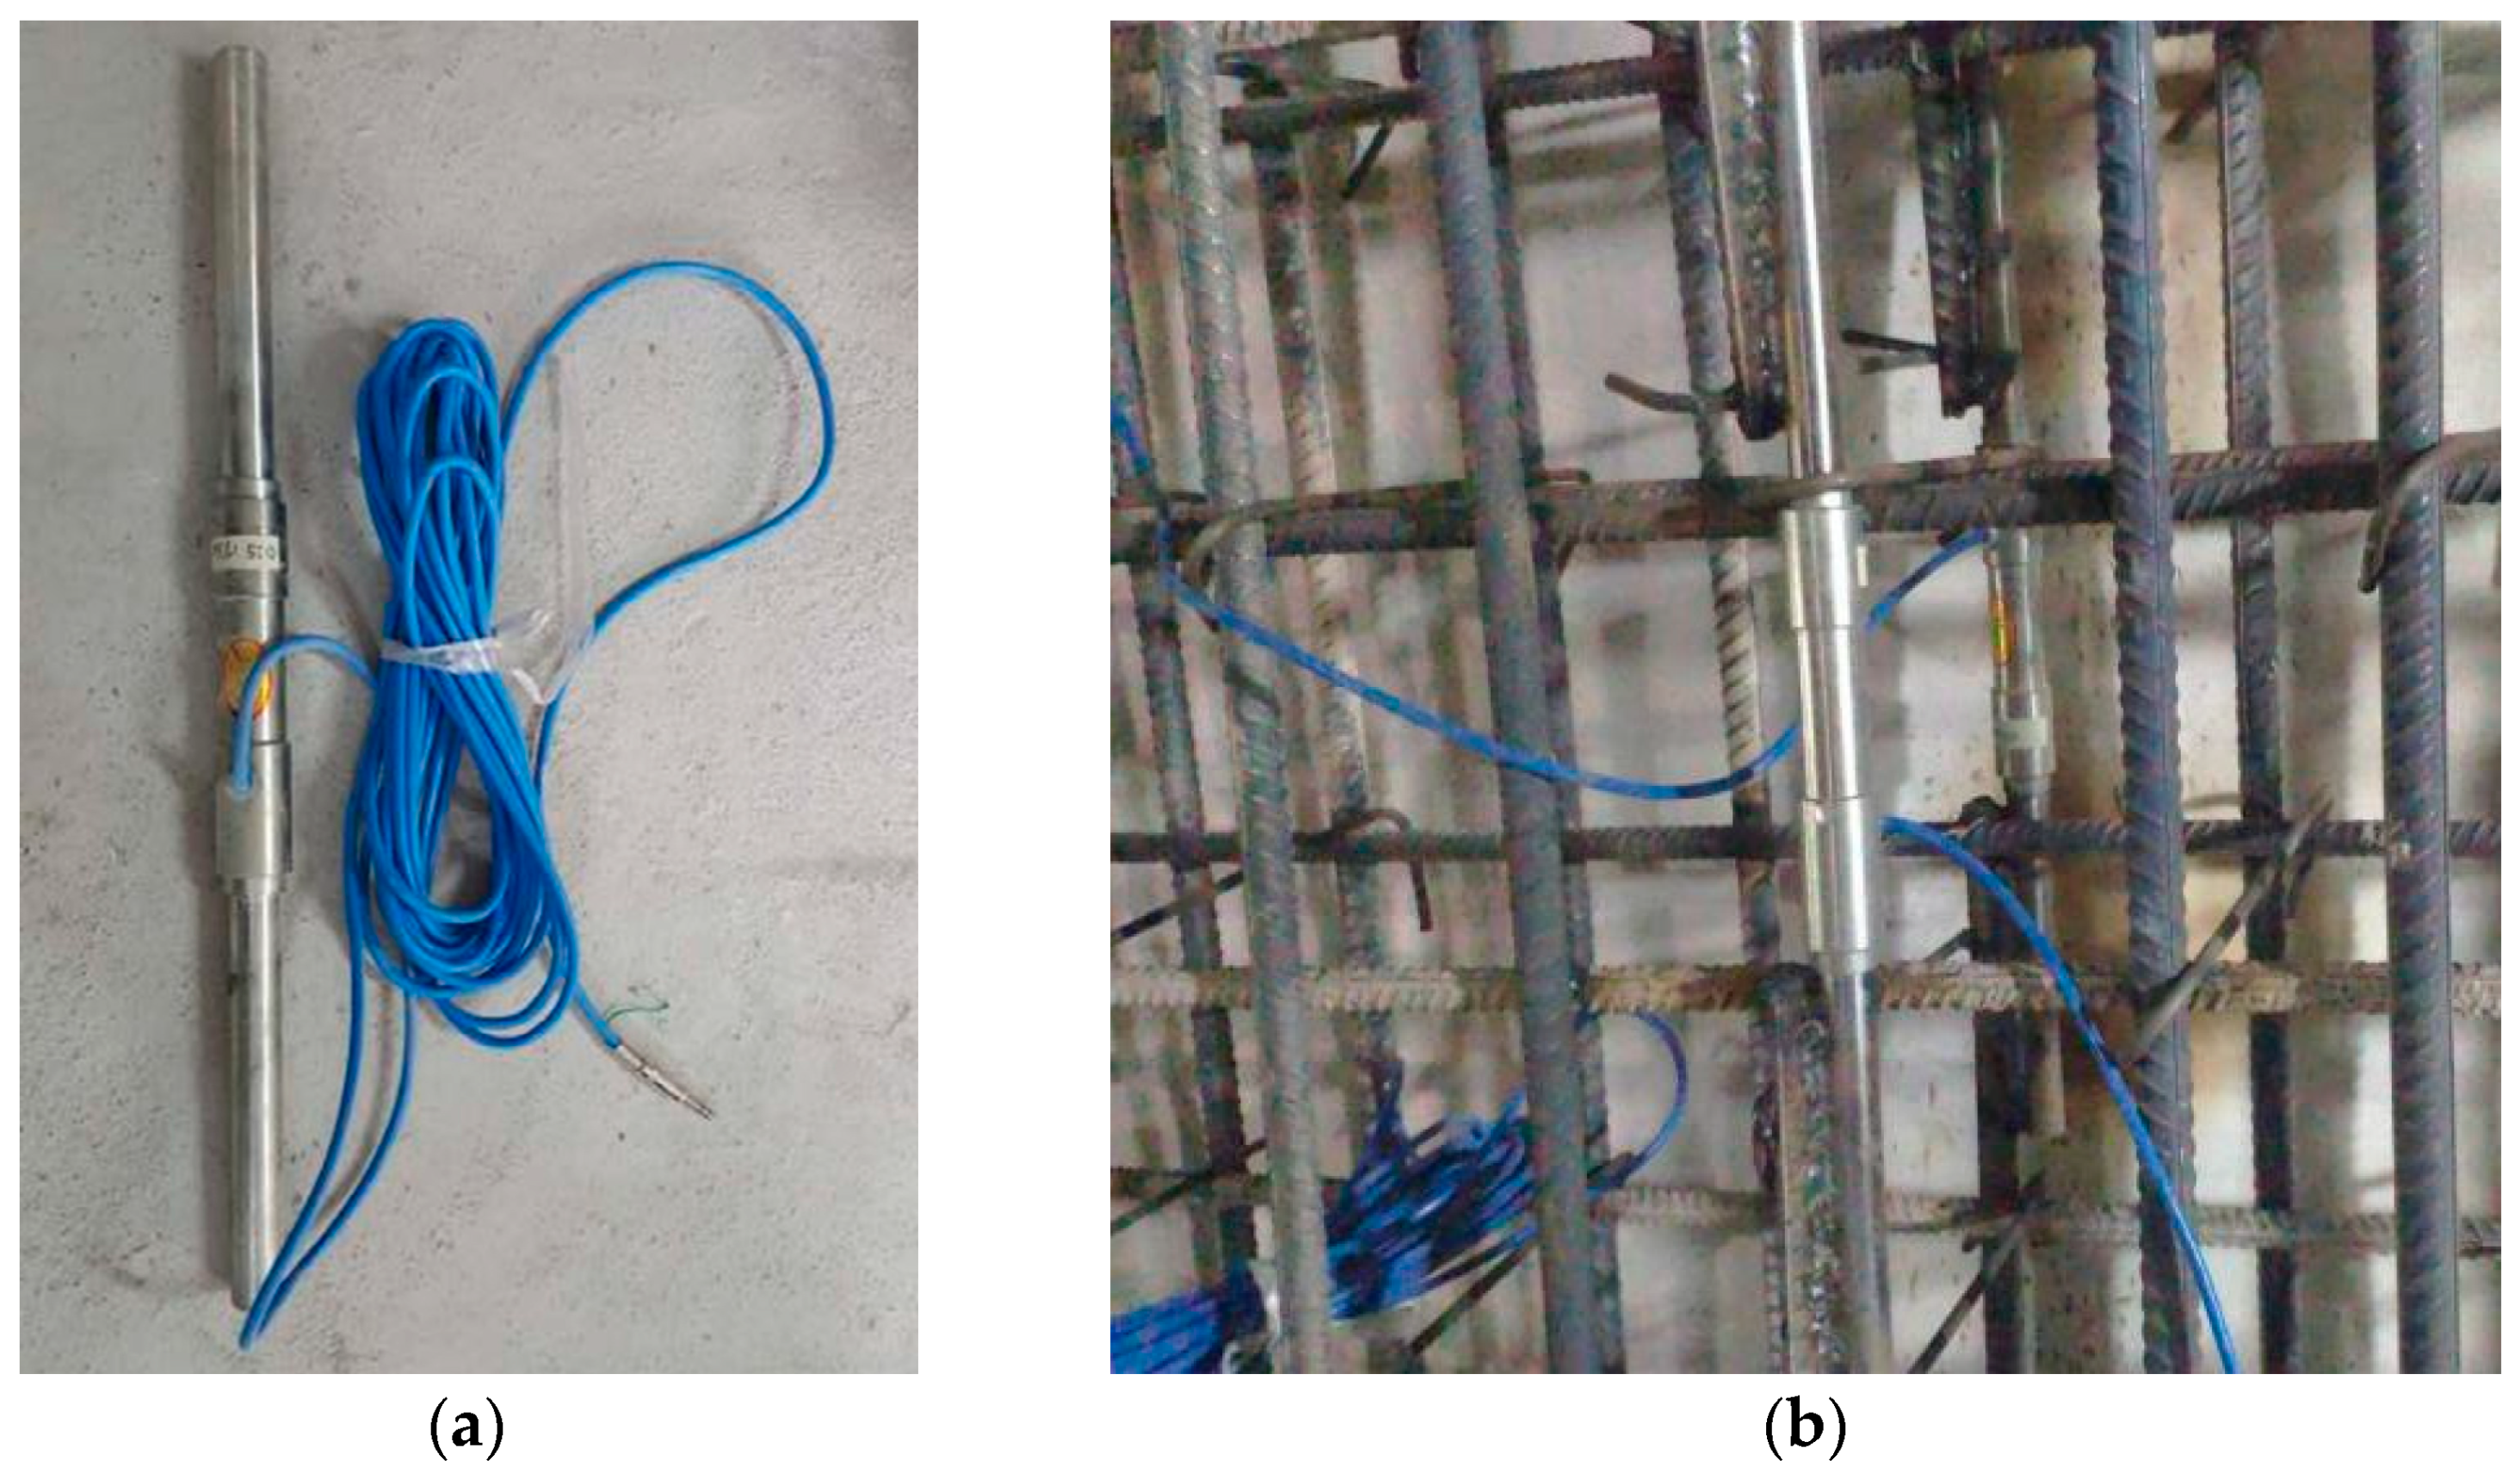
Six pore water pressure measuring points are arranged outside the initial support of each section. The layout of measuring points and the embedding position of instruments are shown in
Figure 3. The vibrating wire pore water pressure sensor is selected as the instrument. The instruments and on-site installation photos are shown in
Figure 4. After nearly five months of continuous monitoring, the time history curve of initial support external water pressure is obtained, as shown in
Figure 5.
It can be seen from
Figure 5 that the external water pressure of the initial support of ZDK42+330 quickly is located in an F5 fracture zone. There was strong volatility in the early stage, although the external water pressure on the initial support of the two sections gradually stabilized after more than two months. ZDK41+943 and ZDK42+092 are located in the F5 bedrock fracture zone, although the two sections finally reach a stable state. However, there was strong volatility in the early stage, which gradually stabilized after two months. On the 14th day of monitoring, the external water pressure of the initial support of ZDK41+943 increased as a whole. The maximum value appears in the inverted arch, reaching 61 kPa, about 11% of the total head. After the water pressure of each part is maintained for about 1 week, it gradually drops to the normal level. Combined with the on-site construction, it is found that the reason is the poor drainage in this area. After the external water pressure of the lining is stable, the water pressure at the inverted arch is the largest. The water pressure at the tunnel invert for ZDK 41+943 and ZDK 42+092 is about twice the one at the other parts of the tunnel. The initial support water pressure of the three monitoring sections finally stabilized below 50 kPa, which is equivalent to the hydrostatic pressure generated by a 5 m water head. The total water head at the vault of the three sections of the tunnel is between 51 m and 55 m. It can be seen that the external water pressure of the initial support measured on site is less than 10% of the total water head.
2.4. Proposal of Water Pressure Reduction Coefficient
This paper puts forward the selection method of water pressure reduction coefficient of sub-sea tunnel lining, mainly considering three factors: surrounding rock permeability coefficient k
r, tunnel grouting ring thickness t
2 and grouting effect k
r/k
g. According to the permeability coefficient, the surrounding rock is divided into class A surrounding rock (k
r ≤ 0.2 m/d), class B surrounding rock (0.2 m/d < k
r ≤ 0.8 m/d), and class C surrounding rock (0.8 m/d < k
r ≤ 1 m/d). The water pressure reduction coefficient selection under various surrounding rock conditions is shown in
Table 4,
Table 5 and
Table 6. It should be noted that these reduction coefficients can only be used for horseshoe tunnels and have previously defined tunnel support thickness and permeability, and water level values. In addition, the recommended values in the following tables are based on the above discussion and a large number of numerical calculations. The water pressure reduction coefficients are directly given here, which is only a recommended value. Although a few reduction coefficients are verified above, more importantly, more similar projects need to be verified in the future.
2.5. Bearing Capacity of Secondary Lining under Different Water Pressure Reduction Coefficients
Based on the above research results, it is inferred that the initial support can form a closed structure with strong impermeability, which can bear large water pressure, while the water pressure on the secondary lining is very small. However, the long-term erosion of primary support shotcrete by seawater may seriously decline its impermeability and cannot play a good role in water plugging [
24,
25], which may increase the water pressure of the secondary lining. The initial support is shotcrete and includes steel arch, reinforcement mesh, and other structures, which is easy to produce weak sealing parts and even form cavities in them [
26]. As the last line of defense of the tunnels, the secondary lining needs to consider the above situations in the design and must have high impermeability and bearing capacity as a safety reserve.
When calculating the bearing capacity of the lining structure, in order to ensure the safety of the tunnel lining structure, this paper assumes that the initial support is not waterproof. Considering that all the external water pressure of the initial support studied above acts on the secondary lining, the internal force of the lining structure is calculated, and then the reinforcement and safety factors are calculated. The calculation is mainly based on Code for Design of Metro [
27] and Code for Design of Railway Tunnel [
23].
This part of the calculation still takes the F5 fracture zone in the Daqing section of Qingdao Metro Line 8 as the engineering background and selects the representative class V surrounding rock section ZDK42+092 section to establish the model. Due to the influence of the fracture zone, the fractured rock at this section is extremely developed. The whole stratum is in loose to columnar structure, the surrounding rock is mainly jointed tuff, and the groundwater is bedrock fissure water. The total water head at the vault of the tunnel is 53.4 m. The secondary lining of section ZDK42+092 is 45 cm thick with C50 reinforced concrete structure. The physical and mechanical parameters of surrounding rock and concrete are shown in
Table 7 [
23], and the structural dimensions of the lining are shown in
Figure 7.
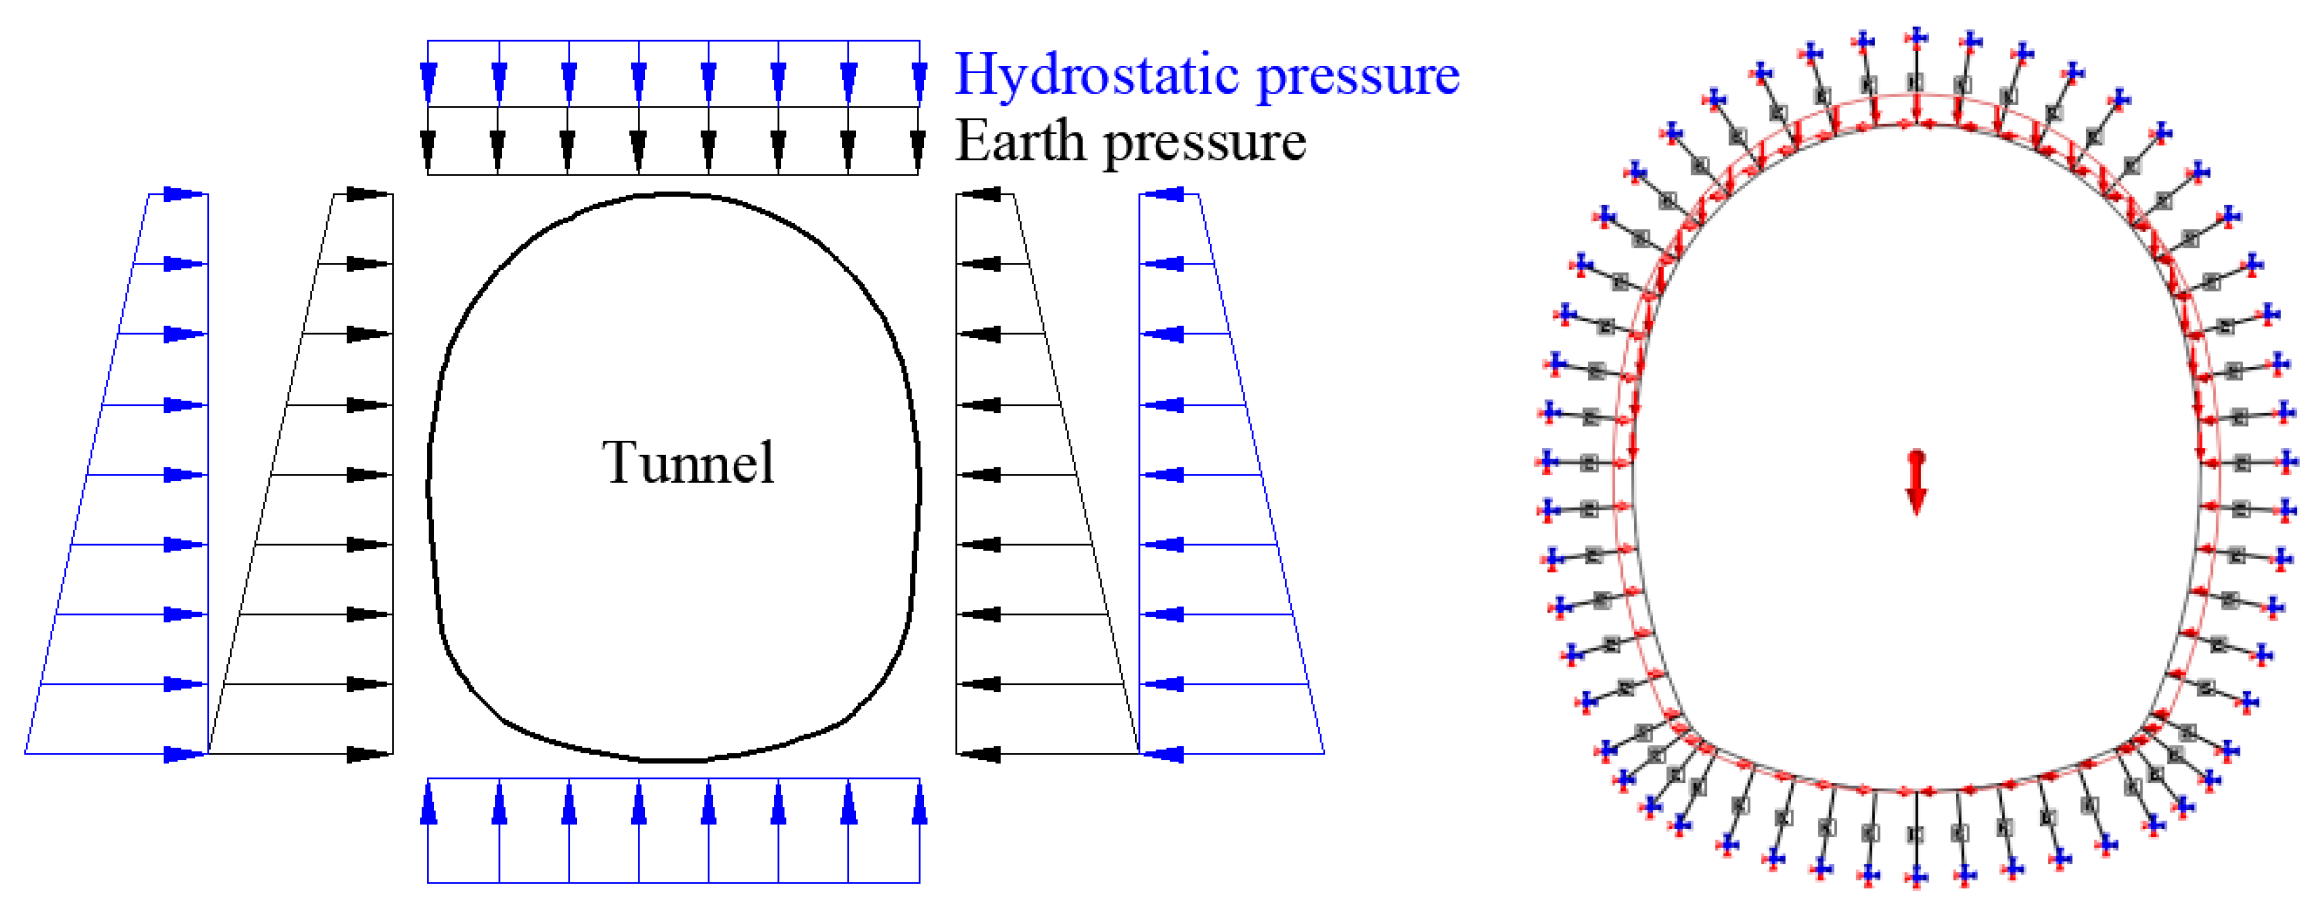
Midas GTS NX finite element calculation software established the Load-structure model. The central line of the second lining is taken as the contour line of the model, and the contour line is a five center circle. The calculation load mainly considers the surrounding rock pressure, water pressure, structural self-weight and formation elastic resistance. The elastic resistance of formation is simulated by radial spring. The lining water pressure is calculated by the reduction coefficient method. The surrounding rock load calculation method is shown in the Code for Design of Railway tunnel [
23]. After calculation, the lining load is shown in
Table 8, in which the actual water pressure shall be reduced according to the working conditions. The surrounding rock load distribution and the calculation model are shown in
Figure 8. The earth pressure at the bottom of the tunnel is simulated by the foundation reaction provided by the foundation spring (see
Figure 8 outside the tunnel).
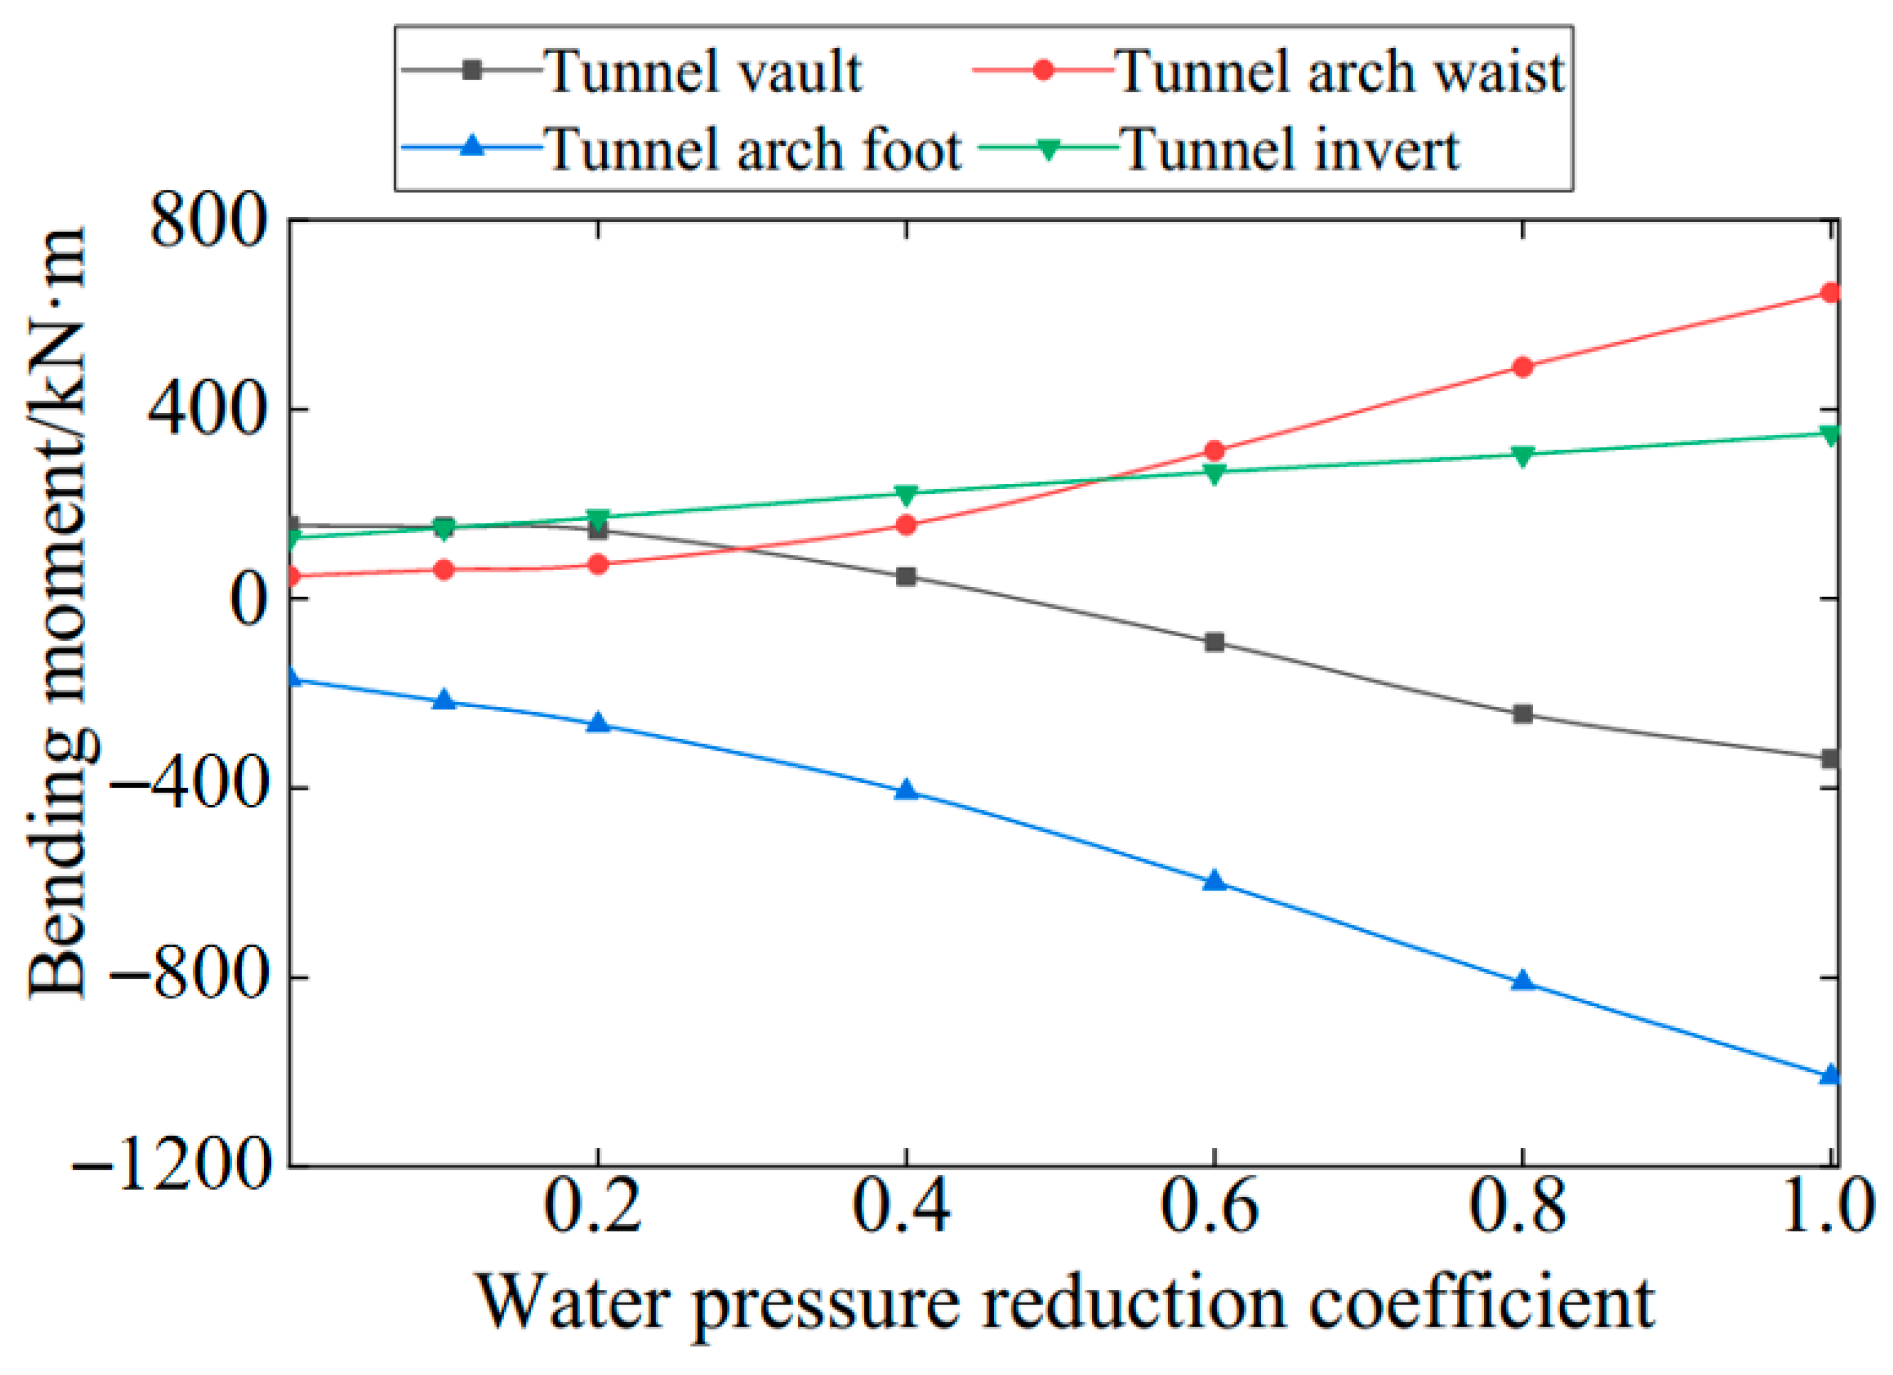
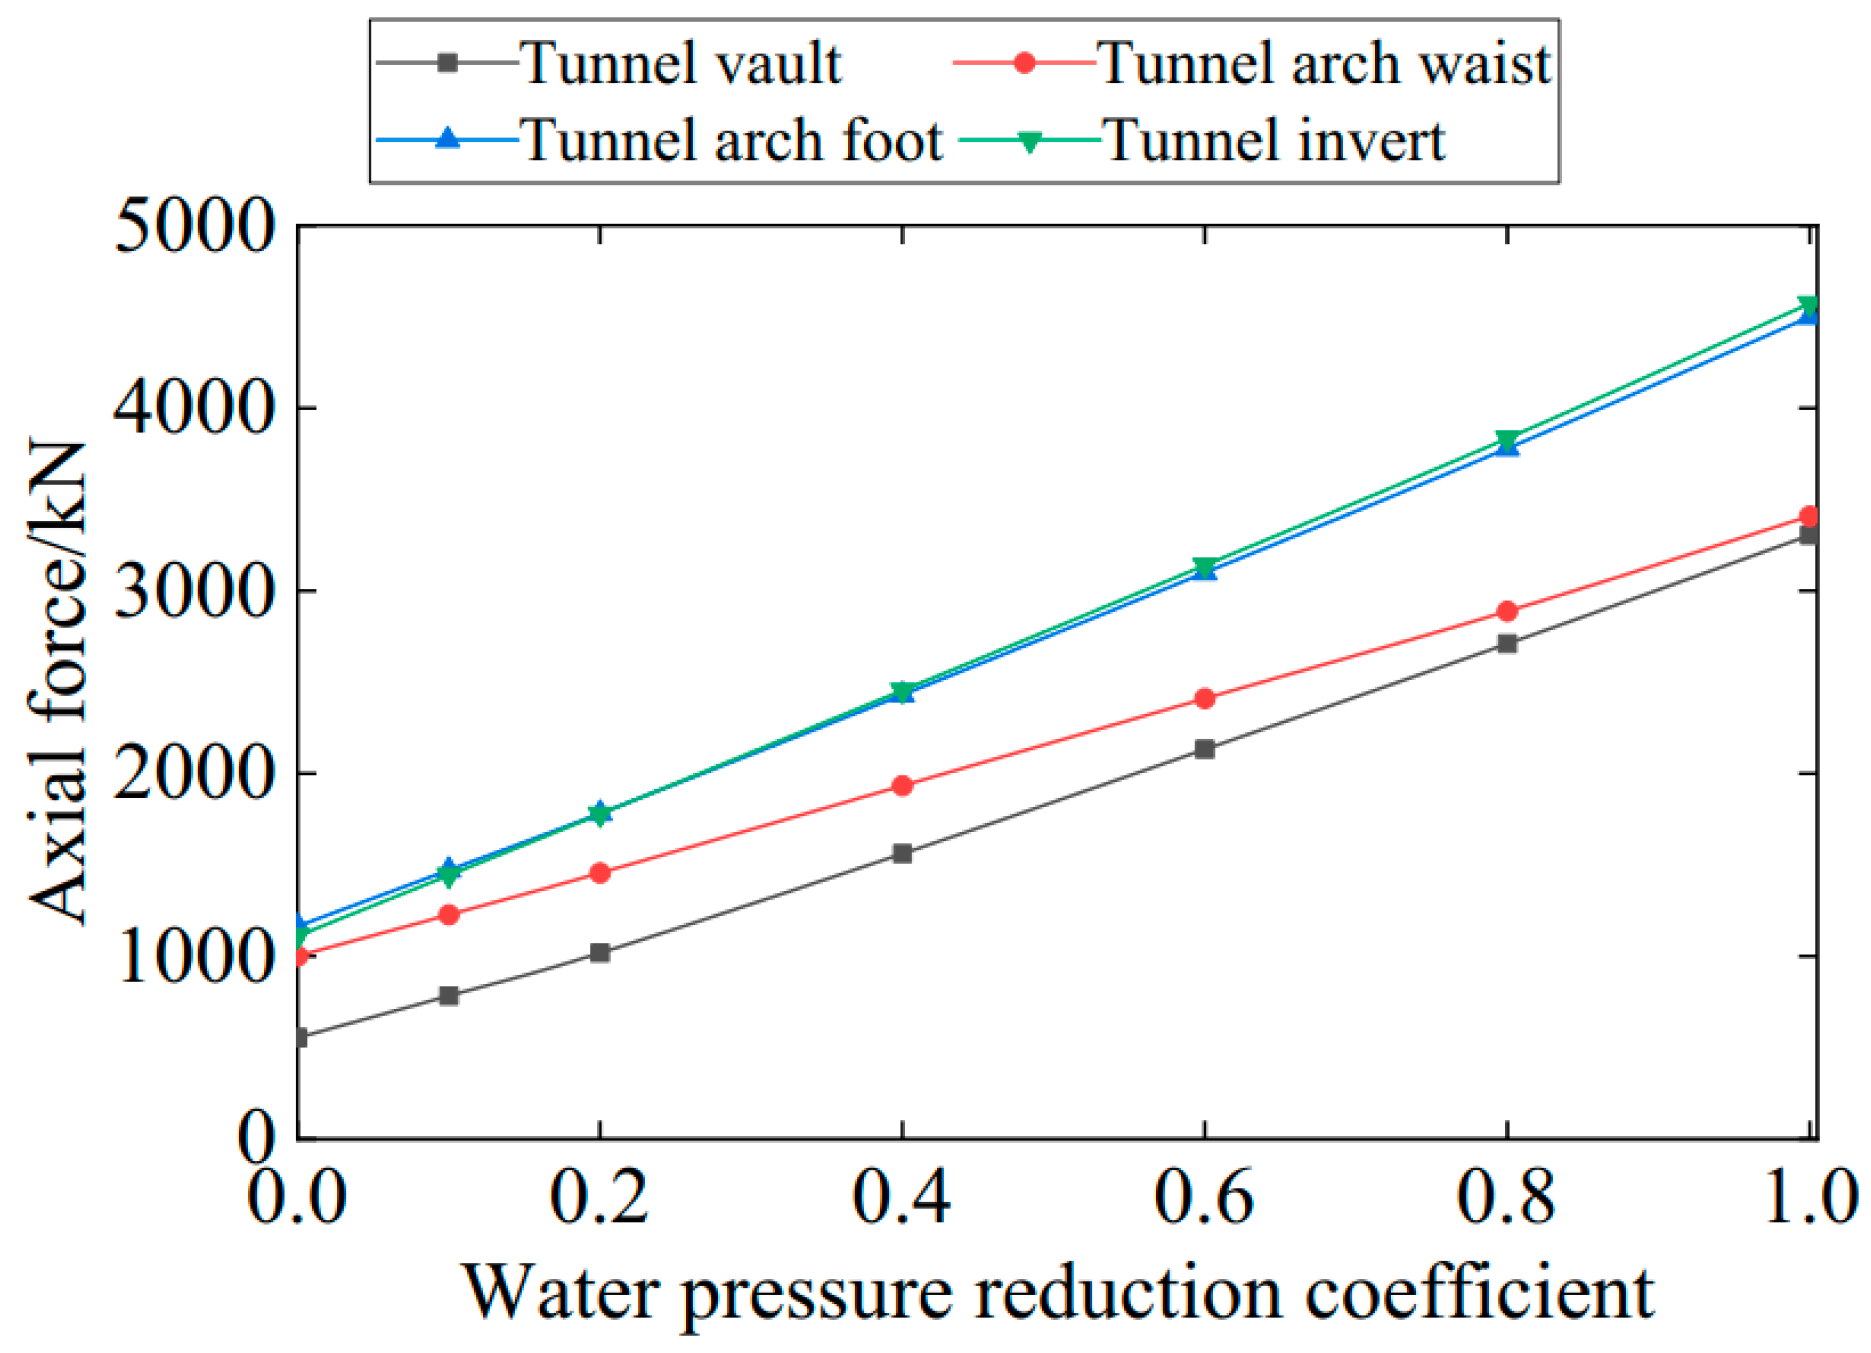
When the water pressure reduction coefficient is 0, 0.1, 0.2, 0.4, 0.6, 0.8, and 1.0, respectively, the variation of axial force and bending moment at each part with the water pressure reduction coefficient is shown in
Figure 9 and
Figure 10.
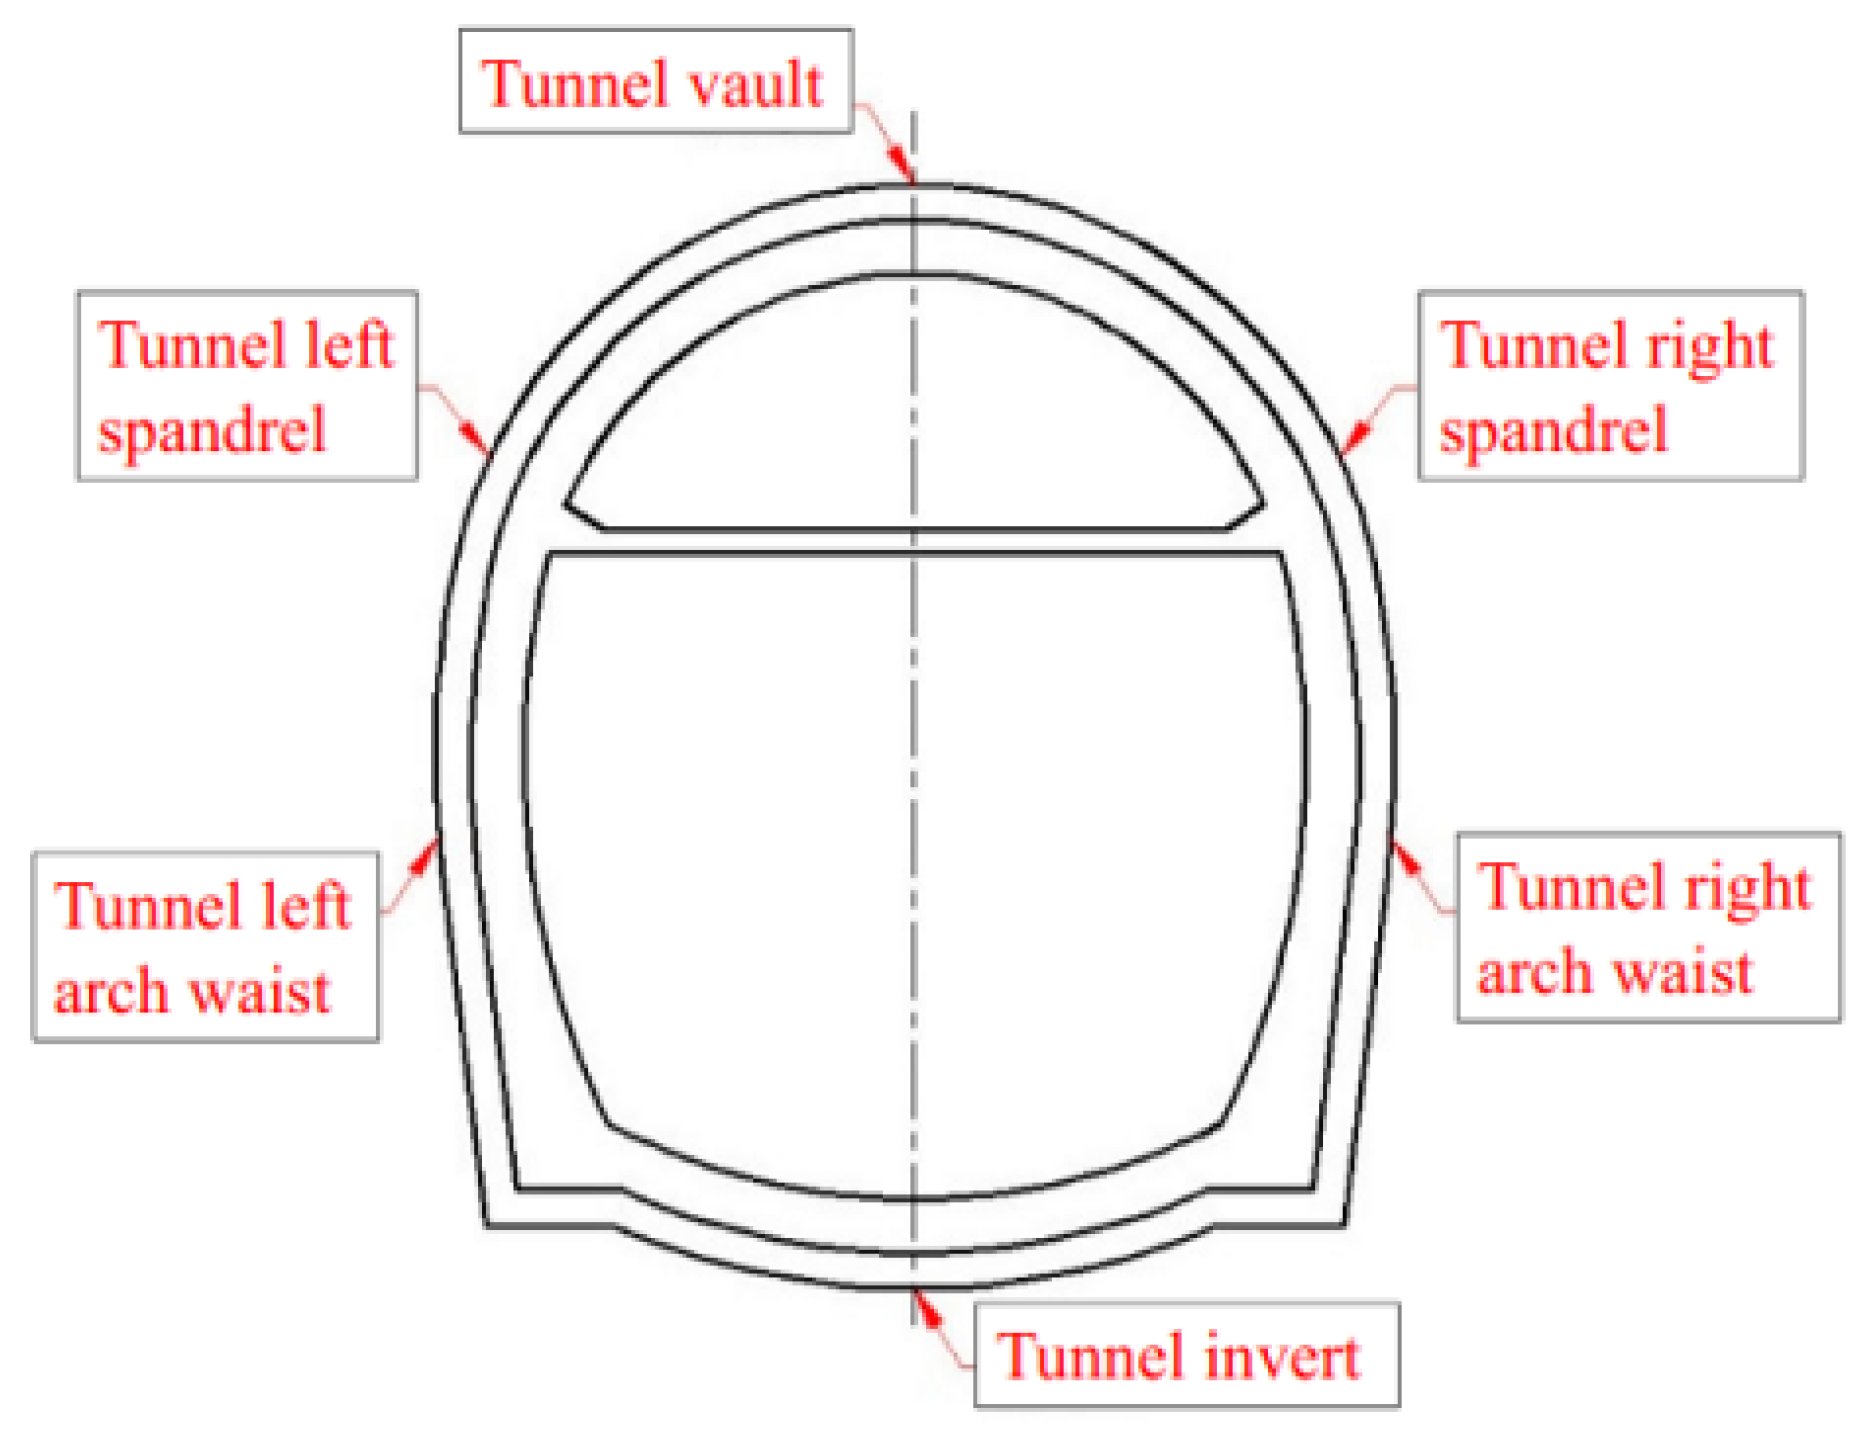
As shown in
Figure 9, the bending moment of all parts except the vault increases with the increase of the water pressure reduction coefficient. Among them, the growth rate of the arch foot and arch waist increases gradually, and the growth rate of the inverted arch decreases gradually. With the increase of reduction coefficient, the lining structure at the vault is transformed from inner tension to outer tension, and then the bending moment increases gradually. When the reduction coefficient increases from 0 to 1, the bending moment at the vault changes from 154.4 kN·m to −338.2 kN·m. The arch waist increased from 47.7 kN·m to 646.8 kN·m, increasing 12.6 times. The arch foot increased from −169.5 kN·m to −1009.9 kN·m, increasing about 5 times. The inverted arch increased from 128.3 kN·m to 349.3 kN·m, increasing 1.7 times. It can be seen that the change of reduction coefficient has the greatest impact on the bending moment at the arch waist, followed by the arch foot. Under the same reduction coefficient, the bending moment at the arch foot may be significantly greater than that at other parts.
As shown from
Figure 10, with the increase of the reduction coefficient, the axial force at each part increases linearly. Among them, the growth rate of the arch crown, arch foot and inverted arch is high, and the growth rate of the arch waist is lower than the others. The axial force at the vault increases from 555.1 kN to 3305.0 kN when the reduction coefficient increases from 0 to 1. The arch waist increased from 1002.2 kN to 3409.8 kN, increasing 2.4 times. The axial force value of the arch foot and the inverted arch is almost the same, increasing from about 1140 kN to about 4500 kN, an increase of nearly three times. Under the same reduction coefficient, the axial force at the arch foot and the inverted arch is larger, the axial force at the arch crown is the smallest, and the axial force distribution is positively correlated with the depth.
According to the relevant design documents of the tunnel, the existing reinforcement scheme of the lining is symmetrical reinforcement, and the strength grade of the main reinforcement is HRB400, which is generally based on Φ25@150 mm configuration, the arch foot is arranged according to 2 × Φ25@150 mm + Φ25@150 mm configuration. The structural safety factor calculation method refers to the Code for Design of Concrete Structures [
28]. The safety factor of the tunnel structure is calculated based on the above reinforcement scheme, combined with the environment and purpose of the tunnel, and the specification stipulates that the safety factor of the tunnel structure shall be not less than 2.0. The calculation results of the safety factor of the lining structure are shown in
Figure 11. The safety factor is defined in the Chinese tunnel design code [
23]. It is mainly controlled by the axial force and a bending moment of the structure, which belongs to the category of the concrete structure. The tunnel lining is safe when the calculated safety factor is greater than 2.0.
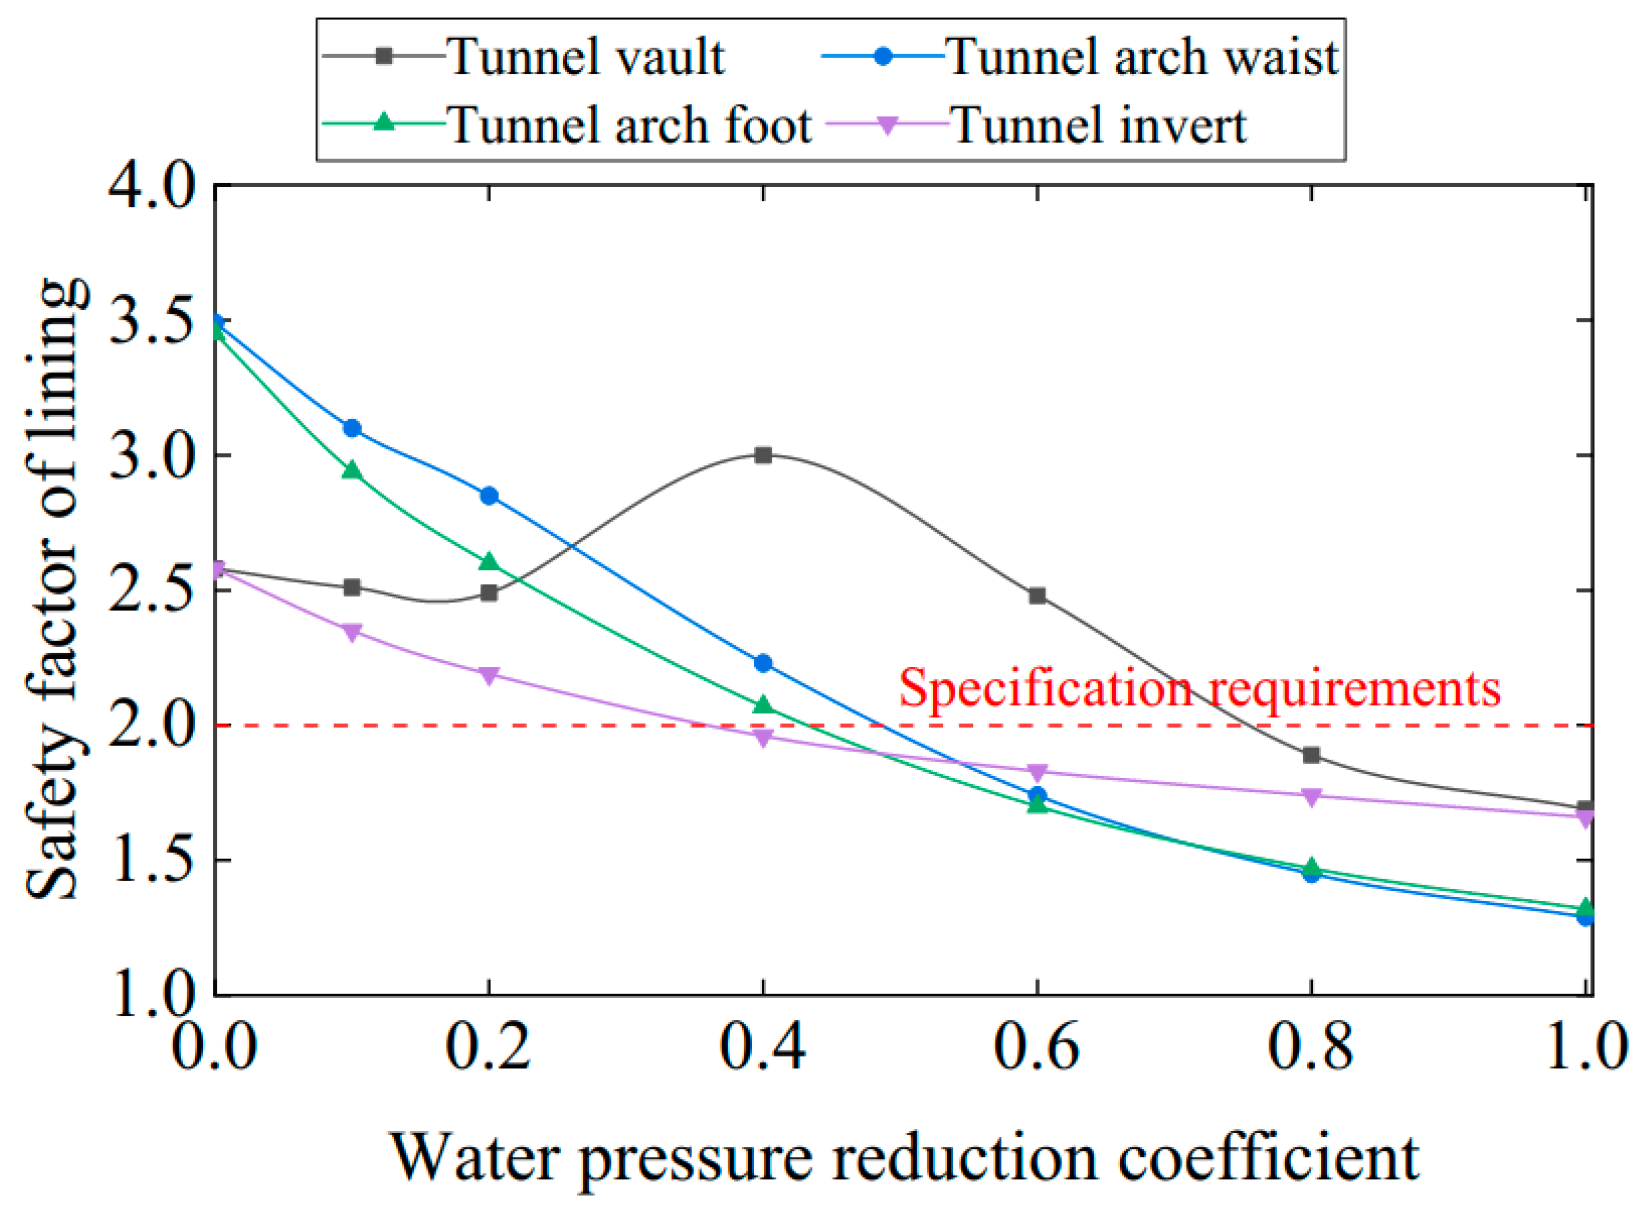
It can be seen from
Figure 11 that under the existing reinforcement scheme, with the increase of reduction coefficient, except for the temporary increase at the vault, the safety coefficient at other parts gradually decreases, and the decline rate gradually decreases. The overall safety of the lining is controlled from the inverted arch to the arch waist. Although the internal force of the arch foot is significantly greater than that of other parts, due to the strengthening of this part, the overall safety is not controlled by the arch foot. When the reduction factor is less than 0.4, the existing scheme can meet the structural safety factor’s requirement to be greater than 2. The reduction coefficient increases from 0 to 1, and the safety factor at the vault decreases from 2.58 to 1.69. The safety factor at the arch waist is reduced from 3.49 to 1.29, the safety factor at the arch foot is reduced from 3.45 to 1.32, the safety factor at the inverted arch is reduced from 2.58 to 1.66, and the overall safety factor of the lining is reduced from 2.58 to 1.29. It can be seen that if the selected water reduction coefficient is smaller than the value that should be selected, the safety coefficient of the lining may be higher than the actual situation, which is contrary to safety.


