Article

Design of Fast Acquisition System and Analysis of Geometric Feature for Highway Tunnel Lining Cracks Based on Machine Vision

1
Zhejiang Scientific Research Institute of Transport, Hangzhou 311305, China
2
Key Laboratory of Road and Bridge Detection and Maintenance Technology of Zhejiang Province, Hangzhou 311305, China
3
Department of Geotechnical Engineering, College of Civil Engineering, Tongji University, Shanghai 200092, China
4
Key Laboratory of Geotechnical and Underground Engineering, Ministry of Education, Tongji University, Shanghai 200092, China
*
Author to whom correspondence should be addressed.
Appl. Sci. 2022, 12(5), 2516; https://doi.org/10.3390/app12052516
Submission received: 8 February 2022 / Revised: 21 February 2022 / Accepted: 25 February 2022 / Published: 28 February 2022
(This article belongs to the Special Issue Tunneling and Underground Engineering: From Theories to Practices)

Abstract

:
Under the dual effects of the rapid growth of tunnel mileage and operating years, the application and research of tunnel crack identification based on machine vision are increasing with the vigorous development of machine vision. However, due to the complex environment in tunnels, it is difficult to quickly obtain tunnel lining cracks via computer visions in the tunnel. Therefore, this paper presents the design of a fast acquisition system with the geometric feature analysis for tunnel lining cracks, which has been integrated into a tunnel fast inspection vehicle with a machine vision module. Through the research on the image acquisition system of the tunnel lining, the parameter selection of the crack shooting hardware system is determined, and the fast calculation method of shooting parameters is proposed. The geometric characteristic analysis of the tunnel lining crack image is employed to calculate crack width and determine the optimal gray value of crack extraction. Field tests have been conducted in the highway tunnels in Zhejiang and Yunnan provinces in China and the result indicates that the proposed approach yields much better performance in the detection efficiency, whose time of detection is only 1%, and the number of personnel required is only 40% of the traditional pure manual method. Compared with similar systems, it also has significant advantages in crack resolution and detection speed. This research provides a means of rapid acquisition of tunnel cracks and laying a foundation for the evaluation of the service performance of the tunnel.

1. Introduction

As a mountainous country, the mountain area accounts for two-thirds of China’s land area. The tunnel, the vital part of the mountain highway, plays an active role in shortening the driving distance, reducing fuel consumption, and protecting the environment, which has further yielded social and economic benefits [1]. With the rapid increase in the length and number of tunnels, the development of tunnels in China has shifted from a construction-oriented phase to a new period when an equal emphasis is placed on construction and maintenance. More and more problems have been exposed in tunnels constructed in early years, which brought considerable challenges to the health and safe operation of the tunnels. As a result, tunnel health inspections have become increasingly important. The structural problems of tunnels are primarily presented in apparent forms, such as cracks and water leakage. Traditional tunnel safety detection methods mainly rely on manual detection, which cannot meet the requirements of detection speed, accuracy, and safety requirements. Consequently, the need for mechanized, automated, and intelligent detection methods has become more and more urgent. In recent years, the continuous development of machine vision technology has provided a means of intelligent detection on tunnel apparent diseases [2].
Scholars have carried out several kinds of research in tunnel disease using machine vision. Yu et al. in South Korea developed a mobile robot system with a line scan CCD camera and a specific light source, which can scan the tunnel lining at a travel speed of 5 km/h [3,4]. Ukai in Japan established an outline of tunnel scanner system, proposed a focus adjustment method based on the derivative of the image histogram, and used image processing technology to eliminate image fluctuations to achieve fast acquisition of tunnel lining images [5]. Gavilán et al. in Spain presented the “Tunneling” tunnel lining inspection system with six high-speed cameras and six laser sensors. It can obtain the tunnel lining image and the three-dimensional outline simultaneously. The depth direction accuracy is 0.5 mm, and the vertical and horizontal resolutions are 1 mm [6]. Toru et al. from the Japanese Pacific Consulting Company proposed the MIMM-R tunnel inspection system consisting of 20 cameras, which can operate at a speed of 50–70 km/h. When shooting at 1.5 mm pixel resolution, the system can identify cracks over 0.3 mm wide [7,8]. The TS series tunnel inspection system designed by the German Spacrtec company employs a 360° rotating scanning head to collect images of the tunnel section lining. The range of 360° can reach 100 million pixels, and the distance between adjacent survey lines can reach 2–5 mm [9]. The ATLAS70 system developed by the Paris Metro in France conducts a laser scanner to detect abnormalities on the tunnel surface. At a working distance of six meters, it has a resolution of 0.2 mm and an operating speed of 2–5 km/h, which can be applied to the health status detection of subways, highways, and railway tunnels [10]. Wang et al. developed a prototype device of a vehicle-mounted automatic detection system for tunnel linings composed of linear array CCD cameras and LED light sources. Through the experiment of the crack acquisition model, the influence rules of the detection distance, light source illumination, effective pixels, and detection speed on the automatic detection performance are established [11]. Tang et al. designed a 360° panoramic camera composed of a camera and a hyperboloid catadioptric mirror. Fifteen LED light sources are used to fill in the light for tunnel lining image acquisition, which can obtain the tunnel lining panorama at one time. Because of catadioptric technology, the image clarity is the same in any region, which does not need to focus anymore [12]. The tunnel inspection vehicle TFS [13] developed by Wuhan ZOYON Company and the tunnel inspection vehicle TDV-H2000 [14] of Shanghai TJGEO Technology Company both carry out mobile monitoring in the tunnel by integrating cameras and laser scanning systems on the vehicle, whose crack detection accuracy can reach 0.2 mm. However, there is no introduction to its imaging system’s selection, parameter calculation method, or image characteristics. Liu et al. established the optimization model of the multi-camera installation center and the single-camera installation position, which gave the optimal design results of the installation parameters of the vision acquisition system. Three line scan cameras with 4 K resolution are integrated on the Stewart platform with rotation and vibration reduction functions, which can achieve mm-level resolution in the tunnel [15,16,17]. Huang et al. developed an MTI-100 tunnel inspection vehicle for subway tunnel inspection. It consists of three systems: image acquisition system, control system, and moving control system. Through human push, the tunnel lining image acquisition can be carried out at a speed of 3–5 km per hour in the subway tunnel. The system consists of six line scan cameras with a resolution of 0.3 mm/pixel. Since the acquisition is carried out in a circular shield tunnel with a relatively fixed size, it is not necessary to adjust the shooting parameters frequently [18]. Bendris et al. proposed an aerial solution for visual inspection of the tunnel. Four vision cameras and one thermal imager are installed on the DJI Matrice 100 quadrotor, and the flight speed can reach 2 m/s. At a shooting distance of two meters, the minimum pixel resolution can reach 0.86 mm/pixel. The solution using aircraft can be used in subways and road tunnels [19]. The existing research mainly focuses on developing the hardware of the lining image shooting system, the integrated application of the system, and the comparison of the detection efficiency. However, there is little research on the calculation of shooting parameters. Most systems require manual adjustment of shooting parameters during the detection process [20]. On the one hand, the operation time of the detection system is increased, and on the other hand, operators have to adjust parameters in the dangerous environment of on-service tunnels for a long time, which has a great negative impact on the imaging quality and shooting efficiency. Furthermore, the analysis of the obtained crack images is also very limited, which makes it difficult to extract information such as crack width without the aid of auxiliary equipment, e.g., calibration plates. Our main contributions can be summarized as follows: Firstly, by studying the image acquisition system of tunnel lining cracks, the hardware system selection is formed, and the calculation methods of three parameters are established. Then, the crack characteristics of tunnel lining images are analyzed, and the crack width extraction model and the optimal gray value for crack extraction are established. Finally, the tunnel inspection vehicle is developed, and compared with the complete manual operation, the inspection speed is significantly improved, and less labor is needed.
This paper proposes a technology to address these problems. In chapters two and three, the hardware development of the tunnel detection system is carried out, and the research on the selection of the hardware system of the lining shooting system and the calculation method of shooting parameters are carried out. In chapter four, the characteristics of the tunnel lining crack image are analyzed, and the crack width extraction method and the optimal background gray value are proposed. In chapters five and six, a verification test is carried out in a working tunnel, and the efficiency and cost of the proposed algorithm are compared with other detection methods.

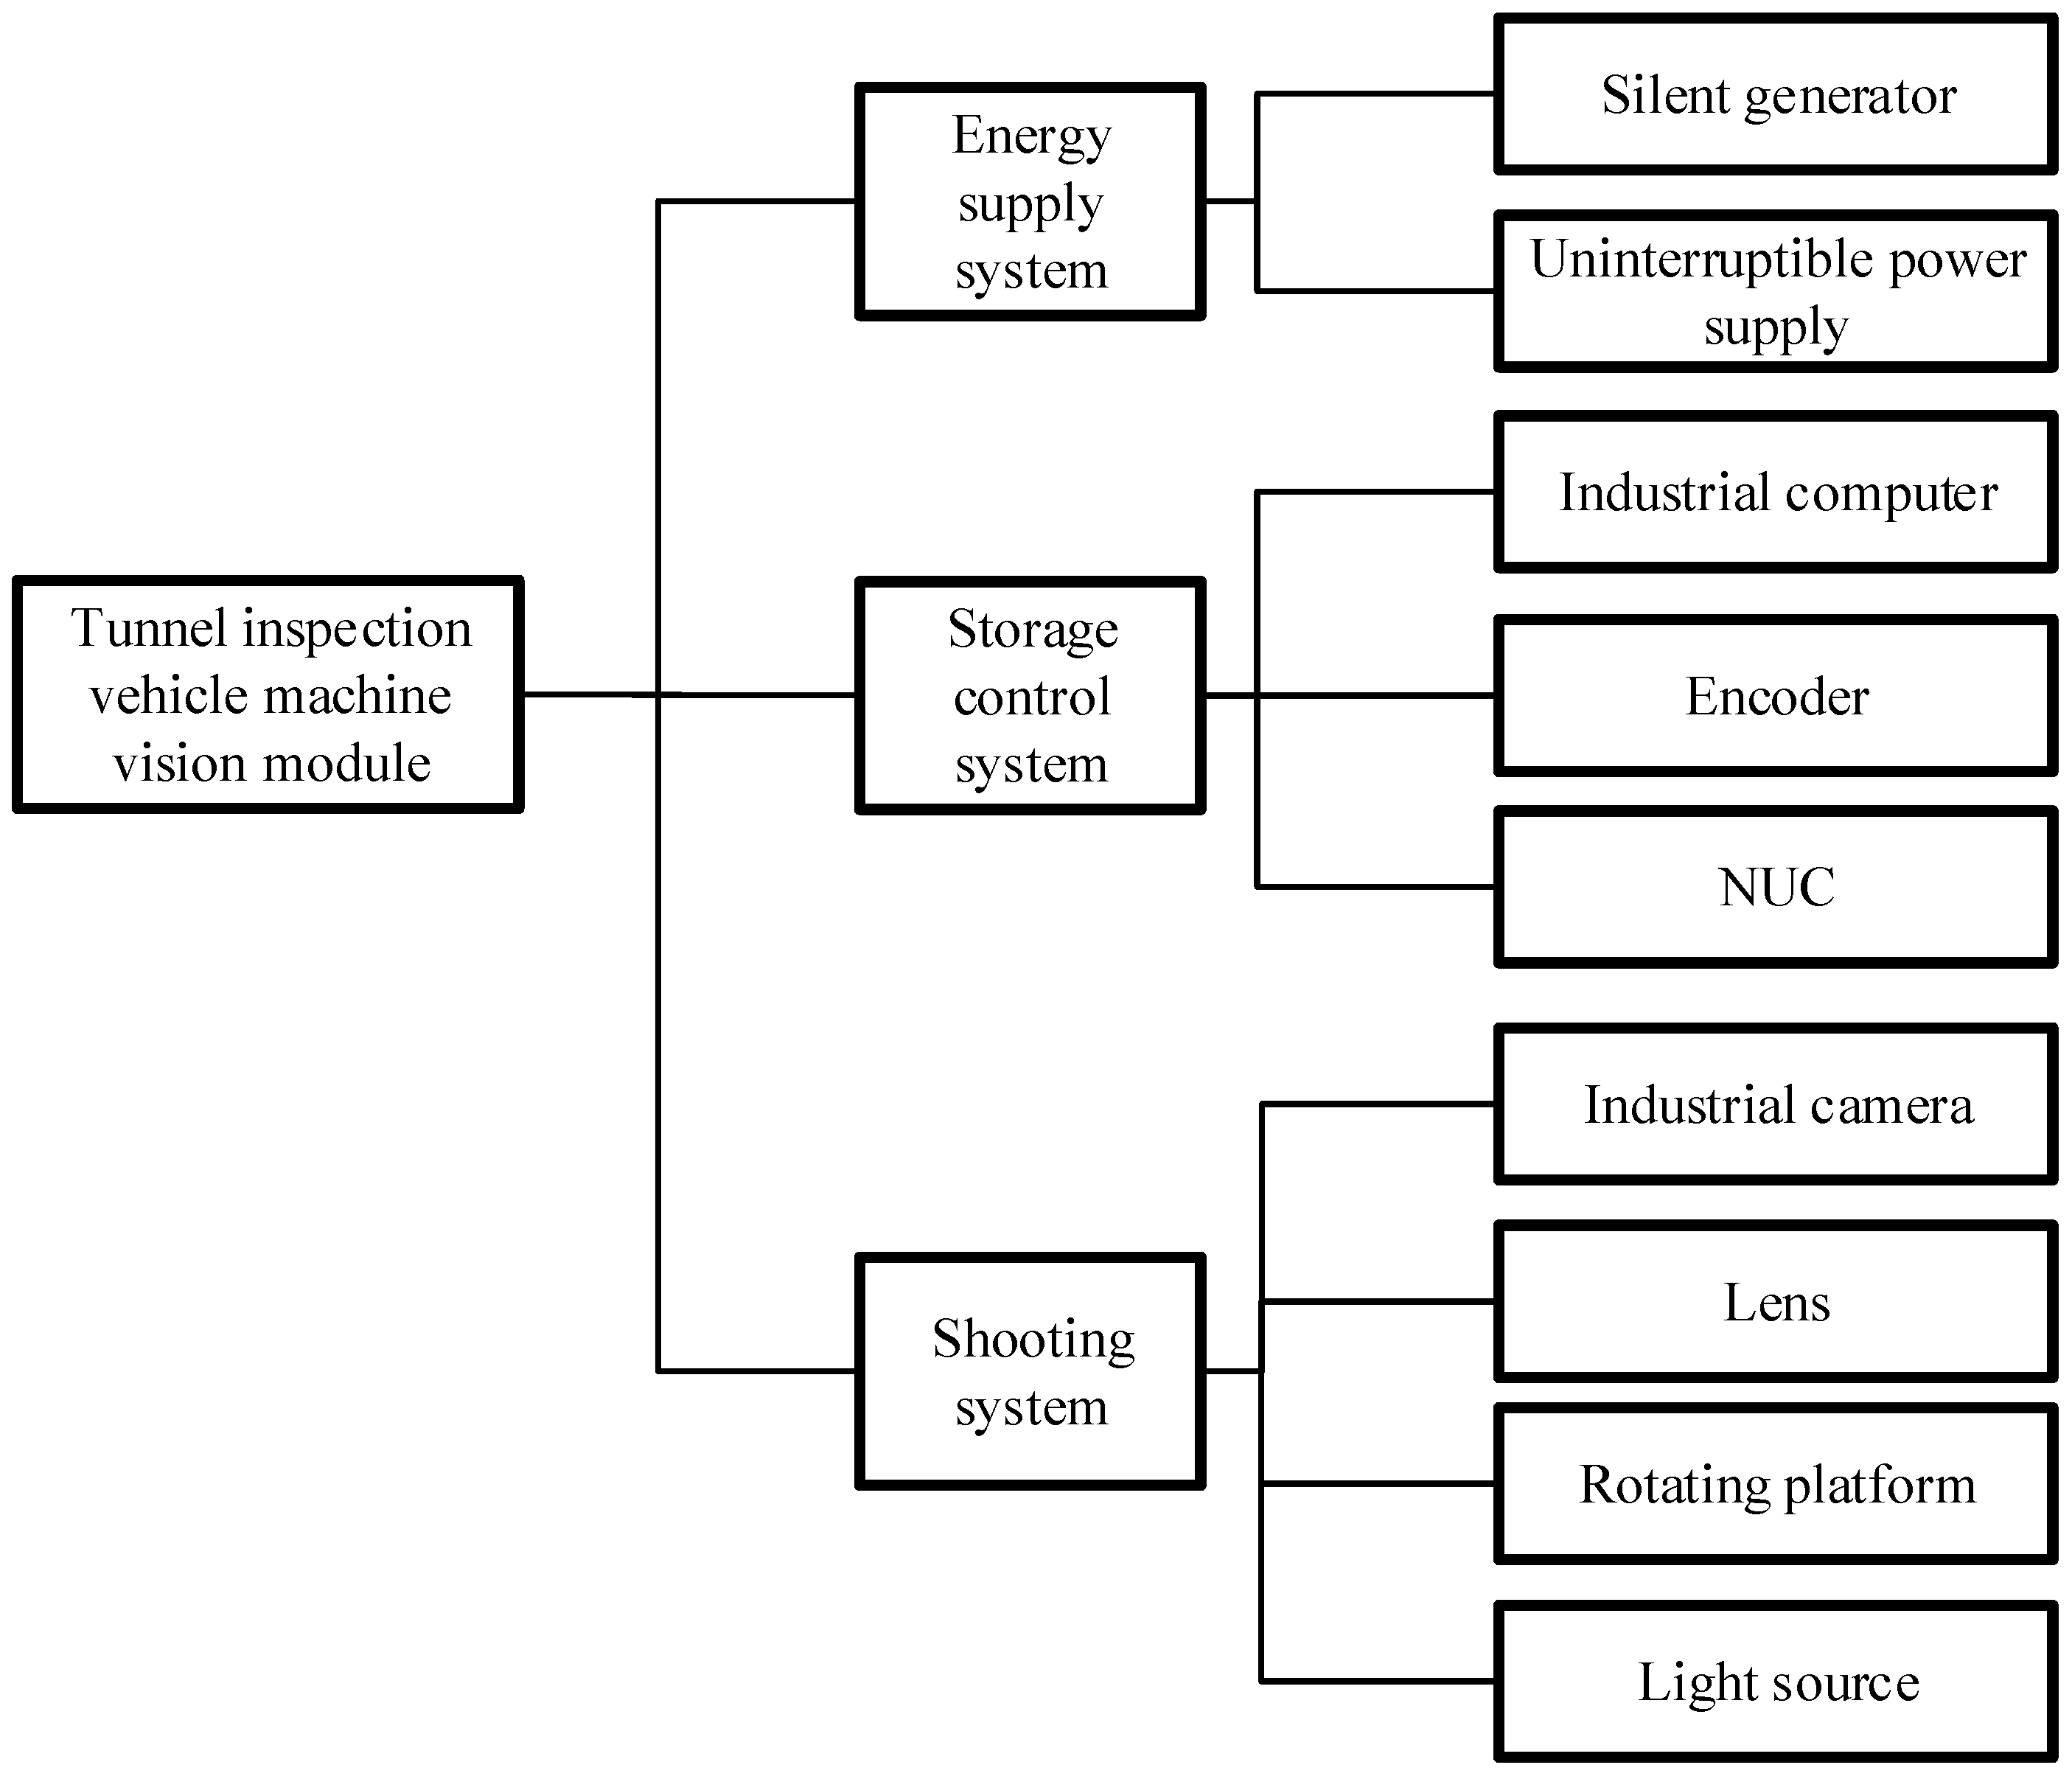
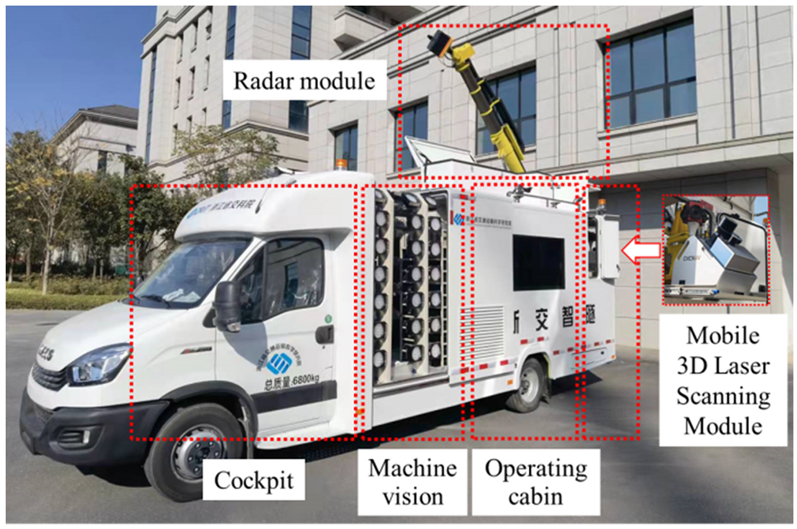
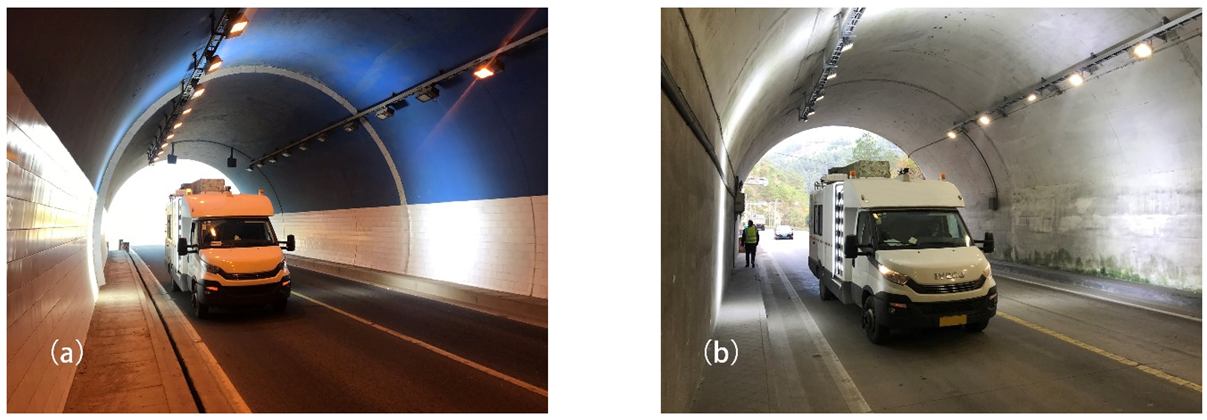
2. Development of Tunnel Image Fast Acquisition System

To realize the rapid acquisition of tunnel lining crack images, a fast acquisition system of tunnel lining images is developed. As shown in Figure 1, the machine vision module is integrated into the vehicle chassis so that the full-section images of the tunnel lining can be quickly collected in a moving state. As shown in Figure 2, the machine vision module of the tunnel inspection vehicle consists of the energy supply system, storage control system, and shooting system.
The energy supply system consists of a silent generator and an uninterruptible power supply equipped with battery packs. The UPS battery pack is responsible for powering the energy supply and storage control systems. The silent generator can directly supply power for the compensation light source and charge the UPS battery pack. The control storage module comprises an industrial computer, an encoder, and five Next Unit of Computings. The industrial computer is responsible for calculating and setting the rotating platform, lens, and camera parameters. In addition, the shooting effect can be previewed in the industrial computer. Due to the large number of cameras and the high acquisition frame rate, the amount of image data that need to be stored in unit time is vast. The method of distributed acquisition and storage by five Next Unit of Computings is adopted to ensure the transmission speed and prevent frame loss. Each mini-computer is responsible for the storage of four or five cameras. After the acquisition is completed, the images of the tunnel lining are merged through the mobile storage device.
As shown in Figure 3, there are three columns and twenty rows, a total of sixty groups of compensation light sources, and nineteen groups of shooting systems composed of cameras, lenses, and rotating platforms in the shooting system. The compensation light source is the 120 W LED light source with constant illumination. The shooting system is the core of the tunnel inspection vehicle machine vision module. The rationality of its hardware selection is the basis for the effect of the lining crack image shooting system. The calculation method of shooting parameters plays a decisive role in the shooting effect and detection efficiency. Therefore, they will be introduced in the next chapter.

3. Research on Image Acquisition System of Lining Cracks

To choose a reasonable shooting system hardware, the camera resolution, shooting range, and focal length will be studied for utilizing experiments and theoretical analysis. In addition, the parameter calculation method of the image shooting system will be analyzed to realize the rapid acquisition of tunnel lining images.

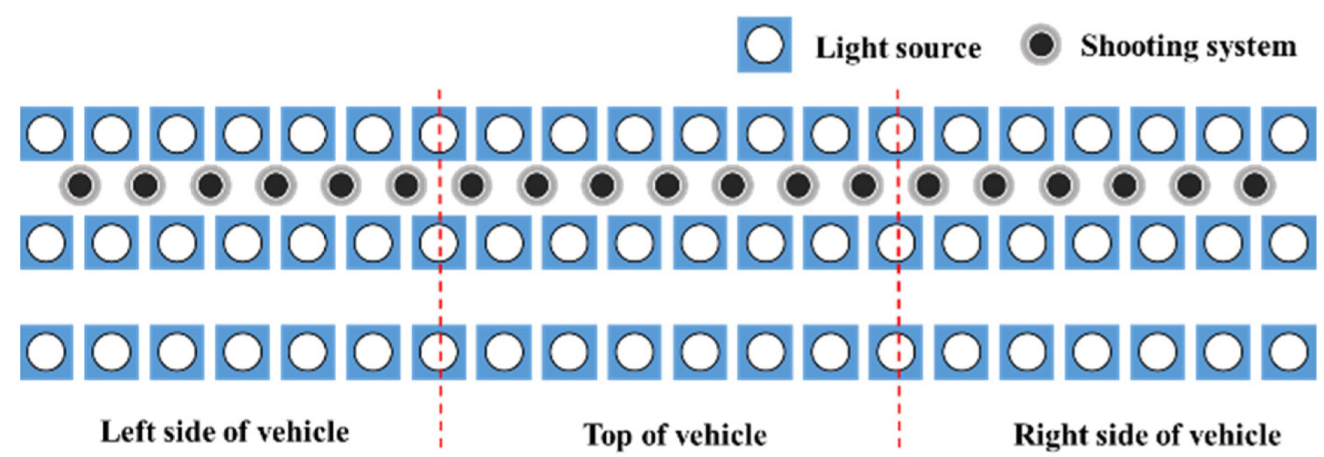
3.1. Shooting System Hardware Analysis

3.1.1. Shooting System Selection Subsubsection

When the camera is shooting, there is a difference in the amount of light received by the subject. Consequently, the gray levels of each pixel on the image will be different because of the nonuniformity of charge accumulation on the sensors. When the width of the crack is less than one pixel on the image, it can still be distinguished by the different gray values.
To determine the camera resolution required by the shooting system, cracks were created on a concrete piece randomly, and the width of each crack was precisely measured with a crack meter. Subsequently, the camera with a resolution of 1.5 mm/pixel was used for shooting. The relationship between the minimum resolution and the recognition width was analyzed by analyzing the captured images. As illustrated in Figure 4, the cracks with a width of 0.1 mm can be distinguished with 1.5 mm/pixel [20].
Analysis of the test piece shows that the camera resolution can be 15 times the minimum crack width identification accuracy when identifying concrete cracks. Considering the usual influencing factors such as insufficient light and dust in the tunnel, the conversion coefficient between the camera resolution and the minimum recognition accuracy of this system is selected as ten times. Consequently, the resolution of 1.0 mm/pixel is used to identify pixels with cracks of 0.10 mm wide.

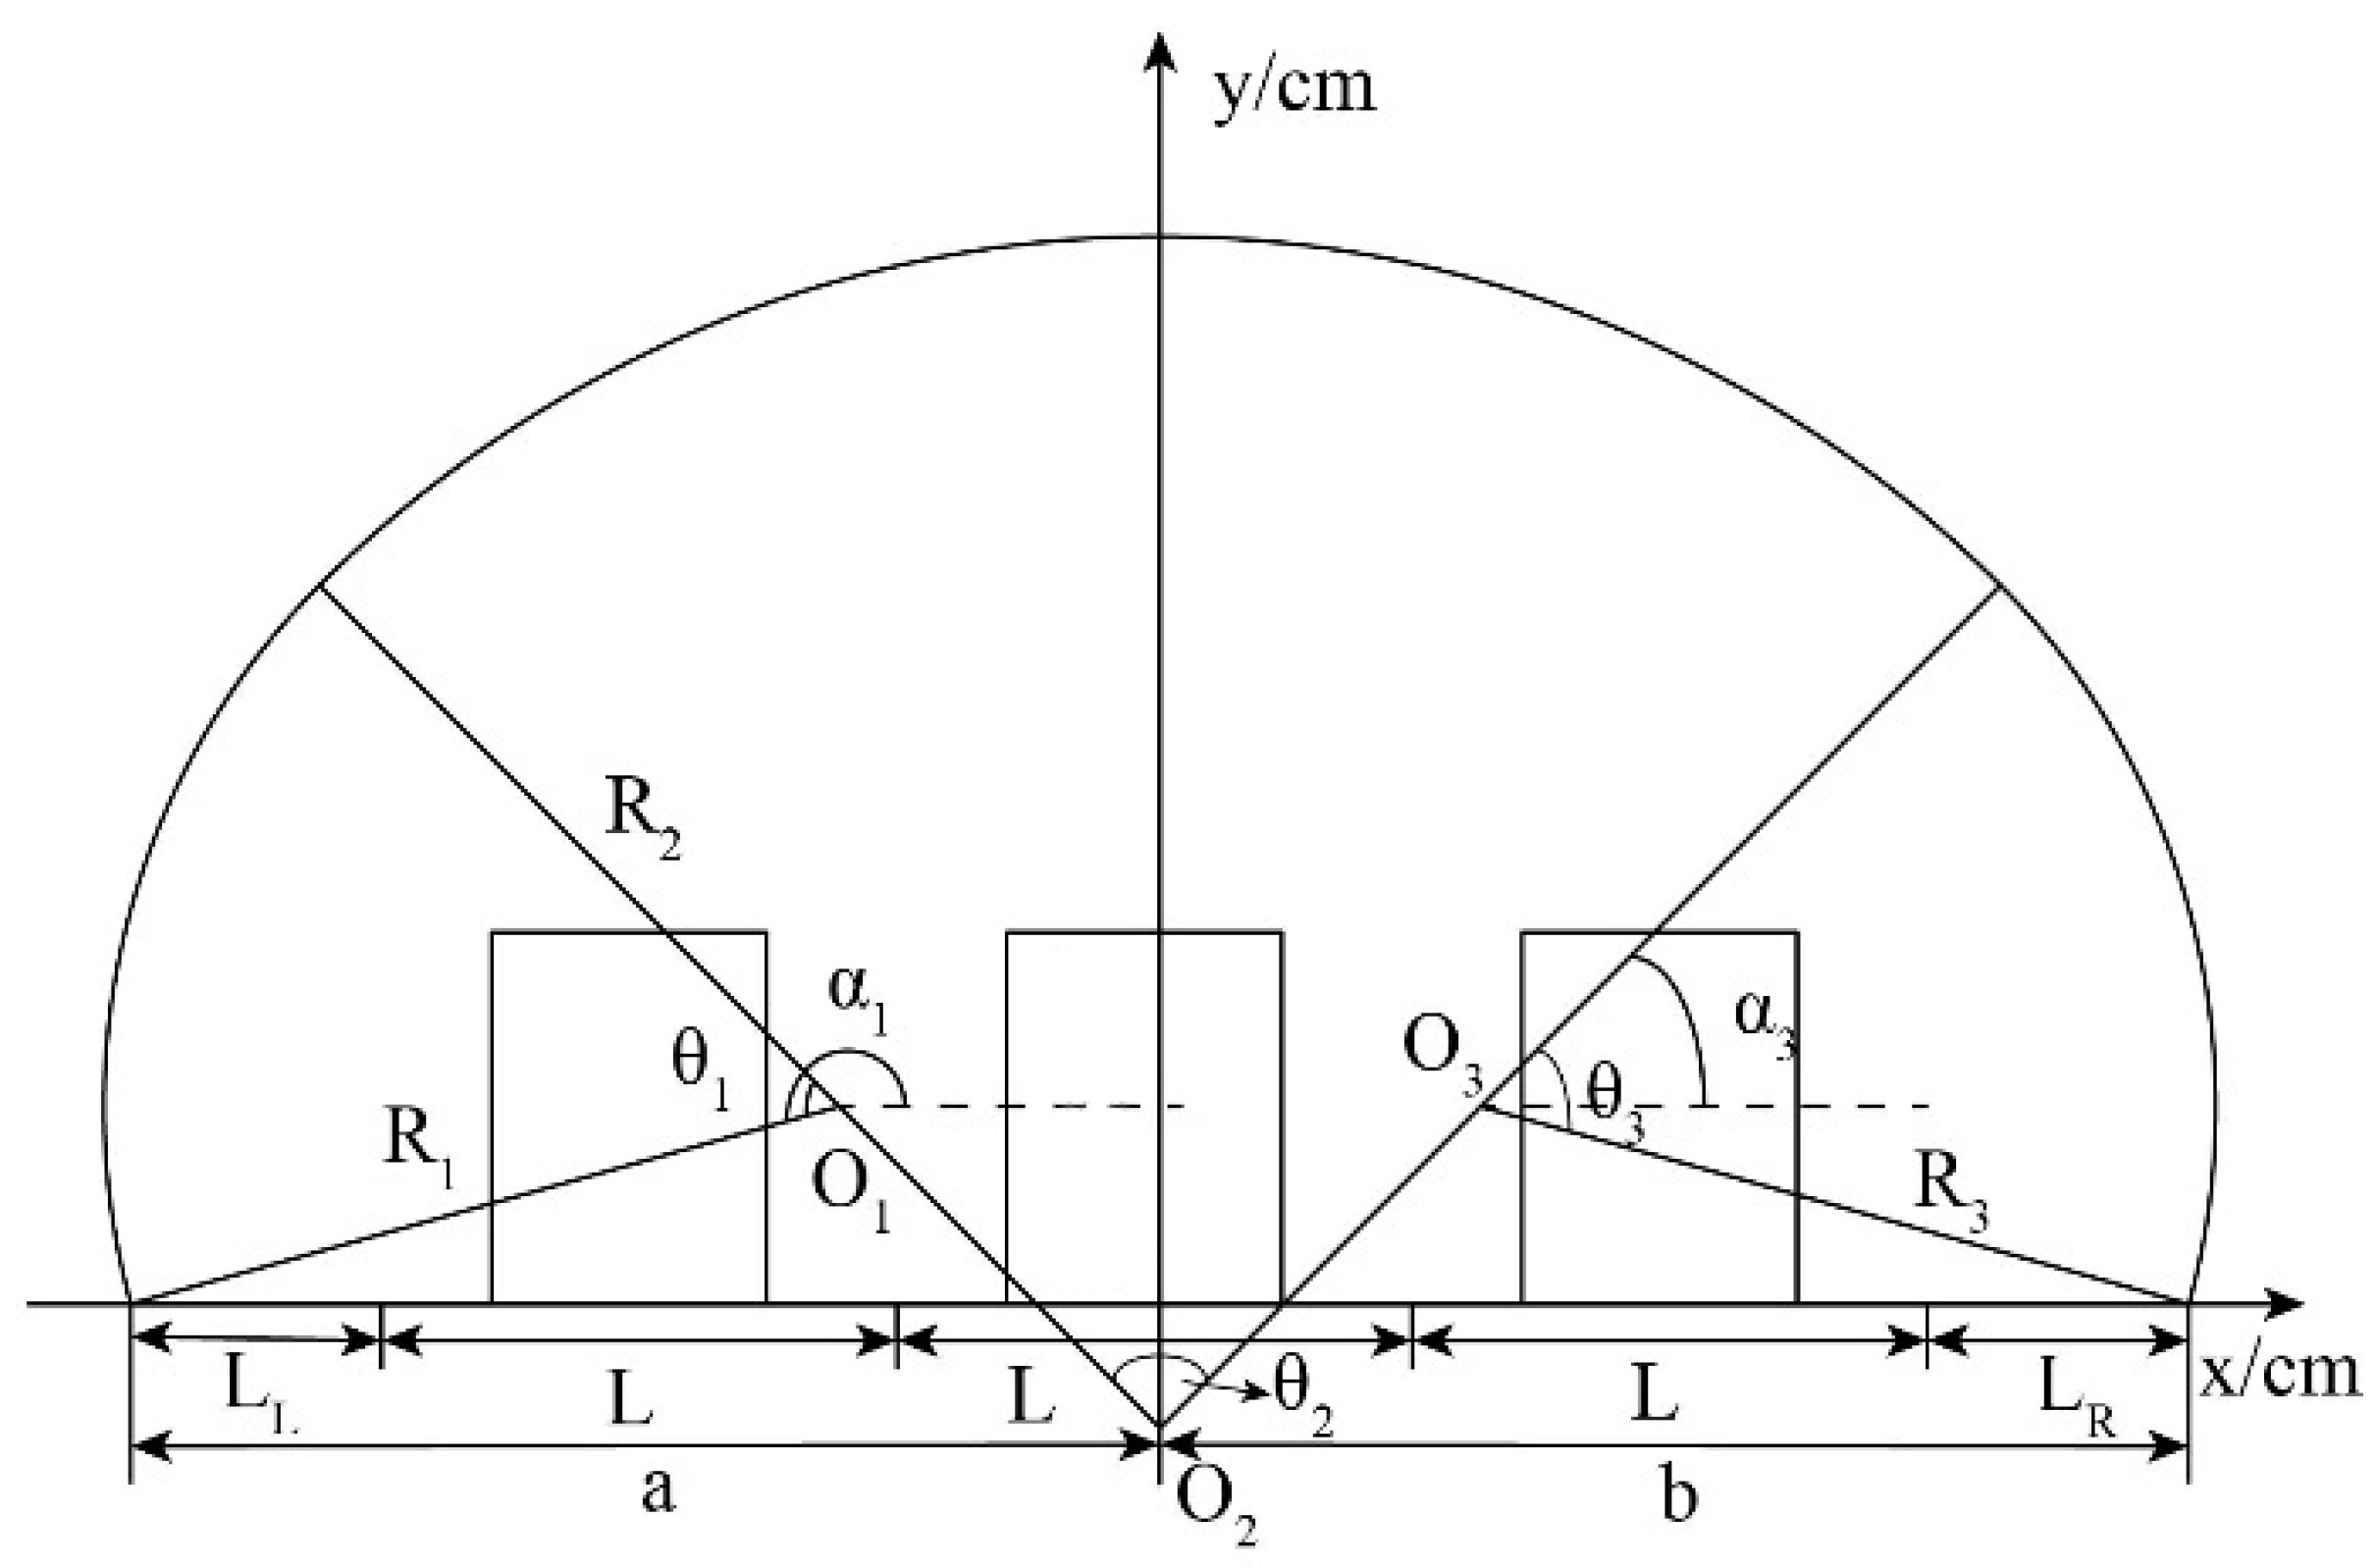
3.1.2. Shooting Range Calculation

For images of the tunnel lining, stitching is required to form a panoramic distribution map of the tunnel for display. Therefore, the actual size of a single picture should not be too small. Concerning the actual detection experience in the tunnel in the past, and considering the overlap area required for splicing, the side length of the field of view to be selected is about 1.0 m, then the minimum number of pixels required for one side of the camera n can be calculated by Equation (1):
n = r p = 1.0 × 1000 1.0 = 1000
where n is the minimum number of pixels, r is the side length of shoot range, and p is the pixel resolution.
After considering the cost and camera sensor model, the Baumer TXG13 area scan camera with a pixel size of 1392 × 1040 is finally selected, corresponding to the actual shooting range 1.392 m × 1.04 m.

3.1.3. Focal Length Calculation

When the camera is imaging, the focal length of the lens determines the actual shooting size. The focal length of the required lens is usually calculated by the field of view, working distance, and camera chip size according to Equation (2):
l s = d f
where l is the length of view, s is the size of the camera sensor, d is the working distance of the camera, and f is the focal length.
When applied in different tunnels, the corresponding working distances of the cameras are different. Therefore, to obtain images with a fixed shooting range, a zoom camera needs to be used to capture images of the tunnel lining.
Through the statistics of common tunnel width, lane width, and vehicle width, the working distance of the camera in the tunnel is 2.0~7.0 m. According to Equations (3) and (4), the minimum focal length is 9.30 mm, and the maximum is 32.54 mm. Therefore, the H6Z0812M electric zoom lens with a zoom range of 8~48 mm was finally selected.
f min = d min × s l = 2000 × 6.47 1392 = 9.30 mm
f min = d max × s l = 7000 × 6.47 1392 = 32.54 mm
where d min and d max are the maximum and minimum working distances, f min and f max are the maximum and minimum focal length.

3.2. The Method of Fast Acquisition Parameter Calculation

After determining the camera model and shooting range, the main parameters related to the shooting effect are aperture, magnification, and focus. Due to the influence of tunnel lighting conditions, tunnel detection time, internal light source conditions, tunnel lining reflectivity, etc., the aperture is difficult to preset in advance when tunnel detection is performed for the first time. Therefore, it is usually adjusted according to the specific conditions of the site. The magnification and focus parameters can be calculated according to the imaging principle or fitting test.

3.2.1. Lens Zoom

The zoom ratio adjustment is realized by adjusting the focal length of the lens. By selecting an appropriate focal length, the picture frame captured by the camera can be zoomed to the required range, and the whole section of the tunnel can be photographed. From the focal length calculation formula in Equation (2), after determining the working distance between the lens and the object, the actual size of the shooting range, and the size of the camera sensor, the focal length can be calculated according to the triangle similarity principle. The size of the camera sensor is 4.84 mm × 6.47 mm, and the actual shooting range has been determined as 1.392 m × 1.040 m in Section 3.1. Therefore, the calculation formula of the focal length is shown in Equation (5) or (6):
f = s w × d i l w = 6.47 d i 1392 = 0.0047 d i
f = s h × d i l h = 4.84 d i 1040 = 0.0047 d i
where d i is the working distance of target position i, s w and s h are the size of the camera sensor in different orientations, and l w and l h are the length of view in different directions.
Using Equation (5) or (6), the camera zoom can be calculated after the camera working distance d i is determined.

3.2.2. Camera Focus

For application scenarios and stability considerations, standard industrial cameras do not have the automatic focusing capability of digital cameras, so the focusing parameters need to be calculated separately.
This can be obtained from the imaging formula of the convex lens in Equation (7). When the focal length and the object distance are determined, the image distance (the distance between the camera sensor and the optical center) can be calculated. The image captured by the camera is clearest when the camera sensor is in the image plane at the distance v from the optical center of the lens.
1 u + 1 v = 1 f
where f is the focal length, u is the object distance, and v is the image distance.
Therefore, it is planned to establish the mapping relationship between the focus and the object distance u and the focal length f when shooting the clearest image from imaging experiments. However, the focal length is adjusted by the zoom in the imaging system. This experiment will fit the focus of the clear image to the object distance u and the zoom.
After determining the zoom and the object distance u, the image captured by the camera is observed while fine-tuning the focal length, and when the clearest image appears, the focal length is recorded at this time. Then, the above operations are repeated after adjusting the object distance u and the corresponding zoom. To ensure the applicability of the fitted data, the zoom will be fine-tuned at different object distances to establish the binary correspondence between the focus and the zoom, the object distance u.
The recorded data perform binary fitting to establish the functional relationship between focus, object distance u, and focal length zoom when the clear image is formed. The test process is as follows:
Object distance calculation: According to Section 3.1.3, the common working distance of the camera is 2.0–7.0 m.
Determination of focal length zoom: Round the calculated working distance of the camera to an integer and calculate the corresponding zoom of the focal length. Furthermore, adjust it respectively after rounding to expand the scope of application. There are 18 sets of data in total, as listed in Table 1.
According to the determined parameters, conduct an experiment to determine the focus corresponding to the clear image under each group of object distances and focal lengths.
Take the focus corresponding to the clear image as the dependent variable, the object distance u, and the focal length zoom as the independent variables, and perform binary fitting to establish the corresponding functional relationship.
By adjusting the focus under the object distance and zoom of each group, when the edge of the crack is the sharpest in the image of the calibration plate, record the focus when the image of the camera is clear, as shown in Table 2.
Using the method of curve fitting, taking the object distance and zoom as independent variables X and Y, respectively, and the focus of the determined clear image as the dependent variable Z, binary fitting is performed. By comparing the mean square error, correlation coefficient, and smoothness of the fitting equations of different degrees, the binary cubic fitting equation shown in Equation (8) is finally selected, and its fitting surface is shown in Figure 5.
Z = f ( X , Y ) = 88.68 19.51 X 0.6809 Y 0.7189 X 2 + 0.5552 X Y 0.002504 Y 2 + 0.3514 X 3 0.06936 X 2 Y + 0.001301 X Y 2 + 0.0001025 Y 3
The formula fitting mean square error (RMSE) is 1.903, and the correlation coefficient (R-square) can reach 0.9701.
In many field applications, the fitting formula works well in the actual detection. Under different shooting distances, tunnel types, and tunnel sections, the focal length quickly calculated by this equation is used to set the lens parameters of the tunnel inspection vehicle, which can clearly collect crack images at each position in the full section of the tunnel. The operation efficiency of the tunnel inspection vehicle is significantly improved, which lays a foundation for the rapid analysis of the geometric characteristics of cracks and the assessment of the safety status of the tunnel structure.

3.2.3. Camera Attitude

When the inspection vehicle detects in the tunnel, due to the large tunnel cross-section, multiple cameras are required to work simultaneously to complete the full coverage of the image across the tunnel [21]. Therefore, the camera attitude control system is required to calculate the rotation angle of each camera.
In order to establish a camera angle control model, the tunnel contour is divided into several arcs according to the radius. As shown in Figure 6, the radii are R1, R2, R3, …, Rm, the corresponding center angles are θ1, θ2, θ3, …, θm, and the coordinates of each center are (Oix, Oiy). The developed control model complies with the following regulations: The direction whereby the center of the circle points to the arc is the positive direction of the radius; the azimuth angle corresponding to the starting radius of each arc is αi, the LL and LR are the distances from the left and right walls of the tunnel to the carriageway, the width of the lane is L, and n is the number of lanes.
The corresponding length of each arc of the tunnel contour is Riθi, then the cumulative length Si of the ith segment arc in front of the tunnel is
S i = i = 1 i R i θ i
For the direct shot point Ai, the accumulated arc length si of the tunnel profile on its left is
s i = 69.5 + 130 ( i 1 ) + s × ( d 1 )
where d is the lane number of the detection system located.
When Sa−1 ≤ si ≤ Sa, the direct point Ai is located in the a-th arc segment, and its horizontal and vertical coordinates can be calculated as
A i x = O a x + R a × cos ( α a s i s a 1 R a )
A i y = O a y + R a × sin ( α a s i s a 1 R a )
Combined with the coordinates (Bix, Biy) of the working camera corresponding to the direct shot point, the cosine of the camera position angle can be obtained as
cos β i = A i x B i x ( A i x B i x ) 2 + ( A i y B i y ) 2
Then, using the arccosine function, the shooting angle of each camera can be calculated.
If AiyBiy ≥ 0:
β i = cos 1 ( cos β i ) ,   cos 1 ( cos β i ) [ 0 , π ]
If AiyBiy < 0:
β i = 2 π cos 1 ( cos β i ) ,   cos 1 ( cos β i ) [ 0 , π ]
Through the Matlab program, the above calculation process has been realized in a programmed way to realize the establishment of the camera attitude control model.

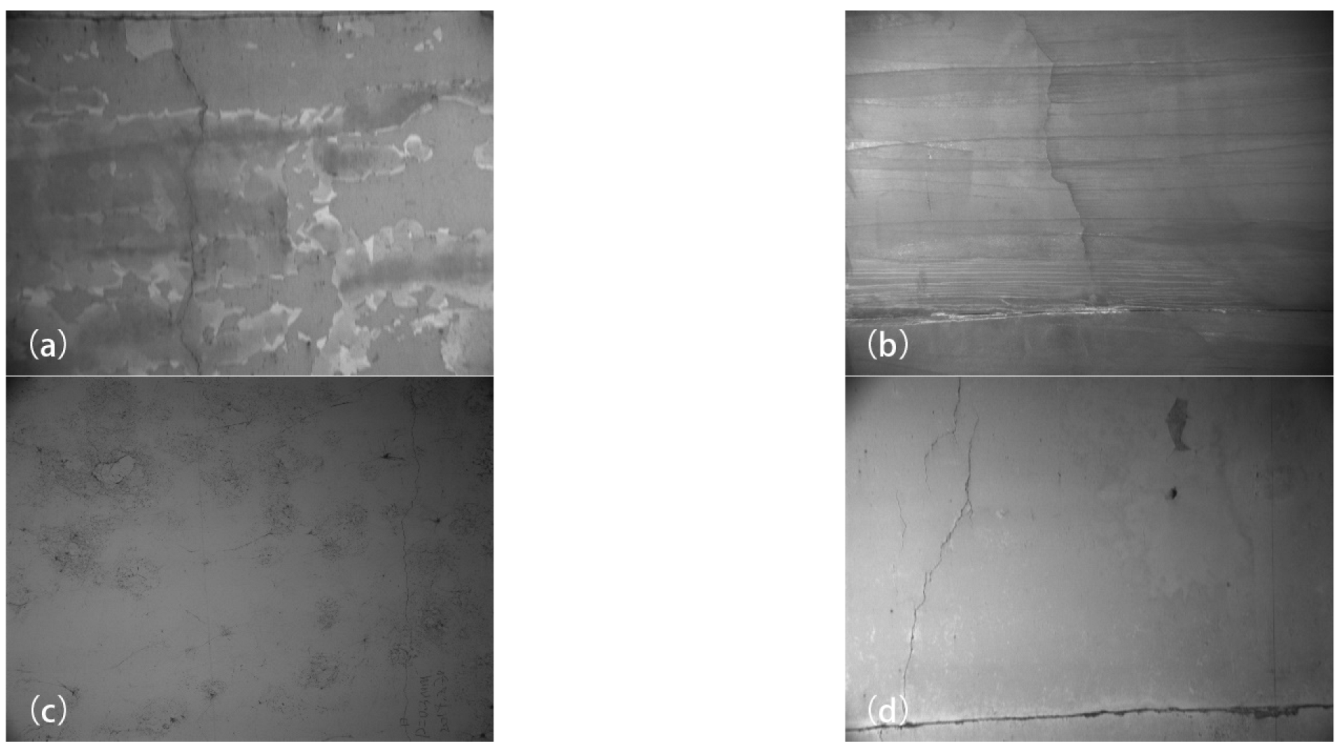
4. Analysis of Crack Characteristics in Tunnel Lining Images

Parameters such as the length and width of cracks in the tunnel are important indicators for the assessment of the safety state of the tunnel structure. As a long and narrow structure, the extraction of the width of cracks is much more difficult than the extraction of lengths. In order to ensure that the shooting results of the lining crack acquisition system can extract the crack width accurately, the crack images of different widths are studied. By establishing the crack width model, the accurate extraction of crack width is realized. In addition, by analyzing the contrast between crack pixels and the background in images with different gray values, the optimal gray value of the image suitable for crack extraction is determined.

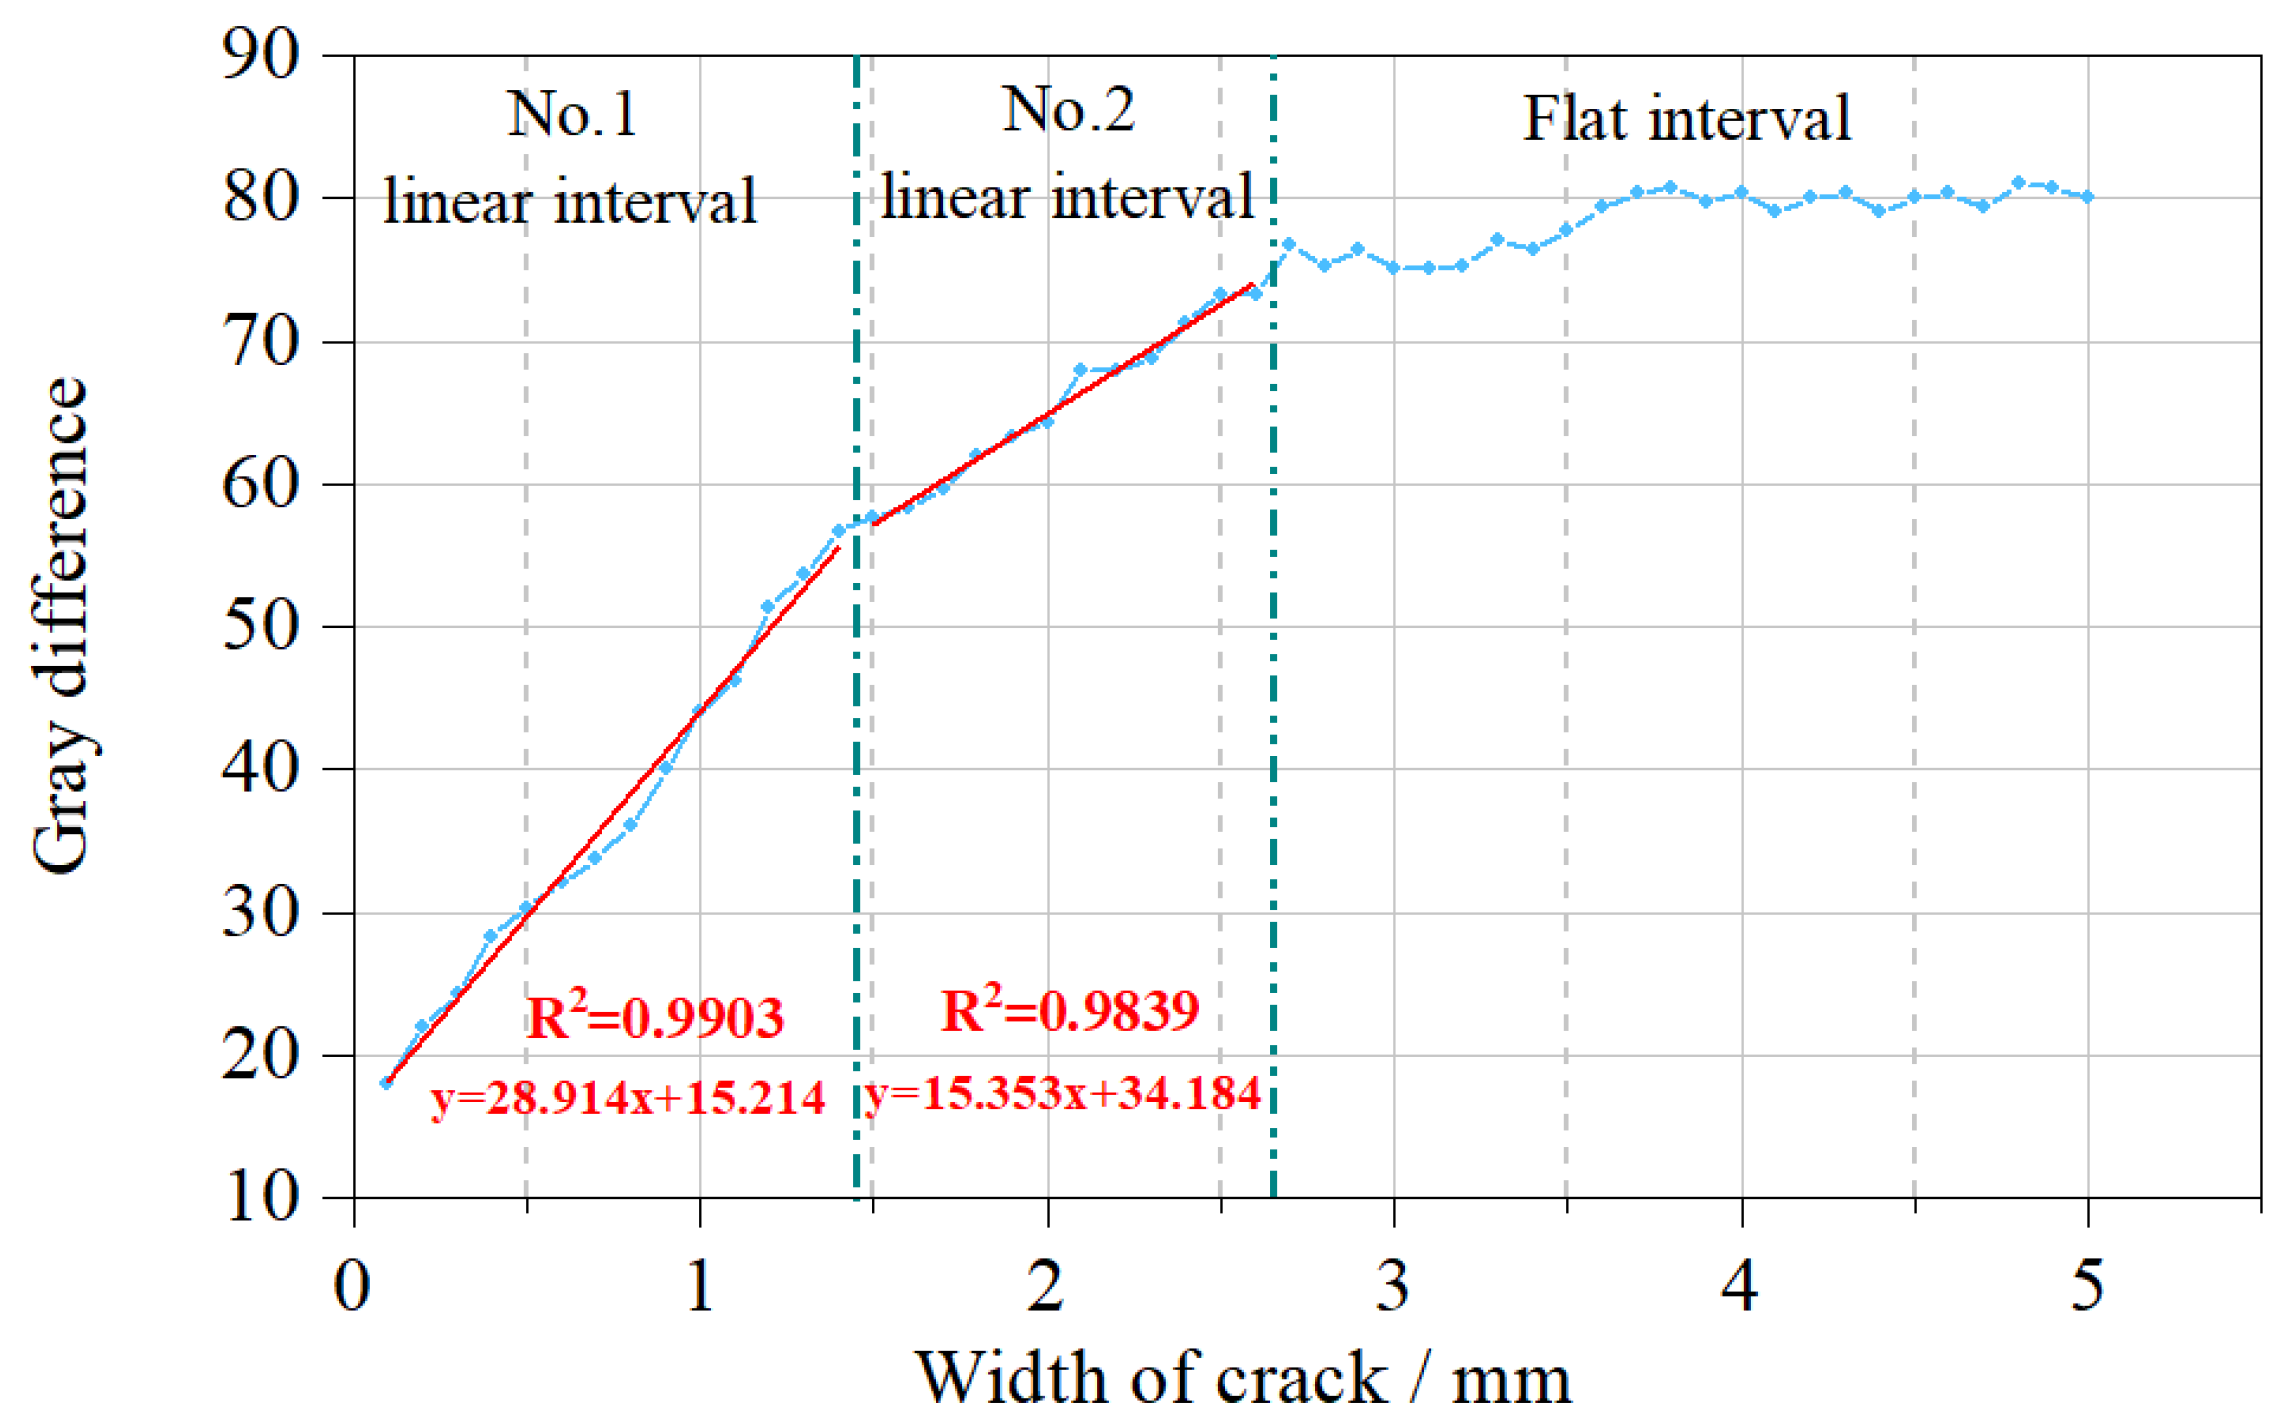
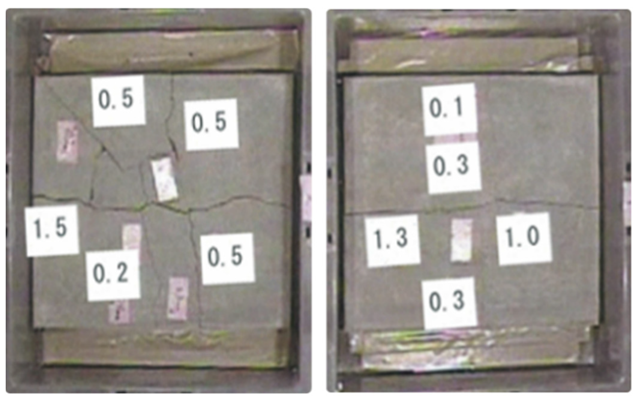
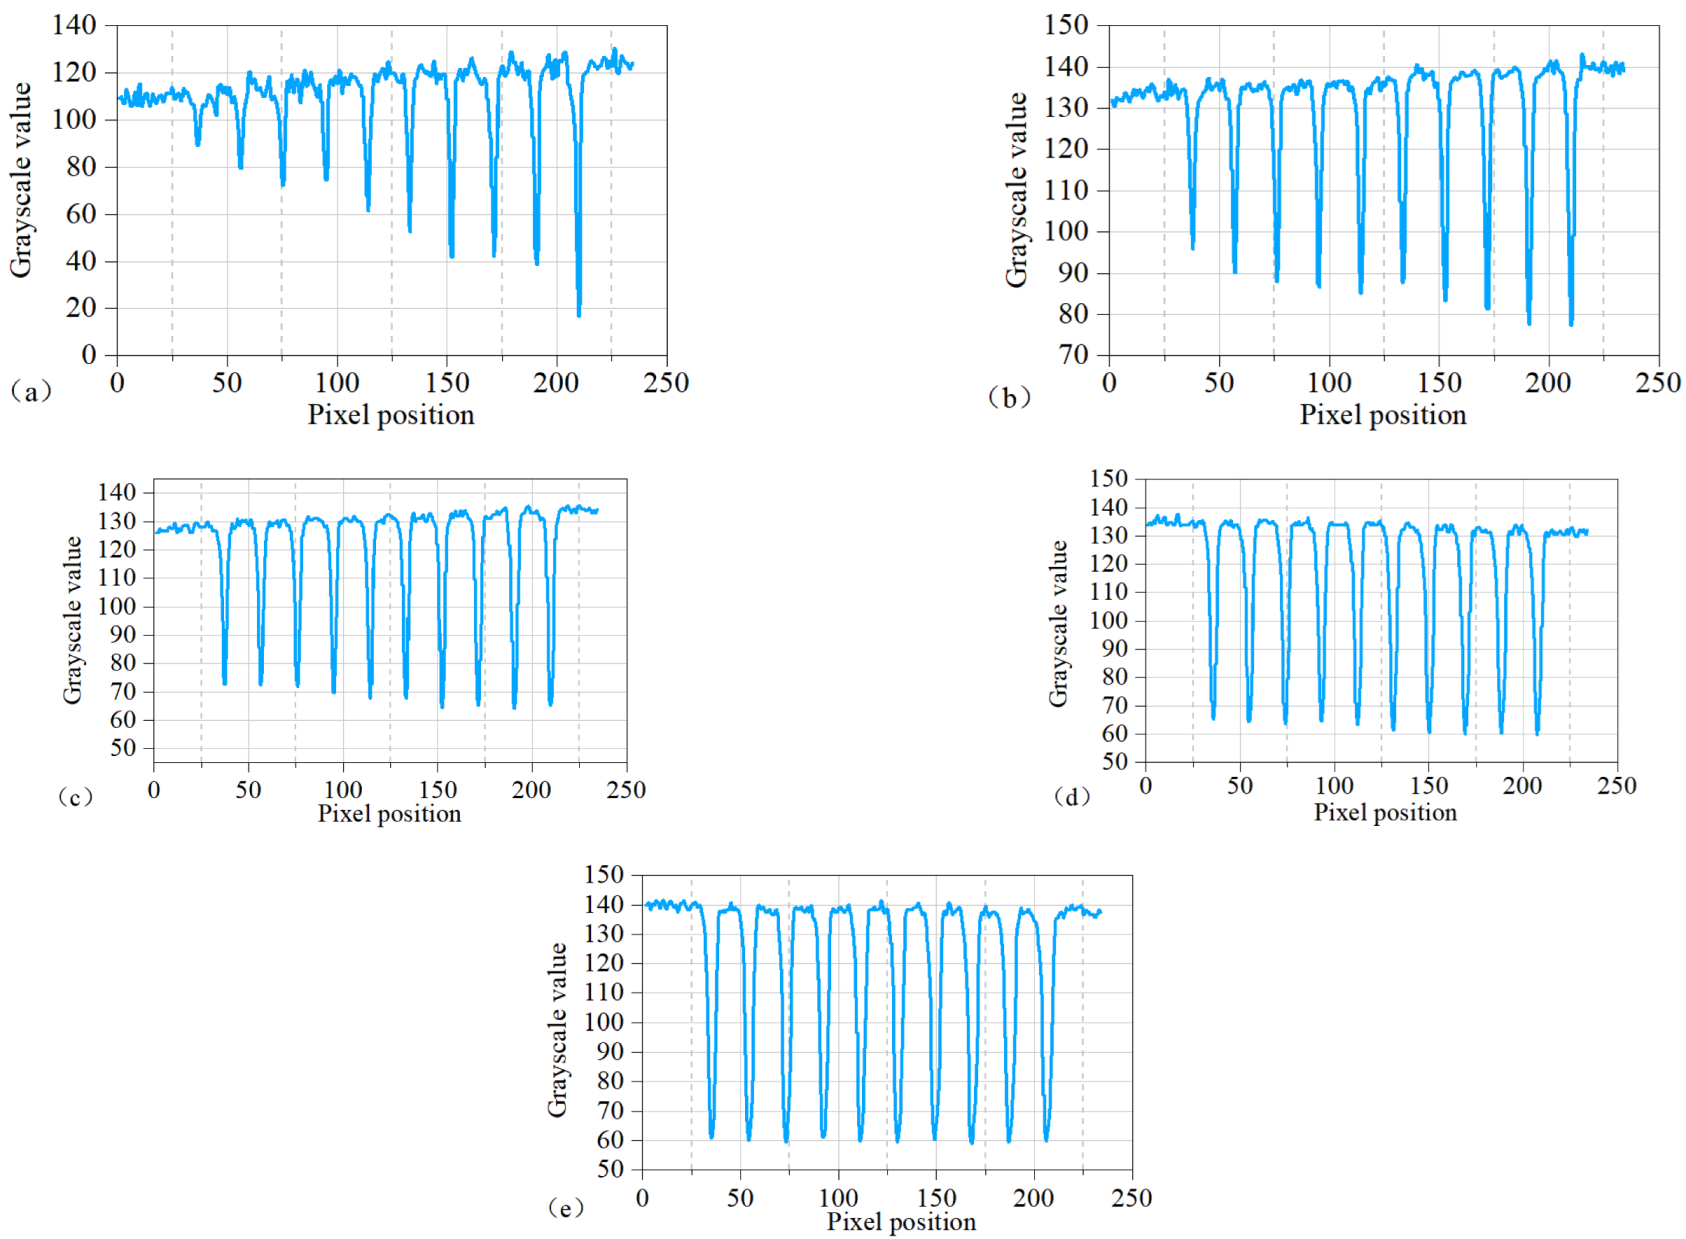
4.1. Crack Width Extraction Model

In order to simulate the different widths of the cracks on the surface of the actual tunnel lining, the image acquisition targets of this experiment are the crack line series and the checkerboard, which are fixed on the white wall on the A1 drawing. The distinguishable range of the crack line series is 0.1~5.0 mm. Considering that longitudinal cracks (in the direction of the tunnel axis) generally have a significant impact on the structural safety performance in tunnel structures, simulated cracks with different widths are presented in the form of longitudinal cracks. The checkerboard is an array of black and white grids where the actual size of each grid is 20 mm × 20 mm, which is used for the focus of the area scan camera.
The above drawings with cracks of different widths are photographed by the selected photographing system, and then the grayscale characteristics of the cracks with different widths in the photographed images are analyzed to establish a crack width model based on grayscale analysis.
As shown in Figure 3, the cracks in the first series, that is, the cracks with a width of 0.1 mm~1.0 mm, show a significant difference in brightness, but the width difference is not apparent. For cracks with a width greater than 3.0 mm, the color density remains basically unchanged, but a relatively noticeable width difference can be observed. In each crack series, three lines are drawn along the vertical crack direction, and the extraction positions are shown in Figure 7.
As shown in Figure 8, three extraction points on each crack are extracted to obtain the average value of the gray value, and the gray distribution map of each crack in the width direction is obtained. The results show that when the crack width is in the range of 0.1~2.0 mm, the gray value of the crack increases linearly, and the openings on both sides of the wave trough remain basically unchanged. When the crack width exceeds 2.0 mm, the gray value of the crack gradually stabilizes, but the opening of the wave trough gradually becomes larger, indicating that the number of pixels of the crack gradually increases.
In order to establish the mapping relationship between the crack width and the gray value, three points are taken on each crack width, and the difference between the average gray value and the background gray value at the three points is calculated. As shown in Figure 9, the relationship with crack width is plotted in the same figure.
The change of the image curve can be divided into three stages:
In the interval of the crack width from 0.1 mm to 1.4 mm, the gray difference of the crack shows a linear change, which is defined as the No.1 linear interval.
In the interval of 1.5 mm~2.6 mm, the gray difference of the cracks still shows a linear change, but the slope is smaller than that of the first linear area, which is defined as the No.2 linear interval.
In the interval of 2.7 mm~5.0 mm, the gray difference of the crack basically changes steadily, which is defined as the smooth interval.
In the cracks of the No.1 linear interval and the No.2 linear interval, it can be seen that the grayscale difference of the cracks is linearly related to the width as a whole. Therefore, the least squares method is used to establish their linear relationship, forming the fitting formula for the No.1 linear interval and the No.2 linear interval. The fitting results are shown in Table 3:
The fitting results show that the correlation coefficients R2 of the linear interval are 0.9903 and 0.98339, and the correlation is high enough to meet the fitting requirements of the linear interval.
As shown in Table 3, by finding the inverse function of the No.1 linear interval and the No.2 linear interval, the functional relationship between the crack width and the gray level difference can be obtained, which can be used as the algorithm basis for the image identification of the crack width. In the application process, by calculating the difference between the crack position and the background gray level, the width value of the crack at the corresponding position can be obtained.
In the flat interval, the color density of the cracks after 3.0 mm remains basically unchanged, but a relatively noticeable width difference can be observed for comparison, indicating that cracks of different widths will have differences in the number of pixels.
In the grayscale distribution map of crack width direction, there will be an opening in the valley of each crack, which represents the number of pixels occupied by the crack. As shown in Figure 10, the relationship between the width of the crack and the number of pixels occupied can be obtained by counting the number of pixels occupied by each crack.
It can be seen from Figure 10 that the number of pixels occupied by cracks with different crack widths is distributed stepwise. When the crack width is 0.1~1.0 mm, the number of pixels occupied by this series of cracks are all three; when the crack width is 1.1~2.0 mm, the number of pixels occupied by this series of cracks is four; when the crack width exceeds 2.0 mm, the cracks occupy the same number of pixels in every 0.5 mm width.
Therefore, in the flat interval, the index of the number of pixels occupied by the cracks can roughly judge the crack width range. The specific Equation (16) is shown below.
w = { 2.6 ~ 3.0   mm ,     n = 6 3.1 ~ 3.5   mm ,     n = 7 3.6 ~ 4.0   mm ,     n = 8 4.1 ~ 4.5   mm ,     n = 9   4.6 ~ 5.0   mm ,     n = 10
Among them, w is the crack width, and n is the number of pixels occupied by the crack width.

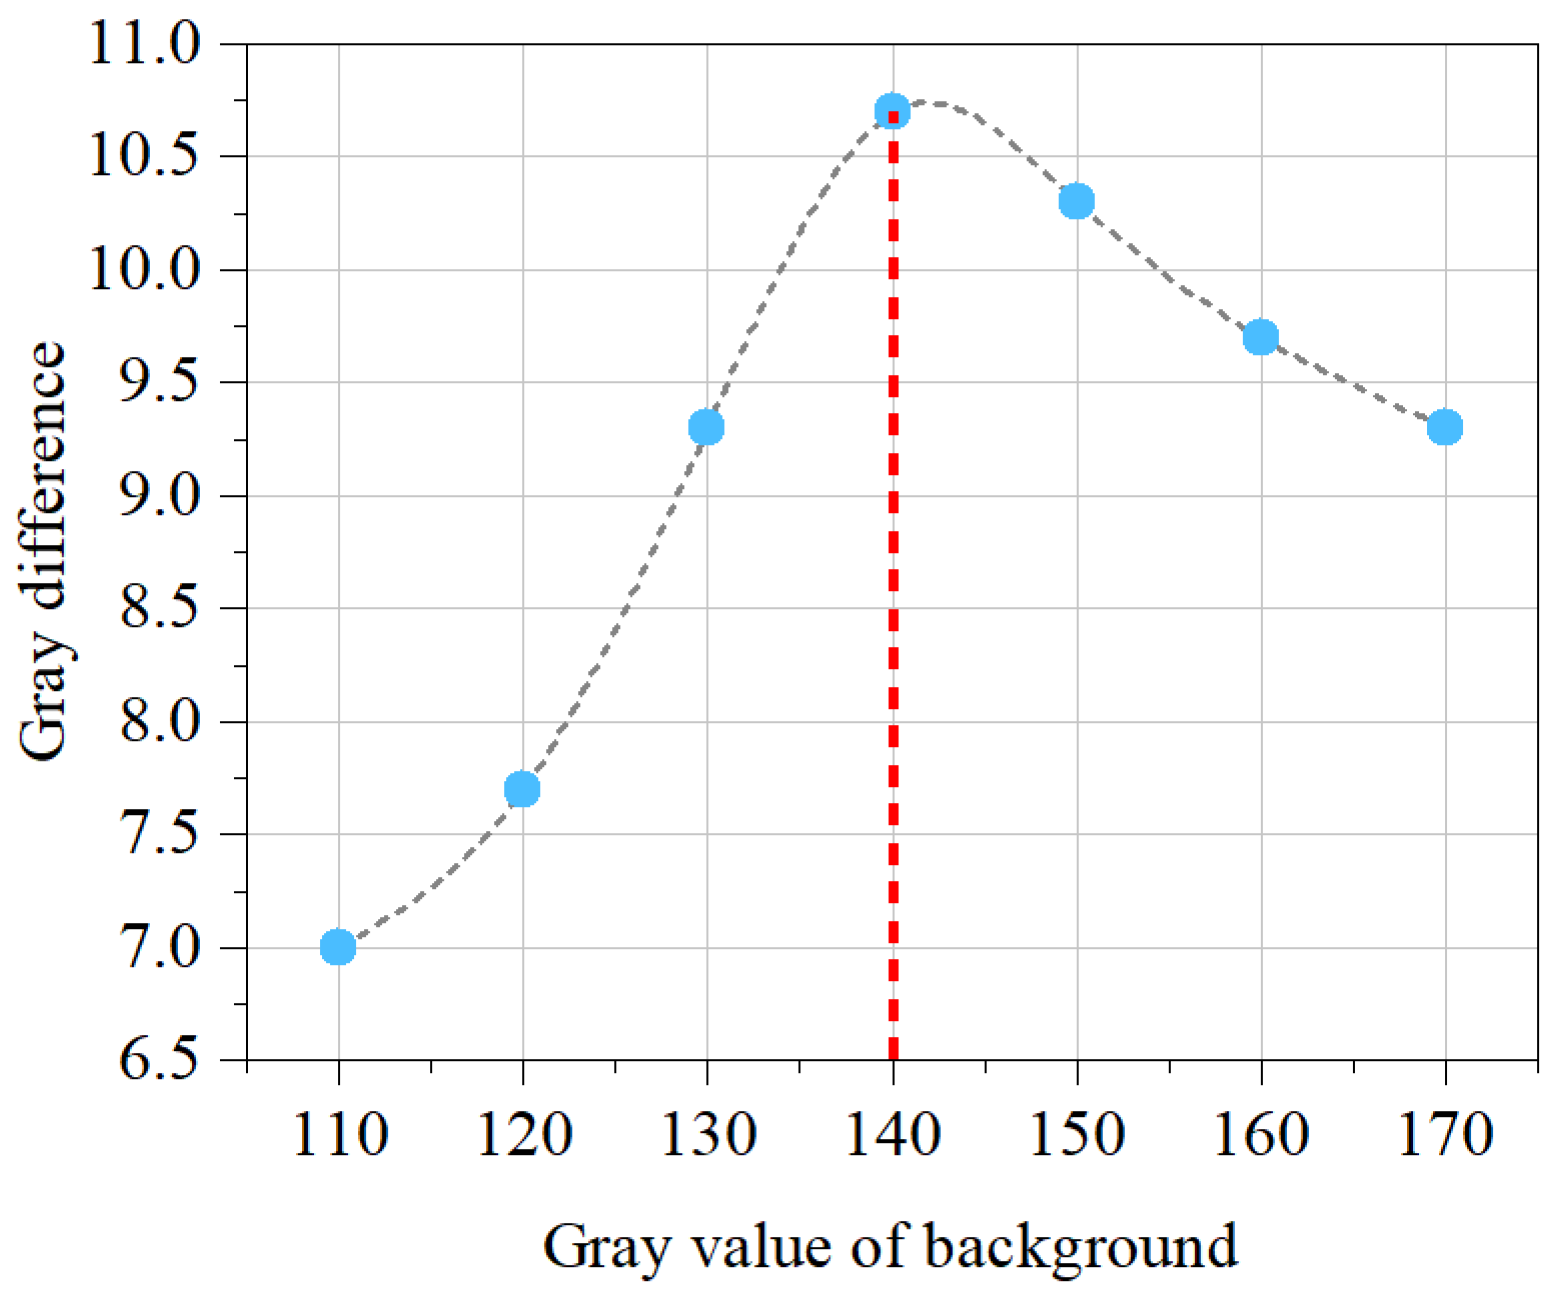
4.2. Best Gray Value for Crack Extraction

According to the calculation model of the crack width, it can be known that for the 0.1~2.0 mm fine cracks, the difference between the crack gray value and the gray value of the background is mainly used to identify the crack width. The larger the difference is, the better the identification of the crack. In order to reduce the difficulty of crack width extraction, the background and crack gray values under different background gray values are compared to determine the best gray value. Generally, the smaller the crack width, the more difficult it is to identify, so as long as the minimum crack width is studied, the best background gray value can be determined.
As shown in Figure 11, the background gray values of the 0.1 mm cracks shown with the gray values of 110, 120, 130, 140, 150, 160, 170 are extracted, and the relationship between the background grayscale and the grayscale difference is obtained.
With the background gray value increase, the crack grayscale difference shows a trend of first increasing and then decreasing. When the background gray value reaches 140, it has the most significant difference, which is the best background gray value.

5. Result

With the tunnel inspection vehicle, tunnel lining image acquisition was carried out in 66 highway tunnels in Zhejiang and Yunnan provinces, as shown in Figure 12.
According to the tunnel inspection requirements, the hardware parameters of the camera system are determined by the experiment and theoretical analysis of the tunnel lining image acquisition system to realize the selection of shooting system hardware. Furthermore, the calculation method of shooting-related parameters zoom and focus value is formed, ensuring that the shooting parameters can be quickly calculated before entering the tunnel, by simply adjusting the aperture and starting tunnel image acquisition when in the tunnel. The typical tunnel lining crack images taken inside the tunnel are shown in Figure 13.
Under various interference factors, the machine vision system can clearly present the cracks in the tunnel lining, which verifies the rationality of the hardware selection of the shooting system and the accuracy of the parameter calculation method.
Cracks at different crack width stages were found in the tunnel by using a crack observer with a resolution of 0.05 mm. As shown in Figure 14, the width of the crack in the No.1 linear interval is 0.50 mm, the width of the crack in No.2 linear interval 2 is 2.05 mm, and the width of the crack in the flat interval is 3.25 mm by onsite measurement. Since the crack width in the smooth area is too large to find the crack of the corresponding width in tunnels, the expansion joint is used to replace the crack for the width extraction test. The crack width calculated by the crack width model is shown in Table 4.
In three different crack width stages, using the corresponding fracture width calculation method of the proposed fracture width model, the extraction of the crack width is accurately achieved. The maximum error rate is only 9.2%, and the overall error rate is lower than 10%, which verifies the rationality of the crack width extraction model.

6. Discussion

A tunnel inspection vehicle that can quickly carry out mobile inspection has been systematically developed. Field tests in multiple tunnels prove the capability of clearly achieving the acquisition of tunnel lining images. Aided by related algorithms for automatic identification and segmentation of cracks and extraction of crack geometric parameters [18,22,23], which have been extensively studied, the mechanized and intelligent operation for the whole-process tunnel crack collection, analysis, and statistics can be realized.
In order to improve the efficiency of tunnel motion detection, the method of fast acquisition parameter calculation is established. The overall parameter calculation time is much less than one second by using the proposed calculation method. The motorized setting of a single lens parameter takes less than 10 s, the aperture adjustment takes 10 s, and 19 cameras take a total of 381 s. When the parameters are completely adjusted manually without the proposed method, it takes nearly 80 s to test and set the parameters of a single camera. Taking a two-lane tunnel as an example, it only takes 90 s for a tunnel inspection vehicle to detect at a speed of 40 km/h. As shown in Figure 15, the total detection time of the proposed method and without the proposed method is 471 s and 1610 s, respectively, which can be completed by only one driver and one operator.
If the traditional pure artificial apparent disease detection method is adopted, it is necessary to interrupt the traffic and close the road to search for diseases such as cracks in the tunnel. For the cracks located in the upper part of the tunnel, an additional climbing car is needed to complete the collection of the geometric parameters of the crack disease. This manual detection method is inefficient, and there are also potential safety hazards in the operation of climbing vehicles. For a one-kilometer-long tunnel, the manual inspection method usually requires 4–5 experienced inspectors, and the operation takes 12–24 h. In the manual collection method, the recording of cracks is mainly based on the parameter record table and discrete crack photos. It is not possible to form a spliced image of tunnel cracks, and it is not convenient to compare the development of cracks in different periods. However, the manual detection method can analyze the causes of cracks by tapping on the cracks, drilling holes, etc. In addition, for extremely dangerous cracks, it can also be disposed of in time on the spot to prevent secondary disasters from occurring, which is the ability that the tunnel inspection vehicle detection method does not have.
The proposed system is compared with MIMM-R, MTI-100, ODVS, and aircraft tunnel detection equipment. As shown in Table 5, the proposed system and MIMM-R have significant advantages over other systems in moving speed due to the use of automobile chassis. Since it is mainly used in road tunnels with larger cross-sectional dimensions, the number of cameras in the proposed system is the largest. In addition, the large number of cameras and the high resolution of a single camera enable the crack identification accuracy to reach 0.1 mm, which has the best realization among devices with existing data.
However, this system requires an automobile as a chassis and 19 high-resolution cameras, so it has a disadvantage compared to other systems in terms of system development cost. The walking mode of the vehicle chassis also makes the proposed system unable to be applied in subway tunnels. In this regard, the advantages of MIT-100, ODVS, and Aerial Solution are significant.

7. Conclusions

This paper firstly develops the hardware system of the tunnel inspection vehicle and studies the hardware parameter selection and parameter calculation method of the image fast acquisition system. Then, images characteristics of cracks in the tunnel lining are analyzed, and practical tests are carried out at the tunnel site. Finally, a comparison is also made with pure detection. The main conclusions are as follows:
The hardware design and integration of the image acquisition system is carried out, and a tunnel inspection vehicle is systematically developed. The selection of the hardware parameters of the image capture system is determined, and the method of fast acquisition parameter calculation is formed so that the three parameters of lens zoom, camera focus, and camera attitude can be calculated before entering the tunnel.
In the analysis of lining crack images, the model of tunnel lining crack width is established. The extraction of crack width is divided into three intervals according to the grayscale difference. In the No.1 linear interval and the No.2 linear interval, a linear fitting relationship between the grayscale difference and the crack width is established. The calculation relationship between the number of pixels and the crack width is established in the flat interval. In addition, in order to facilitate crack identification, it is analyzed that when the gray value of the background is 140, it has the highest gray contrast of crack pixels.
Field tests are carried out in many operated tunnels in Zhejiang and Yunnan provinces. The developed hardware system and software parameter calculation method can clearly obtain images of tunnel lining cracks. In the three crack width stage, the maximum width error rate of the crack extraction model is 9.2% in the No.1 linear interval. The time of detection method using the tunnel detection vehicle and automatic parameter calculation proposed in this paper is only 30% of the manual parameter adjustment and 1% of the traditional pure manual detection, and the amount of labor required is only 40% of the traditional method. In addition, there are also significant advantages in terms of automation. Furthermore, compared with other recent systems in terms of hardware type, quantity, resolution, and movement speed, it shows that this system has significant advantages in crack identification accuracy and movement speed.
Although we have realized some achievements in the rapid acquisition of tunnel lining images and the analysis of crack image characteristics, there is still much work to explore. For example, further improvement of crack width extraction accuracy, automatic adjustment of apertures for different lining materials, and assessment of the safety status of tunnel structures using the detected tunnel crack conditions are all important issues that need to be solved urgently to ensure the safe operation of tunnels.

Author Contributions

Conceptualization, Q.W., X.X. and B.Z.; methodology, H.W.; software, J.C.; validation, J.Z. and H.W.; resources, Y.L.; data curation, D.Y. and W.Z.; writing—original draft preparation, H.W.; writing—review and editing, Q.W. All authors have read and agreed to the published version of the manuscript.

Funding

This research was funded by the Natural Science Foundation Committee Program of China (Grant No. 52038008, 42107216), the Key Science and Technology Projects in Transportation Industry by Ministry of Transport of the People’s Republic of China in 2021 (Grant No. 2021-MS2-061), the Project of Science and Technology Program of Department of Transport (Grant No. 2021014), the Independent Scientific Research Project of Zhejiang Scientific Research Institute of Transport ( Grant No. ZK202205, Grant No. ZK202206).

Institutional Review Board Statement

Not applicable.

Informed Consent Statement

Not applicable.

Data Availability Statement

Not applicable.

Acknowledgments

Thanks to the Bureau of Transportation of Lishui and Yunnan Wuyi Expressway Constructing Headquarters for providing the tunnels for detection.

Conflicts of Interest

The authors declare no conflict of interest.

References

  1. Ge, M.; Sun, L. Design and development of highway tunnel maintenance and management system. J. Southeast Univ. 2015, 31, 137–142. [Google Scholar] [CrossRef]
  2. Huang, M.Q.; Nini, J.; Zhang, Q.B. BIM, machine learning and computer vision techniques in underground construction: Current status and future perspectives. Tunn. Undergr. Space Technol. 2021, 108, 103677. [Google Scholar] [CrossRef]
  3. Han, C.-S.; Yu, S.-N.; Jang, J.-H. Auto inspection system using a mobile robot for detecting concrete cracks in a tunnel. Autom. Constr. 2007, 16, 255–261. [Google Scholar] [CrossRef]
  4. Lee, S.Y.; Lee, S.H.; Shin, D.I.; Son, Y.K.; Han, C.S. Development of an inspection system for cracks in a concrete tunnel lining. Can. J. Civ. Eng. 2007, 34, 966–975. [Google Scholar] [CrossRef]
  5. Ukai, M. Advanced inspection system of tunnel wall deformation using image processing. Q. Rep. RTRI 2007, 48, 94–98. [Google Scholar] [CrossRef] [Green Version]
  6. Gavilán, M.; Sánchez, F.; Ramos, J.A.; Marcos, O. Mobile inspection system for high-resolution assessment of tunnels. In Proceedings of the 6th International Conference on Structural Health Monitoring of Intelligent Infrastructure, Hongkong, China, 9–11 December 2013. [Google Scholar]
  7. Yasuda, T.; Yamamoto, H.; Shigeta, Y. Tunnel Inspection System by using High-speed Mobile 3D Survey Vehicle: MIMM-R. J. Robot. Soc. Jpn. 2016, 34, 589–590. [Google Scholar] [CrossRef]
  8. Yasuda, T.; Yamamoto, H.; Enomoto, M.; Nitta, Y. Smart tunnel inspection and assessment using mobile inspection vehicle, non-contact radar and ai BT. In Proceedings of the 37th International Symposium on Automation and Robotics in Construction: From Demonstration to Practical Use—To New Stage of Construction Robot, ISARC 2020, Kitakyushu, Japan, 27–28 October 2020; pp. 1373–1379. [Google Scholar]
  9. Tabrizi, K.; Celaya, M.; Miller, B.S.; Wittwer, A.; Ruzzi, L. Damage Assessment of Tunnel Lining by Mobile Laser Scanning: Pittsburgh, Pennsylvania, Implementation Phase of FHWA SHRP 2 R06G Project. Transp. Res. Rec. 2017, 2642, 166–179. [Google Scholar] [CrossRef]
  10. Idoux, M. Multisensor system for tunnel inspection. In Infrared Components and Their Applications; SPIE: Bellingham, WA, USA; Volume 5640, pp. 303–311.
  11. Wang, P.; Huang, H.; Xue, Y. Model test study of factors affecting automatic detection performance of cracks in tunnel lining. Yanshilixue Yu Gongcheng Xuebao/Chin. J. Rock Mech. Eng. 2012, 31, 1705–1714. [Google Scholar]
  12. Tang, Y.P.; Wang, Q.; Zong, M.L.; Jiang, J.; Zhu, Y.H. Design of Vertically-Aligned Binocular Omnistereo Vision Sensor with Face-to-Back Configuration. Chin. J. Sens. Actuators 2010, 23, 791–798. [Google Scholar]
  13. Gong, Y.F.; Xiao, M.Q.; Wang, S.F.; Tang, Z. Review and Developing Trend of Railway Tunnel Detection Technology. Railw. Stand. Des. 2019, 5, 93–98. [Google Scholar]
  14. Yang, J.; Liu, X.; Liu, X.; Zhang, P.; Peng, F. Review of Rapid Test Vehicles for Highway Tunnel Structure. J. East China Jiaotong Univ. 2018, 4, 30–38. [Google Scholar]
  15. Liu, X.; Li, Y.; Xue, C.; Liu, B.; Duan, Y. Optimal modeling and parameter identification for visual system of the road tunnel detection vehicle. Yi Qi Yi Biao Xue Bao/Chin. J. Sci. Instrum. 2018, 39, 152–160. [Google Scholar] [CrossRef]
  16. Liu, X. Design and Implementation of Road Tunnel Intelligent Detection System. Mach. Des. Manuf. 2018. Available online: https://www.cnki.com.cn/Article/CJFDTotal-JSYZ201808020.htm (accessed on 7 February 2022).
  17. Montero, R.; Victores, J.G.; Martínez, S.; Jardón, A.; Balaguer, C. Past, present and future of robotic tunnel inspection. Autom. Constr. 2015, 59, 99–112. [Google Scholar] [CrossRef]
  18. Huang, H.; Li, Q.; Zhang, D. Deep learning based image recognition for crack and leakage defects of metro shield tunnel. Tunn. Undergr. Space Technol. 2018, 77, 166–176. [Google Scholar] [CrossRef]
  19. Bendris, B.; Becerra, J.C. Design and Experimental Evaluation of an Aerial Solution for Visual Inspection of Tunnel-like Infrastructures. Remote Sens. 2022, 14, 195. [Google Scholar] [CrossRef]
  20. Shigeta, Y.; Maeda, K.; Yamamoto, H.; Yasuda, T.; Kaise, S.; Maegawa, K.; Ito, T. Tunnel deformation evaluation by mobile mapping system. In Tunnels and Underground Cities: Engineering and Innovation Meet Archaeology, Architecture and Art; CRC Press: Boca Raton, FL, USA, 2019; pp. 3097–3104. [Google Scholar]
  21. Cai, J.L.; Xie, X.Y.; Zhou, B.; Zhou, Y.X.; Zeng, W.C. Rapid automatic inspection system for tunnel lining based on a mobile vehicle. In Tunnels and Underground Cities: Engineering and Innovation Meet Archaeology, Architecture and Art: Volume 5: Innovation in Underground Engineering, Materials and Equipment—Part 1; CRC Press: Boca Raton, FL, USA, 2020. [Google Scholar]
  22. Shim, S.; Kim, J.; Cho, G.-C.; Lee, S.-W. Multiscale and adversarial learning-based semi-supervised semantic segmentation approach for crack detection in concrete structures. IEEE Access 2020, 8, 170939–170950. [Google Scholar] [CrossRef]
  23. Cha, Y.-J.; Choi, W.; Buyukozturk, O. Deep Learning-Based Crack Damage Detection Using Convolutional Neural Networks. Comput. Civ. Infrastruct. Eng. 2017, 32, 361–378. [Google Scholar] [CrossRef]
Figure 1. The tunnel fast-moving detection system composed of the cockpit, control cabin machine vision module, etc.
Applsci 12 02516 g001
Figure 2. The composition of the machine vision module of the tunnel inspection vehicle.
Applsci 12 02516 g002
Figure 3. Layout of the machine vision system for tunnel inspection vehicle.
Applsci 12 02516 g003
Figure 4. The test piece and corresponding crack width (the number in the figure is the width of the crack there in mm).
Applsci 12 02516 g004
Figure 5. Bivariate fitting section plot: X is the object distance, Y is the value of zoom, and Z is the corresponding best focus.
Applsci 12 02516 g005
Figure 6. Camera attitude control model coordinate system.
Applsci 12 02516 g006
Figure 7. Crack grayscale extraction position.
Applsci 12 02516 g007
Figure 8. Grayscale distribution map of the crack width direction: (a) series of 0.1–1.0 mm, (b) series of 1.1–2.0 mm, (c) series of 2.1–3.0 mm, (d) series of 3.1–4.0 mm, (e) series of 4.1–5.0 mm.
Applsci 12 02516 g008
Figure 9. The relationship between the crack background difference and the crack width.
Applsci 12 02516 g009
Figure 10. The relationship between the crack width and the number of pixels occupied.
Applsci 12 02516 g010
Figure 11. Relationship between background grayscale and grayscale difference.
Applsci 12 02516 g011
Figure 12. Tunnel inspection vehicle to carry out image collection (a) in the Shiziling tunnel, and (b) in the Zhaitouling tunnel.
Applsci 12 02516 g012
Figure 13. Images of tunnel lining cracks, (a) cracks picture with breakage, (b) cracks picture with seepage, (c) cracks picture with stains, (d) cracks picture with expansion joint.
Applsci 12 02516 g013
Figure 14. Crack width calculation picture, (a) the crack in No.1 linear interval, (b) the crack in No.2 linear interval, (c) the crack in the flat interval.
Applsci 12 02516 g014
Figure 15. Comparison of detection efficiency of a one-kilometer tunnel: the first column is the use of the tunnel inspection vehicle and the proposed parameter calculation method, the second column is the use of tunnel detection vehicles and manual adjustment of parameters, and the third column is the traditional manual detection method.
Applsci 12 02516 g015
Table 1. The object distance and zoom used in the test.
Object Distance/m234567
Zoom5520303040
101030404050
202040505060
Table 2. The best focus under each object distance and zoom.
Zoom5102030405060
Object Distance/m
2505153
3353740
4303640
5283845
6283135
7333842
Table 3. The functional relationship between the crack width and the gray difference.
IntervalFitting FormulaR2Width
The No.1 linear interval y = 28.914 x + 15.214 0.9903 0.0346 g 0.5262
The No.2 linear interval y = 15.353 x + 34.184 0.9839 0.0651 g 2.2265
g is the difference between the gray value of the crack center point and the gray value of the background.
Table 4. Crack width calculation comparison table.
The Width StageMeasured Width/mmGray DifferenceNumber of Gray PixelsCalculate Width/mmError Rate
No.1 linear interval0.50310.5469.2%
No.2 linear interval2.05631.8758.5%
Flat interval3.2573.1–3.57.7%
Table 5. Comparison table with other recent systems.
NameDrive DeviceNumber of CamerasCamera TypeResolutionCrack
Identification
Accuracy
Movement Speed
Proposedautomobile19area array1392 × 10400.1 mm40~60 km/h
MIMM-Rautomobile16area array380,0000.2 mm50 km/h
MTI-100wheeled track rack6line array75000.3 mm3~5 km/h
ODVSrobot1area array1280 × 720no datano data
Aerial Solutionquadcopter4area array1600 × 1200
4096 × 3000
no data7.2 km/h
Publisher’s Note: MDPI stays neutral with regard to jurisdictional claims in published maps and institutional affiliations.

