Article

Long Term Trends of Base Cation Budgets of Forests in the UK to Inform Sustainable Harvesting Practices

Forest Research, Alice Holt Lodge, Farnham GU10 4LH, Surrey, UK
*
Author to whom correspondence should be addressed.
Appl. Sci. 2022, 12(5), 2411; https://doi.org/10.3390/app12052411
Submission received: 3 September 2021 / Revised: 27 January 2022 / Accepted: 3 February 2022 / Published: 25 February 2022
(This article belongs to the Special Issue Forest Soil Monitoring)

Abstract

:
There is growing concern in the UK that available base cation pools in soil are declining due to the combined effects of acid deposition and forest harvesting. To help inform the issue, elemental mass balances for calcium (Ca), magnesium (Mg) and potassium (K) were calculated using more than 10-years (10–24 years) of data from the UK’s ICP Forest Intensive Monitoring Network (Level II) of plots, covering a range of soil types and three tree species—oak, Scots pine and Sitka spruce. Out of the ten sites investigated, small negative Ca balances were observed at three sites and negative K balances on two sites, all on acid geology and nutrient poor soils, which were previously heavily acidified due to acid deposition. There is sufficient Ca and K in the soil exchangeable pool to sustain forest growth on these sites, however, if the present rate of Ca and K loss continues forest health and productivity are likely to be threatened within a few forest rotations. Magnesium showed a positive balance at all but one site, partly sustained by marine deposition. Base cation budgets were significantly (p < 0.01) positively related to soil exchangeable cations and soil base saturation status. Six of the sites showed an increasingly statistically significant positive cation balance with time, attributed to a decline in leaching linked to recovery from acidification. This included the three sites with negative Ca balance, although Ca remained in deficit. One site (Alice Holt) exhibited a decreasing cation balance, driven by a continued significant decline in base cation deposition thought to be related to pollutant emission control. The results were used to simulate the impact of different forest biomass harvesting scenarios involving the removal of brown (extracted after needle drop) or green (extracted before needle drop) brash. Podzols and deep peats were found to be the most vulnerable to brash harvesting causing Ca and K imbalance, but problems also occurred on brown earths. Impacts were greatest for the extraction of green brash from higher productivity stands. Base cation balance calculations remain highly uncertain due to the restricted nature of available measurements and wide variation of some estimates, particularly inputs from mineral weathering. More data are required to check and improve model predictions to better guide forest harvesting practice and ensure sustainable forest management.

1. Introduction

The drive to decrease anthropogenic CO2 emissions has led to increased harvesting of woody biomass for energy generation [1,2,3]. This practice poses a risk to soil fertility as more nutrients are removed in biomass that would have previously been left on the forest floor to decompose and return nutrients to the soil. The risk is greatest for nutrient poor, acidic forest soils [4,5,6]. North American studies have found biomass harvesting to result in a 17% to 50% net loss of calcium (Ca), 20% to 57% loss of potassium (K), and 16% to 45% loss of magnesium (Mg) [7]. Similar reductions have been identified in studies in Sweden [8], Finland [9], Belgium [10], Germany [11] and across all Nordic countries and the UK [12]. Anthropogenic nitrogen and sulphur deposition have also driven nutrient losses, especially of base cations [13,14,15]; as can increased forest productivity, e.g., due to rising levels of N deposition and atmospheric CO2 [16,17,18]. These trends have important implications for soil acidification and sustainable forest management.
Forest soils rely on soil mineral weathering to replace losses of base cations (BC), buffer acidification processes and sustain forest growth [19]. Many temperate and boreal forests are located on naturally acid soils with low mineral weathering rates [20,21,22,23], making them more vulnerable to acid deposition and biomass harvesting. It is very important to both policymakers and the forest industry to be able to quantify a sustainable level of biomass extraction that allows forest productivity to be maintained without progressively impoverishing forest soils [6,24].
Nutrient mass balance calculations or ‘budgets’ are typically used to assess soil impacts by comparing nutrient inputs via atmospheric deposition, mineral weathering and organic matter decomposition with losses/exports via leaching and biomass removal [25]. Results are compared with the stock or reservoir of available or total nutrients in the soil to determine future sustainability. For base cations, the soil reservoir of exchangeable Mg, Ca and K held on the cation-exchange complex is thought to be most important and readily measured by soil extractions using concentrated salts (salt-extractable exchangeable pools; [8,10,11]. Such an approach has been applied in a number of studies to estimate the ability of forest soils to sustain a range of forest management practices under different climate scenarios [7,8,11]. Results are often presented in terms of the number of harvesting cycles/forest rotations that can be sustained before the stock of soil base cations finally runs out. In reality, impacts on forest nutrition and growth rates are likely to occur well before the soil stock is emptied. Accurate estimates of soil base cation stocks and budgets are important to guide forest policy on sustainable levels of biomass extraction [26].
The objectives of this study are: (1) to quantify the forest base cation (Ca, Mg, and K) balances and their temporal change for ten long term monitoring, UK ICP Level II sites, covering different soil types and tree species—oak, Scots pine and Sitka spruce; and (2) to assess the impact of different harvesting scenarios (Conventional, Whole-tree harvesting with green brash (brash removed before needle drop) and Whole-tree harvesting with brown brash (brash removed after needle drop)) on long-term nutrient sustainability of the UK’s most productive tree species—Sitka spruce, across the main forest soil types. A simple decision matrix is produced to guide the sustainable harvesting practice of Sitka spruce on different soil types.

2. Methodology

2.1. Site Details: ICP Forest Level II Intensive Monitoring Sites

Data were used from ten intensive forest monitoring Level II sites distributed across the UK (Figure 1). The sites form part of a wider European (ICP Forests) network, established to gain a better understanding of the effects of air pollution and other environmental factors on forest ecosystem structure and function. Table 1 provides site details, while the soils are characterised in Table 2. Additional information on the monitoring network is provided by [27,28].

2.2. Base Cation Balance Calculations

A simple mass balance approach was adopted for each of the three base cations: Ca, Mg and K. Atmospheric deposition and soil mineral weathering represent the principal sources, with tree uptake and soil leaching the main sinks [29]. Budgets were calculated for oak, Scots pine and Sitka spruce on each of the main forest soil types:
Cation balance/Δst = inputs [AD + W + EV + F] − outputs [Bh + L]
ΔSt—The overall change in the soil stock of base cations
AD—Atmospheric deposition (wet and dry) of base cations
W—Release of base cations from weathering of soil minerals
EV—Release of base cations from the decomposition of pre-forestation vegetation
F—Base cation inputs in fertiliser applications
Bh—Tree uptake and removal of base cations in harvested ligneous biomass
L—Loss of base cations by leaching in soil run-off/drainage waters
 
All terms of the cation balance are expressed in kilograms per hectare per year (kg ha−1 y−1). The method for determining each term is described below.

2.3. Inputs: Base Cation Deposition

All forms of atmospheric deposition were included, i.e., base cations dissolved in rainwater (wet deposition) or cloud water (occult deposition) and associated with fine particles or dust (collectively referred to as dry deposition). Wet deposition is easier to measure than cloud and dry deposition, with both of the latter interacting with and thus affected by the nature of the forest canopy, including canopy height and structure. Consequently, atmospheric deposition is spatially very variable, influenced by rainfall amount, aspect, altitude, distance from the sea, distance from pollution sources and the nature of the land cover.
Wet deposition was determined using measured bulk precipitation, while dry and occult deposition were estimated from measured throughfall (the precipitation that has passed through the canopy). For each site, water samples from two bulk precipitation gauges (installed on open ground near to the forest plots) and ten throughfall gauges (installed under the forest canopy) were collected and volumes measured every two weeks from 1995 to 2007 and then monthly for some sites until 2019, spanning a 10 to 24 year period. Water flux measurements followed EU ICP Forest protocols described in detail in the ICP Forests manual [30].
Water samples were filtered through a 0.45 µm membrane and analysed for Ca, Mg and K by ICP-OES (Spectro flame, Spectro Ltd., Kleve, Germany). Quality assurance and quality control are as per the ICP Forest manual [30]. Measured base cation concentrations in bulk precipitation and throughfall were converted to monthly chemical fluxes using bi-monthly measured water volumes. The throughfall deposition base cation inputs were corrected for canopy leaching using the Ulrich canopy budget model [31]. Long term average annual canopy leaching among the different sites for Ca was between 9 and 35% of throughfall deposition, Mg was between 4 and 29% and K was between 55 and 86%. The time period of monitoring data varied between sites and is shown in Table 1. The mean annual deposition values for each monitoring period were used to estimate atmospheric deposition inputs for a complete 35–50-year forest rotation of Sitka spruce (depending on the yield class (YC)).

2.4. Input: Base Cation Weathering

Base cation weathering depends on the types of soil minerals present and thus on the geology and nature of the soil parent material. The weathering rate is also very important and affected by a wide range of factors, including climate, soil wetness and pollutant deposition, as well as by land use and management. Forest practices such as cultivation and drainage can increase weathering rates, while fertiliser inputs represent direct nutrient additions that are more readily available for uptake.
Site-specific soil mineral weathering rates were estimated by several methods: the PROFILE model and Zirconium Enrichment. The PROFILE model is a steady-state soil chemistry model [29] that includes process-oriented descriptions for chemical weathering of minerals, leaching and accumulation of dissolved chemical components, and solution equilibrium reactions. It was run with site-specific mineralogical input data; mineral surface areas were calculated using the empirical equation [28] and measured by the nitrogen BET (Brunaeur, Emmett and Teller) gas adsorption method [32,33]. The site-specific soil mineralogy was measured by X-ray diffraction technique (XRD) and calculated both as a percentage of the total mineral mass and of the total mineral surface area (for details see [34,35]. The zirconium enrichment technique generates individual base cation weathering rates for each horizon at each site. However, it is not universally applicable and should only be used where the soil is clearly derived from the underlying rock, or where the location of the parent material is known and can be directly sampled. Three Level II sites, Alice Holt, Savernake and Grizedale, were considered suitable for its application.

2.5. Input: Pre-Existing Vegetation

The pre-existing vegetation prior to afforestation contains a stock of nutrients that will be returned to the site as the vegetation becomes shaded out by increasing tree canopy cover. The quantity of nutrients involved in this one-off input will depend on the nature of the original vegetation and how this was managed (e.g., in terms of past land improvement and fertiliser inputs) and the rate of change. Data were taken from the literature for the nutrient content of rough pasture, which was assumed to be the most common type of pre-existing vegetation on forest sites.

2.6. Input: Fertiliser

Fertiliser applications represent a direct and potential large addition of nutrients to a site. The net contribution to the soil base cation stock will depend on how much of the applied cation is removed by the growing crop or lost by leaching/run-off. Based on previous forestry practice, it was assumed that peaty gleys and deep peats received a single application of rock phosphate, representing an input of 60 kg/ha P and 166 kg/ha Ca [36]. Deep peats were also expected to have received a single application of K fertiliser at a rate of 100 kg/ha K [36].

2.7. Outputs: Base Cation Leaching

Losses by leaching were estimated using measured soil solution chemical concentration and calculated water flux. At each site, soil solution was sampled every two weeks until 2007 and monthly thereafter. Where soil depth permitted, six lysimeters (PRENART Super Quartz soil water samplers, Prenart Equipment Aps, Frederiksberg, Denmark) were located at each of 10 cm and 50 cm depths. The 50 cm depth soil solution data were used to calculate base cation leaching fluxes for nine of the ten Level II sites for time periods ranging between 10 and 24 years. The 10 cm depth soil solution data was used at Coalburn due to the high soil water table and dominance of surface runoff pathways. Soil solution was collected and measured according to Level II protocols as described in the ICP Forests manual [37]. Soil water samples were analysed as per bulk precipitation and throughfall water samples (see above).
Soil solution base cation concentrations were converted to fluxes using a climatic water balance model, drawing on local site-specific bulk precipitation and evaporation estimated using a combination of the Penman–Monteith equation and measured site canopy interception [38,39]. Daily meteorological data for the latter came from automatic weather stations (AWS), either located at the site or from the nearest Meteorological Office weather station; data for the latter were provided by the British Atmospheric Data Centre (BADC). Monthly base cation fluxes were calculated using bimonthly measurements up to 2007 and monthly onwards. The period length of soil solution monitoring data used for each site is shown in Table 1. The resulting mean annual soil solution values were applied to the full 35–50-year forest rotation for assessing the impacts of the harvesting scenarios.

2.8. Outputs: Base Cation Uptake by Trees

Tree uptake of base cations for oak, Scots pine and Sitka spruce was derived from forest inventory data from the individual Level II sites, based on forest age, tree growth rates, biomass partitioning and measured base cation concentrations in stem wood, bark, branches and needles from sampled trees [40]. This used the BSort biomass partitioning model [41,42], with nutrient concentrations simply multiplied by the biomass for each component to derive total nutrient stocks (no allowance was made for possible changes in nutrient concentration with YC). This allowed the base cation contents of wood and bark in conventional harvesting to be compared with the additional removal in harvested brash. Site-specific data are shown in Supplementary Materials Table S1, suggesting that the differences in growth, as well as cation concentrations between sites, likely reflects the range of tree species, soil types and geologies, climatic conditions and deposition inputs.

2.9. Harvesting Scenarios

Base cation budgets were compared for three harvesting scenarios: Conventional harvesting (CH), Whole-tree harvesting with brown brash (WTHB) and Whole-tree harvesting with green brash (WTHG), for a single rotation of YC 6–24 Sitka spruce growing on each of the main forest soil types. Sitka spruce was chosen over the other two studied tree species since this is the main commercial tree species in UK forestry [43]. Separate budgets are provided for peaty gley soils on Ca-rich vs. acid geologies.
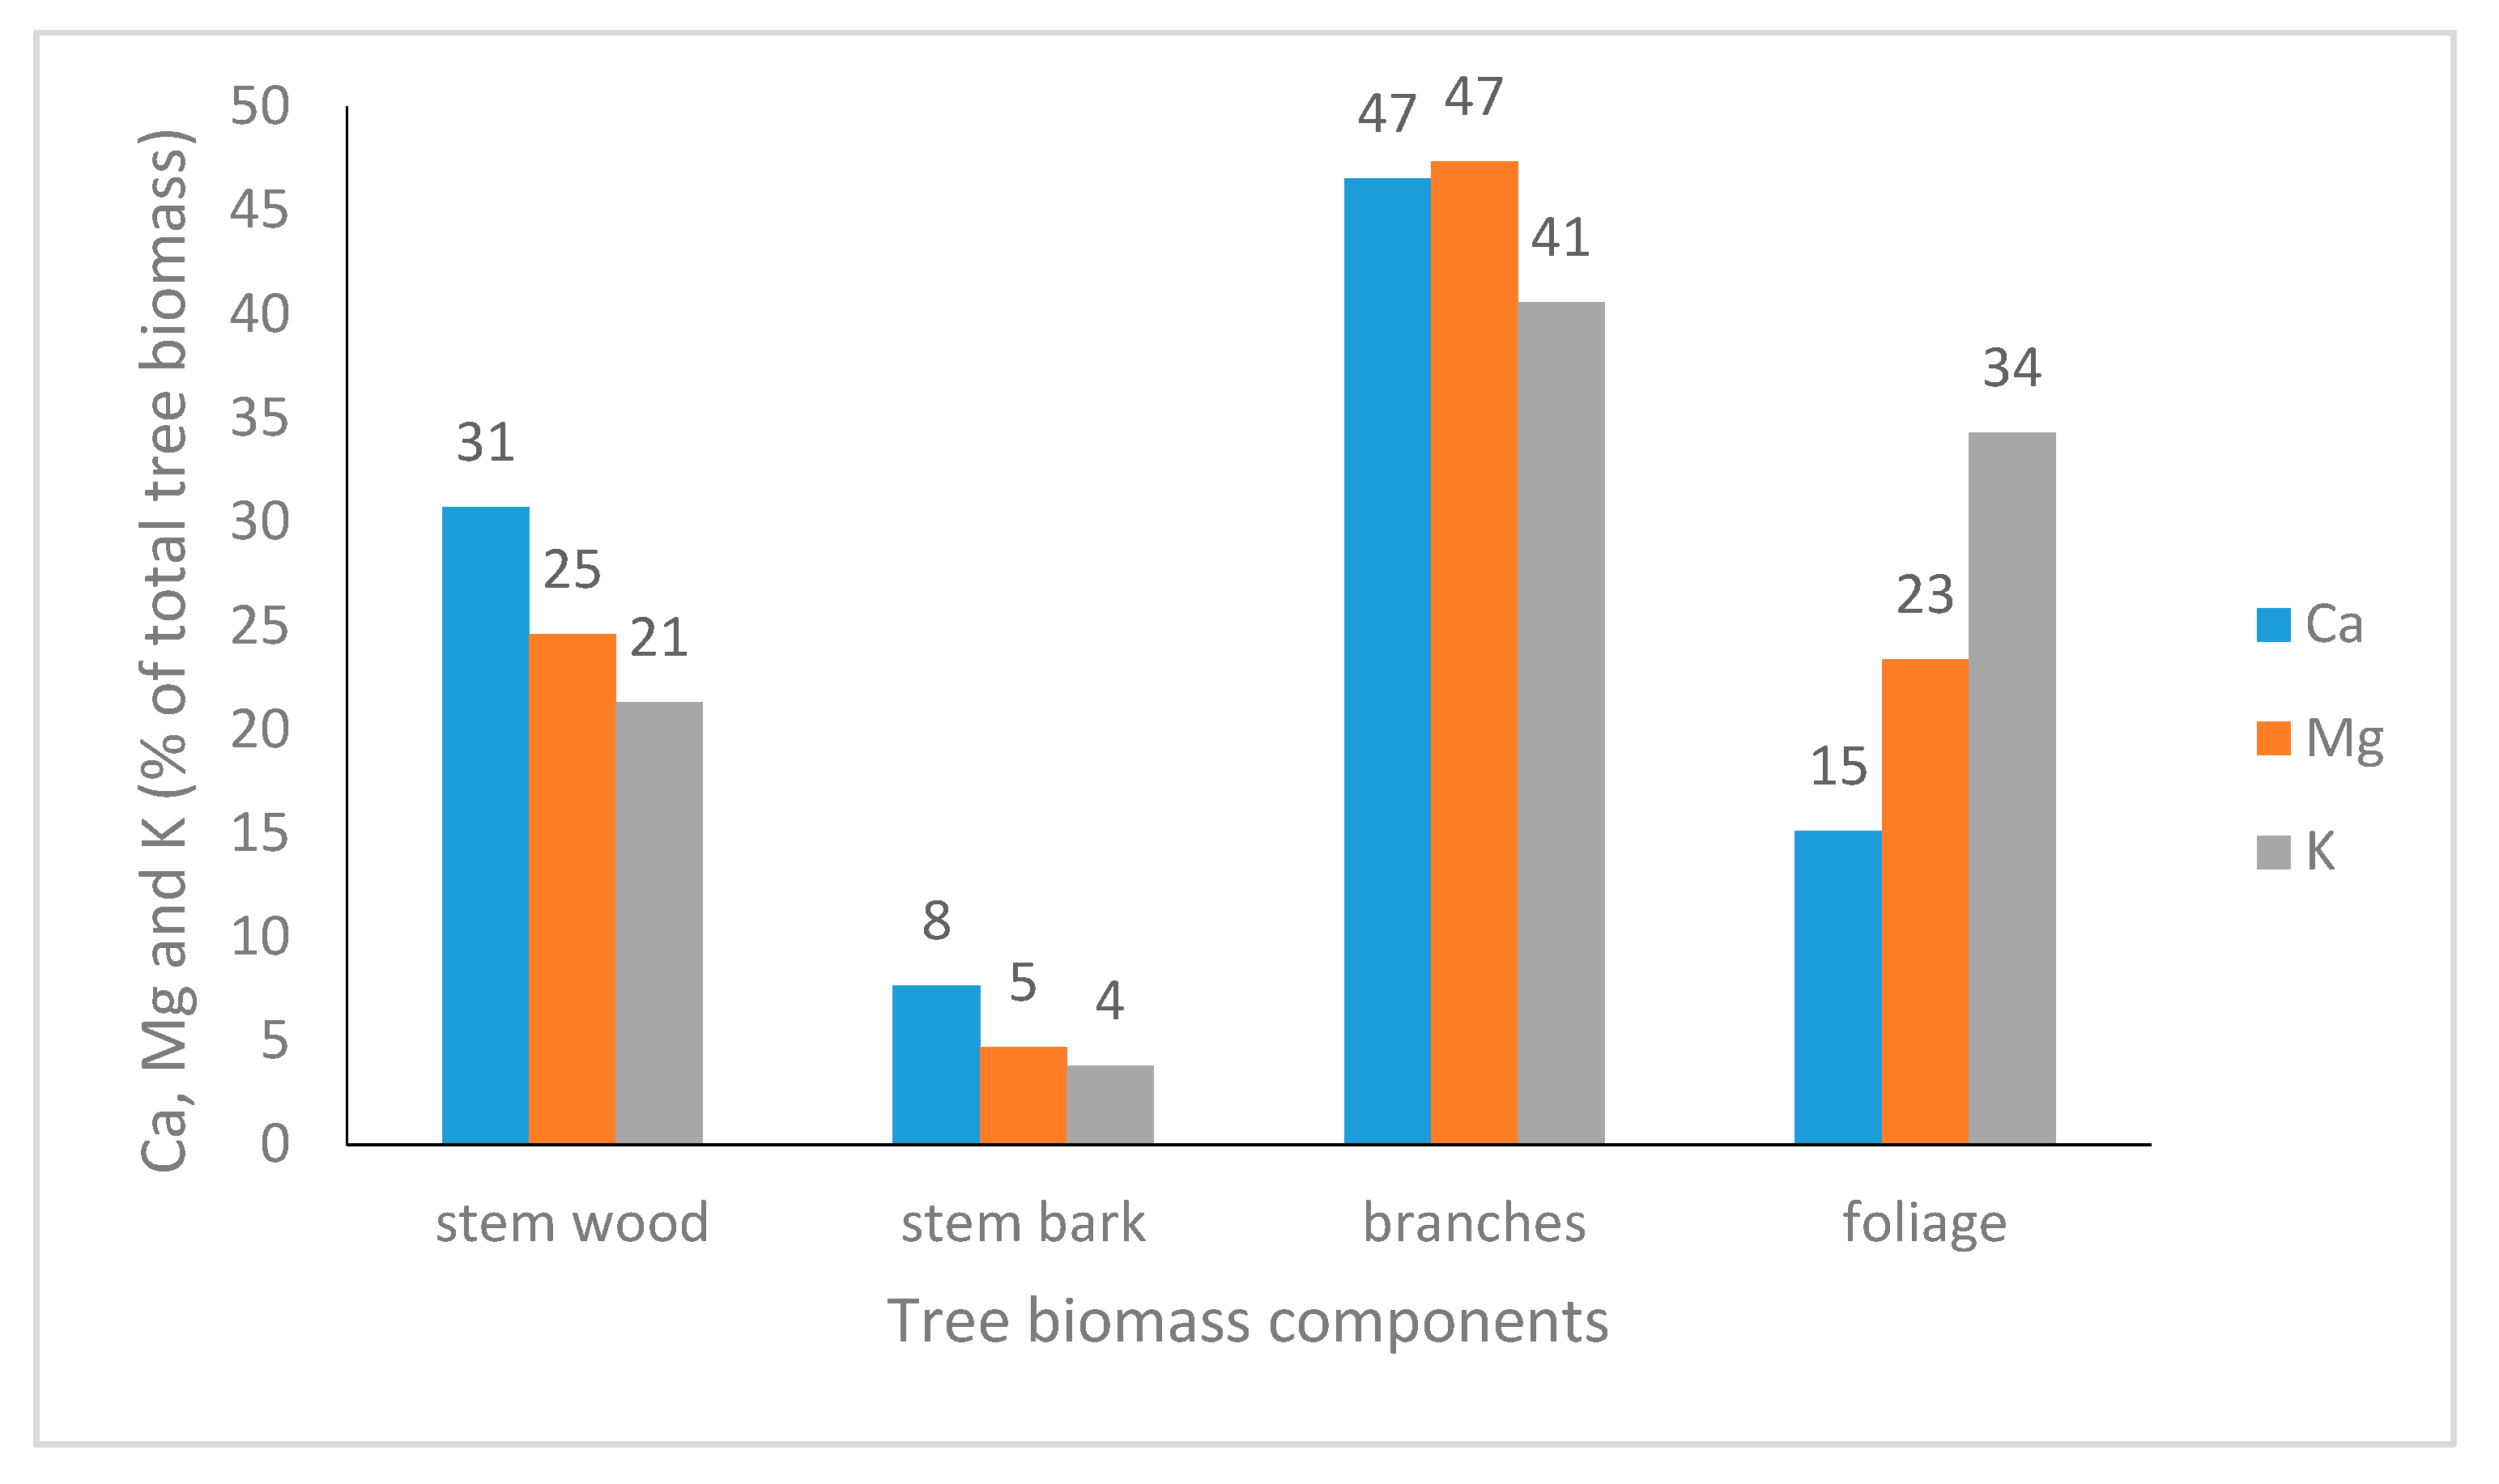
Base cation partitioning in different biomass compartments of Sitka spruce is shown in Figure 2. An adjustment was made for the different nutrient contents in the harvesting scenarios of WTHG and WTHB based on biomass of foliage and branches modelled by the BSort model. Reflecting past forest practice, it was assumed that first rotation Sitka spruce crops on shallow and deep peats would have received a single application of rock phosphate (an input of 166 kg Ca ha−1), while deep peats would also have received a single application of muriate of potash (an input of 100 kg K ha−1) [36]. Inputs from previous vegetation (rough pasture) amounting to 71 kg Ca ha−1, 17 kg Mg ha−1 and 39 kg K ha−1 were also included in all scenarios. Atmospheric deposition of base cation input for the harvesting scenarios uses averaged measured base cation deposition from the three Sitka spruce Level II sites, which is representative of UK upland forests. Base cation inputs by weathering and outputs by leaching use averaged data for the six main soil types covered by the 10 ICP forest monitoring network sites. For example, for gleys, averaged data from Alice Holt and Savernake were used, for brown earths—data from Grizedale, for podzols—averaged data from Thetford, Rogate and Sherwood, for peaty gleys on Ca-rich geology—Coalburn data, and for peaty gleys on acid geology—Llyn Brianne data. In addition, an allowance was made for 20% greater base cation losses by leaching due to disturbance caused by clear-felling (for a four-year period) [8,44,45].

3. Results

3.1. Site-Specific Base Cation Budgets

Site-specific base cation inputs and outputs measured at each of the ten Level II long term monitoring plots over the last 10–24 years are summarised in Table 3a,b, with base cation budgets provided in Table 4. On average across all sites, Ca output as tree uptake (33% of total) was smaller than that by leaching (67%), while Ca input by weathering was much larger (71% of total) compared to deposition (29%). Similar partitioning between deposition and weathering was also observed for Mg and K. In addition, leaching and tree uptake proportion to the total outputs varied between base cations with higher outputs by leaching for Ca and Mg than tree uptake while for K the tree uptake made a higher proportion of outputs than K leaching (Table 3b). Site Ca and Mg inputs were significantly positively related to outputs (r2 = 0.75 and 0.57 respectively), while K exhibited a much weaker and not significant relationship (r2 = 0.07).
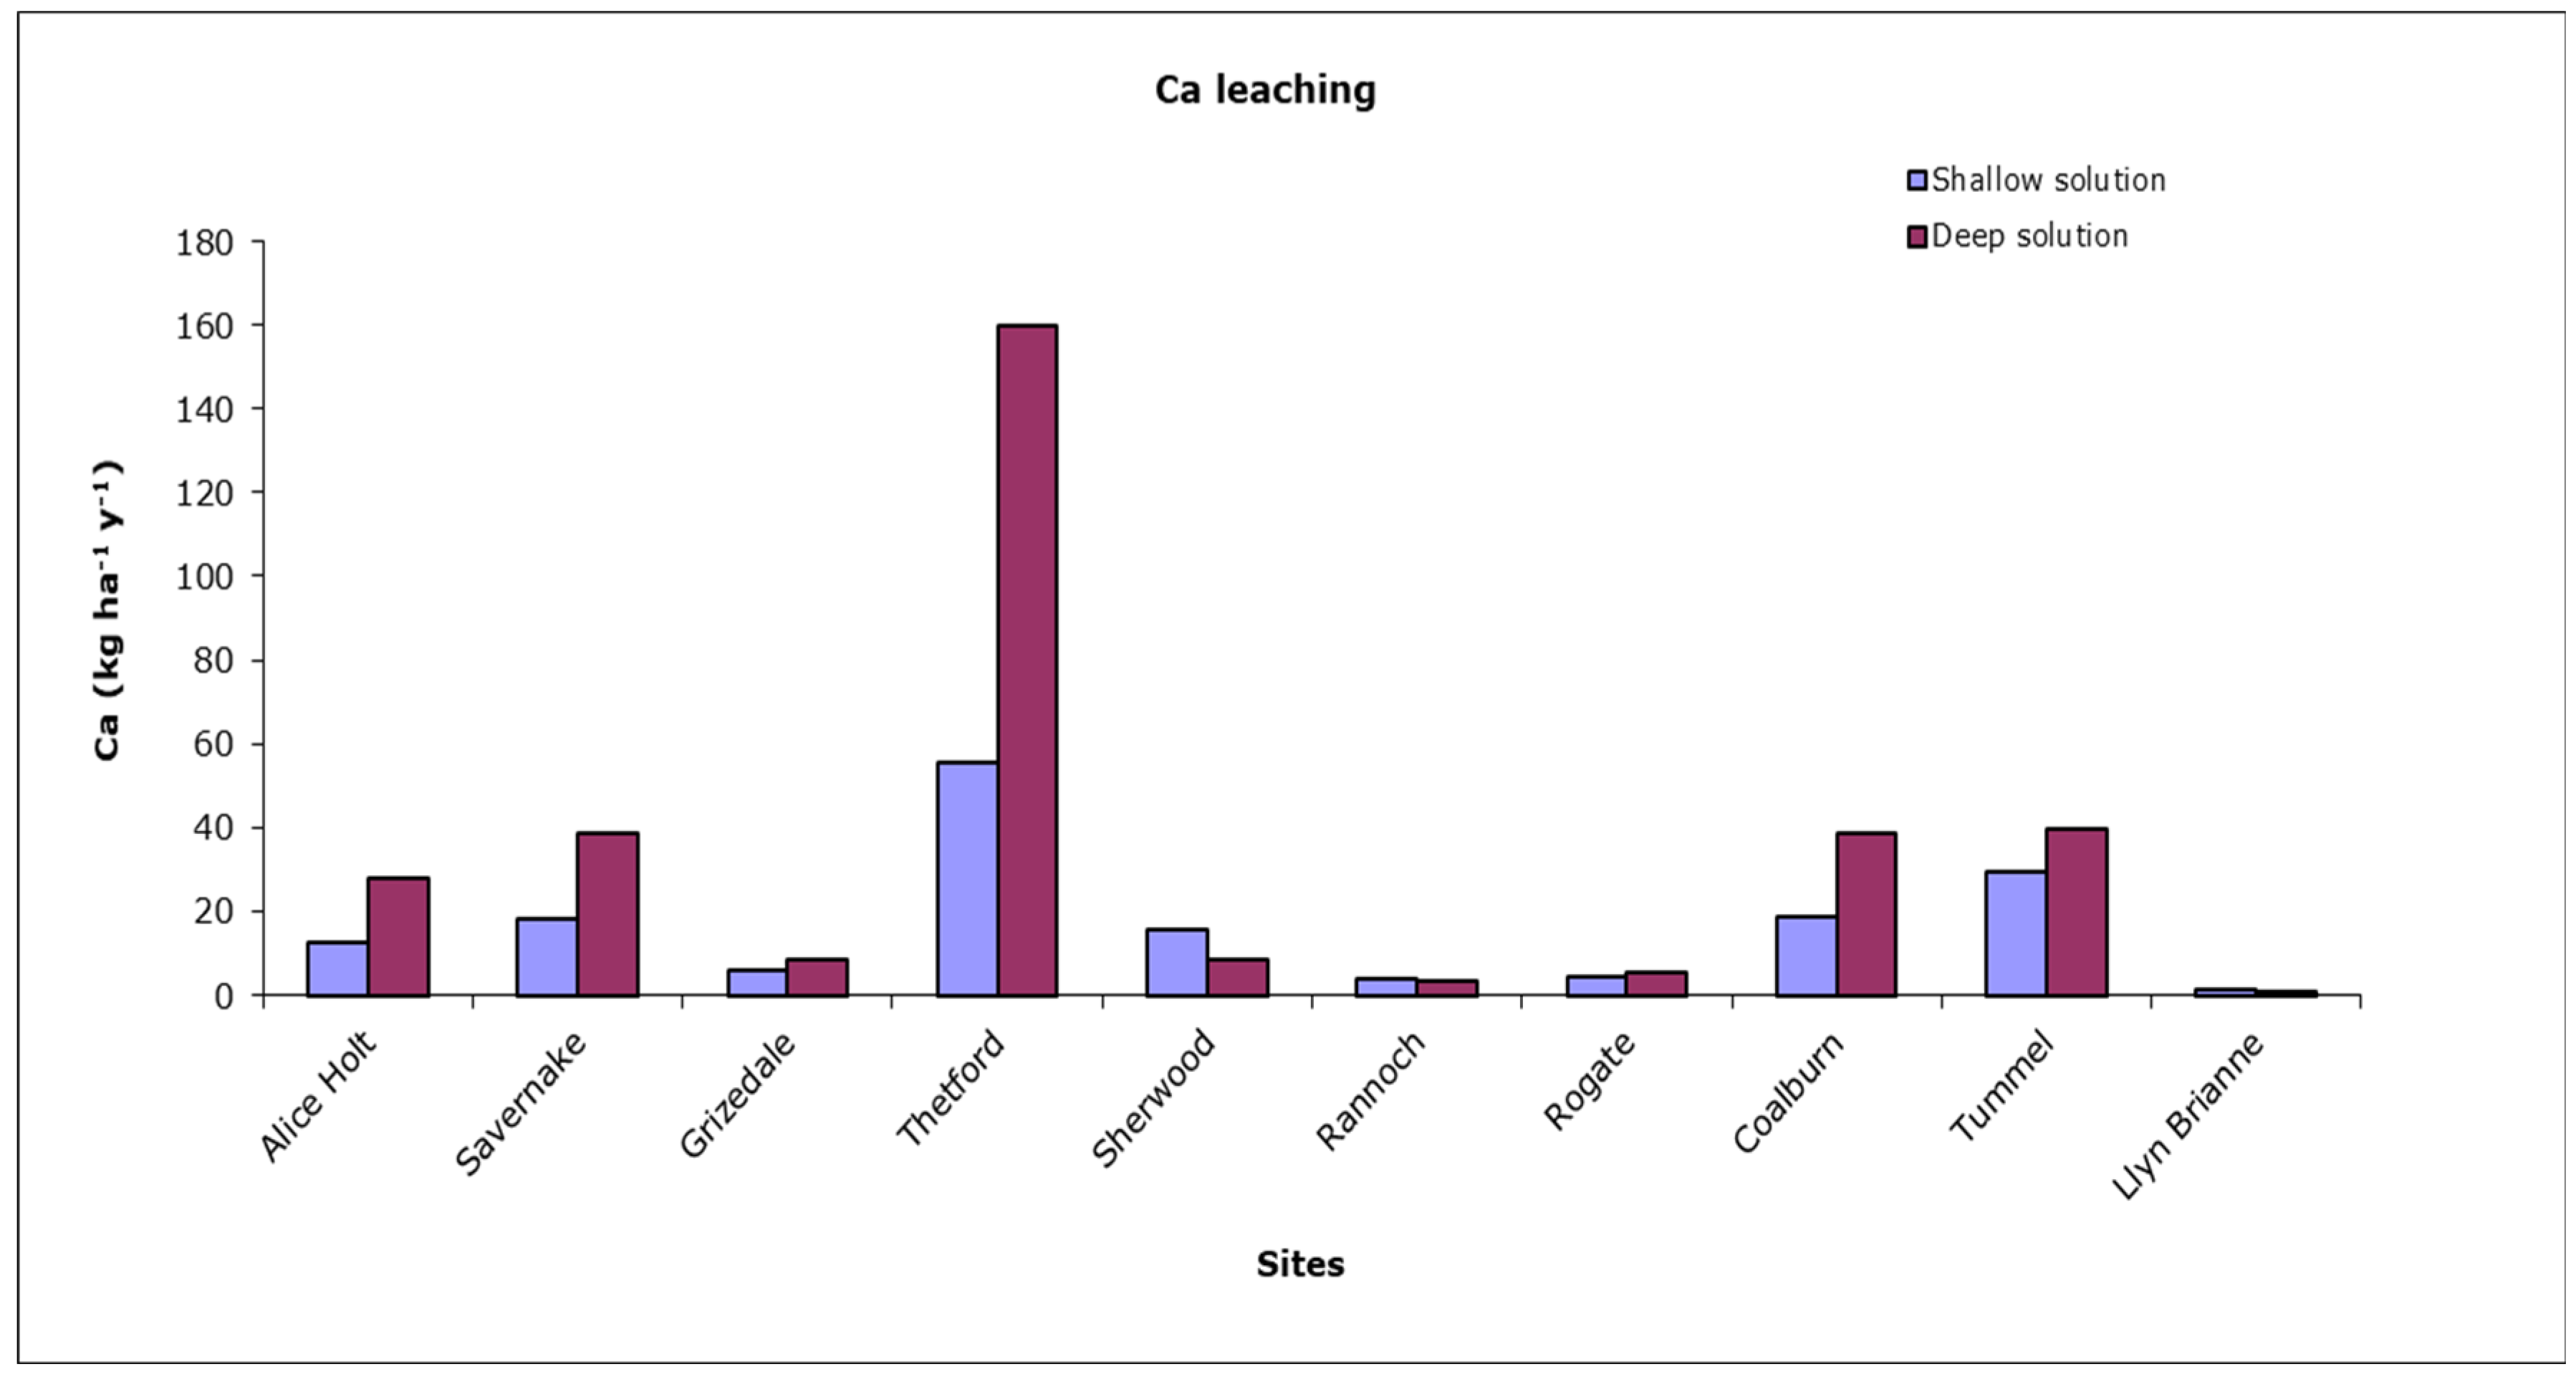
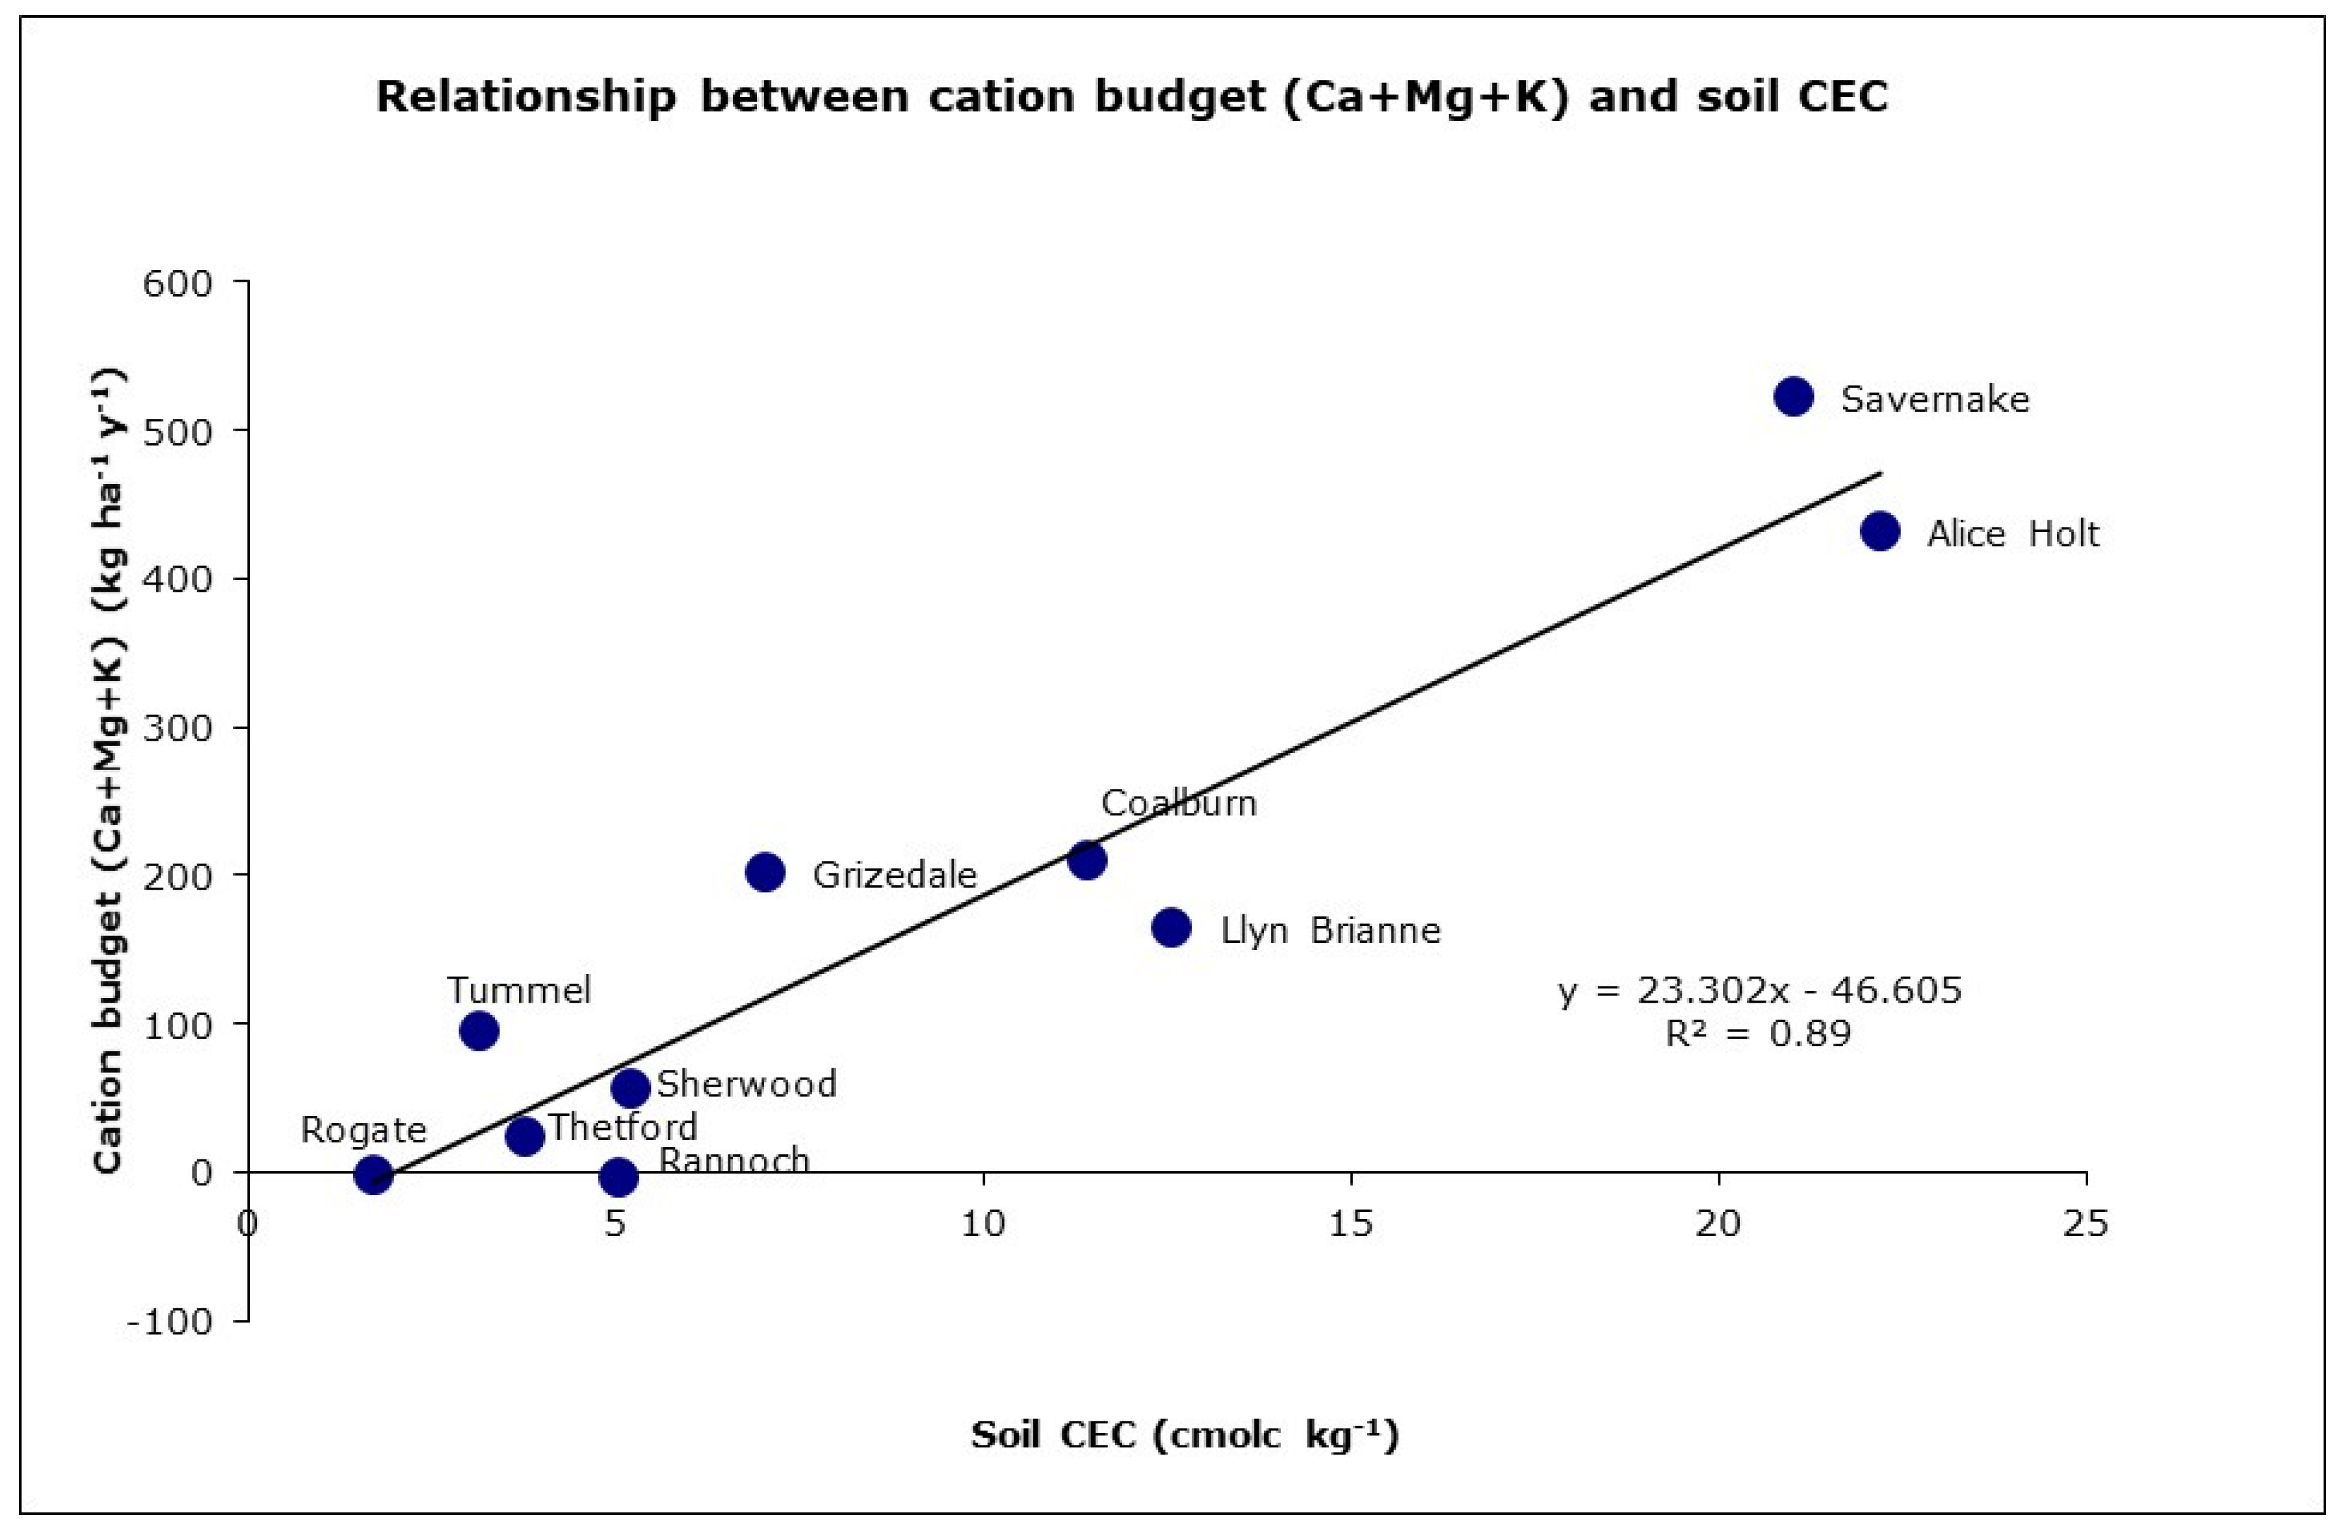
A small negative Ca balance was observed at Sherwood and a small negative Ca and K balance at Rannoch and Rogate; all sites on nutrient poor, acid sandy soils and under mature Scots pine (Table 2). The Mg budget was positive for all but Thetford, which also had a borderline K balance (Table 4). As expected, Ca leaching tended to be higher for sites with deeper soils and Ca-rich geology (Alice Holt, Savernake, Thetford, Coalburn, and Tummel), with the highest leaching rate observed on the sandy soils overlying chalk at Thetford (Figure 3). Ca, Mg and K balances were significantly positively related to soil exchangeable cations (Ca (r2 = 0.91, p < 0.001, n = 10), Mg (r2 = 0.31, p < 0.1, n = 10) and K (r2 = 0.62, p < 0.01, n = 10) (data not shown), while the overall base cation (Ca + Mg + K) budget was significantly positively related to site-specific soil cation exchange capacity (CEC) (r2 = 0.89, p < 0.001, n = 10 Figure 4).

3.2. Temporal Changes in Base Cation Budgets

Significant temporal changes were observed for at least one base cation at most of the sites, which were generally positive in direction (Table 5). The main exception was Alice Holt, where the Ca and Mg balance both decreased over time. The Ca and Mg balance significantly increased at two sites (Sherwood and Coalburn) and the K balance at four sites (Savernake, Rogate, Tummel and Llyn Brianne).

3.3. Base Cation Harvesting Scenarios

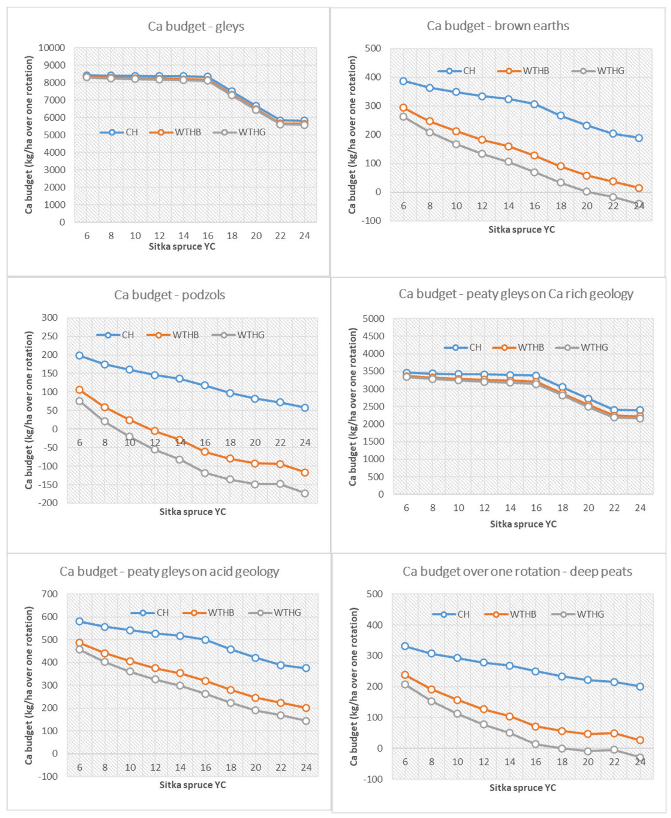
The harvesting scenarios have been calculated for the three main base cations necessary for tree growth and health—Ca, Mg and K. Forest Ca, Mg and K budgets are presented for each scenario (CH, WTHB, WTHG) for YC 6-24 Sitka spruce on the principal forest soil types in Figure 5, Figure 6 and Figure 7. Fertiliser input of Ca as rock phosphate was included in peaty gley and deep peat budgets, and of K as muriate of potash on deep peats, while separate budgets are provided for peaty gley soils on Ca-rich vs. acid geologies.
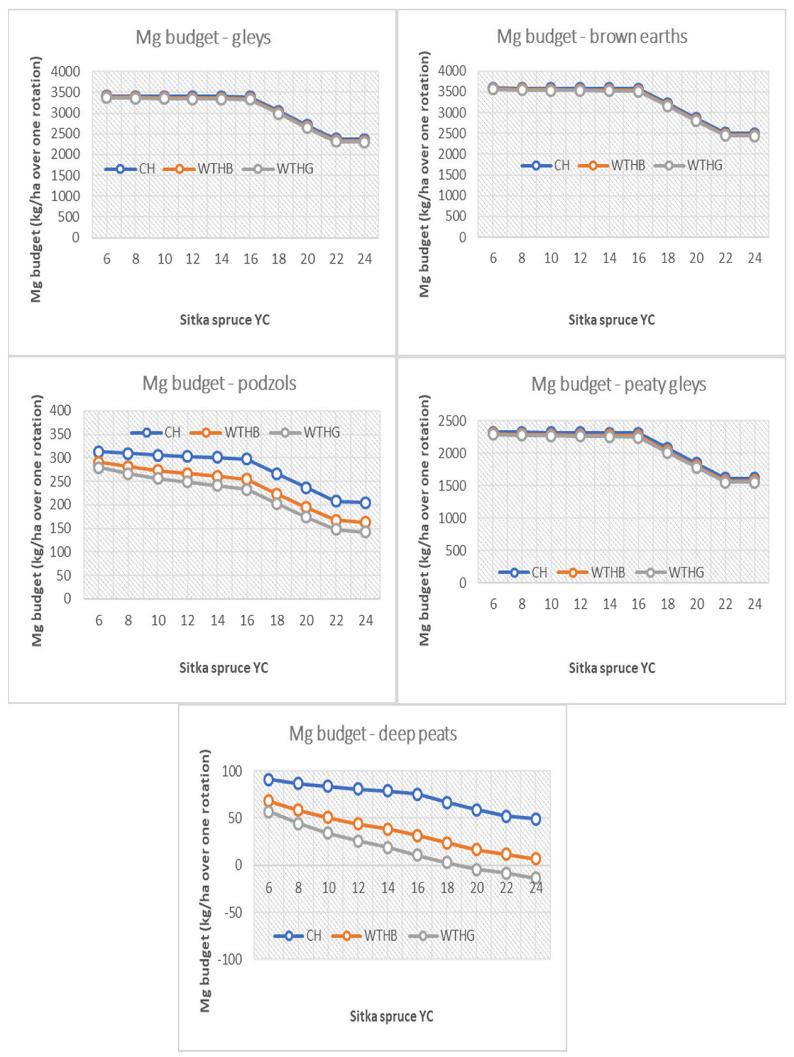
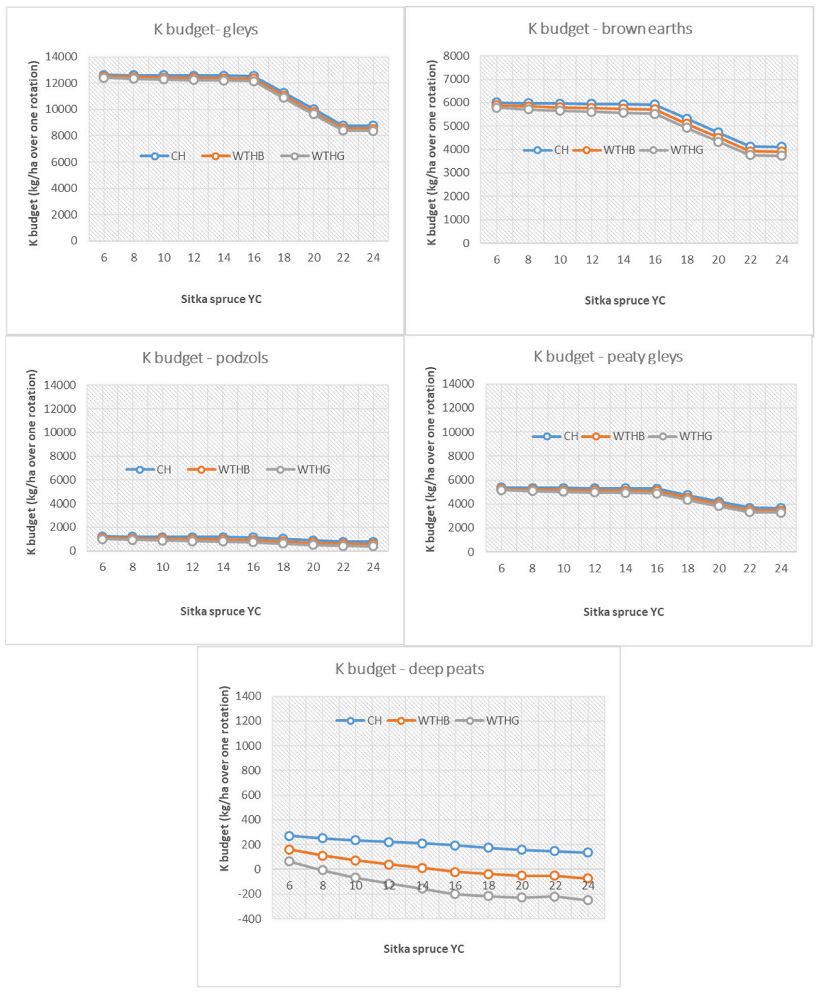
The results indicate that the Ca budget is positive for both CH and WTHB scenarios on all soil types except podzols, where the budget is negative for crops of YC > 12 under WTHB management. The WTHG scenario increased the number of soil types with negative Ca balances for first rotation crops, including for YC > 20 on brown earths, YC > 8 on podzols, and YC > 18 on deep peats. In contrast, the Mg budget was positive for all three harvesting scenarios on gley (surface and ground water) soils, brown earths, podzols and peaty gleys. The only exception was the WTHG scenario for SS YC > 18 on deep peat. The K budget was positive for all three harvesting scenarios on all soil types except for deep peats, where WTHB resulted in a negative budget for YC > 16 and WTHG a negative balance for YC > 8.

4. Discussion

4.1. Base Cation Inputs and Outputs in Forest Ecosystems

Mineral weathering dominated base cation inputs across most sites, especially those on base-rich geologies such as Alice Holt on Gault Clay, Savernake on Cretaceous chalk, Thetford on sands over chalk, and Coalburn and Tummel on carboniferous sediments. The opposite was the case for sites on acidic geologies and soils, such as Rannoch and Rogate overlying sandstone, where deposition accounted for 48% to 95% of base cation inputs (Table 3b). Distance from the west coast exerted a strong influence on Mg deposition, reflecting marine inputs at sites like Llyn Brianne and Grizedale, but to a much lesser degree than in a similar study in Ireland [46]. Notably, canopy leaching was found to be important for K (55–85% of throughfall deposition), Ca (9–35%) and Mg (4–29%), highlighting the need to correct for internal base cation cycling to avoid overestimating deposition inputs. The importance of accounting for canopy nutrient transformation and processing has been previously noted for nitrogen [47] and other nutrients [48].
The UK Level II sites have a wide range of cation deposition which follows the range of sulphur (S) and nitrogen (N) deposition across the sites (Table 1, [28,49,50]), with high inputs at historically industrially polluted sites (Sherwood, Grizedale, Llyn Brianne) but also sites close to busy road networks (Alice Holt) or intensive farming (Savernake and Thetford) and lower inputs of cations at more pristine sites such as Rannoch and Tummel. This suggests that further pollution abatements [51,52,53] may lead to decreases not only to S and N but also in base cation inputs to forest ecosystems.
Many factors influence the balance between base cation leaching versus tree uptake, including site quality and tree growth. Wide variation in tree uptake rates is evident amongst the sites, reflecting the different tree species and site types. Tree growth rates ranged between 2.3 to 3.5 t ha−1 y−1 for oak, 3.3–5.1 t ha−1 y−1 for Scots pine and 6.0–8.1 t ha−1 y−1 for Sitka spruce, although this was not directly related to base cation uptake. Oak and spruce generally had similar levels of uptake, while pine tended to be the lowest for all four base cations. This was despite the base cation concentrations measured in the different woody compartments being similar between the three species (Table 2, Supplementary Materials Table S1). The low uptake values for pine reflected the nature of the soil, with all three pine sites involving nutrient poor podzols over sandstone (Table 4; Figure 5). Soil and geology also strongly affected Ca and Mg uptake rates across oak and spruce sites, with the highest values measured on sites overlying base-rich geology (e.g., oak at Alice Holt vs. at Grizedale, and spruce at Coalburn vs. Llyn Brianne).
Base cation leaching varied greatly between sites, especially for Ca, which can be explained mainly by differences in geology and rainfall (Table 1). Highest Ca leaching was measured for pine at Thetford due to the influence of chalk, while it was lowest for spruce on the acidic soils and geology at Llyn Brianne (Table 3, Figure 4). In contrast, leaching of K was highest at Grizedale, reflecting high rainfall and marine deposition (Table 3b). Future changes in rainfall amount and intensity can be expected to have a significant impact on forest base cation budgets.

4.2. Forest Base Cation Budget

The Ca balance was slightly negative on sites with very poor, sandy, acid soils overlying acid geology, including Sherwood, Rogate and Rannoch. Notably, these sites have been heavily polluted in the past by acid deposition and experienced high cation leaching losses [28,54].
The Ca balance was also very low at Llyn Brianne and Grizedale, where in the former case the low exchangeable Ca content in the soil (Table 2) has already resulted in Ca deficiency in the first rotation Sitka spruce forest [55]. This is in line with the findings of [56], who reported that soil base cation stores within acidic stagnopodzol soils under Sitka spruce in Wales were being depleted and likely to run out within 65 years. A depletion rate of 205 kg Ca ha−1 over a 50-year-old rotation of Sitka spruce was calculated by [57], approximately equivalent to the exchangeable calcium pool to the bottom of the soil profile and 14% of the total soil calcium reserve to the base of the B horizon.
Of the other two main base cations, K is the next lowest with two sites showing a slightly negative balance (Rogate and Rannoch), followed by Mg, which was slightly negative at Thetford (Table 4, Figure 2). Thetford would have been among the poorest sites for total base cations if Ca weathering had not been enhanced in the subsoil by tree rooting. Rooting by Scots pine in the sandy soils was able to access deeper Ca stores linked to the underlying chalk, thus maintaining a positive Ca and total base cation budget. Other studies have found evidence for such base cation uptake/pumping by roots, although this seems to be strongest for broadleaves due to their higher nutrient demand. In addition, chalk geology is known to support upwards capillary flow of water driven by evaporative flux, as demonstrated at Blackwood in Hampshire, which could sustain Ca supply [58]. Mg and K budgets were low at Thetford, partly due to its inland and easterly location, receiving the lowest deposition of marine base cations. Sea salt deposition plays a significant role in sustaining base cation budgets along western coastal areas of the UK, as evidenced by the positive total base cation budgets at Llyn Brianne and Grizedale, despite the upland, acid soils.
Considering the robustness of the estimates in terms of measurement uncertainty, the mineral weathering rates are associated with the highest uncertainties due to methodological difficulties [34], especially for clay soils, but leaching and deposition measurements could also be problematic (e.g., in terms of estimating leaching volumes and allowing for canopy interactions), as well as being highly spatially and temporally variable. Thus, great care is required when using such data to inform forest policy and practice, including a need to adopt a precautionary approach until estimates can be improved and checked.

4.3. Long Term Changes in Base Cation Budgets

Rising trends in base cation balances over the 10+ years of monitoring were recorded at 7 of the 10 sites for one or more cations (Table 5). Significant rising trends were most consistent for K (four sites), where they were mainly driven by increasing K deposition (r2 = 0.275, p < 0.1, Savernake; r2 = 0.341, p < 0.05, Tummel; r2 = 0.473, p < 0.01, Llyn Brianne). This was thought to be related to repeated insect infestations at the canopy level in the latter part of the record, either by caterpillars on the oak or aphids on the spruce. Insect outbreaks were reported by [48] and would have increased K leaching in canopy throughfall and thus deposition input. A decline in K leaching also contributed to the rising trend and was the dominant driver at Rogate (r2 = 0.521, p < 0.05). Drainage volume did not change over the time period and since weathering is held constant, the decline in leaching is likely to be related to increased tree uptake. This could not be confirmed by the data as tree uptake estimates are based on the average tree growth rate at the sites and measured cation concentrations in the different parts of the trees (stems, branches, leaves) at one point in time (see Supplementary Materials Table S1).
Rising trends for Ca and Mg were strongest for Sherwood and Coalburn, where they were associated with significant declines in leaching outputs over the measurement period. This was thought to be mainly due to declining acid deposition, with the Sherwood site showing a steep recovery from historic air pollution and acidification [28,50,54]. The rising base cation balance at this site is in line with long term predictions by SAFE (1800–2100 year) [54] and MAGIC models (1990–2020 year) [48]. At Coalburn, the decline in leaching outputs may also have been due to increased tree uptake. Tree basal area increased by 35% over the monitoring period due to the strong growth of the Sitka spruce crop (although the method did not allow this to be incorporated into the tree uptake estimate).
Alice Holt was the only site to show a consistent declining trend in Ca and Mg base cation budget. This was mainly driven by declining deposition inputs (Ca, r2 = 0.562, p < 0.01; Mg, r2 = 0.412, p < 0.01), probably associated with emission control of acidic pollutants, but unlike at Sherwood and Coalburn did not result in reduced leaching losses. The declining trend is not in line with MAGIC model predictions (1980–2020) [50] and is perhaps associated with changing weather patterns affecting southern England.
Overall, soil type, geology, and tree species were the predominant factors influencing site base cation balance, while temporal changes were driven by ongoing recovery due to emission control and the effects of pest outbreaks on nutrient cycling within forest canopies. The latter are becoming increasingly common and need to be factored into model predictions. As weathering is one of the balance elements with the highest uncertainties in its estimation, sites on clay soils will have high uncertainties associated with their cation balance compared to sites on sandy podzols.

4.4. Biomass Removal Decision Support Matrix for Nutrient Sustainability

The results from the nutrient budgets shown in Figure 5, Figure 6 and Figure 7 are used to generate a simple decision matrix to inform the sustainability of brash removal on five main forest soil types (Table 6). A traffic light approach is adopted for each of three harvesting scenarios, comprising CH, WTHB and WTHG. Green represents a positive nutrient budget and therefore ‘go’, orange a variable budget with decision subject to site Yield Class, with ‘go’ if equal or less than the Yield Class threshold and ‘no-go’ if greater than the Yield Class threshold.
The matrix implies that conventional harvesting poses no issues for site nutrient sustainability for first rotation Sitka spruce on all main forest soil types, regardless of Yield Class. However, this relies on the nutrient input from the pre-existing vegetation plus a single rock phosphate fertiliser application on peaty gley and deep peat soils. For the WTHB scenario, issues mainly arise for Ca on podzolic soils (the most nutrient poor), and for K on deep peats, where brown brash can only be harvested for lower yielding stands of YC < 12 and YC < 16 respectively (Table 6). This reflects the higher base cation content of needles and branches, with brown brash comprising 15% of total tree Ca, 23% for Mg and 34% for K (Figure 2). There is no limit for WTHB extraction on mineral gleys, brown earths and peaty gleys.
As expected, the WTHG option posed the greatest issue, especially on podzols, but also on brown earths and deep peats (Table 6). This practice was not sustainable in terms of Ca balance for the harvesting of green brash from SS crops of YC > 8, YC > 20 and YC > 18 on these three soil types, respectively. WTHG is also not sustainable for Mg on deep peat for crops YC > 18 and for K for crops YC > 8. This is not surprising as the total Sitka spruce brash (branches and needles) contains 63%, 70% and 75% of total tree Ca, Mg and K, respectively (Figure 2).
The impact of WTHG has been studied at two sites in the UK—one at Kielder in England on peaty gley soils [55], and the other at Beddgelert in Wales on peaty podzols [59]. No significant differences were reported by [55] in soil Ca or Mg between WTHG and CH treatments in the Kielder study, although base cation concentrations were lower under WTHG in the upper mineral soil. This contrasted with the results of [59] at Beddgelert, who found soil Ca to be higher in the Bsg horizon of the WTH plots but lower in the organic horizon compared to CH plots. These mixed results reflect similar studies in temperate and boreal forests [5], with WTHG leading to reduced exchangeable Ca Mg and K in some mineral soils [60,61,62] but having no effect in others [63,64]. A metadata analysis by [12] found WTHG significantly lowered pH and base saturation (BS) in the forest floor, but without apparent changes in CEC. The only significant effect of WTHG in the subsoil were reductions in CEC and BS. WTHG in spruce and pine-dominated stands reduced Ca and K in the forest floor but had no effect on Mg and pH. Such studies are subject to a number of inherent limitations, including the size and spatial variability of the soil base cation pools, which makes detecting a treatment effect very difficult [5].
Our findings and resulting matrix are in line with a similar study in Ireland, which assessed the impact of CH, WTHB and WTHG on base cation balance and soil acidification for Sitka spruce (Picea sitchensis (Bong.) Carr), Norway spruce (Picea abies (L.) Karst.) and Lodgepole pine (Pinus contorta (Dougl. var. latifolia)) forests across 40 sites [65]. Under CH and WTHB, inputs were predicted to be sufficient to sustain outputs for Ca, Mg and K, while under WTHG, Ca output was greater than input at 19 of the 40 study sites. However, the difference between inputs and outputs was small relative to the size of soil Ca pools, which could support WTHG removal for a median of 220 years [65]. This contrasts with the much lower exchangeable pools in the podzolic sandy soils of some of the sites such as Rogate, Sherwood and Rannoch in our study (Table 2) and a significant positive relationship between base cation (Ca + Mg + K) balance and soil CEC, with clustering of sites with very low CEC having the lowest base cation balance (Figure 4). The base cation balance dependence on site productivity and tree uptake was also clear (Figure 5, Figure 6 and Figure 7). Our results support the restriction of brash removal from better growing stands over that of poor stands on vulnerable soils, which is simply a reflection of the greater base cation content and removal in higher yielding, harvested crops. In reality, nutrient poor soils would not support a high YC and therefore naturally constrain the scope for negative base cation budgets. However, rising CO2 and climate change have the potential to increase tree growth and exacerbate nutrient issues.
The brash harvesting matrix is based on the best dataset available for evaluating base cation budgets for UK forests, drawing on the Intensive Forest Monitoring Level II Network and biomass partition modelling for Sitka spruce. However, there are a few important caveats of note:
(1)
The base cation budgets are limited to first rotation Sitka spruce and will change for subsequent rotations, most notably in terms of the loss of the base cation input from the pre-forest vegetation. This will make the budgets less positive or more negative, although the deficit could be at least partly offset by greater soil weathering and/or organic matter mineralisation due to restock cultivation, provided these rates are sustainable.
(2)
The calculated base cation budgets are imprecise and subject to significant uncertainty, especially when applied to individual sites. Consequently, the decision matrix should be used with care and it is recommended that its application is monitored and reviewed to inform future assessments and refinement of the practice. One issue is the estimation of soil mineral weathering, which tends to dominate base cation inputs. Although several methods were used to estimate this key component, they all have high uncertainties [35]. Others found variability in weathering estimates to be too high to set thresholds for harvesting practice since the increase in base cation export due to residue harvesting was considerably smaller than the uncertainties associated with mineral weathering estimates [66]. A similar conclusion was reached by [65] in Ireland, where the high uncertainties prevented the definition of clear boundaries for separating the impact of harvest residue removal from that of CH on the base cation balance.
(3)
Another issue concerns the calculated water fluxes used to estimate base cation losses by leaching, which was based on modelled potential rather than measured actual evapotranspiration. It has been shown [67] that actual evapotranspiration by forests can be 20% lower than potential rates estimated using the Penman–Monteith equation. This suggests that our base cation losses through leaching may have been underestimated and the budget overestimated, especially on the more drought-prone sites. The error is unlikely to be large enough to turn the long-term base cation balance for any site from positive to negative (except for Mg in the case of Rogate; Table 3 and Table 4) but will make the values more negative for the most sensitive sites. This is likely to reduce the Yield Class threshold for sustainable harvesting of brown or green brash by one or two classes for the highlighted soil types. Application of a full water balance model to calculate actual evapotranspiration losses is recommended to improve the quantification of base cation leaching and resulting budgets for individual sites.
(4)
The decision matrix only considers the impact of brash removal on base cation sustainability and it is important to note and manage the risks posed to other essential nutrients such as nitrogen and phosphorus, as well as related impacts of practice on other aspects of the forest environment, including ground damage, soil acidity and soil carbon loss.

5. Conclusions

The results from our study suggest that Ca is the most limiting base cation on nutrient poor soils, where biomass harvesting could threaten sustainable forest management over time. K and Mg are also limiting on some sites. Mineral weathering dominates base cation inputs except on very acid soils, where deposition and especially marine inputs are more important. Most sites exhibited rising trends in base cation balance over time, driven by emission control of acid deposition and potentially by climatic changes such as droughts and changes in rainfall amounts and intensity. Rising CO2 and N deposition could be expected to increasingly influence tree growth and base cation uptake rates. Tree health, and especially repeated insect infestations, was found to affect the base cation balance by modifying deposition inputs and leaching outputs. Harvesting additional biomass as brash increases base cation removal and is likely to lead to depletion and potential exhaustion of soil base cation stocks on nutrient poor soils, particularly podzols and deep peats. The harvesting of green brash poses the greatest risk and could cause problems within a few forest rotations.
This study is especially valuable as it presents elemental mass balances from more than 10 years of monitoring in the ICP Forests Level II network. Long term monitoring is vital to evaluate environmental change, including the provision of data for the development, testing and evaluation of biogeochemical models and improving confidence in model predictions. Nutrient budget studies are vital for the scientific underpinning of guidelines for sustainable forest biomass extraction [68].

Supplementary Materials

The following supporting information can be downloaded at: https://www.mdpi.com/article/10.3390/app12052411/s1, Table S1: Averaged growth rate over the duration of the rotation and measured base cation concentrations used in calculating base cation uptake at the ICP Forest Level II sites in the UK.

Author Contributions

Conceptualization, E.V. and T.N.; methodology, E.V. and S.B.; validation, E.V., T.N. and S.B.; formal analysis, E.V.; investigation, E.V. and S.B.; resources, E.V., S.B. and T.N.; data curation, E.V. and S.B.; writing—original draft preparation, E.V.; visualization, E.V.; supervision, E.V.; project administration, E.V. and S.B. All authors have read and agreed to the published version of the manuscript.

Funding

This research received no external funding.

Institutional Review Board Statement

Not applicable.

Informed Consent Statement

Not applicable.

Acknowledgments

We would like to thank Forest Research for funding this research. Numerous staff from the Technical Support Unit and the Chemical Laboratory at Alice Holt are also acknowledged for collecting and analysing the water samples for over 24 years at the Level II network in the UK.

Conflicts of Interest

The authors declare no conflict of interest.

References

  1. Royo, J.; Sebastián, F.; García-Galindo, D.; Gómez, M.; Díaz, M. Large-scale Analysis of GHG (Greenhouse Gas) Reduction by Means of Biomass Co-Firing at Country-Scale: Application to the Spanish Case. Energy 2012, 48, 255–267. [Google Scholar] [CrossRef]
  2. Lauri, P.; Havlík, P.; Kindermann, G.; Forsell, N.; Böttcher, H.; Obersteiner, M. Woody Biomass Energy Potential in 2050. Energy Policy 2014, 66, 19–31. [Google Scholar] [CrossRef]
  3. Kazagic, A.; Music, M.; Smajevic, I.; Ademovic, A.; Redzic, E. Possibilities and Sustainability of “Biomass for Power” Solutions in the Case of a Coal-Based Power Utility. Clean. Technol. Environ. Pol. 2016, 18, 1675–1683. [Google Scholar] [CrossRef]
  4. Kreutzweiser, D.P.; Hazlett, P.W.; Gunn, J.M. Logging Impacts on the Biogeochemistry of Boreal Forest Soils and Nutrient Export to Aquatic Systems: A Review. Environ. Rev. 2008, 16, 157–179. [Google Scholar] [CrossRef]
  5. Thiffault, E.; Hannam, K.D.; Paré, D.; Titus, B.D.; Hazlett, P.W.; Maynard, D.G.; Brais, S. Effects of Forest Biomass Harvesting on Soil Productivity in Boreal and Temperate Forests—A Review. Environ. Rev. 2011, 19, 278–309. [Google Scholar] [CrossRef]
  6. Achat, D.; Deleuze, C.; Landmann, G.; Pousse, N.; Ranger, J.; Augusto, L. Quantifying Consequences of Removing Harvesting Residues on Forest Soils and Tree Growth—A Meta-Analysis. Ecol. Manag. 2015, 348, 124–241. [Google Scholar] [CrossRef]
  7. De Oliveira, G.W.; Amann, T.; Hartmann, J. Increasing Biomass Demand Enlarges Negative Forest Nutrient Budget Areas in Wood Export Regions. Sci. Rep. 2018, 8, 5280. [Google Scholar] [CrossRef]
  8. Akselsson, C.; Westling, O.; Sverdrup, H.; Holmqvist, J.; Thelin, G.; Uggla, E.; Malm, G. Impact of Harvest Intensity on Long-Term Base Cation Budgets in Swedish Forest Soils. Water Air Soil Pollut. Focus 2007, 7, 201–210. [Google Scholar] [CrossRef]
  9. Aherne, J.; Posch, M.; Forsius, M.; Lehtonen, A.; Härkönen, K. Impacts of Forest Biomass Removal on Soil Nutrient Status under Climate Change: A Catchment-Based Modelling Study for Finland. Biogeochemistry 2012, 107, 471–488. [Google Scholar] [CrossRef]
  10. Vangansbeke, P.; De Schrijver, A.; De Frenne, P.; Verstraeten, A.; Gorissen, L.; Verheyen, K. Strong Negative Impacts of Whole Tree Harvesting in Pine Stands on Poor, Sandy Soils: A Long-Term Nutrient Budget Modelling Approach. Ecol. Manag. 2015, 356, 101–111. [Google Scholar] [CrossRef]
  11. Knust, C.; Schua, K.; Feger, K.-H. Estimation of Nutrient Exports Resulting from Thinning and Intensive Biomass Extraction in Medium-Aged Spruce and Pine Stands in Saxony, Northeast Germany. Forests 2016, 7, 302. [Google Scholar] [CrossRef] [Green Version]
  12. Clarke, N.; Kiær, L.P.; Kjønaas, O.J.; Bárcena, T.G.; Vesterdal, L.; Stupak, I.; Finér, L.; Jacobson, S.; Armolaitis, K.; Lazdina, D.; et al. Effects of Intensive Biomass Harvesting on Forest Soils in the Nordic Countries and the UK: A Meta-Analysis. Ecol. Manag. 2020, 482, 118877. [Google Scholar] [CrossRef]
  13. Iwald, J.; Löfgren, S.; Stendahl, J.; Karltun, E. Acidifying Effect of Removal of Tree Stumps and Logging Residues as Compared to Atmospheric Deposition. Ecol. Manag. 2013, 290, 49–58. [Google Scholar] [CrossRef]
  14. McGivney, E.; Gustafsson, J.P.; Belyazid, S.; Zetterberg, T.; Löfgren, S. Assessing the Impact of Acid Rain and Forest Harvest Intensity with the HD-MINTEQ Model–Soil Chemistry of Three Swedish Conifer Sites from 1880 to 2080. Soil 2019, 5, 63–77. [Google Scholar] [CrossRef] [Green Version]
  15. Johnson, J.; Pannatier, E.G.; Carnicelli, S.; Cecchini, G.; Clarke, N.; Cools, N.; Hansen, K.; Meesenburg, H.; Nieminen, T.M.; Pihl-Karlsson, G.; et al. The Response of Soil Solution Chemistry in European Forests to Decreasing Acid Deposition. Glob. Chang. Biol. 2018, 24, 3603–3619. [Google Scholar] [CrossRef]
  16. Duval, B.D.; Blankinship Djikstra, P.; Hungate, B.A. CO2 Effects on Plant Nutrient Concentration Depend on Plant Functional Group and Available Nitrogen: A Meta-Analysis. Plant Ecol. 2012, 213, 505–521. [Google Scholar] [CrossRef]
  17. Terrer, C.; Vicca, S.; Hungate, B.A.; Phillips, R.P.; Prentice, I.C. Mycorrhizal Association as a Primary Control of the CO2 Fertilization Effect. Science 2016, 353, 72–74. [Google Scholar] [CrossRef] [Green Version]
  18. Kreutzer, K. Ecological Questions about the Full Tree Harvest. Forstw. Cbl. 1979, 98, 298–308. [Google Scholar] [CrossRef]
  19. Bormann, F.H.; Likens, G.E. Nutrient Cycling. Science 1967, 155, 424–429. [Google Scholar] [CrossRef]
  20. Kolka, R.K.; Grigal, D.F.; Nater, E.A. Forest Soil Mineral Weathering Rates: Use of Multiple Approaches. Geoderma 1996, 73, 1–21. [Google Scholar] [CrossRef]
  21. Ouimet, R.; Duchesne, L. Base Cation Mineral Weathering and Total Release from Soils in Three Calibrated Forest Watersheds on the Canadian Boreal Shield. Can. J. Soil Sci. 2005, 85, 245–260. [Google Scholar] [CrossRef] [Green Version]
  22. Futter, M.; Klaminder, J.; Lucas, R.W.; Laudon, H.; Köhler, S.J. Uncertainty in Silicate Mineral Weathering Rate Estimates: Source Partitioning and Policy Implications. Environ. Res. Lett. 2012, 7, 024025. [Google Scholar] [CrossRef]
  23. Vadeboncoeur, M.A.; Hamburg, S.P.; Yanai, R.D.; Blum, J.D. Rates of Sustainable Forest Harvest Depend on Rotation Length and Wathering of Soil Minerals. Ecol. Manag. 2014, 318, 194–205. [Google Scholar] [CrossRef] [Green Version]
  24. Lucas, R.W.; Holmström, H.; Lämås, T. Intensive Forest Harvesting and Pools of Base Cations in Forest Ecosystems: A Modeling Study Using the Heureka Decision Support System. Ecol. Manag. 2014, 325, 26–36. [Google Scholar] [CrossRef]
  25. Van Breemen, N.; Mulder, J.; Driscoll, C.T. Acidification and Alkalinization of Soils. Plant Soil 1983, 75, 283–308. [Google Scholar] [CrossRef]
  26. Akselsson, C.; Belyazid, S. Critical Biomass Harvesting—Applying a New Concept for Swedish Forest Soils. Ecol. Manag. 2018, 409, 67–73. [Google Scholar] [CrossRef] [Green Version]
  27. Vanguelova, E.I.; Barsoum, N.; Benham, S.; Broadmeadow, M.; Moffat, A.; Nisbet, T.; Pitman, R. Ten Years of Intensive Environmental Monitoring of British Forests. For. Comm. Inf. Note 2007, 88, 11. [Google Scholar]
  28. Vanguelova, E.I.; Benham, S.; Pitman, R.; Moffat, A.; Broadmeadow, M.; Nisbet, T.; Durrant, D.; Barsoum, N.; Wilkinson, M.; Bochereau, F.; et al. Chemical Fluxes in Time through Forest Ecosystems in the UK–Soil Response to Pollution Recovery. Environ. Pollut. 2010, 158, 1857–1869. [Google Scholar] [CrossRef] [PubMed]
  29. Sverdrup, H.; Warfvinge, P. Calculating Field Weathering Rates Using a Mechanistic Geochemical Model PROFILE. Appl. Geochem. 1993, 8, 273–283. [Google Scholar] [CrossRef]
  30. Clarke, N.; Žlindra, D.; Ulrich, E.; Mosello, R.; Derome, J.; Derome, K.; König, N.; Lövblad, G.; Draaijers, G.P.J.; Hansen, K.; et al. Part XIV: Sampling and Analysis of Deposition. In Manual on Methods and Criteria for Harmonized Sampling, Assessment, Monitoring and Analysis of the Effects of Air Pollution on Forests; UNECE ICP Forests Programme Co-Ordinating Centre, Ed.; Thünen Institute of Forest Ecosystems: Eberswalde, Germany, 2020; p. 32. Available online: http://www.icpforests.org/Manual.htm (accessed on 2 February 2022)ISBN 978–3-86576–162–0.
  31. Ulrich, B. Interaction at forest canopies with atmospheric constituents: SO2, Alkali and Earth Alkali Cations and Chloride. In Effects of Accumulation of Air Pollutants in Forest Ecosystems; Ulrich, B., Pankrath, J., Eds.; Reidel: Dordrecht, The Netherlands, 1983; pp. 33–45. [Google Scholar]
  32. Brunauer, S.; Emmett, P.H.; Teller, E. Adsorption of Gases in Multimolecular Layers. J. Am. Chem. Soc. 1938, 60, 309–319. [Google Scholar] [CrossRef]
  33. Naderi, M. Chapter Fourteen-Surface Area: Brunauer–Emmett–Teller (BET). In Progress in Filtration and Separation; Steve, T., Ed.; Academic Press: Cambridge, MA, USA, 2015; pp. 585–608. ISBN 9780123847461. [Google Scholar]
  34. Kennedy, F.; Rowell, D.; Singh, B.; Moffat, A. The Use of Soil Mineral Weathering Rates in the Calculation of Critical Loads of Sulphur Deposition Using the Simple Mass Balance equation. In Proceedings of the ISSS 16th World Soils Congress, Montpellier, France, 20–26 August 1998. [Google Scholar]
  35. Kennedy, F.; Rowell, D.; Moffat, A.J.M.; Singh, B. An Analysis of the Structure of the Simple Mass Balance Equation-Implications for Testing National Critical Loads Maps. Water Air Soil Pollut. Focus 2001, 1, 281–298. [Google Scholar] [CrossRef]
  36. Taylor, C.M.A. Forest Fertilisation in Britain; Forestry Commission Bulletin 95: London, UK, 1991. [Google Scholar]
  37. Nieminen, T.M.; De Vos, B.; Cools, N.; König, N.; Fischer, R.; Iost, S.; Meesenburg, H.; Nicolas, M.; O’Dea, P.; Cecchini, G.; et al. Part XI: Soil Solution Collection and Analysis. In Manual on Methods and Criteria for Harmonized Sampling, Assessment, Monitoring and Analysis of the Effects of Air Pollution on Forests; UNECE ICP Forests Programme Co-Ordinating Centre, Ed.; Thünen Institute of Forest Ecosystems: Eberswalde, Germany, 2016; p. 20. Available online: http://www.icp-forests.org/manual.htm (accessed on 2 February 2022)ISBN 978–3-86576–162–0.
  38. Monteith, J.; Unsworth, M. Principles of Environmental Physics, 3rd ed.; Academic Press: Burlington, MA, USA, 2008. [Google Scholar]
  39. Hough, M.N.; Jones, R.J.A. The United Kingdom Meteorological Office Bulk Precipitation and Evaporation Calculation System: MORECS Version 2.0-an Overview. Hydrol. Earth Syst. Sci. 1997, 1, 227–239. [Google Scholar] [CrossRef]
  40. Freer-Smith, P.H.; Kennedy, F. Base Cation Removal in Harvesting and Biological Limit Terms for Use in the Simple Mass Balance Equation to Calculate Critical Loads for Forest Soils. Water Air Soil Pollut. 2003, 145, 409–427. [Google Scholar] [CrossRef]
  41. Matthews, R.W.; Duckworth, R.R. BSORT: A Model of Tree and Stand Biomass Development and Production in Great Britain. In Proceedings of the World Renewable Energy Congress (WREC 2005), Aberdeen, UK, 22–27 May 2005; Imbabi, M.S., Mitchell, C.P., Eds.; Elsevier: Oxford, UK, 2005; pp. 404–409. Available online: https://www.forestresearch.gov.uk/documents/2785/BSORT.pdf (accessed on 2 February 2022).
  42. Jenkins, T.A.R.; Mackie, E.D.; Matthews, R.W.; Miller, G.; Randle, T.J.; White, M.E. FC Woodland Carbon Code: Carbon Assessment Protocol; Forestry Commission: Edinburgh, UK, 2014. Available online: www.forestry.gov.uk/carboncode (accessed on 2 February 2022).
  43. Forest Research. Forestry Statistics 231; Corstorphine Road: Edinburgh, UK, 2021. Available online: https://www.forestresearch.gov.uk/tools-and-resources/statistics/forestry-statistics/ (accessed on 2 February 2022).
  44. Reynolds, B.; Stevens, P.A.; Adamson, J.K.; Hughes, S.; Roberts, J.D. Effects of Clearfelling on Stream and Soil Water Aluminium Chemistry in Three UK Forests Environmental Pollution; Elsevier: Amsterdam, The Netherlands, 1992; Volume 77, pp. 157–165. [Google Scholar]
  45. Mannerkoski, H.; Finér, L.; Piirainen, S.; Starr, M. Effects of Clear-Cutting and Site Preparation on the Level and Quality of Groundwater in Some Headwater Catchments in Eastern Finland. For. Ecol. Manag. 2005, 220, 107–117. [Google Scholar] [CrossRef]
  46. Aherne, J.; Farrell, E.P. Deposition of Sulphur, Nitrogen and Acidity in Precipitation Over Ireland: Chemistry, Spatial Distribution and Long-Term Trends. Atmos. Environ. 2002, 36, 1379–1389. [Google Scholar] [CrossRef]
  47. Guerrieri, R.; Vanguelova, E.I.; Michalski, G.; Heaton, T.H.E.; Mencuccini, M. Isotopic Evidence for the Occurrence of Biological Nitrification and Nitrogen Deposition Processing in Forest Canopies. Glob. Chang. Biol. 2015, 21, 4613–4626. [Google Scholar] [CrossRef] [Green Version]
  48. Pitman, R.; Vanguelova, E.I.; Benham, S. Effects of Phytophagous Insects on the Nutrient Concentrations and Fluxes through Forest Stands in the UK Level II Network. Sci. Total Environ. 2010, 409, 169–181. [Google Scholar] [CrossRef]
  49. Sawicka, D.E.; Monteith, D.T.; Vanguelova, E.I.; Wade, A.J.; Clark, J.M. Fine-Scale Temporal Characterization of Trends in Soil Water Dissolved Organic Carbon and Potential Drivers. Ecol. Indic. 2016, 68, 35–51. [Google Scholar] [CrossRef] [Green Version]
  50. Sawicka, K.; Rowe, E.; Evans, C.; Monteith, D.; Vanguelova, E.I.; Wade, A.; Clark, J.M. Modelling Impacts of Atmospheric Deposition and Temperature on Long-Term DOC Trends. Sci. Total Environ. 2016, 578, 323–336. [Google Scholar] [CrossRef] [Green Version]
  51. RoTAP. Review of Transboundary Air Pollution: Acidification, Eutrophication, Ground Level Ozone and Heavy Metals in the UK Contract Report to Defra; Centre for Ecology and Hydrology (CEH): Penicuik, UK, 2012. [Google Scholar]
  52. Sutton, M.A.; Howard, C.M.; Erisman, J.W.; Billen, G.; Bleeker, A.; Grennfelt, P.; van Grinsven, H.; Grizzetti, B. The European Nitrogen Assessment; Cambridge University Press: Cambridge, UK, 2011; Available online: http://go.nature.com/5n9 (accessed on 2 February 2022).
  53. Sutton, M.A.; Oenema, O.; Erisman, J.W.; Leip, A.; van Grinsven, H.; Winiwarter, W. Too much of a Good Thing? Nature 2015, 472, 159–161. [Google Scholar] [CrossRef] [Green Version]
  54. Langan, S.; Fransson, L.; Vanguelova, E. Dynamic Modelling of UK Forest Soils to Changes in Acid Deposition Using the SAFE Model. Sci. Total Environ. 2009, 407, 5605–5619. [Google Scholar] [CrossRef] [PubMed]
  55. Vanguelova, E.; Pitman, R.; Luiro, J.; Helmisaari, H.S. Long Term Effects of Whole Tree Harvesting on Soil Carbon and Nutrient Sustainability in the UK. Biogeochemistry 2010, 101, 43–59. [Google Scholar] [CrossRef]
  56. Reynolds, B.; Wood, M.J.; Truscott, A.M.; Williams, D.L. Cycling of Nutrient Base Cations in a Twelve Year Old Sitka Spruce Plantation in Upland Mid-Wales. Hydrol. Earth Syst. Sci. 2000, 4, 311–321. [Google Scholar] [CrossRef] [Green Version]
  57. Reynolds, B.; Stevens, P.A. Assessing Soil Calcium Depletion Following Growth and Harvesting of Sitka Spruce Plantation Forestry in the Acid Sensitive Welsh Uplands. Hydrol. Earth Syst. Sci. Discuss. 1998, 2, 345–352. [Google Scholar] [CrossRef]
  58. Roberts, J.; Rosier, P. The Impact of Broadleaved Woodland on Water Resources in Lowland UK: I. Soil Water Changes below Beech Woodland and Grass on Chalk Sites in Hampshire. Hydrol. Earth Syst. Sci. Discuss. 2005, 9, 596–606. [Google Scholar] [CrossRef] [Green Version]
  59. Walmsley, J.; Jones, D.; Reynolds, B.; Price, M.; Healey, J. Whole Tree Harvesting Can Reduce Second Rotation Forest Productivity. For. Ecol. Manag. 2009, 257, 1104–1111. [Google Scholar] [CrossRef]
  60. Olsson, B.A.; Bengtsson, J.; Lundkvist, H. Effects of Different Forest Harvest Intensities on the Pools of Exchangeable Cations in Coniferous Forest Soils. For. Ecol. Manag. 1996, 84, 135–147. [Google Scholar] [CrossRef]
  61. Johnson, D.W.; Todd, D.E. Harvesting Effects on Long-Term Changes in Nutrient Pools of Mixed Oak Forest. Soil Sci. Soc. Am. J. 1998, 62, 1725–1735. [Google Scholar] [CrossRef]
  62. Bélanger, N.; Paré, D.; Yamasaki, S.H. The Soil Acid Base Status of Boreal Black Spruce Stands after Whole-Tree and Stem-only Harvesting. Can. J. For. Res. 2003, 33, 1874–1879. [Google Scholar] [CrossRef]
  63. Belleau, A.; Brais, S.; Paré, D. Soil Nutrient Dynamics after Harvesting and Slash Treatments in Boreal Aspen Stands. Soil Sci. Soc. Am. J. 2006, 70, 1189–1199. [Google Scholar] [CrossRef]
  64. Thiffault, E.; Paré, D.; Bélanger, N.; Munson, A.; Marquis, F. Harvesting Intensity at Clear-Felling in the Boreal Forest. Soil Sci. Soc. Am. J. 2006, 70, 691–701. [Google Scholar] [CrossRef]
  65. Johnson, J.; Aherne, J.; Cummins, T. Base Cation budgets under Residue Removal in Temperate Maritime Plantation Forests. For. Ecol. Manag. 2015, 343, 144–156. [Google Scholar] [CrossRef]
  66. Klaminder, J.; Lucas, R.; Futter, M.; Bishop, K.; Köhler, S.; Egnell, G.; Laudon, H. Silicate Mineral Weathering Rate Estimates: Are they Precise enough to Be Useful when Predicting the Recovery of Nutrient Pools after Harvesting? For. Ecol. Manag. 2011, 261, 1–9. [Google Scholar] [CrossRef]
  67. Hammel, K.; Kennel, M. Charakterisierung und Analyse der Wasserverfügbarkeit und des Wasserhaushalts von Waldstandorten in Bayern mit dem Simulationsmodell Brook90; Forstliche Forschungsberichte München 185: Munich, Germany, 2001. [Google Scholar]
  68. Titus, B.D.; Brown, K.; Helmisaari, H.-S.; Vanguelova, E.; Stupak, I.; Evans, A.; Clarke, N.; Guidi, C.; Bruckman, V.J.; Varnagiryte-Kabasinskiene, I.; et al. Sustainable Forest Biomass: A Review of Current Residue Harvesting Guidelines. Energy Sustain. Soc. 2021, 11, 10. [Google Scholar] [CrossRef]
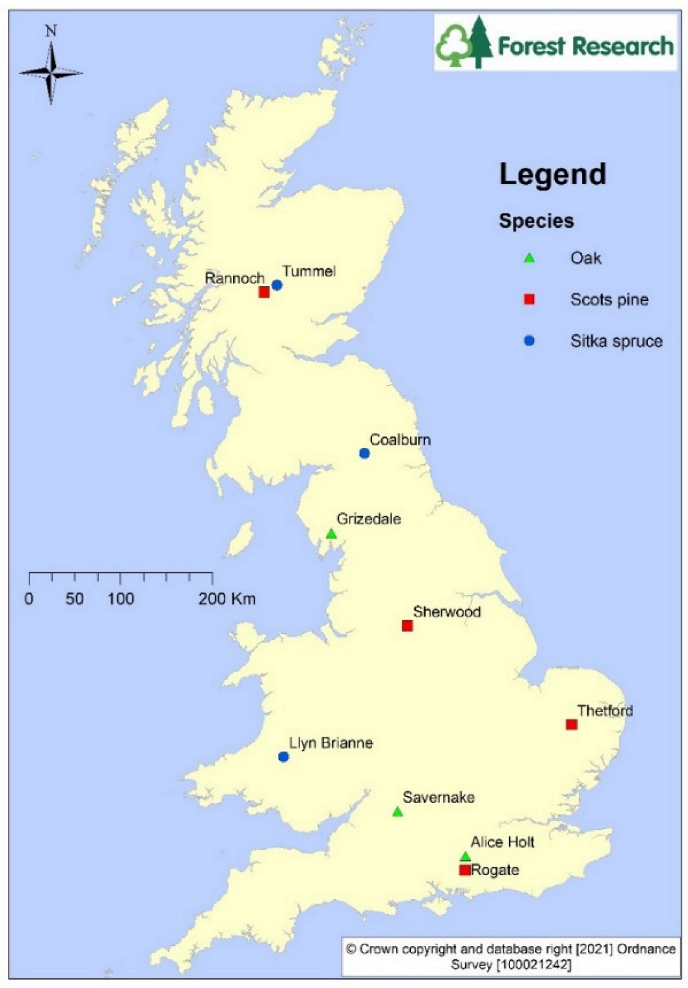
Figure 1. Location of ICP Forest Level II sites in the UK.
Applsci 12 02411 g001
Figure 2. Base cation (Ca, Mg and K) stocks in the biomass of the different tree components for Sitka spruce. Biomass is modelled by the BSort biomass partitioning model and cation concentration measured from the ICP Forest Level II monitoring network’s three Sitka spruce sites.
Applsci 12 02411 g002
Figure 3. Calcium leaching flux at shallow (10 cm depth) and deeper (50 cm depth) soil depths at the ten ICP Forest Level II monitoring sites.
Applsci 12 02411 g003
Figure 4. Linear relationship between total base cation (Ca + Mg + K) budget and soil cation exchange capacity (CEC) at the ICP Forest Level II monitoring sites (n = 10, r2 = 0.89, p < 0.001).
Applsci 12 02411 g004
Figure 5. Forest Ca budget for Sitka spruce first rotation, YC 6-24, on six main forest soil types.
Applsci 12 02411 g005
Figure 6. Forest Mg budget for Sitka spruce first rotation, YC 6-24, on five main forest soil types.
Applsci 12 02411 g006
Figure 7. Forest K budget for Sitka spruce first rotation, YC 6-24, on five main forest soil types.
Applsci 12 02411 g007
Table 1. Site and climatic characteristics of 10 Intensive Forest Monitoring Level II sites in the UK. Basal area was measured in 1995. Averaged annual rainfall, temperature and total nitrogen and sulphur deposition over the monitoring period at the sites are reported.
Site NameTree SpeciesMonitoring PeriodPrevious VegetationPlanting YearBasal Area (m2 ha–1)Elevation (m)Slope (%)Rain (mm)T (°C)N dep
kg ha−1y−1
S dep
kg ha−1y−1
Alice HoltOak1996–2019Woodland193527.380066211.69.87.6
SavernakeOak1996–2005Woodland195018.0107179611.312.710.9
GrizedaleOak1996–2006Woodland192023.51153018009.513.914.2
ThetfordScots pine1996–2019Heathland196735.720160011.313.67.5
SherwoodScots pine1996–2005Grassland195238.12652212009.818.617.6
RannochScots pine1996–2010Moorland196547.847025–3011618.54.84.8
RogateScots pine2010–2019Heathland195037.880066211.410.74.1
CoalburnSitka spruce1996–2019Moorland197491.1300114009.010.28.3
TummelSitka spruce1996–2006Grassland196965.04006–1011007.54.86.4
Llyn BrianneSitka spruce2010–2014Moorland197385.445020210010.18.99.7
Table 2. Soil type and soil horizon related pH, carbon (C), nitrogen (N), cation exchange capacity (CEC by BaCl2 extraction method) and base saturation (BS) of 10 Intensive Forest Monitoring Level II sites in the UK. Soil characteristics are shown only for the two horizons for each plot where the soil solution samplers are situated.
Site NameSoil Type (FAO)Soil HorizonSoil pH (H2O)C%N%Soil CEC cmol c kg–1Soil BS%
Alice HoltEutric vertisolAh5.42.690.5623.1095
BCg6.21.080.02725.8396
SavernakeEutric vertisolE4.73.470.13815.7322
2BCtg6.21.210.06823.1599
GrizedaleCambic podzolAh4.38.270.45612.929
Bs5.15.010.2796.717
ThetfordFerralic arenosolAh5.31.980.4824.9392
Bw7.00.310.2853.2399
SherwoodCabric podzolAh4.12.690.1616.514
BC4.51.370.0642.587
RannochGleyic podzolE4.23.870.11110.039
Bs4.83.420.0822.3513
RogateHumic PodzolE4.32.900.1032.5736
Bs4.41.300.0411.3616
CoalburnUmbric gleysolAh(g)4.06.520.35717.466
Bg3.81.660.06012.4133
TummelFerric podzolAh5.12.50.1856.352
Bs5.90.40.0270.954
Llyn BrianneUmbric gleysolA4.04.440.2916.363
Bg4.33.510.0513.182
Table 3. ICP Forest Level II site-specific input and output base cation (Ca, Mg and K) fluxes (kg ha−1y−1) based on >10 years long term monitoring datasets: average annual flux for each base cation (a) and expressed as a proportion (%) of the total (b). The Level II sites were not thought to have been fertilised, while the age and/or nature of the woodland plus management made it less appropriate to include base cation inputs from the pre-existing vegetation or enhanced leaching by clearfelling. However, these processes are included in the harvesting scenarios presented in Figure 5, Figure 6 and Figure 7.
(3a)
Deposition
Ca
kg ha−1y−1
Weathering
Ca
kg ha−1y−1
Leaching
Ca
kg ha−1y−1
Tree Uptake
Ca
kg ha−1y−1
Deposition
Mg
kg ha−1y−1
Weathering
Mg
kg ha−1y−1
Leaching
Mg
kg ha−1y−1
Tree Uptake
Mg
kg ha−1y−1
Site (Tree species)Soil type (WRB, 2016)
Alice Holt (Oak)Eutric Vertisol5.75199.7727.7110.742.5363.737.891.15
Savernake (Oak)Eutric Vertisol5.89199.7738.459.112.1591.1113.730.81
Grizedale (Oak)Cambic Podzol5.7613.718.534.896.0381.1310.120.70
Thetford (Scots pine)Ferralic Arenosol3.97185.14159.725.541.992.603.841.12
Sherwood (Scots pine)Cambic Podzol7.772.858.394.064.2713.274.040.61
Rannoch (Scots pine)Gleyic Podzol2.202.033.604.082.422.603.581.17
Rogate (Scots pine)Podzol4.392.545.293.283.552.963.520.55
Coalburn (Sitka spruce)Umbric gleysol4.01102.2038.557.992.9454.456.081.25
Tummel (Sitka spruce)Ferric Podzol2.5492.5039.886.162.0113.278.260.96
Llyn Brianne (Sitka spruce)Umbric gleysol5.984.980.724.587.6754.454.311.28
Deposition
K
kg ha−1y−1
Weathering
K
kg ha−1y−1
Leaching
K
kg ha−1y−1
Tree Uptake
K
kg ha−1y−1
Site (Tree species)Soil type (WRB, 2016)
Alice Holt (Oak)Eutric Vertisol4.44211.501.256.00
Savernake (Oak)Eutric Vertisol4.86287.711.364.67
Grizedale (Oak)Cambic Podzol6.84125.288.033.60
Thetford (Scots pine)Ferralic Arenosol3.621.450.783.44
Sherwood (Scots pine)Cambic Podzol6.3544.012.982.47
Rannoch (Scots pine)Gleyic Podzol2.691.391.533.01
Rogate (Scots pine)Podzol4.471.696.542.35
Coalburn (Sitka spruce)Umbric gleysol4.38103.740.786.82
Tummel (Sitka spruce)Ferric Podzol3.0744.010.865.97
Llyn Brianne (Sitka spruce)Umbric gleysol6.92103.740.726.75
(3b)
% of Inputs
Deposition
Ca
% of Inputs
Weathering
Ca
% Outputs
Leaching
Ca
% Outputs
Tree Uptake
Ca
% of Inputs
Deposition
Mg
% of Inputs
Weathering
Mg
% Outputs
Leaching
Mg
% Outputs
Tree Uptake
Mg
Site (Tree species)Soil type (WRB, 2016)
Alice Holt (Oak)Eutric Vertisol39772284968713
Savernake (Oak)Eutric Vertisol3978119298946
Grizedale (Oak)Cambic Podzol30706436793946
Thetford (Scots pine)Ferralic Arenosol29897343577723
Sherwood (Scots pine)Cambic Podzol7327673324768713
Rannoch (Scots pine)Gleyic Podzol5248475348527525
Rogate (Scots pine)Podzol6337623855458614
Coalburn (Sitka spruce)Umbric gleysol49683175958317
Tummel (Sitka spruce)Ferric Podzol397871313879010
Llyn Brianne (Sitka spruce)Umbric gleysol5545148612887723
average (%)2971673321798515
% of Inputs
Deposition
K
% of Inputs
Weathering
K
% Outputs
Leaching
K
% Outputs
Tree Uptake
K
Site (Tree species)Soil type (WRB, 2016)
Alice Holt (Oak)Eutric Vertisol2981783
Savernake (Oak)Eutric Vertisol2982377
Grizedale (Oak)Cambic Podzol5956931
Thetford (Scots pine)Ferralic Arenosol71291882
Sherwood (Scots pine)Cambic Podzol13875545
Rannoch (Scots pine)Gleyic Podzol66343466
Rogate (Scots pine)Podzol73277426
Coalburn (Sitka spruce)Umbric gleysol4961090
Tummel (Sitka spruce)Ferric Podzol7931387
Llyn Brianne (Sitka spruce)Umbric gleysol6941090
average (%)25753268
Table 4. Base cation budgets (kg ha−1 y−1) for each ICP Forest Level II site based on long term (>10 years) monitoring datasets. Mass balances in bold are negative, indicating a net loss of base cations from the forest ecosystem. The Level II sites were not thought to have been fertilised, while the age and/or nature of the woodland plus management made it less appropriate to include base cation inputs from the pre-existing vegetation or enhanced leaching by clear-felling.
Long Term Base Cation Mass Balance
CaMgKTotal (Ca + Mg + K)
Site Tree SpeciesSoil Type (WRB, 2016)kg ha−1y−1kg ha−1y−1kg ha−1y−1kg ha−1y−1
Alice Holt OakEutric Vertisol167.0757.22208.68432.96
Savernake OakEutric Vertisol158.0978.72286.54523.35
Grizedale OakCambic Podzol6.0576.33120.49202.87
ThetfordScots pineFerralic Arenosol23.84–0.380.8524.32
SherwoodScots pineCambic Podzol–1.8412.8944.9155.96
RannochScots pineGleyic Podzol–3.440.27–0.46–3.64
Rogate Scots pinePodzol–1.642.44–2.73–1.93
Coalburn Sitka spruceUmbric gleysol59.6950.05100.51210.26
Tummel Sitka spruceFerric Podzol48.996.0540.2595.30
Llyn Brianne Sitka spruceUmbric gleysol5.6656.52103.19165.37
Table 5. Temporal trend analysis for base cation budgets at all ten ICP Forest Level II sites. Linear regressions between cation budgets and time were tested and r2 and p values are shown. Decreasing trends are highlighted in light grey and increasing trends in dark grey. Significant trends at p < 0.05 are highlighted in bold and marginally significant trends at p < 0.1 are also underlined.
Decreasing Trend Long Term Linear Trends
Increasing Trend CaMgK
Site (Tree Species) (Years of Monitoring)Soil Type (WRB, 2016)kg ha−1y−1kg ha−1y−1kg ha−1y−1
Alice Holt (Oak) (24 years)Eutric Vertisolr2 = 0.24 (p < 0.01)r2 = 0.14 (p = 0.068)r2 = 0.03 (p = 0.392)
Savernake (Oak) (10 years)Eutric Vertisolr2 = 0.01 (p = 0.906)r2 = 0.01 (p = 0.915)r2 = 0.34 (p = 0.051)
Grizedale (Oak) (11 years)Cambic Podzolr2 = 0.03 (p = 0.281)r2 = 0.08 (p = 0.383)r2 = 0.17 (p = 0.213)
Thetford (Scots pine) (24 years)Ferralic Arenosolr2 = 0.01 (p = 0.802)r2 = 0.04 (p = 0.441)r2 = 0.05 (p = 0.293)
Sherwood (Scots pine) (10 years)Cambic Podzolr2 = 0.25 (p = 0.09)r2 = 0.30 (p = 0.076)r2 = 0.15 (p = 0.231)
Rannoch (Scots pine) (10 years)Gleyic Podzolr2 = 0.09 (p = 0.689)r2 = 0.04 (p = 0.787)r2 = 0.09 (p = 0.689)
Rogate (Scots pine) (10 years)Podzolr2 = 0.16 (p = 0.246)r2 = 0.02 (p = 0.676)r2 = 0.60 (p < 0.001)
Coalburn (Sitka spruce) (15 years)Umbric gleysolr2 = 0.61 (p < 0.001)r2 = 0.64 (p < 0.001)r2 = 0.015 (p = 0.637)
Tummel (Sitka spruce) (10 years)Ferric Podzolr2 = 0.02 (p = 0.791)r2 = 0.12 (p = 0.361)r2 = 0.35 (p = 0.072)
Llyn Brianne (Sitka spruce) (24 years)Umbric gleysolr2 = 0.04 (p = 0.409)r2 = 0.02 (p = 0.500)r2 = 0.28 (p = 0.020)
Table 6. Biomass removal decision matrix. The numbers represent forest Yield Class. A traffic light approach is adopted for each of three harvesting scenarios, comprising CH, WTHB and WTHG. Green represents a positive nutrient budget and therefore ‘go’ and orange a variable budget with the decision subject to site Yield Class, with ‘go’ if equal or less than the Yield Class threshold and ‘no go’ if greater than the Yield Class threshold.
Nutrient Budgets
CaMgK
Harvesting regimeCHWTHBWTHGCHWTHBWTHGCHWTHBWTHG
Soil type
Gleys (surface and ground water)
Brown Earths ≤20
Podzols/Ironpans <12≤8
Peaty gleys on Ca-rich geology
Peaty gleys on acid geology
Deep peats <18 ≤18 <16<8
Publisher’s Note: MDPI stays neutral with regard to jurisdictional claims in published maps and institutional affiliations.