Abstract
Objective: Hypertensive nephroangiosclerosis (HN) represents the second most common cause of chronic kidney disease. Kidney damage secondary to high blood pressure favors the appearance of serum and urinary changes, but also imaging, highlighted by ultrasonography (B-mode, Doppler, Acoustic Radiation Force Impulse Elastography). Acoustic Radiation Force Impulse Elastography (ARFI) represents a new imagistic method which characterizes renal stiffness in the form of shear wave velocity (SWV). Aim: This study aims to investigate renal stiffness in HN patients, and to assess the correlations between it and urinary albumin/creatinine ratio (UACR), estimated glomerular filtration rate (eGFR), and intrarenal resistive index (RRI). Material and Methods: This cross-sectional study was performed on a group of 80 HN patients and 50 healthy, sex and age-matched, as controls. UACR (urinary immunoturbidimetry), eGFR (Jaffe method), RRI, and renal SWV (Siemens Acuson 2000) were determined in all patients and controls. Data were expressed as mean ± standard deviation. Statistical analysis was done by means Pearson’s test and t-Student test, p values of less than 0.05 were considered statistically significant. Results: UACR, eGFR, RRI and SWV showed statistically significant differences between the HN patients and controls (p < 0.0001). In the hypertensive patients group, statistically significant correlations were observed between the SWV and UACR (r = −0.7633, p < 0.00001), eGFR (r = 0.7822, p = 0.00001), and RRI (r = −0.7978, p = 0.00001). Conclusions: Kidney sonoelastography characterizes imagistically the existence of intrarenal lesions associated with essential hypertension, offering a new diagnosis method for these patients.
1. Introduction
Hypertensive nephroangiosclerosis (HN) represents the renal involvement secondary to the long-term evolution of arterial hypertension, being the second or third most common cause of renal replacement therapy in Europe, USA, respective in Japan [1,2,3]. The epidemiological data revealed that the HN incidence had increased both in Europe and in United States of America in the last 20 years. About 15% in Europe, respective 28% in United States of America of new cases with end-stage renal disease had HN as an etiology [4,5].
Mahmoodi et al. demonstrated an existence of a strong relationship between high blood pressure, renal involvement and cardiovascular disease [6]. On the other side, microalbuminuria and macroalbuminuria represent the important risk factors for cardiovascular events [7], and for the progression of renal involvement to chronic kidney disease [8].
In current medical practice, the diagnosis of HN is established on a clinical examination and laboratory tests, only a small proportion of patients benefit from histopathological examination. Therefore, epidemiological data vary widely between different medical centers (in Europe, between 5 and 33% of ESRD cases have as etiology HN) [5].
Hypertension-induced kidney damage involves vasculature, glomeruli, and tubulointerstitium. Intrarenal arteries show progressive intimal thickening and fibrosis, caused by collagen deposition, and, media thickening, attributable to smooth muscle cell hyperplasia. Afferent arterioles present a process of hyalinization. Glomerular involvement is heterogeneous: normal morphology, ischemic, obliterated glomeruli, with collapsed capillaries, or others hypertrophied. Another hallmark of hypertensive kidney injury is tubular atrophy, associated with interstitial fibrosis. These histological changes have a progressive evolution, from asymptomatic organ damage to symptomatic organ damage, with chronic kidney disease appearance. But this evolution may be slowed, if the kidney involvement is diagnosed early and the patients receive an appropriate treatment [4,9].
These renal morphological changes have an impact on renal function. Increased albuminuria and reduced glomerular filtration rate are the first changes that define the incipient kidney damage in HN [9]. But besides serum and urinary biomarkers, ultrasonographic investigations (B-mode and Doppler) play an important role in the diagnosis of HN. B-mode ultrasound evaluates the kidney position and the morphology (kidney length, parenchyma thickness and echogenicity). But, unfortunately, ultrasonographic changes appear late in the disease evolution [4,9,10]. Through colour duplex Doppler and power Doppler ultrasound, the renal and intrarenal vascularization (arterial and venous) are estimated, providing information about the kidney function [11,12].
All the morphological abnormalities of the kidneys listed above can cause elastic compliance changes, determined by a new ultrasonographic method, known as Acoustic Radiation Force Impulse Elastography (ARFI), as shear wave velocity (SWV). In ARFI, the acoustic pulses emitted by the transducer generate micrometric displacements (1–20 μm) in the examined tissue. The square region of interest (ROI) is used to measure micrometric displacements. The displacement generates the shear waves, which propagate away from the ROI and are captured by the same transducer, displaying them as m/s. ARFI technique has many advantages over other elastographic methods. First, it is not operator-dependent. Another advantage of the ARFI technique is that it is not based on transducer compression. By using ARFI, the deep organs, like kidneys, can be successfully examined [13,14,15].
The aim of this study is to investigate the kidney SWV in patients with HN, and to establish the correlations between SWV and UACR, eGFR, and RRI.
2. Material and Methods
2.1. Patients
This cross-sectional study was performed in the Department of Internal Medicine, Timișoara, Romania between July and September 2019 on a group of 80 patients with HN and 50 healthy subjects, used for matching, as controls.
HN was diagnosed based on the following criteria: essential hypertension, having a period of evolution over 5 years before the proteinuria development, mild to moderate persistent proteinuria, normal or minimal changes of urinary sediment, hypertensive retinopathy, left ventricular hypertrophy, exclusion of other primary or secondary kidney diseases [9,16]. Exclusion criteria were represented by: age under 18 years, patients’ refusal to participate in this study, pregnancy, breast feeding women, secondary hypertension of any etiology, primary or secondary kidney diseases, cardiovascular diseases. The controls were selected among the healthy subjects, who have periodically checked their health. The controls presented normal values of arterial blood pressure, normal renal structure and function, and no risk factors for chronic kidney disease (diabetes mellitus, collagen-vascular diseases, inflammatory systemic diseases, urinary tract infections, heart diseases). All the participants signed the informed consent. This study was approved by the Ethics Committee of Railway Clinical Hospital Timișoara, Romania, with registration number 137/July 2019. This study respected the Declaration of Helsinki.
All the patients and controls underwent clinical examinations, laboratory tests (serum and urinary creatinine, albuminuria, estimated glomerular filtration rate), renal ultrasonographic examinations (gray scale, Doppler, ARFI).
2.2. Methods
Serum and urinary creatinine were performed using colorimetric enzymatic Jaffe method (normal values of serum creatinine being between 0.6–1.1 mg/dL), and glomerular filtration rate (eGFR) was estimated by MDRD formula (http://www.mdrd.com (accessed on 27 September 2019)) (normal values over 90 mL/min/1.73 m2).
Albuminuria was determined from the first matinal voiding (immunoturbidimetric method). It was expressed as urinary albumin/creatinine ratio (UACR). Microalbuminuria was defined as UACR ≥ 30–299 mg/g, and macroalbuminuria as UACR ≥ 300 mg/g [17].
The retinal microvascular changes were assessed by means of funduscopy. It was used the Mitchell-Wong classification systems for the hypertensive retinopathy [18].
Renal ultrasonography was performed in all the participants, using SIEMENS ACUSON A2000 with 3.5 MHz convex transducer, by two operators (A.C. and A.M.). The participants in this study were in fasting conditions for at least 6 h. RRI was determinated in the interlobar arteries at the lower pole, at the middle level of the kidney, as well as in the upper pole of each kidney in the lateral decubitus or prone position. Color gain and the pulse repetition frequency were adjusted individually in order to avoid the aliasing phenomenon. The Doppler angle was set below 60° with respect to the long axis of the interlobar artery. The mean value of RRI of both kidneys was recorded. In healthy kidney, the normal RRI value is less than 0.70 [11,12]. Then, ARFI was performed, keeping the same position of the participants. Using the conventional ultrasonographic image, region of interest (ROI) was identified (box with fixed dimension of 1 × 0.5 cm) and positioned at the middle level of the kidney, in the outer renal cortex, with minimal scanning pressure. The participants were asked not to breathe. Each participant was given 5 valid SWV measurements, calculating the average, expressed as meter/second (m/s). In case of an invalid measurement, on the screen was displayed “X.XX” [10,13,14,15].
3. Statistical Analysis
Data are recorded and presented as mean ± standard deviation. Statistical analyses were performed using the Student’s t-test, ANOVA test, and the Pearson’s correlation. Differences were considered statistically significant at the value of p < 0.05.
4. Results
This study included 130 participants, 80 patients with HN and 50 controls. Baseline participant characteristics are presented in Table 1.

Table 1.
Baseline participant characteristics.
Based on the office blood pressure measurements, the HN patients were classifies as: grade 1 hypertension (18 patients), and grade 2 hypertension (62 patients) [19].
Between the group of HN patients and controls, statistically significant differences of the monitored parameters were identified. The group of HN patients presented low values of eGFR and SWV, statistically significant. On the other side, the same patients presented high values of UACR and RRI, statistically significant, too (Table 2).

Table 2.
Parameters assessed in HN patients and controls.
The histological abnormalities are responsible for the changes of the monitored parameters. Intrarenal parenchyma arteries show progressive intimal thickening, afferent arterioles present a process of arteriosclerosis, all these changes being highlighted by the increase of RRI (Figure 1). Another factor responsible for the RRI increased is tubular atrophy associated with interstitial fibrosis [9,20,21]. Glomerular involvement is expressed by UACR increasing [9]. But the kidney is a complex organ and the SWV, as a marker of its stiffness, is dependent on the degree of renal fibrosis, as well as on the intrarenal vascularization [22] (Figure 2).
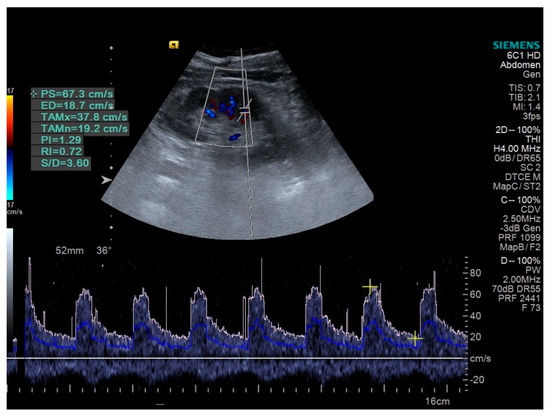
Figure 1.
Interlobar renal artery (RRI = 0.72).
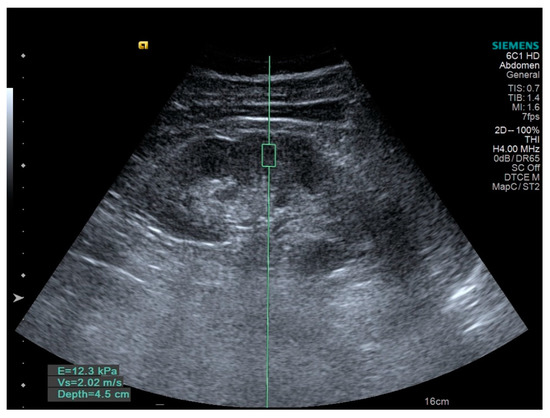
Figure 2.
ARFI; SWV = 2.02 m/s.
The severity of kidney damage, depending on the degree of hypertension and the duration of its evolution, causes changes in the monitored parameters, statistically significant. Among patients with HN, those with grade 1 hypertension had lower values of UACR and RRI, as well as higher values of eGFR and SWV compared to patients with grade 2 hypertension (Table 3).

Table 3.
Monitorized parameters in HN patients depending on the severity of hypertension.
Statistical analysis revealed the presence of significant correlations between SWV and UACR, eGFR, respectively RRI (p < 0.0001) (Table 4, Figure 3, Figure 4 and Figure 5).

Table 4.
Correlations between SWV and monitorized parameters.
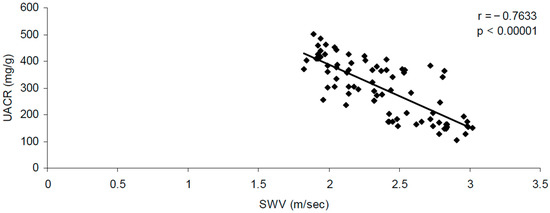
Figure 3.
Correlations between SWV and UACR.
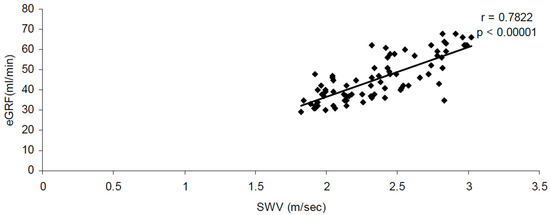
Figure 4.
Correlations between SWV and eGFR.
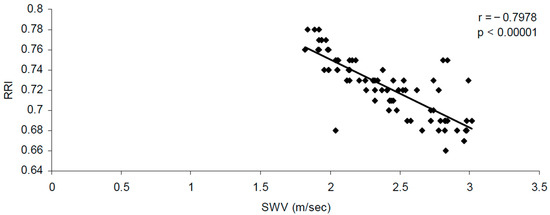
Figure 5.
Correlations between SWV and RRI.
5. Discussion
In present, HN represents an important cause of end-stage renal disease [21]. It is the consequence of essential hypertension with a long-term evolution, being characterized by complex histopathological changes, involving intrarenal vessels, glomeruli and tubulointerstitium [9].
The present study is one of the few published related to the HN patients investigated by means of ARFI. By investigating 80 HN patients, it showed that hypertensive kidney damage causes changes in kidney vascularization (evaluated by means of RRI of interlobar arteries) and elasticity (evaluated by means of ARFI, as SWV), but also in biochemical and urinary tests.
Glomerular impairment secondary to high blood pressure is evidenced by increased UACR (297.31 ± 107.81 mg/g in HN patients versus 18.93 ± 4.41 mg/g in controls, p < 0.0001) and decreased eGFR (45.90 ± 11.07 mL/min in HN patients versus 95.86 ± 7.38 mL/min in controls, p < 0.0001). Boulatov et al. reported that the hypertensive patients presented higher UACR than the normotensive ones (2.17 ± 2.67 mg/mmol versus 1.72 ± 2.97 mg/mmol, p = 0.012) [23]. Studying microvascular involvement in hypertensive patients, Sabanayagam et al., reported that the decreased of retinal arteries diameter was associated with the reduced eGFR and micro/macroalbuminuria [24]. Awua-Larbi demonstrated that the albuminuria was associated with hypertensive retinopathy [17]. Yoon SJ et al. analyzed the data from the 2011–2012 Korea National Health and Nutrition Examination Survey, including 9519 subjects. The authors reported a positive correlation between the systolic blood pressure, respective diastolic blood pressure and UACR (p < 0.005) [25]. Georgakis et al., in their meta-analysis described that albuminuria was associated with small vessel involvement from kidney and brain [26]. In another study, Grupper et al. showed that the hypertensive patients presented lower eGFR and higher UACR than the normotensive subjects (p < 0.001) [27].
In addition to glomerular changes, the hypertensive kidney also has vascular changes (narrowing of the intrarenal arteries and arterioles), as well as interstitial fibrotic ones. Gray-scale ultrasonography reveals renal changes only in advanced stages of HN evolution. But early renal histopathological changes can be identified only by special ultrasonographic techniques, such as Doppler technique (as RRI of interlobar renal arteries), respectively ARFI (as SWV) [11,12,13,14,15]. RRI is increased in several renal parenchymal diseases, particularly those with pathological changes in tubules, renal interstitium and blood vessels, while patients with isolated glomerular lesions usually have normal RRI [28].
This study identified that the RRI were higher in HN patients than in controls (0.72 ± 0.02 in HN patients versus 0.63 ± 0.02 in controls, p < 0.0001). In a group of 211 patients with essential hypertension, higher RRI of interlobar renal arteries was associated with higher prevalence of microalbuminuria (p = 0.008) [29]. In another study, Doi et al. demonstrated that the increased RRI was associated with low eGFR, this association being related with poor cardiovascular and renal outcomes. [30]. Elevated RRI values were associated with increased UACR and decreased eGFR (p < 0.01) [20].
ARFI uses short-duration acoustic radiation forces that produce localized displacements in the renal tissue [31,32]. The renal shear wave velocity (SWV) represents the speed of a transverse wave that propagates perpendicular to the direction of tissue movement, which is a representative factor of renal tissue rigidity [33,34]. Renal elasticity changes during the HN progression. The speed of shear wave propagation is measured and is proportional to the stiffness of the renal tissue [22,32,33]. In the present study the SWV values were between 1.82 and 2.99 m/s. The studied HN patients presented low values of SWV than the controls (2.37 ± 0.34 m/s in HN patients, versus 2.96 ± 0.18 m/s in controls), statistically significant (p < 0.0001). Guo et al. and Zheng et al. reported similar results (p < 0.001, respective p < 0.05) [34,35]. Munger et al., based on the fact that 20% of cardiac output enters the kidneys, and that changes in this flow affect renal function, has shown that renal SWV is dependent on intrarenal vascularization [36]. Bob et al., in their study, demonstrated that renal SWV depends not only on renal fibrosis, but also on intrarenal vascularization [22]. Under HN conditions, reducing the diameter of the intrarenal vessels leads to a reduction in blood flow, and then, SWV [35].
Our study revealed the presence of significant correlations between SWV and eGFR (r = 0.7822, p < 0.00001), UACR (r = −0.7633, p < 0.00001), respectively RRI (r = −0.7978, p < 0.00001).
Studying by ARFI 46 patients with chronic glomerulonephritis, diabetic nephropathy, hypertensive nephrosclerosis, chronic pyelonephritis, and 58 healthy subjects, Bob et al. demonstrated that the renal SWV values decreased with the reduction of eGFR in renal patients (p < 0.001) [22]. Asano et al. identified that the SWV decreased with eGFR decline (p < 0.01) [37]. The same results were obtained by other studies [10,13,14,38]. In HN patients, the reduction of SWV is consistent with the reduction of eGRF and renal histopathological changes. Lesions of intrarenal parenchyma arteries and afferent arterioles generate decreased renal blood flow, which may affect SWV values more than tissue fibrosis affects [37,39,40,41]. Hu et al. studied 163 patients with chronic kidney disease and 32 healthy subjects and investigated the renal parenchyma stiffness in correlation with renal histolopathological fibrosis and renal function. SWV showed significantly correlations with pathological parameters (p < 0.001), serum creatinine (p < 0.001), and eGFR (p < 0.001). The authors identified the cutoff values of SWV for the diagnosis of renal dysfunction, as: 2.65 m/s for the mildly impaired kidneys, 2.50 m/s for moderately impaired kidneys, and 2.33 m/s for severely impaired kidneys [42].
Young’s modulus represents a quantitative and objective parameter for evaluation of tissue elasticity. It is is calculated according to the equation: E = 3 cs2, where E = Young’s modulus (kPa), cs = shear wave velocity (m/s) [43]. In the study performed by Leong et al. on the renal patients who underwent renal biopsy, it was demonstrated that the kidney Young’s modulus correlated significantly with intrarenal lesions (p < 0.001) [44].
You-Hsien Lin et al. demonstrated on 227 patients with CKD that these patients presented lower elasticity values than the controls (p < 0.001). On the other hand, the authors identified significant correlations between renal elasticity and proteinuria (p < 0.001), eGFR (p < 0.001). The conclusion of their article was that the renal elasticity was associated with the degree of proteinuria and the risk of renal function deterioration [10].
Koc et al. identified in two studies a statistically significant correlation between the renal stiffness and RRI in hypertensive patients (p < 0.001, respective p < 0.05) [45,46].
The present study showed that the severity of high blood pressure (grade 1 hypertension versus grade 2 hypertension) causes kidney damage dependent on it. The severity of renal impairment is shown by increases of UACR, RRI, respectively reductions of eGFR and SWV in grade 2 hypertension patients, statistically significant (Table 3). Sievers et al. reported that the severity of blood pressure elevation often correlates with the degree of renal damage [21].
This study this study had some limitations. First, the number of studied patients with HN was not very large. On the other hand, histopathological examination of patients with HN was not performed in order to correlate UACR, eGFR, RRI and SWV with histopathological data. The future research should be coordinated in the direction of identifying correlations between histological and biochemical parameters, respectively imaging (SWV, RRI) in HN.
6. Conclusions
Renal acoustic radiation force impulse elastography, by means of SWV, characterizes imagistically the existence of intrarenal lesions associated with essential hypertension. SWV changes appear early in the HN evolution. The present study demonstrated the strong correlations between SWV and biochemical, respective Doppler ultrasonography parameters.
Author Contributions
Conceptualization: A.C.; Methodology: A.C., A.M., S.I., M.I.; Investigation: A.C., A.M.; Resources: A.C., A.M., S.I., M.I.; Data curation: A.C., A.M., S.I., M.I.; Writing—original draft preparation: A.C., S.I.; Writing—review and editing: A.C., A.M., S.I., M.I.; Visualization: S.I., M.I.; Supervision: A.C. All authors have read and agreed to the published version of the manuscript.
Funding
This research received no external funding.
Institutional Review Board Statement
The study was conducted according to the guidelines of the Declaration of Helsinki, and approved by the institutional review board of the Railway Clinical Hospital Timișoara, Romania, with registration number 137/July 2019.
Informed Consent Statement
All subjects involved in this study read and signed the informed consent.
Data Availability Statement
Not applicable to this article.
Conflicts of Interest
The authors declare no conflict of interest.
References
- Kramer, A.; Pippias, M.; Noordzij, M.; Stel, V.S.; Andrusev, A.M.; Aparicio-Madre, M.I.; Arribas Monzón, F.E.; Åsberg, A.; Barbullushi, M.; Beltrán, P.; et al. The European Renal Association–European Dialysis and Transplant Association (ERA-EDTA) Registry Annual Report 2016: A summary. Clin. Kidney J. 2019, 12, 702–720. [Google Scholar] [CrossRef] [PubMed]
- Kramer, A.; Boenink, R.; Noordzij, M.; Bosdriesz, J.R.; Stel, V.S.; Beltrán, P.; Ruiz, J.C.; Seyahi, N.; Farnés, J.C.; Stendahl, M.; et al. The ERA–EDTA Registry Annual Report 2017: A summary. Clin. Kidney J. 2020, 13, 693–709. [Google Scholar] [CrossRef] [PubMed]
- Nitta, K.; Masakane, I.; Hanafusa, N.; Hasegawa, T.; Nakai, S.; Goto, S.; Wada, A.; Hamano, T.; Hoshino, J.; Joki, N.; et al. Annual dialysis data report 2017. Ren. Replace Ther. 2019, 5, 53. [Google Scholar] [CrossRef]
- Stompór, T.; Perkowska-Ptasińska, A. Hypertensive kidney disease: A true epidemic or rare disease? Pol. Arch. Intern. Med. 2020, 130, 130–139. [Google Scholar] [CrossRef]
- Hallan, S.I.; Øvrehus, M.A.; Bjørneklett, R.; Aasarød, K.I.; Fogo, A.B.; Ix, J.H. Hypertensive nephrosclerosis: Wider kidney biopsy indications may be needed to improve diagnostics. J. Intern. Med. 2021, 289, 69–83. [Google Scholar] [CrossRef] [PubMed]
- Mahmoodi, B.K.; Matsushita, K.; Woodward, M.; Blankestijn, P.J.; Cirillo, M.; Ohkubo, T.; Rossing, P.; Sarnak, M.J.; Stengel, B.; Yamagishi, K.; et al. Associations of kidney disease measures with mortality and end-stage renal disease in individuals with and without hypertension: A meta-analysis. Lancet 2012, 380, 1649–1661. [Google Scholar] [CrossRef]
- Matsushita, K.; Van Der Velde, M.; Astor, B.C.; Woodward, M.; Levey, A.S.; De Jong, P.E.; Coresh, J.; Gansevoort, R.T. Association of estimated glomerular filtration rate and albuminuria with all-cause and cardiovascular mortality in general population cohorts: A collaborative meta-analysis. Lancet 2010, 375, 2073–2081. [Google Scholar] [CrossRef]
- Gansevoort, R.T.; Correa-Rotter, R.; Hemmelgarn, B.R.; Jafar, T.H.; Heerspink, H.J.L.; Mann, J.F.; Matsushita, K.; Wen, C.P. Chronic kidney disease and cardiovascular risk: Epidemiology, mechanisms, and prevention. Lancet 2013, 382, 339–352. [Google Scholar] [CrossRef]
- Bakris, G.L.; Sorrentino, M.J. Hypertension. A companion to Braunwald’s Heart Disease, 3rd ed.; Elsevier: Amsterdam, The Netherlands, 2018. [Google Scholar]
- Lin, H.Y.-H.; Lee, Y.-L.; Lin, K.-D.; Chiu, Y.-W.; Shin, S.-J.; Hwang, S.-J.; Chen, H.-C.; Hung, C.-C. Association of Renal Elasticity and Renal Function Progression in Patients with Chronic Kidney Disease Evaluated by Real-Time Ultrasound Elastography. Sci. Rep. 2017, 7, srep43303. [Google Scholar] [CrossRef]
- Knapp, R.; Plötzeneder, A.; Frauscher, F.; Helweg, G.; Judmaier, W.; Nedden, D.Z.; Recheis, W.; Bartsch, G. Variability of Doppler parameters in the healthy kidney: An anatomic-physiologic correlation. J. Ultrasound Med. 1995, 14, 427–429. [Google Scholar] [CrossRef]
- Platt, J.F. Doppler ultrasound of the kidney. Semin. Ultrasound CT MRI 1997, 18, 22–32. [Google Scholar] [CrossRef]
- Duymuş, M.; Menzilcioğlu, M.S.; Gok, M.; Avcu, S. Kidney Ultrasound Elastography: Review. Kafkas J. Med. Sci. 2016, 6, 121–129. [Google Scholar] [CrossRef]
- Wang, L. Applications of acoustic radiation force impulse quantification in chronic kidney disease: A review. Ultrasonography 2016, 35, 302–308. [Google Scholar] [CrossRef]
- Sigrist, R.M.; Liau, J.; El Kaffas, A.; Chammas, M.C.; Willmann, J.K. Ultrasound Elastography: Review of Techniques and Clinical Applications. Theranostics 2017, 7, 1303–1329. [Google Scholar] [CrossRef]
- Izzo, J.L.; Sica, D.A.; Black, H.R. Hypertension Primer, 4th ed.; Lippincott Williams & Wilkins: Philadelphia, PE, USA, 2008. [Google Scholar]
- Awua-Larbi, S.; Wong, T.Y.; Cotch, M.F.; Durazo-Arvizu, R.; Jacobs, D.R.; Klein, B.E.K.; Klein, R.; Lima, J.; Liu, K.; Kramer, H. Retinal arteriolar caliber and urine albumin excretion: The Multi-Ethnic Study of Atherosclerosis. Nephrol. Dial. Transplant. 2011, 26, 3523–3528. [Google Scholar] [CrossRef] [PubMed]
- Wong, T.Y.; Mitchell, P. Hypertensive retinopathy. N. Engl. J. Med. 2004, 351, 2310–2317. [Google Scholar] [CrossRef] [PubMed]
- Unger, T.; Borghi, C.; Charchar, F.; Khan, N.A.; Poulter, N.R.; Prabhakaran, D.; Ramirez, A.; Schlaich, M.; Stergiou, G.S.; Tomaszewski, M.; et al. 2020 International Society of Hypertension Global Hypertension Practice Guidelines. Hypertension 2020, 75, 1334–1357. [Google Scholar] [CrossRef] [PubMed]
- Viazzi, F.; Leoncini, G.; Derchi, L.E.; Pontremoli, R. Ultrasound Doppler renal resistive index: A useful tool for the management of the hypertensive patient. J. Hypertens. 2014, 32, 149–153. [Google Scholar] [CrossRef]
- Sievers, L.K.; Eckardt, K.-U. Molecular Mechanisms of Kidney Injury and Repair in Arterial Hypertension. Int. J. Mol. Sci. 2019, 20, 2138. [Google Scholar] [CrossRef] [PubMed]
- Bob, F.; Bota, S.; Sporea, I.; Sirli, R.; Popescu, A.; Schiller, A. Relationship between the Estimated Glomerular Filtration Rate and Kidney Shear Wave Speed Values Assessed by Acoustic Radiation Force Impulse Elastography. J. Ultrasound Med. 2015, 34, 649–654. [Google Scholar] [CrossRef]
- Boulatov, V.A.; Stenehjem, A.; Os, I. Association between albumin:creatinine ratio and 24-hour ambulatory blood pressure in essential hypertension. Am. J. Hypertens. 2001, 14, 338–344. [Google Scholar] [CrossRef]
- Sabanayagam, C.; Shankar, A.; Koh, D.; Chia, K.S.; Saw, S.M.; Lim, S.C.; Tai, E.S.; Wong, T.Y. Retinal Microvascular Caliber and Chronic Kidney Disease in an Asian Population. Am. J. Epidemiol. 2009, 169, 625–632. [Google Scholar] [CrossRef] [PubMed]
- Yoon, S.-J.; Kim, D.-H.; Nam, G.-E.; Yoon, Y.-J.; Han, K.-D.; Jung, D.-W.; Park, S.-W.; Kim, Y.-E.; Lee, S.-H.; Lee, S.-S.; et al. Prevalence and Control of Hypertension and Albuminuria in South Korea: Focus on Obesity and Abdominal Obesity in the Korean National Health and Nutrition Examination Survey, 2011–2012. PLoS ONE 2014, 9, e111179. [Google Scholar] [CrossRef][Green Version]
- Georgakis, M.K.; Chatzopoulou, D.; Tsivgoulis, G.; Petridou, E. Albuminuria and Cerebral Small Vessel Disease: A Systematic Review and Meta-Analysis. J. Am. Geriatr. Soc. 2018, 66, 509–517. [Google Scholar] [CrossRef]
- Grupper, A.; Ehrenwald, M.; Schwartz, D.; Berliner, S.; Shashar, M.; Baruch, R.; Schwartz, I.F.; Rogowski, O.; Zeltser, D.; Shapira, I.; et al. Hypertension is associated with increased post-exercise albuminuria, which may be attenuated by an active lifestyle. J. Clin. Hypertens. 2019, 21, 1171–1179. [Google Scholar] [CrossRef] [PubMed]
- Pellerito, J.S.; Zwiebel, W.J. Ultrasound assessment of native renal vessels and renal allografts. In Introduction to Vascular Ultrasonography; Zwiebel, W.J., Pellerito, S., Eds.; Elsevier: Philadelphia, PE, USA, 2005; pp. 612–636. [Google Scholar]
- Pontremoli, R.; Viazzi, F.; Martinoli, C.; Ravera, M.; Nicolella, C.; Berruti, V.; Leoncini, G.; Ruello, N.; Zagami, P.; Bezante, G.P. Increased renal resistive index in patients with essential hypertension: A marker of organ damage. Nephrol Dial Transpl. 1999, 14, 360–365. [Google Scholar] [CrossRef]
- Doi, Y.; Iwashima, Y.; Yoshihara, F.; Kamide, K.; Takata, H.; Fujii, T.; Kubota, Y.; Nakamura, S.; Horio, T.; Kawano, Y. Association of Renal Resistive Index With Target Organ Damage in Essential Hypertension. Am. J. Hypertens. 2012, 25, 1292–1298. [Google Scholar] [CrossRef] [PubMed]
- Nightingale, K.; Soo, M.S.; Nightingale, R.; Trahey, G. Acoustic radiation force impulse imaging: In vivo demonstration of clinical feasibility. Ultrasound Med. Biol. 2002, 28, 227–235. [Google Scholar] [CrossRef]
- Gallotti, A.; D’Onofrio, M.; Mucelli, R.P. Acoustic Radiation Force Impulse (ARFI) technique in ultrasound with Virtual Touch tissue quantification of the upper abdomen. Radiol. Med. 2010, 115, 889–897. [Google Scholar] [CrossRef]
- Bota, S.; Bob, F.; Sporea, I.; Şirli, R.; Popescu, A. Factors that influence kidney shearwave speed assessed by Acoustic Radiation Force Impulse Elastography in patients without kidney pathology. Ultrasound Med. Biol. 2015, 41, 1–6. [Google Scholar] [CrossRef]
- Guo, L.-H.; Xu, H.-X.; Fu, H.-J.; Peng, A.; Zhang, Y.-F.; Liu, L.-N. Acoustic Radiation Force Impulse Imaging for Noninvasive Evaluation of Renal Parenchyma Elasticity: Preliminary Findings. PLoS ONE 2013, 8, e68925. [Google Scholar] [CrossRef] [PubMed]
- Zheng, X.Z.; Yang, B.; Fu, N.H. Preliminary Study on the Kidney Elasticity Quantification in Patients with Chronic Kidney Disease Using Virtual Touch Tissue Quantification. Iran. J. Radiol. 2015, 12, e12026. [Google Scholar] [CrossRef] [PubMed]
- Munger, K.A.; Kost, C.K.; Brenner, B.M., Jr.; Maddox, D.A. The Renal Circulations and Glomerular Ultrafiltration. In Brenner & Rector’s the Kidney, 9th ed.; Taal, M.W., Chertow, G.M., Marsden, P.A., Skorecki, K., Yu, A.S.L., Brenner, B.M., Eds.; Elsevier: Philadelphia, PE, USA, 2012; pp. 94–137. [Google Scholar]
- Asano, K.; Ogata, A.; Tanaka, K.; Ide, Y.; Sankoda, A.; Kawakita, C.; Nishikawa, M.; Ohmori, K.; Kinomura, M.; Shimada, N.; et al. Acoustic Radiation Force Impulse Elastography of the kidneys. Is shear wave velocity affected by tissue fibrosis or renal blood flow? J. Ultrasound Med. 2014, 33, 793–801. [Google Scholar] [CrossRef]
- Grossmann, M.; Tzschätzsch, H.; Lang, S.T.; Guo, J.; Bruns, A.; Dürr, M.; Hoyer, B.F.; Grittner, U.; Lerchbaumer, M.; Trong, M.N.; et al. US Time-Harmonic Elastography for the Early Detection of Glomerulonephritis. Radiology 2019, 292, 676–684. [Google Scholar] [CrossRef]
- Gennisson, J.-L.; Grenier, N.; Combe, C.; Tanter, M. Supersonic Shear Wave Elastography of In Vivo Pig Kidney: Influence of Blood Pressure, Urinary Pressure and Tissue Anisotropy. Ultrasound Med. Biol. 2012, 38, 1559–1567. [Google Scholar] [CrossRef] [PubMed]
- Wang, L.; Xia, P.; Lv, K.; Han, J.; Dai, Q.; Li, X.-M.; Chen, L.-M.; Jiang, Y.-X. Assessment of renal tissue elasticity by acoustic radiation force impulse quantification with histopathological correlation: Preliminary experience in chronic kidney disease. Eur. Radiol. 2014, 24, 1694–1699. [Google Scholar] [CrossRef]
- Menzilcioglu, M.S.; Duymus, M.; Citil, S.; Avcu, S.; Gungor, G.; Sahin, T.; Boysan, S.N.; Altunoren, O.; Sarica, A. Strain wave elastography for evaluation of renal parenchyma in chronic kidney disease. Br. J. Radiol. 2015, 88, 20140714. [Google Scholar] [CrossRef]
- Hu, Q.; Wang, X.-Y.; He, H.-G.; Wei, H.-M.; Kang, L.-K.; Qin, G.-C. Acoustic Radiation Force Impulse Imaging for Non-Invasive Assessment of Renal Histopathology in Chronic Kidney Disease. PLoS ONE 2014, 9, e115051. [Google Scholar] [CrossRef]
- Shiina, T.; Nightingale, K.R.; Palmeri, M.L.; Hall, T.J.; Bamber, J.C.; Barr, R.G.; Castera, L.; Choi, B.I.; Chou, Y.; Cosgrove, D.; et al. WFUMB Guidelines and recommendations for clinical use of ultrasound elastography: Part 1: Basic principles and terminology. Ultrasound Med. Biol. 2015, 41, 1126–1147. [Google Scholar] [CrossRef]
- Leong, S.S.; Wong, J.H.D.; Shah, M.N.M.; Vijayananthan, A.; Jalalonmuhali, M.; Chow, T.K.; Sharif, N.H.M.; Ng, K.H. Shear wave elastography accurately detects chronic changes in renal histopathology. Nephrology 2021, 26, 38–45. [Google Scholar] [CrossRef]
- Koc, A.S.; Sümbül, H.E. Relationship between renal resistive index and increased renal cortical stiffness in patients with preserved renal function. Eur. J. Ther. 2018, 24, 255–261. [Google Scholar] [CrossRef]
- Koc, A.S.; Demirtas, D.; Gorgulu, F.F.; Sumbul, H.E. Diurnal variation of renal resistive index over 24-hour period in hypertensive patients and healthy controls. Abdom. Radiol. 2019, 44, 1010–1018. [Google Scholar] [CrossRef] [PubMed]
Publisher’s Note: MDPI stays neutral with regard to jurisdictional claims in published maps and institutional affiliations. |
© 2021 by the authors. Licensee MDPI, Basel, Switzerland. This article is an open access article distributed under the terms and conditions of the Creative Commons Attribution (CC BY) license (https://creativecommons.org/licenses/by/4.0/).