
Comparison of Different Approaches Estimating Skeletal Muscle Oxygen Consumption Using Continuous-Wave Near-Infrared Spectroscopy at a Submaximal Contraction Level—A Comparative Study


Abstract
Featured Application
Abstract
1. Introduction
2. Materials and Methods
2.1. Subjects
2.2. Experimental Setup
2.3. Experimental Protocol
- (1)
- Position_1: 3° dorsiflexion;
- (2)
- Position_2: 13° plantarflexion, with 0° defined as tibia axis perpendicular to the plantar aspect of the foot.
Near-Infrared Spectroscopy
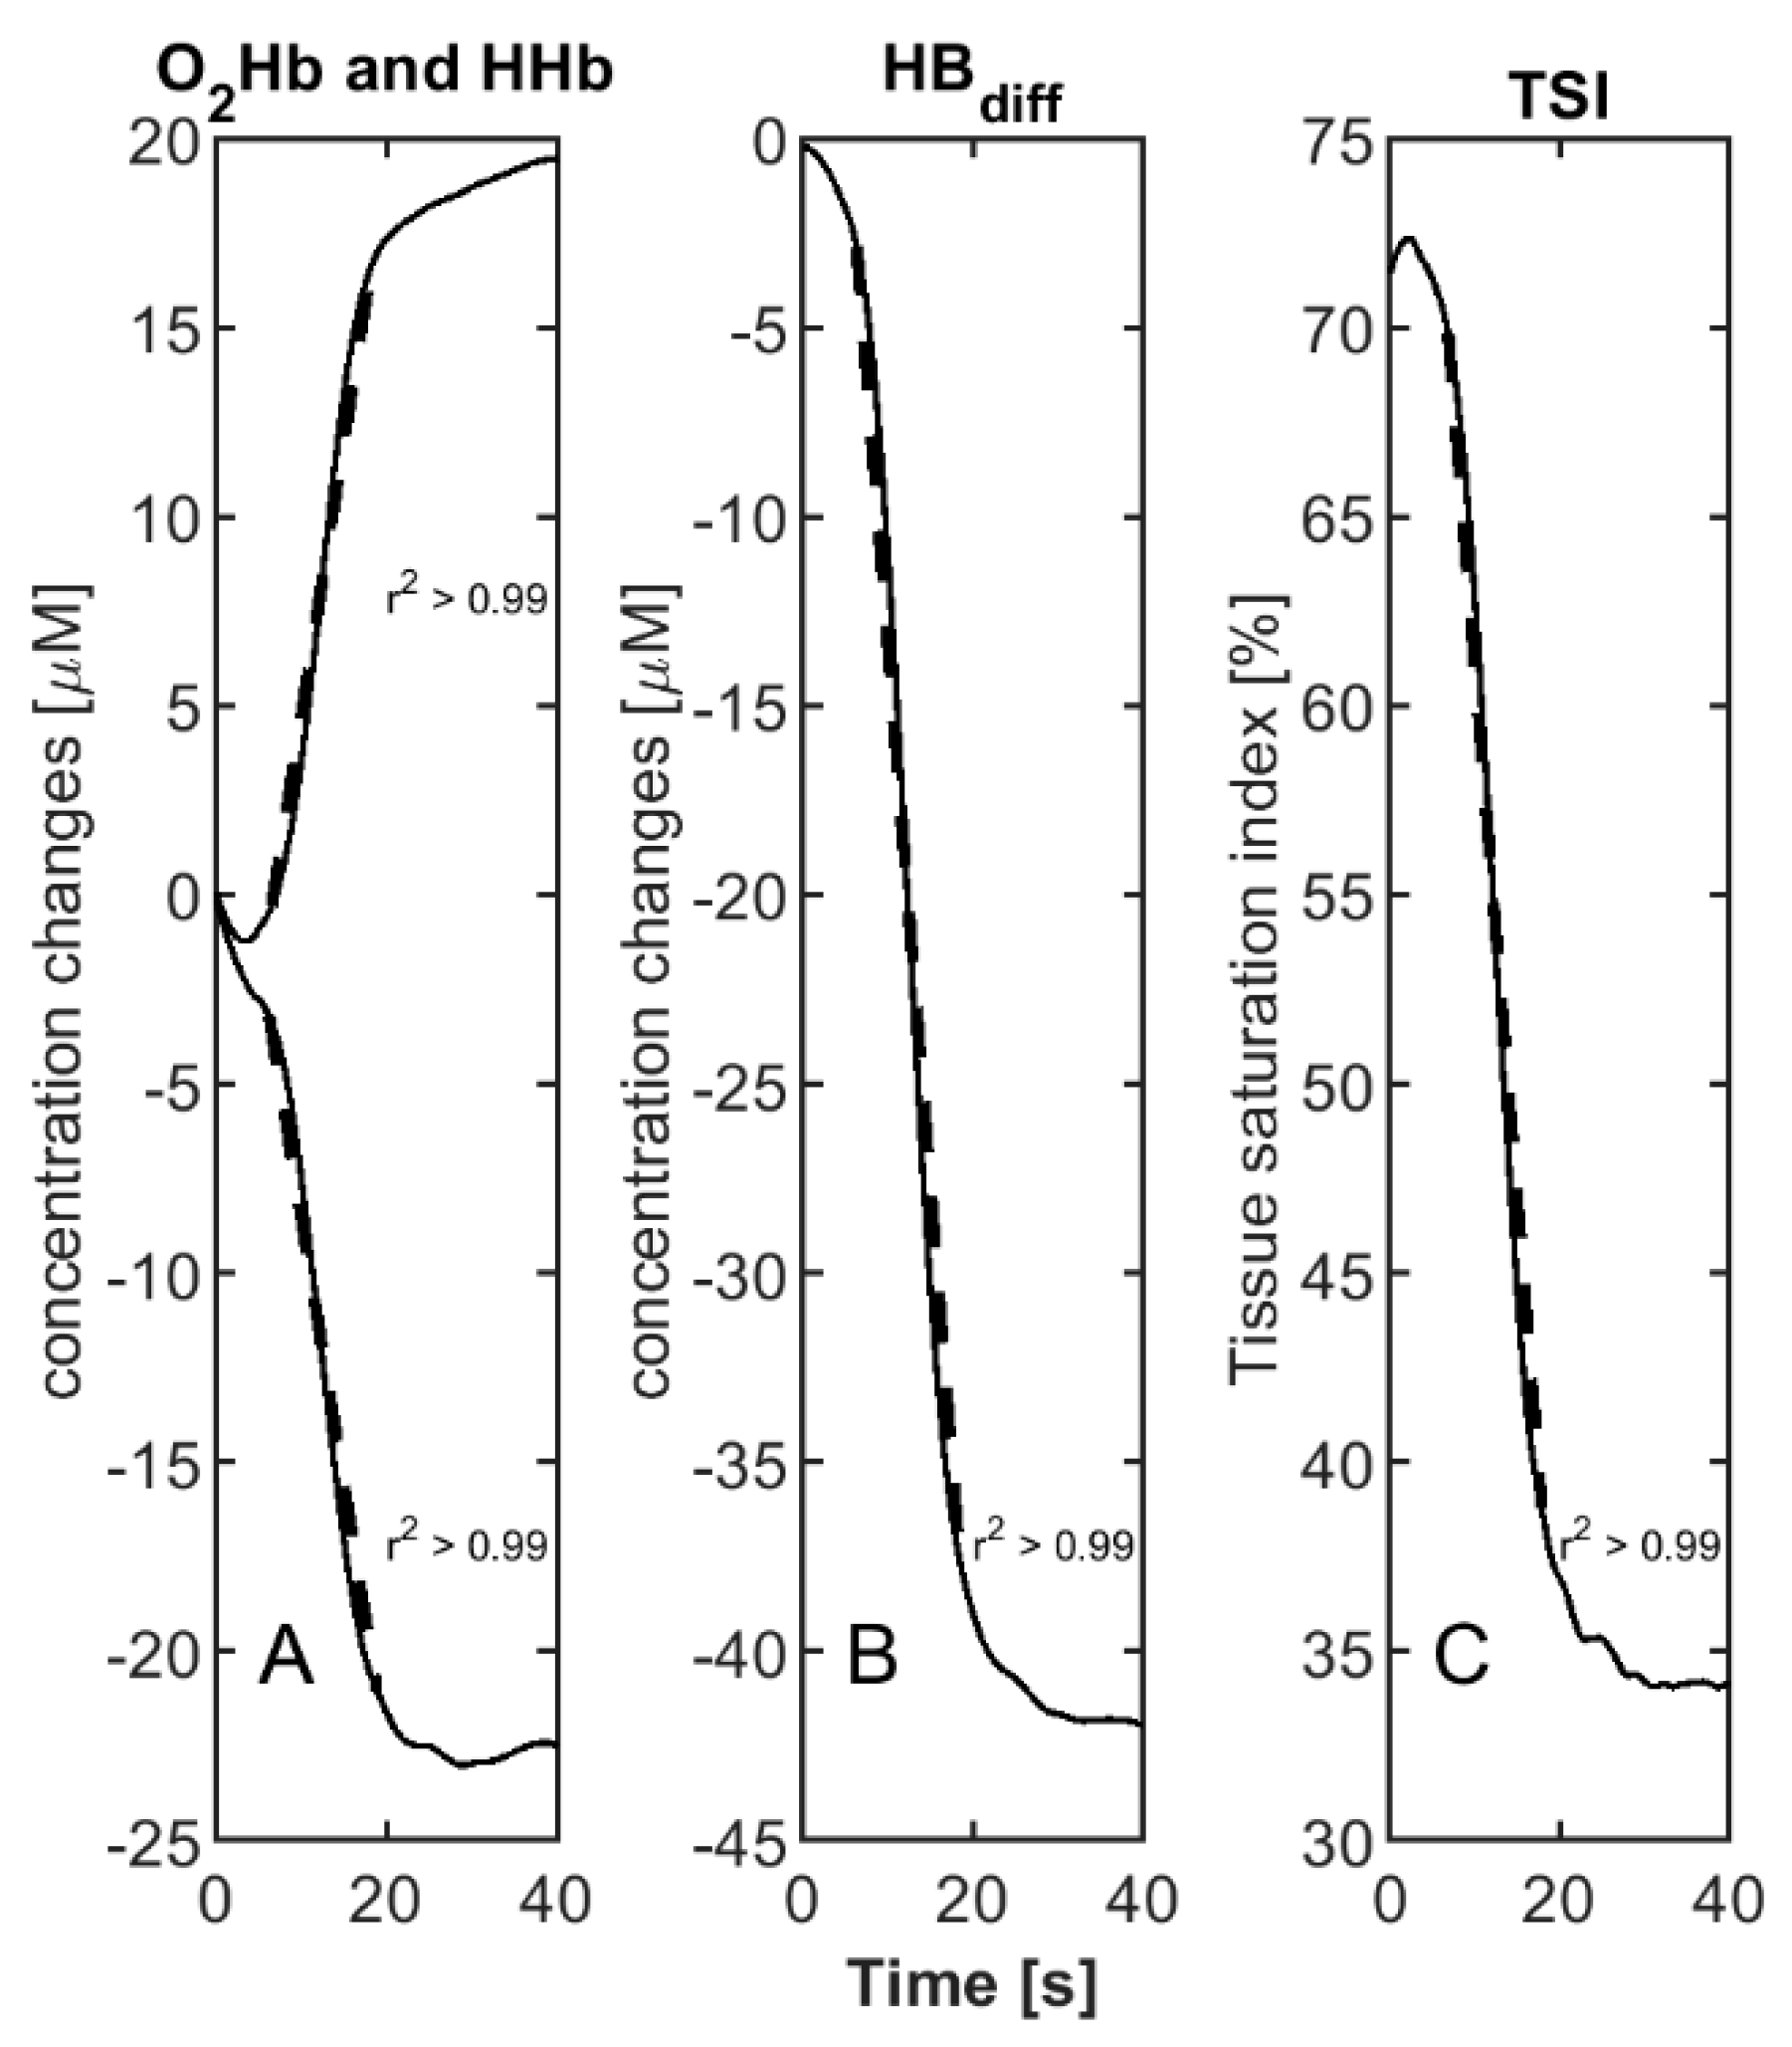
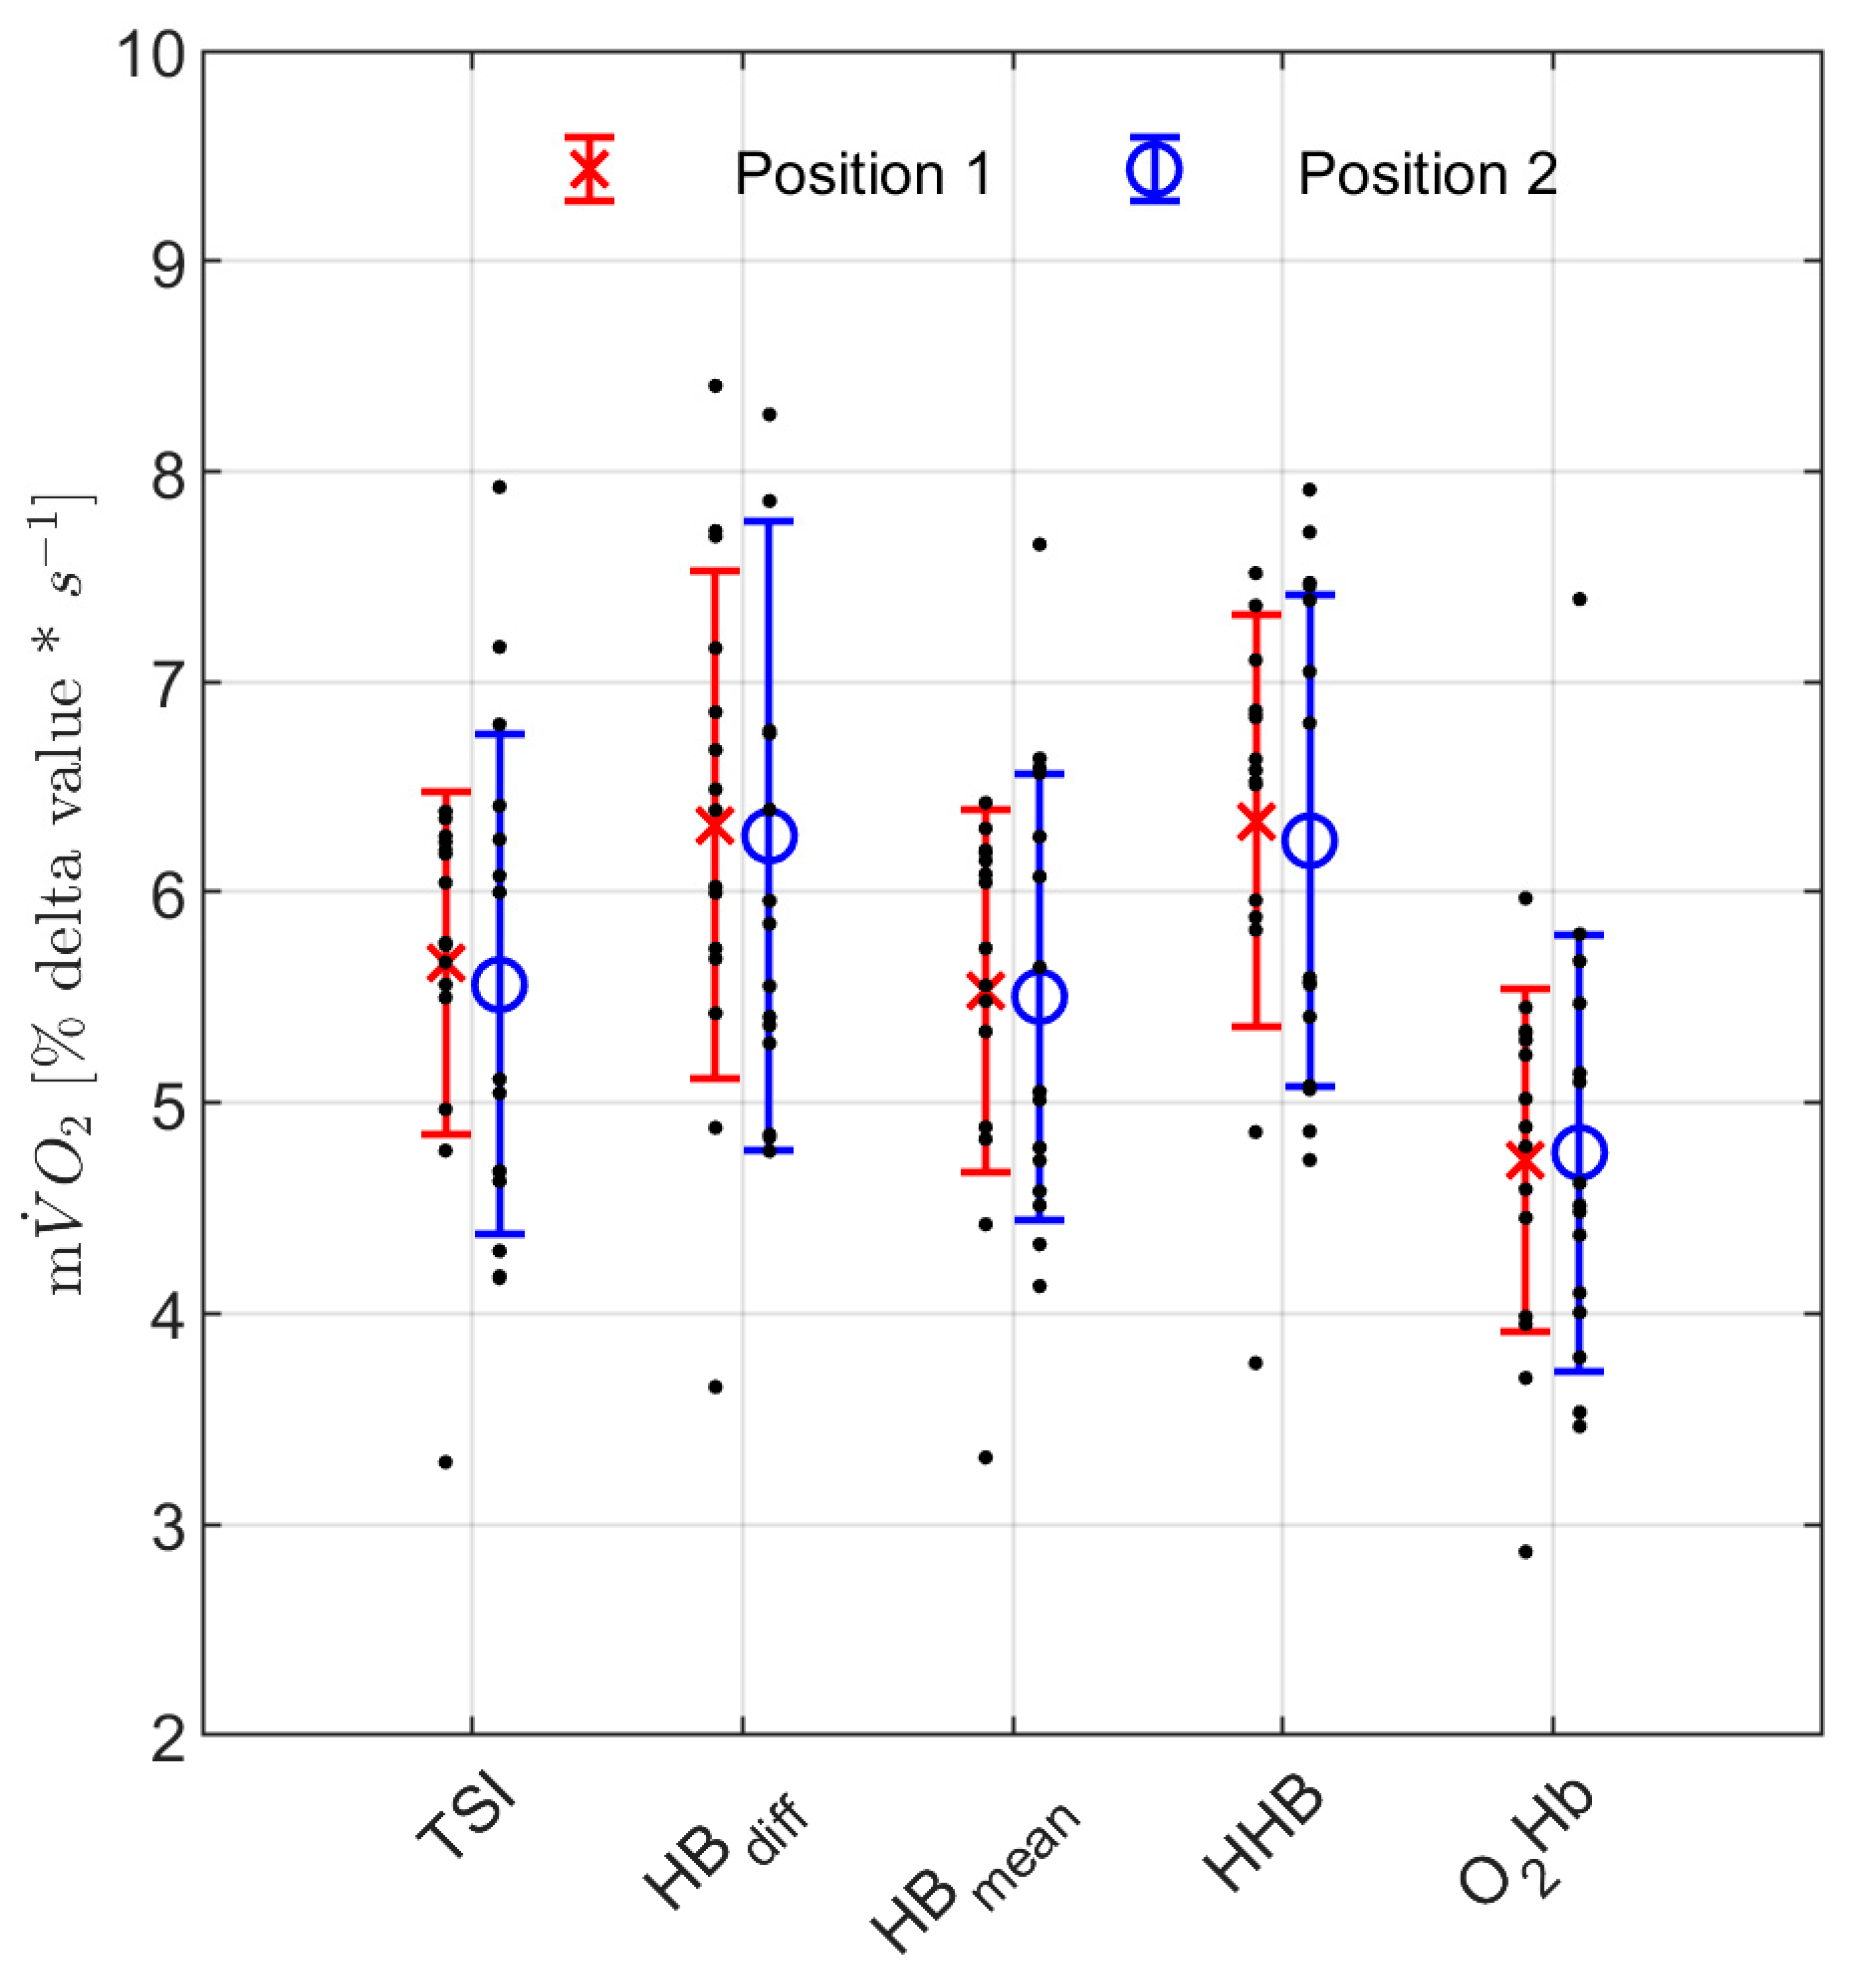
2.4. Data Analysis
- (1)
- TSI signal;
- (2)
- Difference between O2Hb and HHb (Hbdiff);
- (3)
- Mean of the slopes from O2Hb and HHb (Hbmean);
- (4)
- HHb signal;
- (5)
- O2Hb signal.
2.5. Statistics
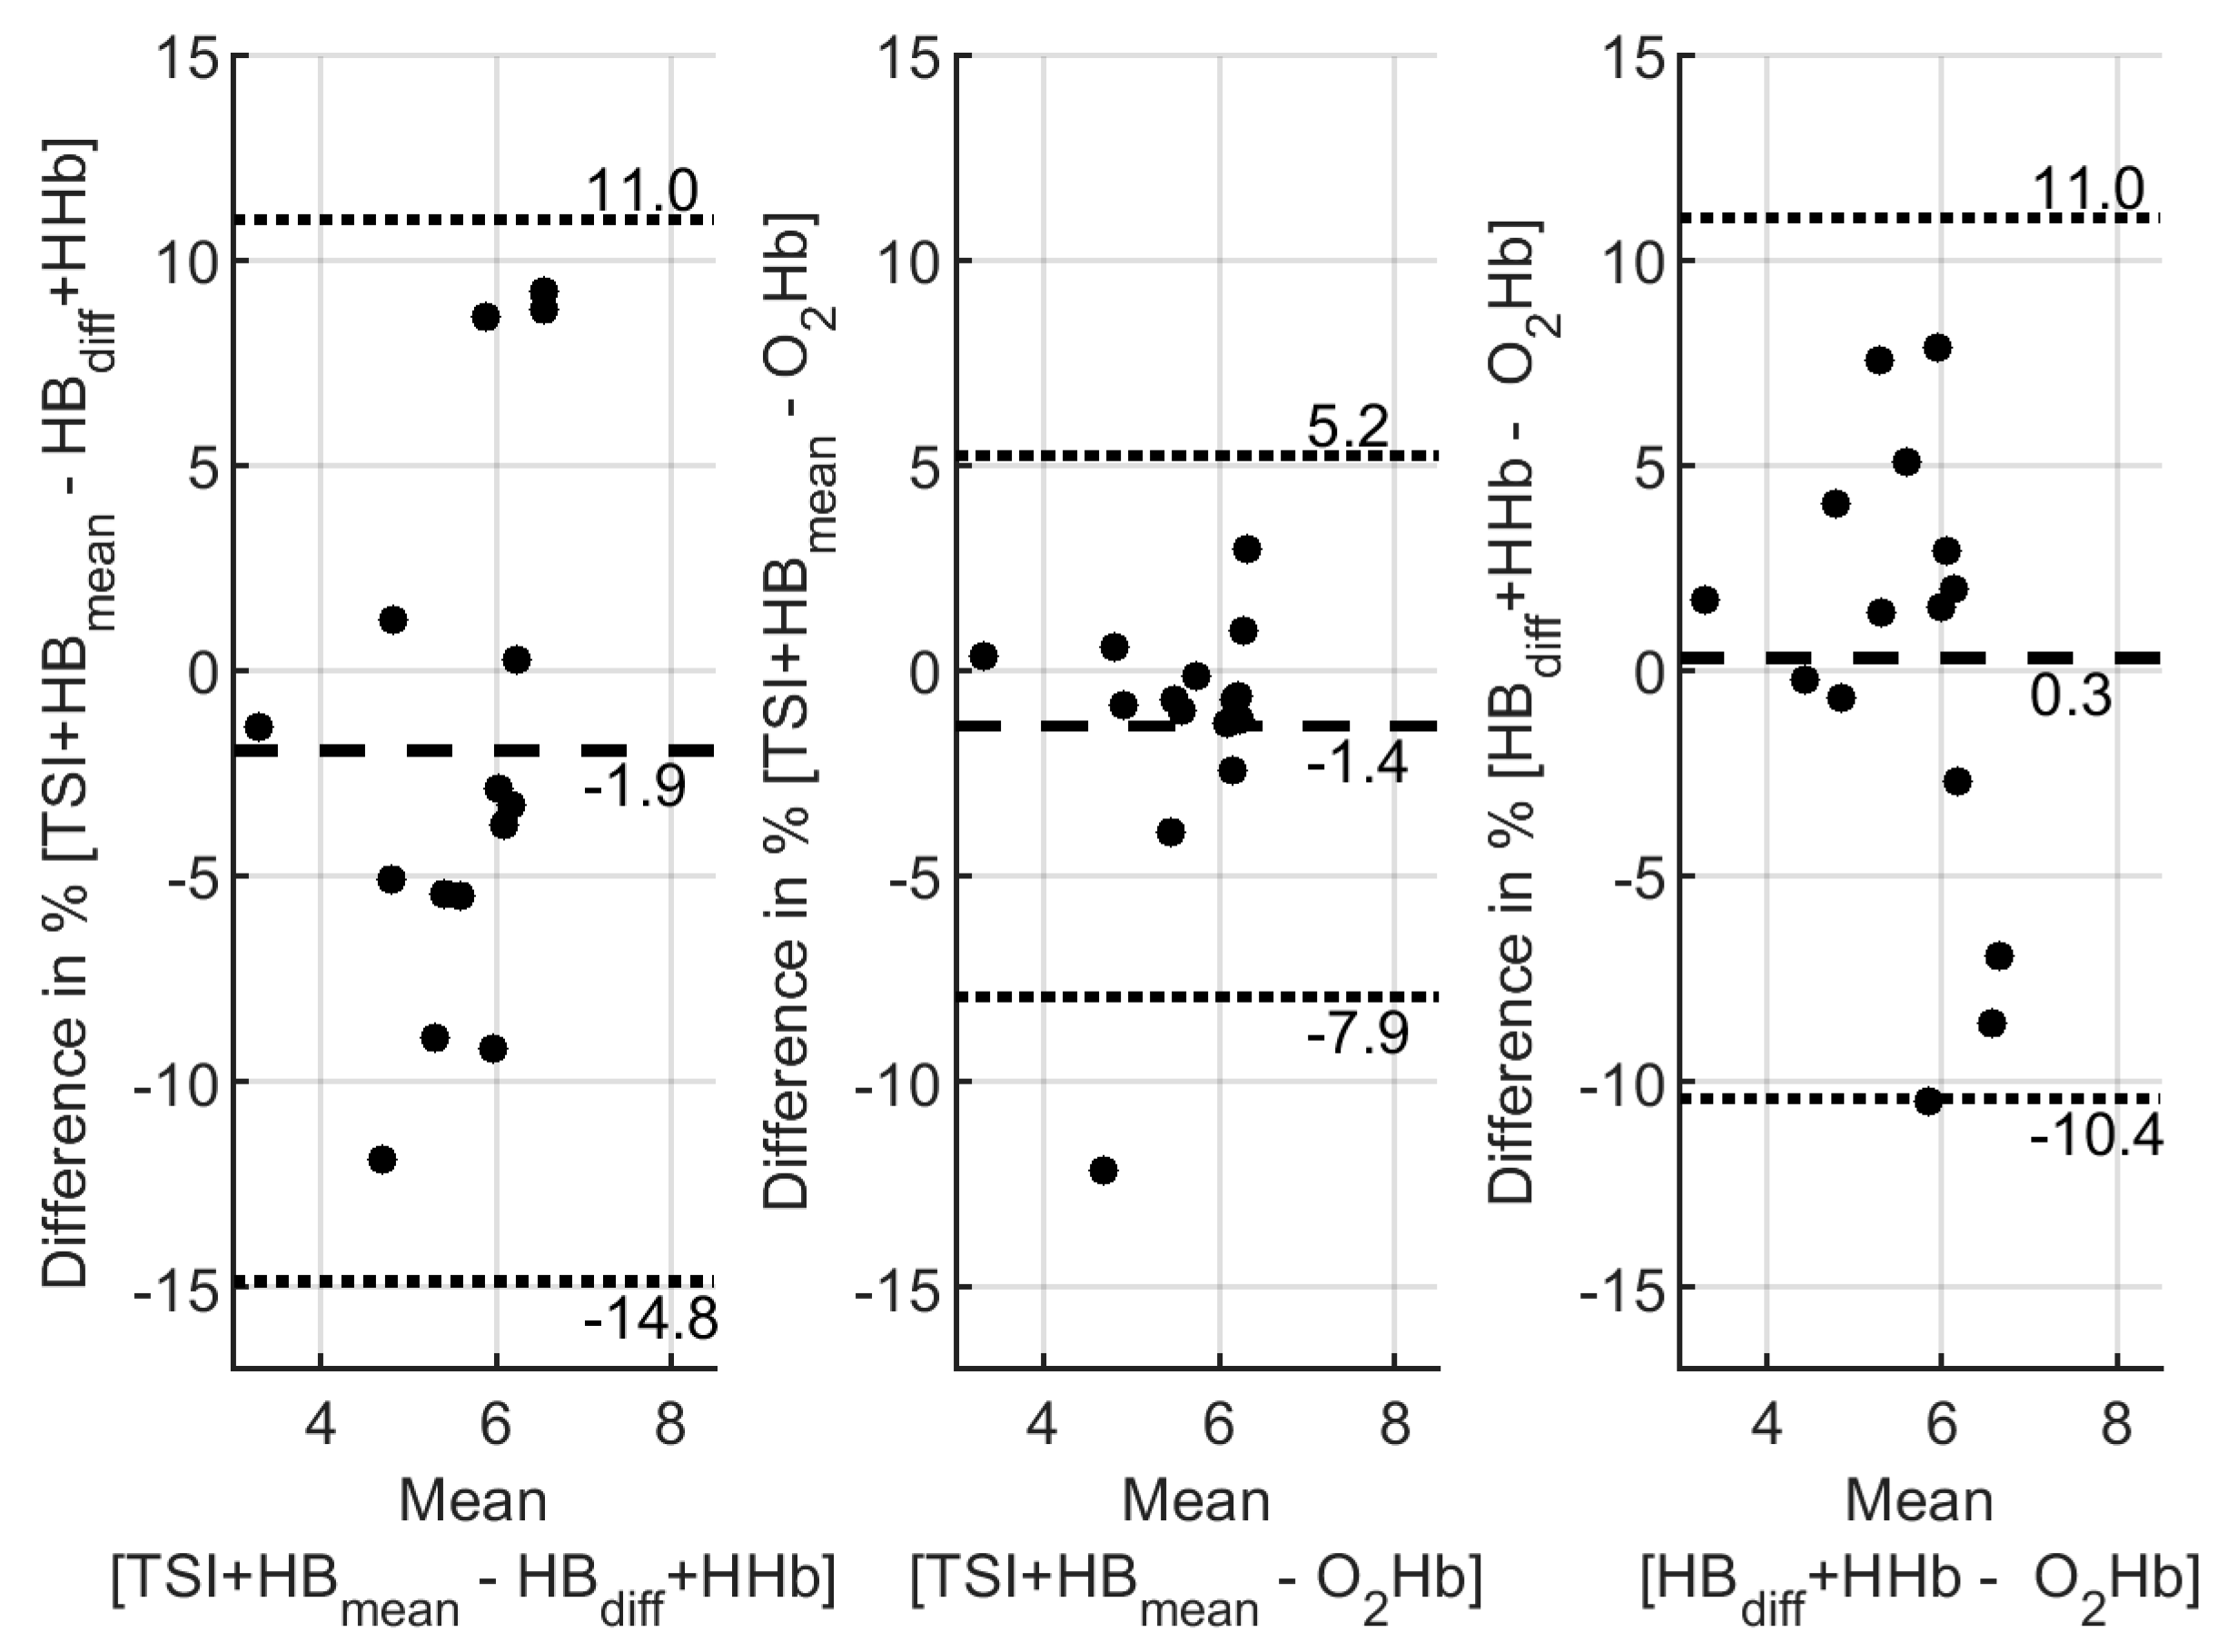
3. Results
4. Discussion
Author Contributions
Funding
Institutional Review Board Statement
Informed Consent Statement
Data Availability Statement
Conflicts of Interest
References
- Scholkmann, F.; Kleiser, S.; Metz, A.J.; Zimmermann, R.; Mata Pavia, J.; Wolf, U.; Wolf, M. A review on continuous wave functional near-infrared spectroscopy and imaging instrumentation and methodology. Neuroimage 2013, 85, 6–27. [Google Scholar] [CrossRef] [PubMed]
- Barstow, T.J. Understanding near infrared spectroscopy and its application to skeletal muscle research. J. Appl. Physiol. 2019, 126, 1360–1376. [Google Scholar] [CrossRef] [PubMed]
- Zhang, C.; Hodges, B.; McCully, K.K. Reliability and reproducibility of a four arterial occlusions protocol for assessing muscle oxidative metabolism at rest and after exercise using near-infrared spectroscopy. Physiol. Meas. 2020, 41, 65002. [Google Scholar] [CrossRef] [PubMed]
- Shaw, K.; Butcher, S.; Ko, J.; Zello, G.A.; Chilibeck, P.D. Wearing of Cloth or Disposable Surgical Face Masks has no Effect on Vigorous Exercise Performance in Healthy Individuals. Int. J. Environ. Res. Public Health 2020, 17, 8110. [Google Scholar] [CrossRef]
- Baláš, J.; Gajdošík, J.; Giles, D.; Fryer, S.; Krupková, D.; Brtník, T.; Feldmann, A. Isolated finger flexor vs. exhaustive whole-body climbing tests? How to assess endurance in sport climbers? Eur. J. Appl. Physiol. 2021, 121, 1337–1348. [Google Scholar] [CrossRef]
- Stöggl, T.; Born, D.-P. Near Infrared Spectroscopy for Muscle Specific Analysis of Intensity and Fatigue during Cross-Country Skiing Competition—A Case Report. Sensors 2021, 21, 2535. [Google Scholar] [CrossRef]
- Zuccarelli, L.; do Nascimento Salvador, P.C.; Del Torto, A.; Fiorentino, R.; Grassi, B. Skeletal muscle Vo2 kinetics by the NIRS repeated occlusions method during the recovery from cycle ergometer exercise. J. Appl. Physiol. 2020, 128, 534–544. [Google Scholar] [CrossRef]
- Malagoni, A.M.; Felisatti, M.; Lamberti, N.; Basaglia, N.; Manfredini, R.; Salvi, F.; Zamboni, P.; Manfredini, F. Muscle oxygen consumption by NIRS and mobility in multiple sclerosis patients. BMC Neurol. 2013, 13, 52. [Google Scholar] [CrossRef]
- Vardi, M.; Nini, A. Near-infrared spectroscopy for evaluation of peripheral vascular disease. A systematic review of literature. Eur. J. Vasc. Endovasc. Surg. 2008, 35, 68–74. [Google Scholar] [CrossRef]
- Paternoster, F.K.; Hahn, D.; Stöcker, F.; Schwirtz, A.; Seiberl, W. Oxygen consumption of gastrocnemius medialis muscle during submaximal voluntary isometric contractions with and without preceding stretch. Sci. Rep. 2017, 7, 77. [Google Scholar] [CrossRef]
- De Ruiter, C.J.; de Boer, M.D.; Spanjaard, M.; de Haan, A. Knee angle-dependent oxygen consumption during isometric contractions of the knee extensors determined with near-infrared spectroscopy. J. Appl. Physiol. 2005, 99, 579–586. [Google Scholar] [CrossRef] [PubMed]
- Perrey, S.; Ferrari, M. Muscle Oximetry in Sports Science: A Systematic Review. Sports Med. 2018, 48, 597–616. [Google Scholar] [CrossRef] [PubMed]
- Booghs, C.; Baudry, S.; Enoka, R.; Duchateau, J. Influence of neural adjustments and muscle oxygenation on task failure during sustained isometric contractions with elbow flexor muscles. Exp. Physiol. 2012, 97, 918–929. [Google Scholar] [CrossRef] [PubMed]
- Boone, J.; Celie, B.; Dumortier, J.; Barstow, T.J.; de Bleecker, J.; Smet, J.; van Lander, A.; van Coster, R.; Bourgois, J. Forearm muscle oxygenation responses during and following arterial occlusion in patients with mitochondrial myopathy. Respir. Physiol. Neurobiol. 2014, 190, 70–75. [Google Scholar] [CrossRef]
- Suzuki, S.; Takasaki, S.; Ozaki, T.; Kobayashi, Y. Tissue oxygenation monitor using NIR spatially resolved spectroscopy. Proc. SPIE 1999, 3597, 582–592. [Google Scholar] [CrossRef]
- Ferrari, M.; Muthalib, M.; Quaresima, V. The use of near-infrared spectroscopy in understanding skeletal muscle physiology: Recent developments. Philos. Trans. A Math. Phys. Eng. Sci. 2011, 369, 4577–4590. [Google Scholar] [CrossRef]
- Ferrari, M. Progress of near-infrared spectroscopy and topography for brain and muscle clinical applications. J. Biomed. Opt. 2007, 12, 62104. [Google Scholar] [CrossRef]
- Lacroix, S.; Gayda, M.; Gremeaux, V.; Juneau, M.; Tardif, J.-C.; Nigam, A. Reproducibility of near-infrared spectroscopy parameters measured during brachial artery occlusion and reactive hypermia in healthy men. J. Biomed. Opt. 2012, 17, 077010. [Google Scholar] [CrossRef]
- Muthalib, M.; Millet, G.Y.; Quaresima, V.; Nosaka, K. Reliability of near-infrared spectroscopy for measuring biceps brachii oxygenation during sustained and repeated isometric contractions. J. Biomed. Opt. 2010, 15, 17008. [Google Scholar] [CrossRef]
- Crenshaw, A.G.; Elcadi, G.H.; Hellstrom, F.; Mathiassen, S.E. Reliability of near-infrared spectroscopy for measuring forearm and shoulder oxygenation in healthy males and females. Eur. J. Appl. Physiol. 2012, 112, 2703–2715. [Google Scholar] [CrossRef]
- van Beekvelt, M.C.; van Engelen, B.G.; Wevers, R.A.; Colier, W.N. In vivo quantitative near-infrared spectroscopy in skeletal muscle during incremental isometric handgrip exercise. Clin. Physiol. Funct. Imaging 2002, 22, 210–217. [Google Scholar] [CrossRef] [PubMed]
- Quaresima, V.; Colier, W.N.; van der Sluijs, M.; Ferrari, M. Nonuniform quadriceps O2 consumption revealed by near infrared multipoint measurements. Biochem. Biophys. Res. Commun. 2001, 285, 1034–1039. [Google Scholar] [CrossRef] [PubMed]
- Celie, B.; Boone, J.; van Coster, R.; Bourgois, J. Reliability of near infrared spectroscopy (NIRS) for measuring forearm oxygenation during incremental handgrip exercise. Eur. J. Appl. Physiol. 2012, 112, 2369–2374. [Google Scholar] [CrossRef] [PubMed]
- Manfredini, F.; Malagoni, A.M.; Felisatti, M.; Mandini, S.; Mascoli, F.; Manfredini, R.; Basaglia, N.; Zamboni, P. A dynamic objective evaluation of peripheral arterial disease by near-infrared spectroscopy. Eur. J. Vasc. Endovasc. Surg. 2009, 38, 441–448. [Google Scholar] [CrossRef] [PubMed][Green Version]
- Agbangla, N.F.; Audiffren, M.; Albinet, C.T. Assesing muscular oxygenation during incremental excercise using near-infrares spectrosscopy: Comparison of three different methods. Physiol. Res. 2017, 66, 979–985. [Google Scholar] [CrossRef]
- De Blasi, R.A.; Cope, M.; Elwell, C.; Safoue, F.; Ferrari, M. Noninvasive measurement of human forearm oxygen consumption by near infrared spectroscopy. Europ. J. Appl. Physiol. 1993, 67, 20–25. [Google Scholar] [CrossRef]
- Ryan, T.E.; Erickson, M.L.; Brizendine, J.T.; Young, H.-J.; McCully, K.K. Noninvasive evaluation of skeletal muscle mitochondrial capacity with near-infrared spectroscopy: Correcting for blood volume changes. J. Appl. Physiol. 2012, 113, 175–183. [Google Scholar] [CrossRef]
- De Ruiter, C.J.; Goudsmit, J.F.A.; van Tricht, J.A.; de Haan, A. The isometric torque at which knee-extensor muscle reoxygenation stops. Med. Sci. Sports Exerc. 2007, 39, 443–453. [Google Scholar] [CrossRef]
- Kooistra, R.D.; Blaauboer, M.E.; Born, J.R.; De Ruiter, C.J.; de Haan, A. Knee extensor muscle oxygen consumption in relation to muscle activation. Eur. J. Appl. Physiol. 2006, 98, 535–545. [Google Scholar] [CrossRef][Green Version]
- Ufland, P.; Lapole, T.; Ahmaidi, S.; Buchheit, M. Muscle force recovery in relation to muscle oxygenation. Clin. Physiol. Funct. Imaging 2012, 32, 380–387. [Google Scholar] [CrossRef]
- Van Beekvelt, M.; Colier, W.N.J.M.; Wevers, R.A.; van Engelen, B.G.M. Performance of near-infrared spectroscopy in measuring local O2 consumption and blood flow in skeletal muscle. J. Appl Physiol. 2001, 90, 511–519. [Google Scholar] [CrossRef] [PubMed]
- De Salles, B.F.; Simão, R.; Miranda, F.; Novaes, J.d.S.; Lemos, A.; Willardson, J.M. Rest interval between sets in strength training. Sports Med. 2009, 39, 765–777. [Google Scholar] [CrossRef] [PubMed]
- Cohen, J. Statistical Power Analysis for the Behavioral Sciences, 2nd ed.; Erlbaum: Hillsdale, NJ, USA, 1988; ISBN 0-8058-0283-5. [Google Scholar]
- JASP Team. JASP (Version 0.11.1) [Computer Software]. 2019. Available online: https://jasp-stats.org/ (accessed on 17 January 2022).
- Ferrari, M.; Binzoni, T.; Quaresima, V. Oxidative Metabolism in Muscle. Phil. Trans. R. Soc. Lond. B 1997, 1354, 677–683. [Google Scholar] [CrossRef] [PubMed]
- Hamaoka, T.; Iwane, H.; Shimomitsu, T.; Katsumura, T.; Murase, N.; Nishio, S.; Osada, T.; Kurosawa, Y.; Chance, B. Noninvasive measures of oxidative metabolism on working human muscles by near-infrared spectroscopy. J. Appl. Physiol. 1996, 81, 1410–1417. [Google Scholar] [CrossRef]
- Praagman, M.; Veeger, H.; Chadwick, E.; Colier, W.; van der Helm, F. Muscle oxygen consumption, determined by NIRS, in relation to external force and EMG. J. Biomech. 2003, 36, 905–912. [Google Scholar] [CrossRef]


| pbonf | Difference [%] | ||
|---|---|---|---|
| TSI | HBdiff | 0.020 | 12.5 ± 11.2 |
| HBmean | 0.271 | 2.4 ± 1.9 | |
| HHb | <0.001 | 12.3 ± 6.0 | |
| O2Hb | <0.001 | 15.5 ± 4.7 | |
| HBdiff | HBmean | 0.002 | 11.6 ± 7.4 |
| HHb | 1.000 | 7.2 ± 5.2 | |
| O2Hb | <0.001 | 24.1 ± 7.7 | |
| HBmean | HHb | <0.001 | 14.1 ± 4.7 |
| O2Hb | <0.001 | 14.1 ± 4.7 | |
| HHb | O2Hb | <0.001 | 24.5 ± 7.3 |
| Bias [%] | LoA [%] | Range [%] | |
|---|---|---|---|
| TSI and Hbmean—Hbdiff and HHb | −1.9 | 11/−14.8 | 12.9 |
| TSI and Hbmean—O2Hb | −1.4 | 5.2/−7.9 | 6.6 |
| Hbdiff and HHb—O2Hb | 0.3 | 11.0/−10.4 | 20.4 |
Publisher’s Note: MDPI stays neutral with regard to jurisdictional claims in published maps and institutional affiliations. |
© 2022 by the authors. Licensee MDPI, Basel, Switzerland. This article is an open access article distributed under the terms and conditions of the Creative Commons Attribution (CC BY) license (https://creativecommons.org/licenses/by/4.0/).
Share and Cite
Paternoster, F.K.; Seiberl, W. Comparison of Different Approaches Estimating Skeletal Muscle Oxygen Consumption Using Continuous-Wave Near-Infrared Spectroscopy at a Submaximal Contraction Level—A Comparative Study. Appl. Sci. 2022, 12, 2272. https://doi.org/10.3390/app12052272
Paternoster FK, Seiberl W. Comparison of Different Approaches Estimating Skeletal Muscle Oxygen Consumption Using Continuous-Wave Near-Infrared Spectroscopy at a Submaximal Contraction Level—A Comparative Study. Applied Sciences. 2022; 12(5):2272. https://doi.org/10.3390/app12052272
Chicago/Turabian StylePaternoster, Florian Kurt, and Wolfgang Seiberl. 2022. "Comparison of Different Approaches Estimating Skeletal Muscle Oxygen Consumption Using Continuous-Wave Near-Infrared Spectroscopy at a Submaximal Contraction Level—A Comparative Study" Applied Sciences 12, no. 5: 2272. https://doi.org/10.3390/app12052272
APA StylePaternoster, F. K., & Seiberl, W. (2022). Comparison of Different Approaches Estimating Skeletal Muscle Oxygen Consumption Using Continuous-Wave Near-Infrared Spectroscopy at a Submaximal Contraction Level—A Comparative Study. Applied Sciences, 12(5), 2272. https://doi.org/10.3390/app12052272