Abstract
Recently, many muscle synergy-based human motion prediction models and algorithms have been proposed. In this study, the muscle synergies extracted from electromyography (EMG) data were used to construct a musculoskeletal model (MSM) to predict the joint angles of the wrist, thumb, index finger, and middle finger. EMG signals were analyzed using independent component analysis to reduce signal noise and task-irrelevant artifacts. The weights of each independent component (IC) were converted into a heat map related to the motion pattern and compared with human anatomy to find a different number of ICs matching the motion pattern. Based on the properties of the MSM, non-negative matrix factorization was used to extract muscle synergies from selected ICs that represent the extensor and flexor muscle groups. The effects of these choices on the prediction accuracy was also evaluated. The performance of the model was evaluated using the correlation coefficient (CC) and normalized root-mean-square error (NRMSE). The proposed method has a higher prediction accuracy than those of traditional methods, with an average CC of 92.0% and an average NRMSE of 10.7%.
1. Introduction
Aging populations, upper limb loss, and motor deficits pose significant challenges to healthcare systems in modern societies [1]. In response to these growing problems, technologies for constructing wearable robots, such as exoskeletal devices and prostheses for medical rehabilitation or compensation of motor deficits, are being developed. These devices and systems can reduce stress on the healthcare system, such as the shortage of physical therapists and caregivers, by enabling older adults or people with motor disabilities to perform daily activities in home environments [2,3].
Non-invasive electromyography (EMG), as a control signal, is one of the most popular and intuitive interfaces for controlling robotic devices [4,5]. EMG refers to physiological signals generated during muscle contraction. With special processing expenditures (e.g., root-mean-squared (RMS)), researchers can extract movement-related information from this physiological signal to predict the intended movement of a user. In recent years, researchers have developed numerous EMG control methods based on machine and deep learning [6,7,8]. Qin et al. recently proposed a convolutional neural network (CNN)–based regression model for simultaneously predicting three motions of the forearm (flexion and extension of the wrist, pronation and supination of the arm, and gripping and opening of the hand). The highest correlation coefficients (CCs) of the 3 degrees of freedom were 97%, 96%, and 92%, respectively [9]. Apart from the joint angles, other parameters can be used to predict the grip force [10,11]. Yokoyama et al. used four-channel EMG signals to predict grip force using an artificial neural network (ANN) [12]. Prediction accuracy was evaluated using three different methods (in-session, within-subject, and between-subject assessments); the correlations between the predicted and measured forces were 0.840, 0.770, and 0.789, respectively. Machine learning–based prediction methods tend to use feature data to establish a relationship between EMG signals and forearm motion. However, these models cannot explain the EMG signals and neural instructions.
To develop models in which the internal parameters are directly correlated with muscle tension, some researchers have attempted to build mathematical muscle models using EMG-based signals [13,14,15]. Shin et al. developed a musculoskeletal model (MSM) based on anatomical and physiological data to estimate joint torque using EMG [16]. Kawase et al. further improved the MSM and used it to simultaneously predict the angle and stiffness of the wrist [17]. These models require the use of muscle-specific EMG signals to adjust the parameters and adapt the model to the individual to obtain the best predictive performance. Thus, a key challenge to this approach is the lack of EMG data for muscles that contribute significantly to the joint torque. This is because surface electrodes cannot measure EMG signals from deeper muscles, and several issues need to be addressed, including crosstalk noise between the adjacent muscles. The issue of crosstalk noise in EMG signals is more severe when using high-density (HD) surface electromyogram grids or array EMG systems than when using conventional EMG electrodes [18]. To separate specific deep muscle signal sources, a blind source separation algorithm called independent component analysis (ICA) was used to separate overlapping muscle signals in the sensor. The advantages of ICA have been confirmed by several studies on EMG to obtain deep muscle source signals from performed motions, such as reducing errors in gesture classification [19] and improving the accuracy of force prediction [20]. In addition to the aforementioned advantages, another advantage of ICA is the compression of the incoming force signal, which reduces the computational cost.
The human musculoskeletal system has a highly redundant structure, and the redundancy issue remains an unresolved problem. To solve this redundancy problem, an approach called muscle synergy has been proposed, in which the motor system is reduced to a module in which multiple muscles work in a coordinated manner [21,22,23]. Muscle synergy was extracted from the EMG signal, where each synergy consisted of two components: the weight of the muscle under synergy, and its time-varying synergy excitations. Muscle synergy has been widely used in the study of human limb movements to analyze the muscle activation patterns in motor tasks [24,25,26]. Several recent studies have used muscle synergy information for predictive analyses [27,28]. Kim et al. used synergy-based linear regression models to estimate wrist joint angles with and without grip motion [29]. The results showed that the predictive performance of the synergy-based linear regression model was similar to that of the traditional EMG-based MSM, with a CC of 0.7891 ± 0.0844. Whether the central nervous system employs this low-dimensional embedding to generate motor behavior remains an open question; these innovative studies certainly show the potential of muscle synergy in predicting potential human limb movements [30]. Notably, the aforementioned studies aimed to use muscle synergy to develop prediction strategies that focus on wrist movements (flexion/extension and radial/ulnar deviation). The use of muscle synergy to predict finger movements has not been well studied, and the performances of these models remain unclear.
To facilitate the clinical application of muscle synergy-based neurorehabilitation techniques, we propose an ICA-based muscle synergy extraction method that is introduced into the MSM (Synergy-MSM) to estimate the metacarpophalangeal (MCP) angles of the thumb, index finger, and middle finger. The accuracy of prediction using the proposed method was also tested for the wrist joint. This study evaluated whether using muscle synergy extracted from ICA data can improve the predictive performance of the MSM and compared the developed model with two traditional prediction methods: the linear regression model (LRM) and support vector regression (SVR). Data were collected using a 32-channel array EMG system, and the signals were analyzed using ICA. Non-negative matrix decomposition (NMF) was then used to extract muscle synergies from selected independent components (ICs) representing the extensor and flexor muscle groups. The effects of these choices on the prediction accuracy were also evaluated.
2. Materials and Methods
The proposed approach aims to develop a musculoskeletal model based on muscle synergy for the continuous estimation of hand and wrist motion. Subsequently, the proposed method, traditional MSM, and regression method, which used muscle synergy as the input, were compared. Figure 1 depicts each step of the experiment.
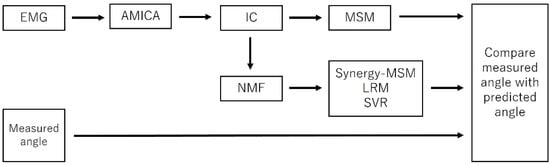
Figure 1.
Process flow showing steps used in this study. The IC is calculated using AMICA, and the calculated IC is used to train the MSM. The muscle synergy calculated using IC is then used to train Synergy-MSM, LRM, and SVR, respectively. Finally, the measured angles are compared with the angles predicted by the model.
2.1. Subjects
A total of 9 healthy participants (8 men, 1 woman; mean age: 25 ± 2 years) participated in this study. All the research procedures complied with the ethics committee of the Tokyo Institute of Technology and were performed in accordance with the Declaration of Helsinki. Prior to the start of the experiment, a description of the experiment was provided to the subject, and written informed consent was obtained.
2.2. Experiment
During the experiment, the subject’s forearm was placed on a table and secured using a wrist strap. Throughout the experiment, the subjects were asked to perform cyclic single-joint tasks of the wrist and fingers within 30 s. The following is a description of the periodic monoarticular task. The subjects were instructed to perform the task from the rest position, flex the joint to its maximum range of motion and maintain it for 2 s, return to the rest position for 2 s, extend the joint to its maximum range of motion and maintain it for 2 s, and return to the rest position. This group of motions was repeated three times for each task. The wrist task included radial and ulnar motions, in addition to extension and flexion. The extension/flexion motions of the index finger, middle finger, thumb, and wrist, as well as the radial/ulnar motions of the wrist, were performed 11 times for each task.
The data from the first task for each joint were used to extract the weights and sphere matrices of ICA, as described in a later section. The obtained weights and sphere matrices were used to calculate the ICs from the remaining 10-task data and then composed into a dataset for training and testing. Thus, before the first task was performed, the participants were encouraged to complete the extension/flexion motion at a slower rate. In later tasks, the subjects were encouraged to complete each motion at a faster speed, as the goal was to study natural human hand motions. To prevent muscle fatigue, the subjects were asked to relax for 1 min after completing each task and before starting the next task. Feedback on the joint angle was provided during the experiment, and the subjects could adjust the joint angle back to the resting position after completing the movement based on the feedback.
2.3. Data Acquisition
EMG signals were acquired at a frequency of 500 Hz using 32-channel bipolar multiarray electrodes (SMK Co., Ltd., Tokyo, Japan) [31]. Multiarray EMG sensors (1 cm × 1 cm) were embedded in a specially designed sleeve and placed equidistantly on the extensor and flexor sides of the sleeve, as shown in Figure 2. Thus, the muscle position corresponding to the EMG electrodes varied depending on the size of the subject’s arms. The EMG signals were recorded at 500 Hz with a resolution of 16 bits [9].
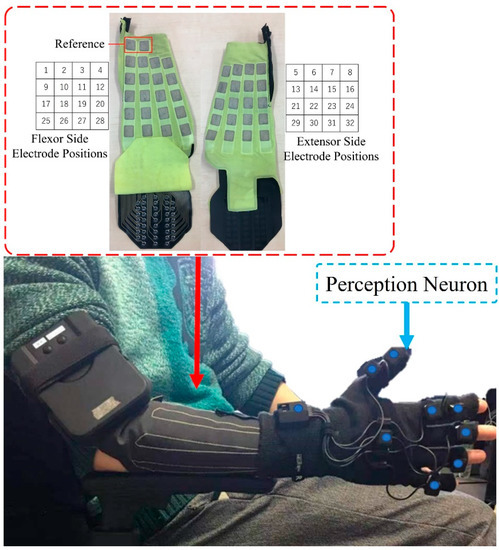
Figure 2.
Thirty-two-channel multiarray electrode forearm gloves and the Perception Neuron Motion Capture System. The blue point on each location represents the sensor of the perception neuron.
The joint angles of the subjects were measured using a Perception Neuron Motion Capture System (Noitom Ltd., Beijing, China). In the present experiments, only the right- or left-hand portion of the glove was used, depending on the dominant hand of the subject. As shown in Figure 2, nine sensor units were located on different parts of the hand in the glove of the perception neuron. For the target joints in this study, that is, the MCP joints of the thumb and index finger, the device was equipped with a separate sensor unit to determine and record the spatial positions of the joints. For the middle finger, only one sensor unit was used to collect the spatial position data of the MCP joint. While using only the glove, the sampling frequency in the Perception Neuron Motion Capture System was set to 120 Hz. The measured angle data were resampled at 500 Hz to match the sampling rate of EMG data. During the experiments, a laboratory streaming layer system was used to synchronously collect both EMG and joint angle data [32].
2.4. Independent Component Analysis and IC Weight Based Topological Plot
ICA is a blind source separation method used to solve the cocktail party problem. The following assumptions must be met when applying the ICA model: (1) the measured signals are linearly mixed independent signals, and (2) the sources are non-Gaussian distributed signals [33]. It was assumed that the best signal location for estimating motion was the primary active muscle associated with the motion. The ICA was applied to the EMG signal of the forearm to identify the active muscles associated with each action. The ICA can be expressed as:
where is the EMG data matrix obtained from measurements at time point, and represents the number of channels. is the mixing matrix of . is the matrix of the source signals, which are assumed to be independent of each other.
It is difficult to determine the IC matrix or mixing matrix when they are unknown. Thus, to separate the mixed EMG signals, a separation matrix must be obtained. Once matrix is calculated, the approximation of the source signal is given by Equation (2):
Figure 3 illustrates the flow of the ICA process. First, the EMG data were loaded in MATLAB and imported into EEGLAB. As a preprocessing step, band-pass filtering between 3 and 500 Hz was performed to reduce noise and artifacts. Adaptive component analysis (AMICA) was selected owing to the advantages mentioned by Palmer et al. [34]. More importantly, AMICA exhibits a better separation performance than other ICA methods for very short data lengths [35].
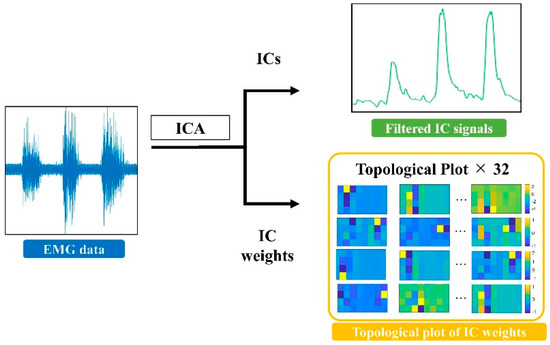
Figure 3.
Independent component analysis was performed on the raw EMG data. After independent component analysis, IC signals were rectified and filtered at a cut-off frequency of 3 Hz by a low-pass filter. The weights of IC were then converted into a topological plot. The yellow locations were assigned high weight values, and the blue locations were assigned low weight values. A higher weight value indicates greater exertion in the muscles in that area during the particular motion.
After decomposing the thirty-two channels of EMG signals with AMICA, the IC signals were rectified and low-pass filtered with a cut-off frequency of 3 Hz [36]. The filtered IC signals were used to extract muscle synergy, and the weights of the ICs were converted into a topological plot for analysis. Figure 3 shows a topological plot of the IC weights for the subjects during middle finger flexion. As shown in Figure 3, the IC weights were highly localized during single-finger flexion, indicating that the muscles in this location experienced intense activity during this action. Channels with low signal energies are typically muscles that are not associated with action. Therefore, by post-analysis of the IC weights, the topological plot of the IC weights can be compared with muscle anatomy data.
2.5. Estimation Model
2.5.1. Musculoskeletal Model
Figure 4 presents an overview of the MSM, and a detailed proof of the relevant formula can be found in [17]. The MSM assumes that each muscle has the characteristics of a linear spring, and the tension of each muscle varies with muscle activation and joint angle. Additionally, the MSM considers the activities of multiple flexors and extensors on the joints as a whole. Therefore, in this model, the flexor and extensor muscle groups are each represented by a single muscle. The joint torque is expressed as
where represents the torque of the joint, represents the moment arm of muscle , is the muscle stiffness, is the change in the natural length of the muscle, and is the joint angle.
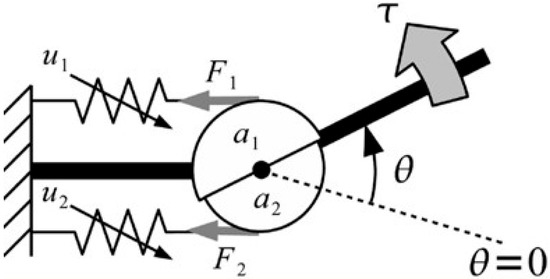
Figure 4.
Structure of MSM [17]. represents the motion instruction to the muscle, represents the force generated when the muscle is contracted, represents the moment arm of the joint, and represents the torque of the joint. Because of its elasticity, when a muscle contracts, force is generated in the joints. It is assumed that the joint angle is equal to the angle of the mechanical equilibrium point of the musculoskeletal system.
The equilibrium point is defined as the angle at which the torque generated by the muscle is balanced until motion stops, when no external force is applied to the joint. By substituting into Equation (1), the equilibrium point of the joint is given by Equation (4):
2.5.2. Linear Regression Model
A linear regression model (LRM) employs the least squares function, called the linear regression equation, to model the relationship between one or more independent and dependent variables. In this study, the LRM can be expressed as:
where is the estimated joint angle. is the angular intercept of the joint. is the regression coefficient of the flexor muscles. is the regression coefficient of the extensor muscles, is the synergy representing the flexors, is the synergy representing the extensors, and is the error term. MATLAB (2021b) was used to build the LRM.
2.5.3. Support Vector Regression
SVR is an extension of the support vector machine (SVM) [37] and is used for numerical prediction. The SVM is a supervised classification system that can find the maximum margin hyperplane separating two types of data. The training instance closest to this hyperplane is called the support vector. SVR with a radial basis function (RBF) core was used for comparison with other models. The SVR function is expressed as follows:
where denotes the Lagrange multipliers obtained in the minimization process, is the bias, and is the RBF kernel function. The form of this function is
In this study, the scikit-learn library in Python was used to build an SVR model. The GridSearchCV function of sklearn was applied to the training data using a grid search, and five-fold cross-validation was used to adjust the hyperparameters , , and .
2.6. Non-Negative Matrix Factorization
Non-negative matrix factorization (NMF) was used to extract the muscle synergy from the selected ICs (ICA-synergy). NMF uses nonlinear optimization to iteratively find a potential nonunique solution [38]. NMF is constrained by non-negative constraints, where non-uniqueness is the result of non-convexity of the search space. The NMF was selected for the extraction of muscle synergies for two reasons. First, studies have shown that NMF can reconstruct muscle activation patterns better than other decomposition methods [39,40]. Second, the muscle synergy extracted with NMF was limited to non-negative values, which is consistent with the characteristics of muscle activity. The IC of the channels, which is decomposed from the original EMG signal, is decomposed into:
where denotes an time-point matrix; is the number of calculated ICs; is an matrix, where and are the numbers of ICs and synergies, respectively; and C is an matrix. Variance accounting for (VAF) ≥ 90% is commonly used in studies on muscle synergy to determine the optimal amount of muscle synergy [41,42]. The MSM simplifies the muscle groups used to control joint extension and flexion into two muscles and uses the motion signals of these two muscles as inputs for the model. To achieve a fair comparison with other regression models and fit the MSM, the number of synergies was limited to two, where the VAF of the muscle synergies was ≥80% [43].In other words, one synergy represents the extension activity and the other represents the flexion action. Based on the results of previous studies on the relationship between the number of synergies and single-joint motion, two synergies are sufficient to describe the extension and flexion motions of a single joint [44].
2.7. Performance Indicators
A five-fold cross-validation procedure was adopted to evaluate the performances of the four models. The dataset was divided into five subsets: one subset at a time was removed for testing and the remaining four subsets were used for training. This procedure was repeated five times, and the results were averaged over the five validation results. The and normalized root-mean-square error () are two indicators used to evaluate the model. The formula used was as follows:
where is the number of samples; and are two variables; is the standard deviation of each variable set; and and denote the maximum and minimum values of the measured angle, respectively. Student’s t-test was used to test the differences between the results. All statistical analyses were performed using the MATLAB (2021b) software.
3. Results
For the traditional MSM, we used the channel selection method suggested by Stapornchaisit et al. [45]. The two criteria are as follows: (1) the channel must be in the area where the expected active muscle is located, and (2) the highest correlation exists between the ICs and the acquired measured joint motion. For the Synergy-MSM and regression methods, the CC was calculated between each IC component based on the angle measured during finger flexion and extension. To determine the optimal number of ICs, two ICs were initially selected, and the IC component with the highest CC was gradually selected as the input data. The ICs with the highest CC for flexion and extension of the joint were prioritized for selection, and the synergy was calculated using NMF, followed by the modeling and evaluation of the estimated performance of the model. This stepwise process continued until 16 channels (half the number of ICs related to flexion and extension) were selected. The average NRMSE of the five joints was then calculated from the angles predicted by the models and the measured angles to evaluate the predictive performance of each model with different numbers of ICs and determine the best model. Figure 5 shows the prediction performance of each model for different numbers of ICs for Subject 5. The results show that for Subject 5, the average NRMSE was lowest when 12 ICs were selected for modeling in the Synergy-MSM; for the Synergy-LRM, the average NRMSE was lowest when 4 ICs were selected for modeling; and for Synergy-SVR, the average NRMSE was lowest when 4 ICs were selected for modeling.
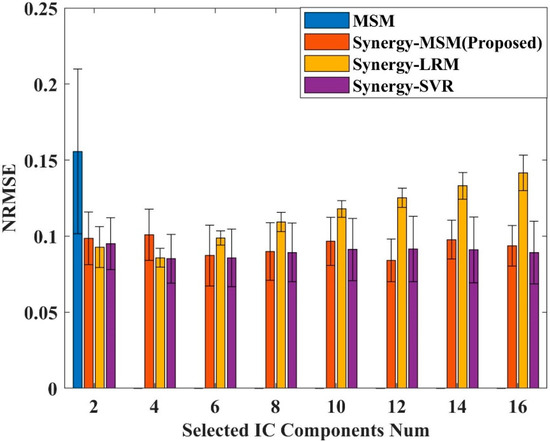
Figure 5.
Average NRMSE for prediction using different numbers of IC components for Subject 5. The IC components were selected from the angles measured during joint flexion and extension and the CC values between the IC components. Half the number of IC components are correlated with flexion and the other half are correlated with extension.
Finally, the estimates from the four models were compared with the joint angles measured using motion capture to calculate CC and NRMSE. Statistical p-value below 0.05 was considered statistically significant. Figure 6 shows the prediction results for Subject 5 when the fitting was performed using the model with the optimal number of ICs for each method. The blue dashed lines represent the measured angles, and the red, yellow, purple, and green lines represent the data from the Synergy-MSM, MSM, Synergy-LRM, and Synergy-SVR, respectively. The results show that the proposed method can predict the MCP joints of finger and wrist movements. Moreover, the error for the developed model was lower than those of the other methods. The results for the thumb are shown in Figure 6. Figure 6c shows that the proposed method provides a better fit for predicting thumb extension motions (from the 0° to −° direction), which were not predicted by other methods.
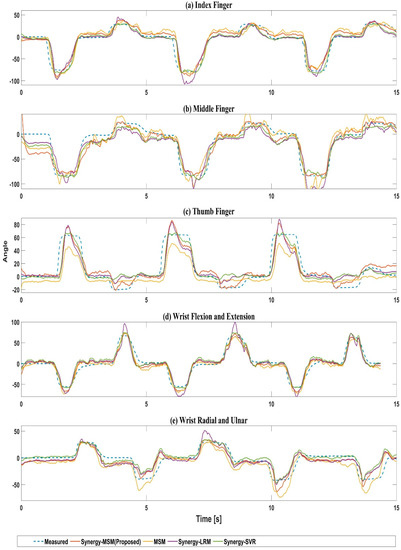
Figure 6.
Test results for Subject 5: For (a) index finger, and (b) middle finger, and (d) flexion and extension motions of the wrist, the angle from 0° to −° corresponds to the flexion motion and 0° to +° corresponds to the extension motion. For (c) the thumb, 0° to +° corresponds to the flexion motion, and 0° to −° corresponds to the extension motion. For (e) radial and ulnar deviations of the wrist, 0° to +° corresponds to the radial deviation, 0° to −° corresponds to the ulnar deviation. The blue dashed line indicates the measurement angle of Perception Neuron. The red line is the estimated value from the Synergy-MSM, the yellow line is the estimated value from the MSM, the purple line is the estimated value from Synergy-LMR, and the green line is the estimated value from synergy-SVR.
Figure 7 shows the mean results for each joint for all the subjects, with the CC and NRMSE values expressed as boxplots and barplots, respectively. Table 1 presents the exact statistics for the four models. For the Synergy-MSM, average CC = 92.0 ± 5% (Synergy-MSM vs. other models, p < 0.01); average NRMSE = 10.7 ± 1% (Synergy-MSM vs. MSM and SVR, p < 0.01, Synergy-MSM vs. LRM, p < 0.05). For the MSM, the average CC was 88.0 ± 9% (MSM vs. Synergy-MSM and SVR, p < 0.01), and the average NRMSE was 15.9 ± 2% (MSM vs. other models, p < 0.01). For LRM, average CC = 87.9 ± 9% (LRM vs. Synergy-MSM and SVR, p < 0.01), average NRMSE = 11.5 ± 1% (LRM vs. Synergy-MSM and MSM, p < 0.01). For SVR, average CC = 89.9 ± 9% (SVR vs. other models, p < 0.01), average NRMSE = 11.9 ± 2% (SVR vs. Synergy-MSM and MSM, p < 0.01).
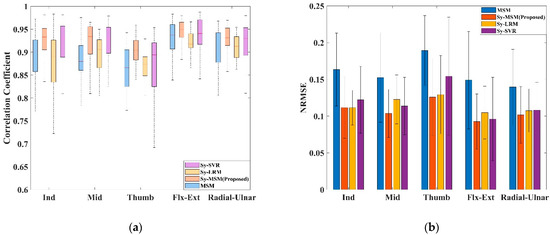
Figure 7.
Comparisons of five-fold cross-validation results of all models: (a) Average correlative coefficient of the best performance models of all subjects. (b) Average NRMSE of the best performance models of all subjects.

Table 1.
Average statistics for various models.
This comparison demonstrates that the three models employing ICA-synergy to estimate the joint angles have lower CC and NRMSE values than those of the MSM, and the proposed Synergy-MSM shows better performance and robustness than those of the other models. Among the four models, the Synergy-MSM provided better performance and robustness than those of the original MSM. The average CC and NRMSE of the Synergy-MSM (4.0% and 5.2%, respectively) were better than those of the MSM. The LRM with ICA-synergy as the input also showed excellent performance, although the LRM is the simplest model.
4. Discussion
An MSM for predicting joint angles based on muscle synergy was developed, and its performance was evaluated by comparing it with the original method and other traditional prediction methods. According to our previous study, the proposed method uses ICA-based muscle synergy as the input for the model [46]. Specifically, the raw EMG signal was first decomposed using ICA, after which the independent components were extracted using NMF for muscle synergy. Because different numbers of independent components affect muscle synergy, the optimal number of extracted independent components must be confirmed. After confirming the optimal number of decomposed independent components for each subject, the extracted muscle synergy was used to train the Synergy-MSM. The results obtained with the Synergy-MSM were also compared with those of traditional MSM, LMR, and SVR.
The reliability of the continuous estimation of joint angles using a muscle-synergy-driven model has not been investigated previously. Previous studies have demonstrated that the robustness and performance of motion classification are better when synergistic features are used than EMG feature sets [46,47]. Stapornchaisit compared the results with and without the MSM, and the current results of the MSM are compatible with the previous results [45]. Herein, it was confirmed that the MSM with muscle synergy is more effective for estimating continuous joint motion than the traditional MSM and also has excellent performance compared with other regression models. The results without the MSM had lower accuracy than that of the results with the MSM. In conclusion, the results using synergy activities were better than the results using each muscle activity with or without the MSM.
Previous studies have investigated the optimal number and location of electrodes on the forearm to obtain information representative of muscle activation and motor robustness [48,49]. It has been pointed out that the user’s arm position affects changes in the activity of the EMG signals, and different patterns of forearm muscle activity are observed during the same motion [49]. From this perspective, the performance of EMG-based motion prediction can be improved if specific locations of muscle activity can be identified during wrist and single-finger motion. In this study, attempts were made to identify specific muscle activity locations associated with motion using a topological plot of the weights of the independent components. The ICs of these muscle locations that contribute significantly to specific motions were then gradually increased from 2 to 16 in multiples of 2 to analyze how the 2 synergies computed from these ICs affect the predictive power of the model. The selected muscle activity locations were ranked from highest to lowest based on the IC component, by considering the CC of the joint angles during flexion and extension.
Herein, the motor activation pattern of the index finger was selected for illustration. The topological plot for Subject 7 is shown in Figure 8a. Figure 8a shows the weight of the IC from the sensor locations, which are divided into two parts representing the flexor side (left) of flexion and extensor side (right) of the extension muscle groups, where the colors indicate the weights assigned to the specific ICs of each sensor in the EMG sensor. The synergy weight patterns and synergy vectors extracted through the NMF are shown in Figure 8b. Figure 8c shows the measured and estimated joint angles. The topological plot and muscle synergy data for the other subjects are provided in Supplementary Materials. In the flexion motion of the index finger, the muscle synergy representing flexion consists mainly of IC data around locations 1, 2, 10, 18, and 26 in the topological plot. The deep flexor digitorum profundus and flexor digitorum superficialis muscles correspond to these locations. The former is responsible for flexion motions of the distal joints of the index, middle, ring, and little fingers, whereas the latter mainly acts on the metacarpophalangeal and interphalangeal joints of the flexed fingers. In the extension motion of the index finger, the muscle synergy representing the extension consisted mainly of data around locations 7, 15, 24, and 30 in the electrode positions. These locations corresponded to the extensor digitorum muscle. Therefore, we created a topological plot based on the best model for each subject to investigate the calculated muscle synergies further. Analysis of the topological plot for all subjects demonstrated that they showed similar motor patterns when performing specific movements, despite the fact that each subject’s best model had a different number of ICs. Moreover, unique motor activation patterns were confirmed in other joints such as the middle finger, thumb, and wrist. The motion patterns corresponding to the different joints were also confirmed in the topological plot of other joints, such as the middle finger, thumb, and wrist.
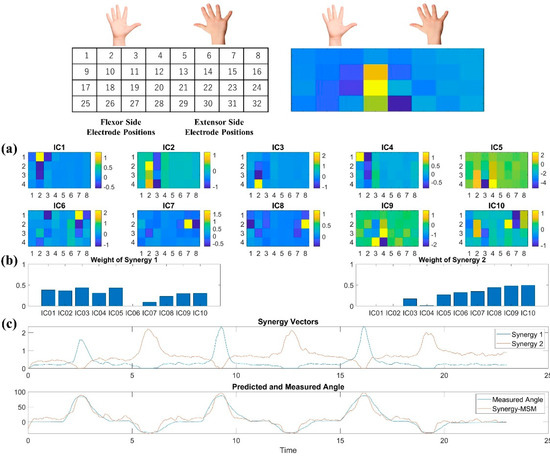
Figure 8.
Post hoc analysis for the best model of Subject 7. (a) Topology Plot of IC weight, the yellow locations denote motion-related regions to muscle. (b) Synergy weight patterns and synergy vectors of Subject 7 in the task. The blue-colored line represents the flexion motion, and the red-colored line represents the extension motion. (c) The extracted muscle synergy was found to be highly correlated with the motion by comparison with the measured joint angles. At the top of figure shows the correspondence between hand anatomy and the position of IC.
Compared with the Synergy-MSM, the traditional MSM selects only the two ICs with the highest CC for flexion and extension motions as inputs. In contrast, the proposed ICA-synergy extraction method can afford a higher prediction accuracy by extracting the synergy representing both extensor and flexor muscle groups by selecting deep and superficial muscle locations with a high contribution to the movement according to the movement situation. As shown in Figure 5, the predictive performance of the Synergy-MSM was better than that of the MSM when the two ICs were used as inputs for the model. The MSM and Synergy-MSM use the same ICs, differing only in that the Synergy-MSM extracts muscle synergies using IC and then uses them as inputs for the model. This suggests that the ICA-synergy provides better predictive performance than the ICA-EMG counterparts. As mentioned in the Introduction, human motion may be controlled by a set of low-dimensional excitation primitives, rather than by each muscle. In our opinion, this is precisely why the muscle synergy extracted by NMF can better represent motor commands, and thus enables more accurate prediction.
The proposed method is also advantageous for compressing multidimensional data into two input signals, thereby reducing computational costs, which is conducive to real-time control systems. At this stage, to investigate the use of ICA-synergy to predict the maximum performance of a single joint, the IC was obtained using only the motion data of the corresponding joint. Although the IC weights of the thumb and wrist had corresponding movement patterns in the topological plot, the movement patterns of the index and middle fingers were more similar. The reason for this is related to the fact that the dominant muscles of the index and middle fingers are the same group of muscles. This may affect the performance of simultaneous multifinger predictions. Perhaps the use of all types of movement data to derive weights and spherical matrices for ICAs containing multiple motion patterns to calculate the ICs could improve the performance of the proposed method for real-time control and simultaneous multifinger prediction.
Compared with recent studies that predict finger movements, the Synergy-MSM exhibits higher performance and better robustness [50,51]. Knowledge of the structure of the muscle position is crucial for acquiring a better EMG signal. This is a non-negligible burden on users who do not have relevant knowledge. With this in mind, our method uses an array EMG system to acquire EMG signals. The advantage of this is that the use of the array EMG system largely reduces the impact of the user’s placement in the sensor. In addition, we used ICA-synergy to identify the activated muscles of each subject and to compress the dimensionality of the input signal. We envision that these advantages of exoskeletal parts could reduce the burden of EMG electrode placement on the user, reduce the complexity of the system, and provide better predictive performance.
The performance of the model using ICA-synergy was significantly better than that of the model using ICA-EMG. This improved performance was attributed to the ability of the developed method to delineate muscle activity to optimally recombine muscle activation with motion patterns. However, this study has two important limitations. Because of the properties of the MSM, and to facilitate the fairest possible comparison of the four models, only two synergies were considered for the predictive modeling of the single-joint motions of the forearm. It has been suggested that two synergies are sufficient to describe single-joint motion. However, there is no consensus regarding the optimal number of synergies for describing motion in muscle synergy studies [22,52]. In addition to mainstream NMF muscle synergy, other extraction techniques, such as PCA, second-order blind identification, and factor analysis can be used. Further investigation of how these variations affect models that use muscle synergy as input is required in future studies.
5. Conclusions
An ICA-based muscle synergy extraction method was proposed and introduced into an MSM to predict the forearm joint angle. This method can be used to address the difficulty of separating deep muscle signals using surface electrodes, which is crucial for motion prediction. The proposed ICA-synergy extraction method can successfully distinguish between deep and superficial muscle activities, thus successfully predicting the motions of the index finger, middle finger, thumb, and wrist. Synergy-MSMs exhibit better robustness and performance than those of traditional MSMs. This method also achieved excellent performance in classical regression models. Considering that the main application of this type of research is the control of prosthetic or exoskeletal devices, future work will focus on developing an online control system to test the online performance of the method based on the results of this study.
Supplementary Materials
The following supporting information can be downloaded at: https://www.mdpi.com/article/10.3390/app12083772/s1.
Author Contributions
Conceptualization, Z.H. and Y.K.; methodology, Z.H.; software, Z.Q. and Z.H.; validation, Y.K.; analysis, Z.H. and Y.K.; data curation, Z.H.; writing—original draft preparation, Z.H., Z.Q., and Y.K.; funding acquisition, Y.K. All authors have read and agreed to the published version of the manuscript.
Funding
This work was supported in part by the Japan Society for the Promotion of Science (JSPS) KAKENHI under Grant 19H05728.
Institutional Review Board Statement
The study was conducted in accordance with the Declaration of Helsinki, and approved by the ethics committee of the Tokyo Institute of Technology (2014042).
Informed Consent Statement
Informed consent was obtained from all subjects involved in the study.
Data Availability Statement
Not applicable.
Conflicts of Interest
The authors declare no conflict of interest.
References
- Jensen, M.P.; Smith, A.E.; Bombardier, C.H.; Yorkston, K.M.; Miró, J.; Molton, I.R. Social support, depression, and physical disability: Age and diagnostic group effects. Disabil. Health J. 2014, 7, 164–172. [Google Scholar] [CrossRef] [PubMed]
- Lyu, M.; Chen, W.-H.; Ding, X.; Wang, J.; Pei, Z.; Zhang, B. Development of an EMG-controlled knee exoskeleton to assist home rehabilitation in a game context. Front. Neurorobot. 2019, 13, 67. [Google Scholar] [CrossRef] [PubMed] [Green Version]
- Benitez, L.M.V.; Tabie, M.; Will, N.; Schmidt, S.; Jordan, M.; Kirchner, E.A. Exoskeleton technology in rehabilitation: Towards an EMG-based orthosis system for upper limb neuromotor rehabilitation. J. Robot. 2013, 2013, 610589. [Google Scholar] [CrossRef] [Green Version]
- Lee, H.; Kim, W.; Han, J.; Han, C. The technical trend of the exoskeleton robot system for human power assistance. Int. J. Precis. Eng. Manuf. 2012, 13, 1491–1497. [Google Scholar] [CrossRef]
- Bi, L.; Feleke, A.; Guan, C. A review on EMG-based motor intention prediction of continuous human upper limb motion for human-robot collaboration. Biomed. Signal Process. Control 2019, 51, 113–127. [Google Scholar] [CrossRef]
- Hu, Y.; Wong, Y.; Wei, W.; Du, Y.; Kankanhalli, M.; Geng, W. A novel attention-based hybrid CNN-RNN architecture for sEMG-based gesture recognition. PLoS ONE 2018, 13, e0206049. [Google Scholar] [CrossRef] [Green Version]
- Asif, A.R.; Waris, A.; Gilani, S.O.; Jamil, M.; Ashraf, H.; Shafique, M.; Niazi, I.K. Performance Evaluation of Convolutional Neural Network for Hand Gesture Recognition Using EMG. Sensors 2020, 20, 1642. [Google Scholar] [CrossRef] [Green Version]
- Bao, T.; Zhao, Y.; Zaidi, S.A.R.; Xie, S.; Yang, P.; Zhang, Z. A deep Kalman filter network for hand kinematics estimation using sEMG. Pattern Recognit. Lett. 2021, 143, 88–94. [Google Scholar] [CrossRef]
- Qin, Z.; Stapornchaisit, S.; He, Z.; Yoshimura, N.; Koike, Y. Multi–Joint Angles Estimation of Forearm Motion Using a Regression Model. Front. Neurorobot. 2021, 15, 685961. [Google Scholar] [CrossRef]
- Baldacchino, T.; Jacobs, W.; Anderson, S.R.; Worden, K.; Rowson, J. Simultaneous Force Regression and Movement Classification of Fingers via Surface EMG within a Unified Bayesian Framework. Front. Bioeng. Biotechnol. 2018, 6, 13. [Google Scholar] [CrossRef] [Green Version]
- Chen, Y.; Dai, C.; Chen, W. Cross-Comparison of EMG-to-Force Methods for Multi-DoF Finger Force Prediction Using One-DoF Training. IEEE Access 2020, 8, 13958–13968. [Google Scholar] [CrossRef]
- Yokoyama, M.; Koyama, R.; Yanagisawa, M. An Evaluation of Hand-Force Prediction Using Artificial Neural-Network Regression Models of Surface EMG Signals for Handwear Devices. J. Sens. 2017, 2017, 3980906. [Google Scholar] [CrossRef] [Green Version]
- Manal, K.; Buchanan, T.S. A one-parameter neural activation to muscle activation model: Estimating isometric joint moments from electromyograms. J. Biomech. 2003, 36, 1197–1202. [Google Scholar] [CrossRef]
- Shao, Q.; Bassett, D.N.; Manal, K.; Buchanan, T.S. An EMG-driven model to estimate muscle forces and joint moments in stroke patients. Comput. Biol. Med. 2009, 39, 1083–1088. [Google Scholar] [CrossRef] [PubMed] [Green Version]
- Ao, D.; Shourijeh, M.S.; Patten, C.; Fregly, B.J. Evaluation of Synergy Extrapolation for Predicting Unmeasured Muscle Excitations from Measured Muscle Synergies. Front. Comput. Neurosci. 2020, 14, 588943. [Google Scholar] [CrossRef] [PubMed]
- Shin, D.; Kim, J.; Koike, Y. A myokinetic arm model for estimating joint torque and stiffness from EMG signals during maintained posture. J. Neurophysiol. 2009, 101, 387–401. [Google Scholar] [CrossRef] [PubMed] [Green Version]
- Kawase, T.; Kambara, H.; Koike, Y. A Power Assist Device Based on Joint Equilibrium Point Estimation from EMG Signals. J. Robot. Mechatron. 2012, 24, 205–218. [Google Scholar] [CrossRef]
- Wang, K.; Chen, X.; Wu, L.; Zhang, X.; Chen, X.; Wang, Z.J. High-Density Surface EMG Denoising Using Independent Vector Analysis. IEEE Trans. Neural Syst. Rehabil. Eng. 2020, 28, 1271–1281. [Google Scholar] [CrossRef]
- Junior, J.J.A.M.; Campos, D.P.; Dias, T.S.; Siqueira, H.V.; Stevan, S.L.; Pichorim, S.F. Independent component analysis in multi-channel forearm surface electromyography processing on armband approach for hand gesture classification. Res. Biomed. Eng. 2020, 36, 439–448. [Google Scholar] [CrossRef]
- Zhang, C.; Chen, X.; Cao, S.; Zhang, X.; Chen, X. HD-sEMG-based research on activation heterogeneity of skeletal muscles and the joint force estimation during elbow flexion. J. Neural Eng. 2018, 15, 056027. [Google Scholar] [CrossRef]
- Tresch, M.C.; Saltiel, P.; Bizzi, E. The construction of movement by the spinal cord. Nat. Neurosci. 1999, 2, 162–167. [Google Scholar] [CrossRef] [PubMed]
- D’Avella, A.; Portone, A.; Fernandez, L.; Lacquaniti, F. Control of Fast-Reaching Movements by Muscle Synergy Combinations. J. Neurosci. 2006, 26, 7791–7810. [Google Scholar] [CrossRef] [PubMed] [Green Version]
- Torres-Oviedo, G.; Ting, L.H. Muscle synergies characterizing human postural responses. J. Neurophysiol. 2007, 98, 2144–2156. [Google Scholar] [CrossRef] [PubMed] [Green Version]
- Bowden, M.G.; Clark, D.J.; Kautz, S.A. Evaluation of abnormal synergy patterns poststroke: Relationship of the fugl-meyer assessment to hemiparetic locomotion. Neurorehabil. Neural Repair 2010, 24, 328–337. [Google Scholar] [CrossRef]
- D’Avella, A.; Lacquaniti, F. Control of reaching movements by muscle synergy combinations. Front. Comput. Neurosci. 2013, 7, 42. [Google Scholar] [CrossRef] [Green Version]
- Aoi, S.; Ohashi, T.; Bamba, R.; Fujiki, S.; Tamura, D.; Funato, T.; Senda, K.; Ivanenko, Y.; Tsuchiya, K. Neuromusculoskeletal model that walks and runs across a speed range with a few motor control parameter changes based on the muscle synergy hypothesis. Sci. Rep. 2019, 9, 369. [Google Scholar] [CrossRef] [Green Version]
- Choi, C.; Kim, J. Synergy matrices to estimate fluid wrist movements by surface electromyography. Med. Eng. Phys. 2011, 33, 916–923. [Google Scholar] [CrossRef]
- Jiang, N.; Rehbaum, H.; Vujaklija, I.; Graimann, B.; Farina, D. Intuitive, online, simultaneous, and proportional myoelectric control over two degrees-of-freedom in upper limb amputees. IEEE Trans. Neural Syst. Rehabil. Eng. 2014, 22, 510. [Google Scholar] [CrossRef]
- Kim, Y.; Stapornchaisit, S.; Kambara, H.; Yoshimura, N.; Koike, Y. Muscle Synergy and Musculoskeletal Model-Based Continuous Multi-Dimensional Estimation of Wrist and Hand Motions. J. Healthc. Eng. 2020, 2020, 5451219. [Google Scholar] [CrossRef]
- Tresch, M.C.; Jarc, A. The case for and against muscle synergies. Curr. Opin. Neurobiol. 2009, 19, 601–607. [Google Scholar] [CrossRef] [Green Version]
- Koike, Y.; Kim, Y.; Stapornchaisit, S.; Qin, Z.; Kawase, T.; Yoshimura, N. Development of Multi-sensor Array Electrodes for Measurement of Deeper Muscle Activation. Sens. Mater. 2020, 32, 959–966. [Google Scholar] [CrossRef] [Green Version]
- Kothe, C. LabStreamingLayer. Available online: https://github.com/sccn/labstreaminglayer (accessed on 13 March 2022).
- Hyvärinen, A.; Oja, E. Independent component analysis: Algorithms and applications. Neural Netw. 2000, 13, 411–430. [Google Scholar] [CrossRef] [Green Version]
- Palmer, J.A.; Kreutz-Delgado, K.; Makeig, S. AMICA: An Adaptive Mixture of Independent Component Analyzers with Shared Components. Swartz Cent. Comput. Neursosci. Univ. Calif. San Diego Tech. Rep. 2011. Available online: https://sccn.ucsd.edu/~jason/amica_a.pdf (accessed on 13 March 2022).
- Korats, G.; Le Cam, S.; Ranta, R.; Hamid, M. Applying ICA in EEG: Choice of the Window Length and of the Decorrelation Method; Springer: Berlin/Heidelberg, Germany, 2012. [Google Scholar] [CrossRef]
- Koike, Y.; Kawato, M. Biological Cybernetics Estimation of dynamic joint torques and trajectory formation from surface electromyography signals using a neural network model. Biol. Cybern. 1995, 73, 291–300. [Google Scholar] [CrossRef] [PubMed]
- Awad, M.; Khanna, R. Support Vector Regression; Apress: Berkeley, CA, USA, 2015. [Google Scholar] [CrossRef] [Green Version]
- Lee, D.D.; Seung, H.S. Learning the parts of objects by non-negative matrix factorization. Nature 1999, 401, 788–791. [Google Scholar] [CrossRef]
- Ebied, A.; Kinney-Lang, E.; Spyrou, L.; Escudero, J. Evaluation of matrix factorisation approaches for muscle synergy extraction. Med. Eng. Phys. 2018, 57, 51–60. [Google Scholar] [CrossRef] [Green Version]
- Rabbi, M.F.; Pizzolato, C.; Lloyd, D.G.; Carty, C.P.; Devaprakash, D.; Diamond, L.E. Non-negative matrix factorisation is the most appropriate method for extraction of muscle synergies in walking and running. Sci. Rep. 2020, 10, 8266. [Google Scholar] [CrossRef]
- Cheung, V.C.K.; D’Avella, A.; Tresch, M.C.; Bizzi, E. Central and Sensory Contributions to the Activation and Organization of Muscle Synergies during Natural Motor Behaviors. J. Neurosci. 2005, 25, 6419–6434. [Google Scholar] [CrossRef]
- Clark, D.J.; Ting, L.H.; Zajac, F.E.; Neptune, R.R.; Kautz, S.A. Merging of healthy motor modules predicts reduced locomotor performance and muscle coordination complexity post-stroke. J. Neurophysiol. 2010, 103, 844–857. [Google Scholar] [CrossRef] [Green Version]
- Cheung, V.C.-K.; Turolla, A.; Agostini, M.; Silvoni, S.; Bennis, C.; Kasi, P.; Paganoni, S.; Bonato, P.; Bizzi, E. Muscle synergy patterns as physiological markers of motor cortical damage. Proc. Natl. Acad. Sci. USA 2022, 109, 14652–14656. [Google Scholar] [CrossRef] [Green Version]
- Muceli, S.; Boye, A.T.; D’Avella, A.; Farina, D. Identifying representative synergy matrices for describing muscular activation patterns during multidirectional reaching in the horizontal plane. J. Neurophysiol. 2010, 103, 1532–1542. [Google Scholar] [CrossRef] [PubMed] [Green Version]
- Stapornchaisit, S.; Kim, Y.; Takagi, A.; Yoshimura, N.; Koike, Y. Finger angle estimation from array EMG system using linear regression model with independent component analysis. Front. Neurorobot. 2019, 13, 75. [Google Scholar] [CrossRef] [PubMed]
- Kim, Y.; Stapornchaisit, S.; Miyakoshi, M.; Yoshimura, N.; Koike, Y. The Effect of ICA and Non-negative Matrix Factorization Analysis for EMG Signals Recorded From Multi-Channel EMG Sensors. Front. Neurosci. 2020, 14, 600804. [Google Scholar] [CrossRef] [PubMed]
- Antuvan, C.W.; Bisio, F.; Marini, F.; Yen, S.-C.; Cambria, E.; Masia, L. Role of Muscle Synergies in Real-Time Classification of Upper Limb Motions using Extreme Learning Machines. J. Neuroeng. Rehabil. 2016, 13, 76. [Google Scholar] [CrossRef] [Green Version]
- Young, A.J.; Hargrove, L.J.; Kuiken, T.A. Improving Myoelectric Pattern Recognition Robustness to Electrode Shift by Changing Interelectrode Distance and Electrode Configuration. IEEE Trans. Biomed. Eng. 2012, 59, 645–652. [Google Scholar] [CrossRef] [Green Version]
- Gazzoni, M.; Celadon, N.; Mastrapasqua, D.; Paleari, M.; Margaria, V.; Ariano, P. Quantifying Forearm Muscle Activity during Wrist and Finger Movements by Means of Multi-Channel Electromyography. PLoS ONE 2014, 9, e109943. [Google Scholar] [CrossRef]
- Dwivedi, S.K.; Ngeo, J.G.; Shibata, T. Extraction of Nonlinear Synergies for Proportional and Simultaneous Estimation of Finger Kinematics. IEEE Trans. Biomed. Eng. 2020, 67, 2646–2658. [Google Scholar] [CrossRef]
- Guo, W.; Ma, C.; Wang, Z.; Zhang, H.; Farina, D.; Jiang, N.; Lin, C. Long exposure convolutional memory network for accurate estimation of finger kinematics from surface electromyographic signals. J. Neural Eng. 2021, 18, 026027. [Google Scholar] [CrossRef]
- Rimini, D.; Agostini, V.; Knaflitz, M. Intra-subject consistency during locomotion: Similarity in shared and subject-specific muscle synergies. Front. Hum. Neurosci. 2017, 11, 586. [Google Scholar] [CrossRef] [Green Version]
Publisher’s Note: MDPI stays neutral with regard to jurisdictional claims in published maps and institutional affiliations. |
© 2022 by the authors. Licensee MDPI, Basel, Switzerland. This article is an open access article distributed under the terms and conditions of the Creative Commons Attribution (CC BY) license (https://creativecommons.org/licenses/by/4.0/).