Article

Terahertz Imaging for Formalin Fixed Malignant Liver Tumors Using Two-Band Beamline at the Accelerator Facility of Nihon University

1
Department of Oral and Maxillofacial Radiology, Radiology Center, Kagoshima University Hospital, Kagoshima 890-8520, Japan
2
Department of Radiology, Nihon University School of Dentistry at Matsudo, Chiba 271-8587, Japan
3
Department of Pathology, Nihon University School of Dentistry at Matsudo, Chiba 271-8587, Japan
4
Laboratory for Electron Beam Research and Application, Nihon University, Chiba 274-8501, Japan
5
Research Institute for Measurement and Analytical Instrumentation, National Institute of Advanced Industrial Science and Technology, Tsukuba 305-8560, Japan
*
Author to whom correspondence should be addressed.
Appl. Sci. 2022, 12(4), 2229; https://doi.org/10.3390/app12042229
Submission received: 11 January 2022 / Revised: 2 February 2022 / Accepted: 4 February 2022 / Published: 21 February 2022
(This article belongs to the Topic Medical Image Analysis)

Abstract

:
We investigated the transmission characteristics of formalin fixed human liver samples in which normal liver tissue and malignant liver tumor were mixed using terahertz (THz) coherent synchrotron radiation at an infrared free-electron laser (FEL) facility at Nihon University. Infrared-FEL imaging has indicated that the amount of water molecules in the tumor tissue is not different from that in the normal tissue. However, the transmission of the incipient tumor tissue was lower than that of the normal tissue in THz imaging because the tumor tissue contained more water molecular clusters than the normal tissue. The tumor tissue became more permeable owing to the development of fibrous tissue around it. THz imaging will be more useful for discriminating liver tissues by increasing the spatial resolution.

1. Introduction

In recent years, compact light sources have been developed in the terahertz (THz) region, and the field of THz wave spectroscopy has made remarkable progress [1,2,3,4,5,6]. Because there are many vibration modes characteristic of molecules in the THz region, it is called the fingerprint region of a substance, and THz wave spectroscopic imaging is applied to identify explosives [7], drugs [8], and foreign bodies in dry food [9]. THz waves are nonionizing, meaning that they do not cause any detrimental effects on dividing human keratinocytes used as a promising noninvasive imaging tool [10]. THz waves are strongly sensitive to polar materials such as water molecular clusters [11]; if there is a difference in the form of water taken up by each tissue in the body, it is possible to identify the tissue by observing changes in the transmission/absorption rate of THz waves [12]. In previous reports, the THz spectroscopy and imaging were applied to diagnose malignant and benign neoplasms with different nosology’s [13,14]. The THz pulsed imaging method has been used to detect skin cancer [15,16,17], colon cancer [18,19], oral cancer [20], breast cancer [21], burn injuries [22], corneal cancer [23], caries lesion [24], brain glioma [25], and brain injuries [26]. A few imaging studies using THz waves have been conducted on liver tissue. However, previous reports have described that the transmission of the tumor tissue was not stable in the THz region [27,28].
To develop an effective technique for THz imaging of samples of formalin fixed human liver in which normal tissue and tumor tissue were mixed, we performed transmission imaging experiments using a beamline at the Laboratory for Electron Beam Research and Application (LEBRA) in Nihon University. This beamline, which is called the infrared free-electron laser radiation (FEL)/the THz coherent synchrotron radiation (CSR) beamline, supplies intense CSR in a frequency range of 0.1–0.3 THz and FELs in a wavelength range of 1–6 μm. Multimodal imaging (THz CSR and infrared FEL) can be applied to spectroscopic and imaging experiments using the same optical system. In a previous report, THz and visible light (VIS) imaging were applied to study non-melanoma skin cancer [15]. Using the infrared FEL/THz CSR beamline, we can observe both intermolecular vibration and hydroxide stretching vibration for water in a living tissue and can provide useful information for the tissue analysis and differentiation.
In this article, we first clarified the deviation in THz transmission between the normal liver tissue and the malignant liver tumor. Subsequently, we reported that the factor that caused the deviation was the advanced fibrosis of the tissue. The malignant liver tumor with less fibrosis contained more water molecular clusters, and its transmission in the THz region was lower than that in the normal liver tissue. Finally, THz imaging can distinguish between malignant tumor tissues and normal tissues of the human liver.

2. Materials and Methods

2.1. Infrared FEL/THz CSR Beamline

We used an infrared FEL/THz CSR beamline at LEBRA as a THz light source [11,12,29]. The CSR beam was generated from a 45° bending magnet that guided the electron beam to an FEL undulator line. This was reflected by a LiTaO3 crystal substrate inserted in the FEL beamline, whose refractive index was high in the THz region [30]. It was transported to an experimental room coaxially with the infrared FEL beam at a temperature of 297 K. The transported CSR beam was injected into the atmosphere through a sapphire window with a thickness of 3 mm and could be used for imaging and spectroscopy experiments. Depending on the pulse structure of the electron beam of the S-band linac, the CSR pulses were generated with an interval of 0.35 ps during a macropulse of 20 μs. The average energy of the CSR beam per macropulse was 50 nJ, and the maximum frequency of the CSR spectrum was 0.15 THz.
The infrared FEL radiation was oscillated by interacting spontaneous emission of the undulator confined in a Fabry-Pérot optical cavity with the electron beam in the undulator [31]. The infrared FEL could oscillate in the range of 0.9–6.1 μm at LEBRA. Although the interval of the FEL radiation micropulses was the same as that of the electron beam, the macropulse duration was less than 10 μs. The infrared FEL was extracted from the optical cavity by a coupling hole of the upstream cavity mirror and converted into a parallel beam by a set of ellipsoidal and parabolic mirrors. The profile of the parallel beam was a circle with a diameter of 30 mm. The maximum energy of the FEL radiation extracted from the sapphire window was approximately 25 mJ per macropulse at a wavelength of 2 μm [30]. Infrared FEL can also be transported by a mirror actuator to several laboratories in a neighboring building. The relative line width of the FEL was approximately 1%. It was used to develop novel materials, study dental treatments, and obtain many unique results as a monochromatic light source.

2.2. Samples of Formalin Fixed Human Liver Tumor

We used two formalin-fixed livers from different individuals which were stored in the Department of Oral Pathology, Nihon University School of Dentistry at Matsudo. The formalin-fixed human livers do not enable the identification of a specific individual. The formalin-fixed human liver was sliced to 200 μm. The sample was enclosed between a quartz slide and cover glasses with Marinol. The size of the microscope quartz glass was 26 mm × 76 mm × 1 mm, and the cover glass was 30 mm × 30 mm × 0.9 mm. The sample was stained with hematoxylin and eosin and diagnosed by oral pathologists (Figure 1).

2.3. Image Analysis with THz CSR

The CSR beam extracted from the sapphire window was vertically deflected and converged by a parabolic mirror with a focal length of 153 mm and a diameter of 50 mm. The profile was almost a perfect TEM00 mode, and the beam size was 5.9 mm in full width at half maximum. The CSR was stable, and the fluctuation of CSR intensity was 3%. Two-dimensional imaging with THz CSR can be performed by translating a sample on a horizontal plane at the focal point of the CSR beam. A schematic layout of the two-dimensional imaging system is shown in Figure 2. To limit the irradiated area of the CSR beam, a conical horn, which had a circular output with a diameter of 2 mm, was set at a position 2 mm above the sample. The sample was fixed on an X–Y axis translation stage, in which the effective movable areas were 100 and 50 mm in the horizontal (X) and vertical (Y) directions, respectively. In the THz imaging experiments, this translation stage was moved by a raster scan at intervals of 0.2–0.5 mm.
The CSR intensity was measured using a Schottky D-band diode detector with a square antenna (Millitech Inc., DXP-06, Northampton, MA, USA), which was set at a position 2 mm away from the sample. This detector had the maximum sensitivity at a frequency of 0.10 THz [11]. To prevent detection of the scattered light, a metal aperture with an opening of 1 × 2 mm2 was placed on the square antenna. The spatial resolution of the CSR imaging system with the D-band diode detector was evaluated to be 1.6 mm using a knife-edge method. The signal of the detector was measured using an oscilloscope (Tektronix, TDS3054, Beaverton, OR, USA). The measurement was performed four times for each measurement point, and the average value was used to evaluate the transmission.

2.4. Image Analysis with Infrared FEL Radiation

The infrared FEL extracted from the sapphire window was also vertically deflected and converged by a parabolic mirror. Because the FEL energy was not as stable as the CSR, a thin quartz beam splitter was inserted between the parabolic mirror and the focal spot to monitor the FEL energy, and the FEL reflected by the beam splitter was measured by a pyroelectric detector (Ophir Optronics Solutions Ltd., PE10-S, Jerusalem, Israel). Because the FEL energy was relatively high, a neutral density filter with a transmission of 16% was inserted between the parabolic mirror and the pyroelectric detector. Moreover, a metallic pinhole with a diameter of 0.6 mm was installed 20 mm before the focal spot. Two-dimensional imaging experiments with the infrared FEL radiation were performed using the same stage as for the CSR imaging experiments.
The infrared FEL radiation transmitted through the sample was detected using a Ge semiconductor detector (OP-IR2, Santa Clara, CA, USA). The detector was placed 40 mm away from the sample to avoid the influence of light scattered in the sample. The spatial resolution of the FEL imaging system was less than 0.5 mm. The signal of the detector was measured using an oscilloscope. The measurement was performed four times for each measurement point, and the average value was used to evaluate the transmission.

3. Results

3.1. Absorption Coefficient of the Formalin Fixed Normal Liver Tissue

To investigate whether liver tissue can be identified by THz imaging, we first precisely measured the absorption coefficient of the normal liver tissue in the THz region. According to references, THz waves are mainly absorbed by the water content in the liver tissue. Because water is a polar molecule, the absorption coefficient is high owing to the dielectric relaxation in the THz region. The absorption coefficient of Marinol, which was used in the experiments as water-insoluble mounting medium, is less than 0.59 cm−1 at a frequency of 0.1 THz. Therefore, when the thickness of a sample is ≤200 μm, the absorption due to the mounting medium in the THz region is negligible. The refractive index of Marinol in the THz region is approximately 1.55, which is almost equal to that of the liver tissue (~1.57). The reflection of the THz waves is negligible at the boundaries between the quartz slides and Marinol. Subsequently, the transmission of the sample in the THz region is calculated by normalizing the CSR intensity passing through the Marinol fixed sample sandwiched between quartz slides. Figure 3 shows the transmission images of normal liver tissues with thicknesses of 100 and 200 μm in a 2 mm2 area.
The average transmissions are 58.3 ± 1.7% for a thickness of 100 μm and 35.2 ± 1.7% for a thickness of 200 μm. The measured dispersion of the transmission is relatively small, and our THz imaging system can identify a difference of approximately 1% with respect to the transmission. The absorption coefficient α is 52.9 ± 1.0 cm−1, which was calculated from the measured transmission data using the least squares method. Therefore, we found that the appropriate thickness of the samples for the THz imaging experiments is 200 μm.

3.2. Transmission of Liver Normal Tissue and Malignant Tumor Tissue

Next, we prepared formalin fixed samples with a thickness of 200 μm in which normal tissue and tumor tissue were mixed and measured the transmission of the samples at a frequency of 0.1 THz. The boundary between the normal and tumor tissues could be visually confirmed. Fibrosis advanced around the tumor tissue, and vacancies such as blood vessels also increased around the tumor tissue. We selected 2 mm2 tissues with fewer vacancies by visual observation and transmission data were measured, from which the mean and standard deviation of the transmission was calculated. Table 1 shows the measured transmission of normal and tumor tissues for some samples. The transmission of the normal tissue was distributed in a relatively narrow range of 33–37%, whereas the transmission of the tumor tissue was distributed in a rather wide range of 31–38%. There were some samples in which the transmission of the normal tissue was higher than that of the tumor tissue and some samples in which the transmission of the normal tissue was lower than that of the tumor tissue. However, the p-value for each sample was ≤0.05, so that the transmissions for the two tissues were significantly different. Although the difference in transmission between tissues was small, our experiments suggest that the malignant tumor tissue can be distinguished from the normal tissue by THz imaging. We have calculated the p values when we hypothesized that the permeability of tumor tissue is equal to that of normal tissue.

3.3. Near-Infrared FEL Imaging

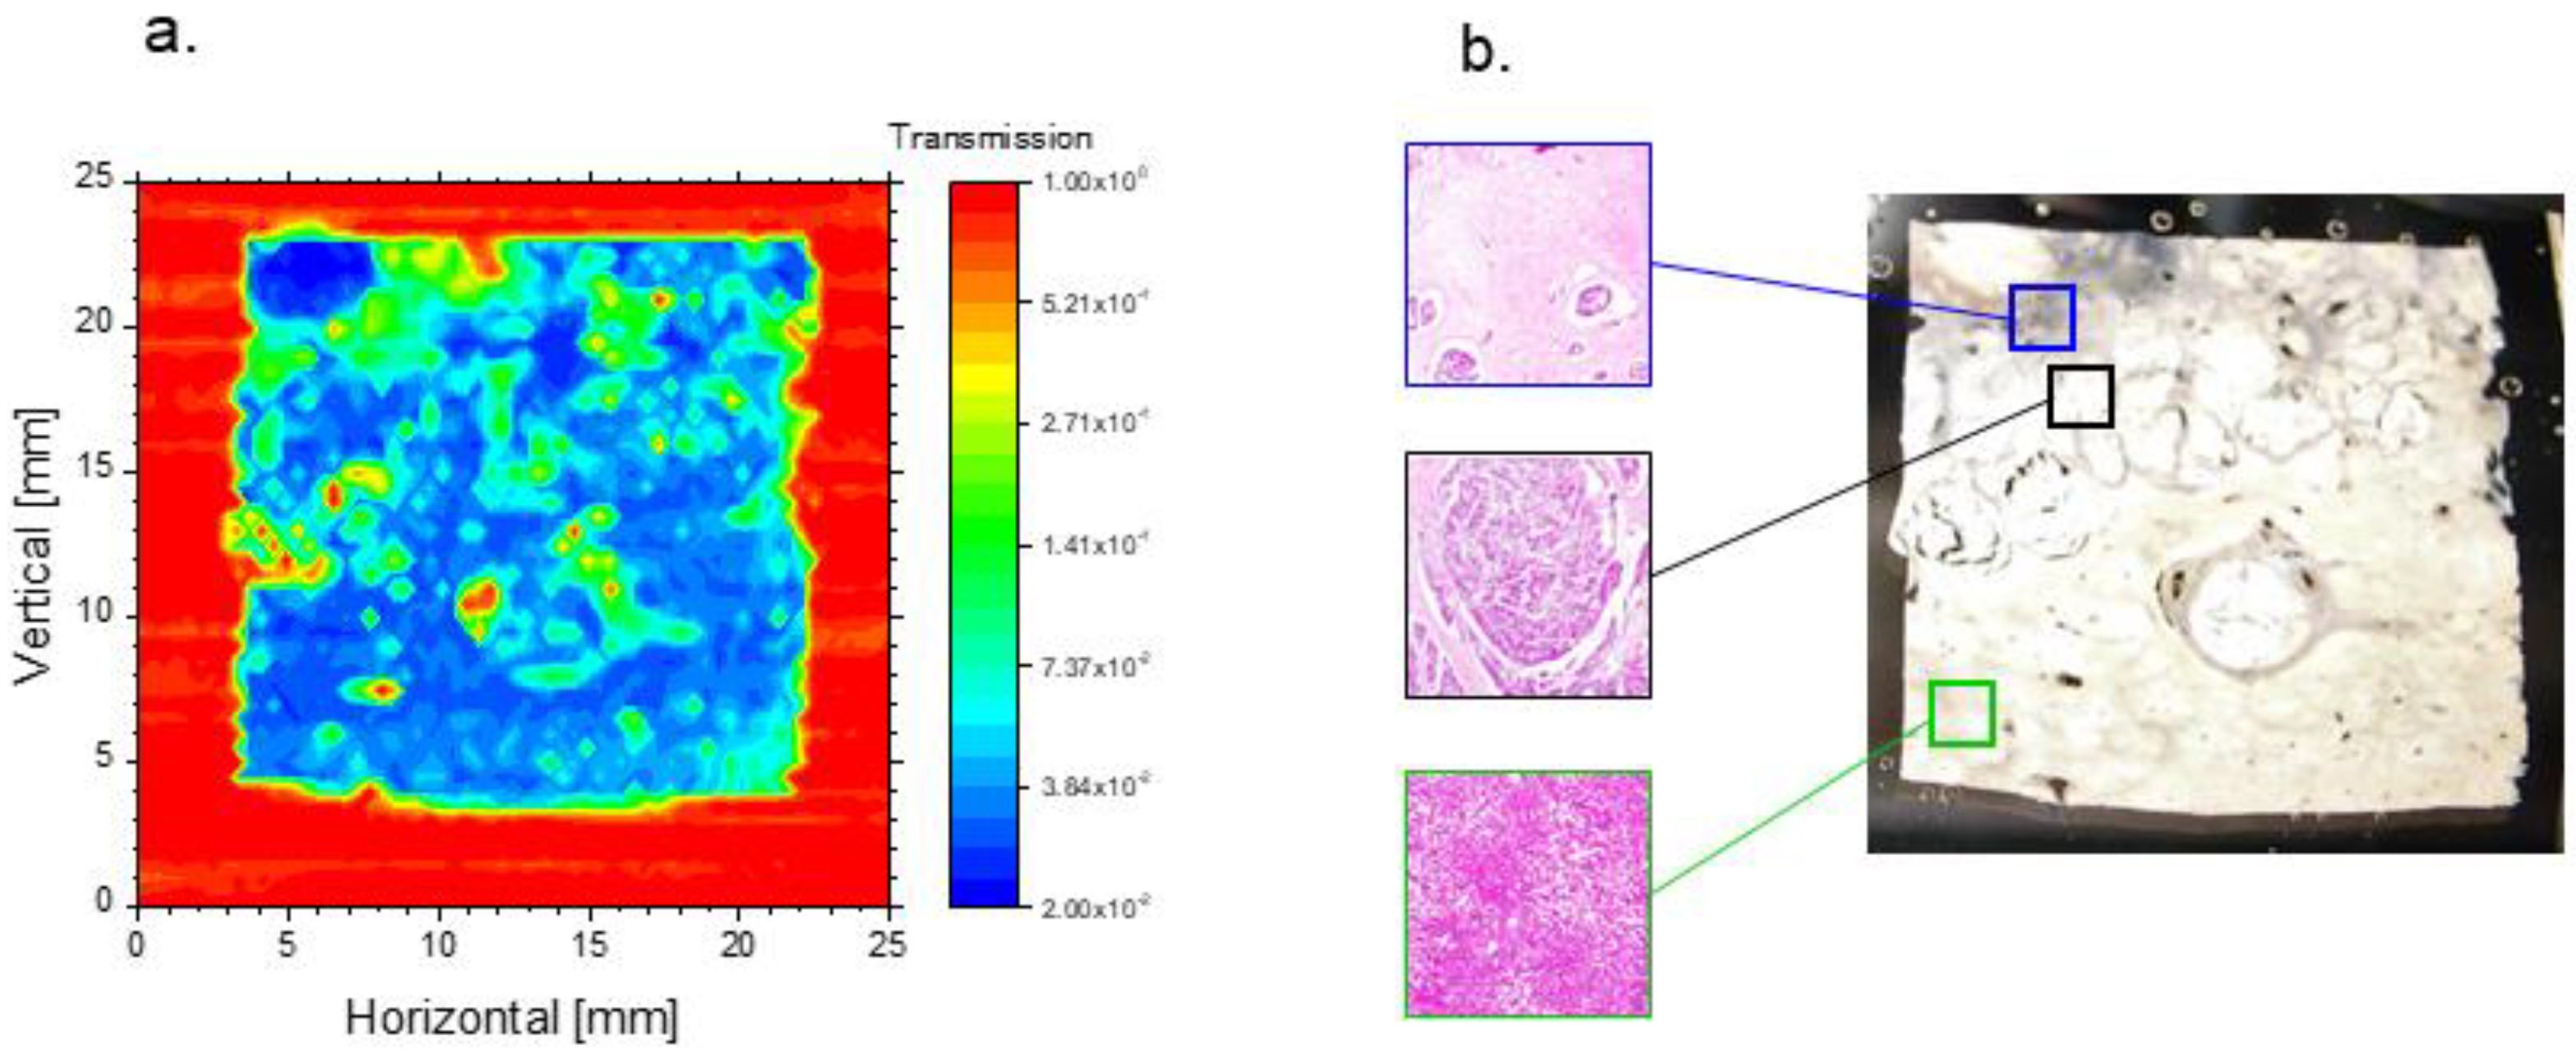
To clarify the cause of the variation in the transmission of the tumor tissue in the THz region, near-infrared imaging using the LEBRA FEL was performed for sample #3, in which the difference in the transmission between the tumor tissue and the normal tissue was minimal. The FEL wavelength was set to 1.93 μm, where there was a vibration mode of OH radicals in water. The absorption coefficient of water at a wavelength of 1.93 μm was as large as 124 cm−1, and the FEL was absorbed by the water rather than proteins and lipids, which were the main components of the liver. Figure 4. shows a near-infrared image and a photograph of the liver sample used in the experiment.
Because an absorption of the near-infrared FEL due to the mounting medium Marinol is negligible in Figure 4a, the transmission of the sample at the wavelength of 1.93 μm is calculated by normalizing the FEL intensity passing through the Marinol fixed sample sandwiched between quartz slides. The imaging graph is represented on a logarithmic scale owing to low transmission. The black and green frames in Figure 4b indicate the areas where the transmissions of the tumor tissue and the normal tissue are evaluated in Table 1. Images of the stained tissues inside the frames are also shown in this figure. The transmissions of the tumor tissue and the normal tissue for the near-infrared FEL were measured to be 3.03 ± 0.61% and 3.56 ± 1.50%, respectively. The difference in the transmission of the two tissues was not significant (p = 0.08 > 0.05). This experimental result indicates that the number of water molecules contained in the 2 mm2 tumor tissue is almost equal to that in the 2 mm2 normal tissue.
As identified from the photograph and the staining image inside the blue frame in Figure 4b, this sample had an area that was mostly occupied by fibrous tissues. Vacancies were found around the tumor tissues in this area. The transmission of the fibrous tissue in the blue frame was measured to be 10.82 ± 6.82%, which was significantly higher than that of the other tissues (p < 0.001). The staining image inside the black frame in Figure 4b shows the presence of fibrous tissues and vacancies surrounding the tumor tissue. The proportion of fibrous tissues and vacancies in the black frame was 20–30%. Although small vacancies with a scale of 10 μm are negligible for THz waves, larger vacancies influence the transmission of THz waves. Therefore, we considered that larger vacancies and fibrous tissues around the tumor tissue increase the transmission of the tumor tissue in the THz region.

3.4. THz Imaging of Liver Tissues with Advanced Fibrosis

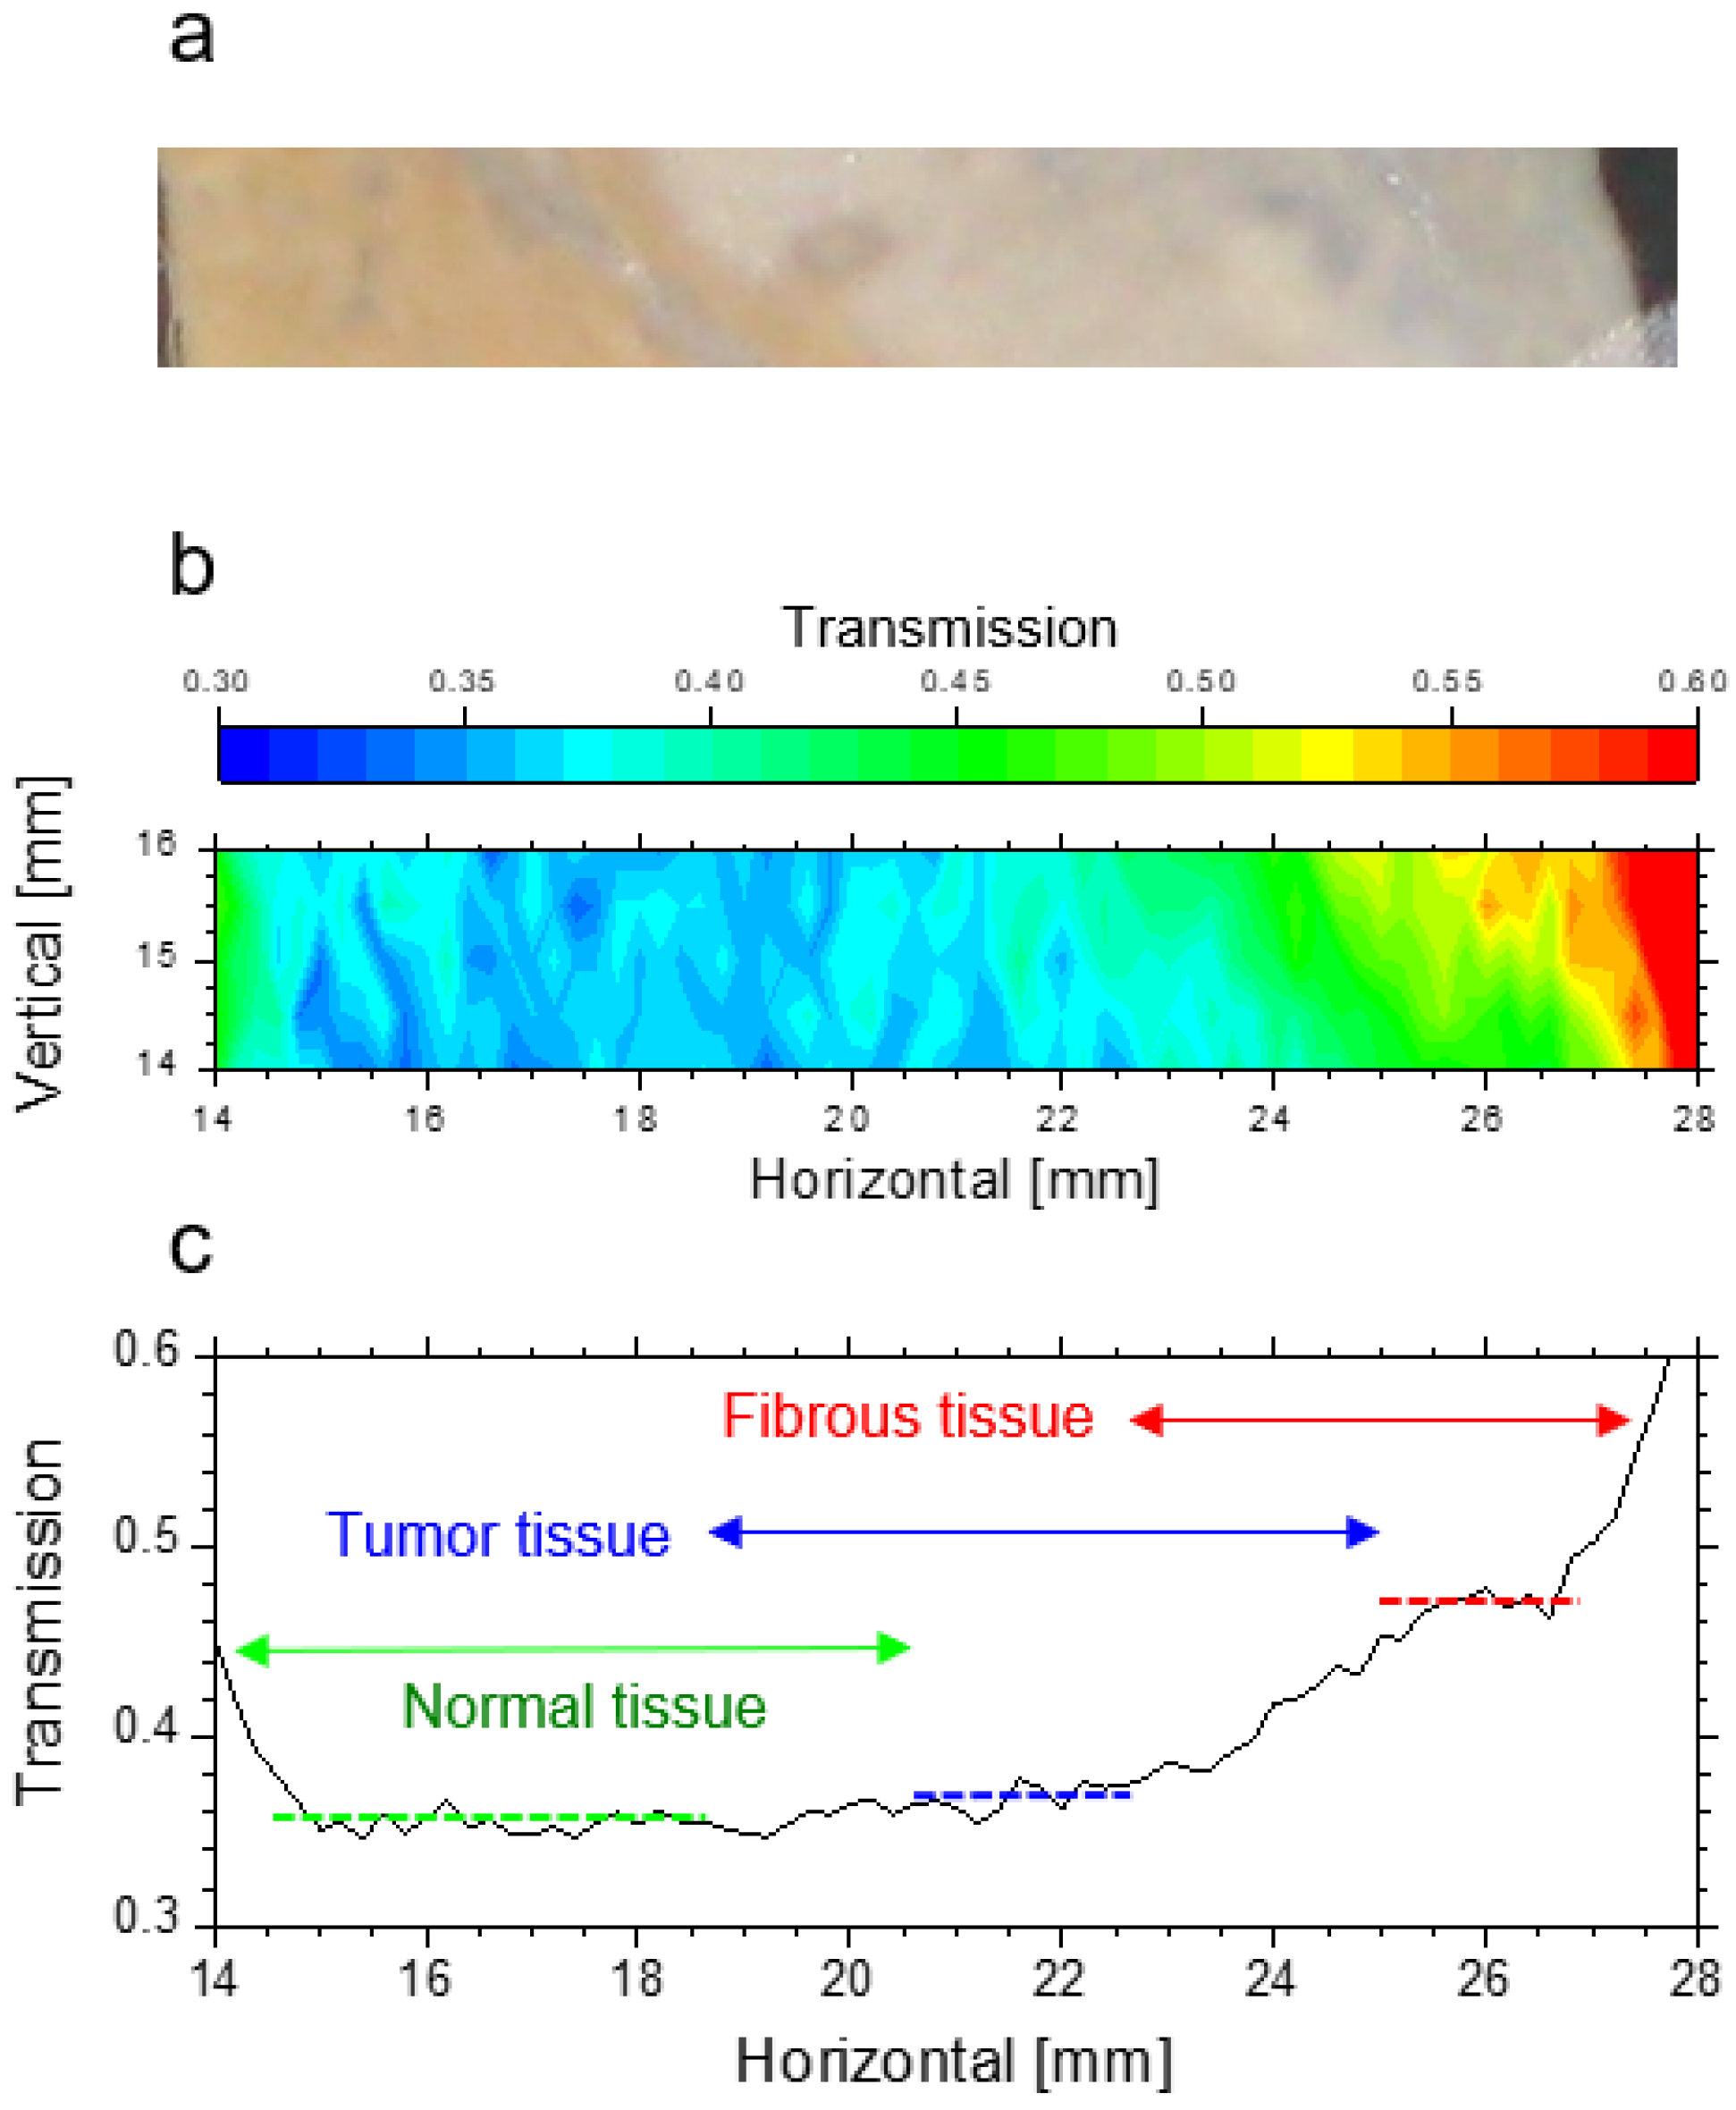
It is necessary to investigate the contribution of the fibrous tissue to the transmission in the THz region to prove the above hypothesis. Subsequently, we performed THz imaging for a part of sample #1, in which the transmission of the tumor tissue was relatively high. By calculating from the photograph, the ratio of the fibrous tissue to the area where the transmission of the tumor tissue was measured in sample #1 was as high as 30–40%. Figure 5 shows a visible image (a), a THz image (b), and a transmission averaged in the Y-axis direction (c). Figure 5a indicates that a boundary between the normal tissue and the tumor tissue is located at X = 20 mm, and the boundary between the tumor tissue and the fibrous tissue is located at X = 24 mm.
The angles between these boundaries and the X-axis were 3/4π. Because the boundaries are not perpendicular to the direction of the translation stage, there are areas overlapping different tissues in the graph of the averaged transmission. By removing such mixing regions and comparing the transmissions of single tissues, the transmission clearly depends on the tissue in the THz region. The transmission of tissues with advanced fibrosis was as high as 46.0 ± 1.6%. The experimental result that the transmission of the tumor tissue is clearly higher than that of the normal tissue supports the notion that fibrous tissue grows around the tumor tissue and contributes to the increase in the average transmission of the tumor tissue.

3.5. THz Imaging for Non-Fibrotic Formalin Fixed Liver Tissue

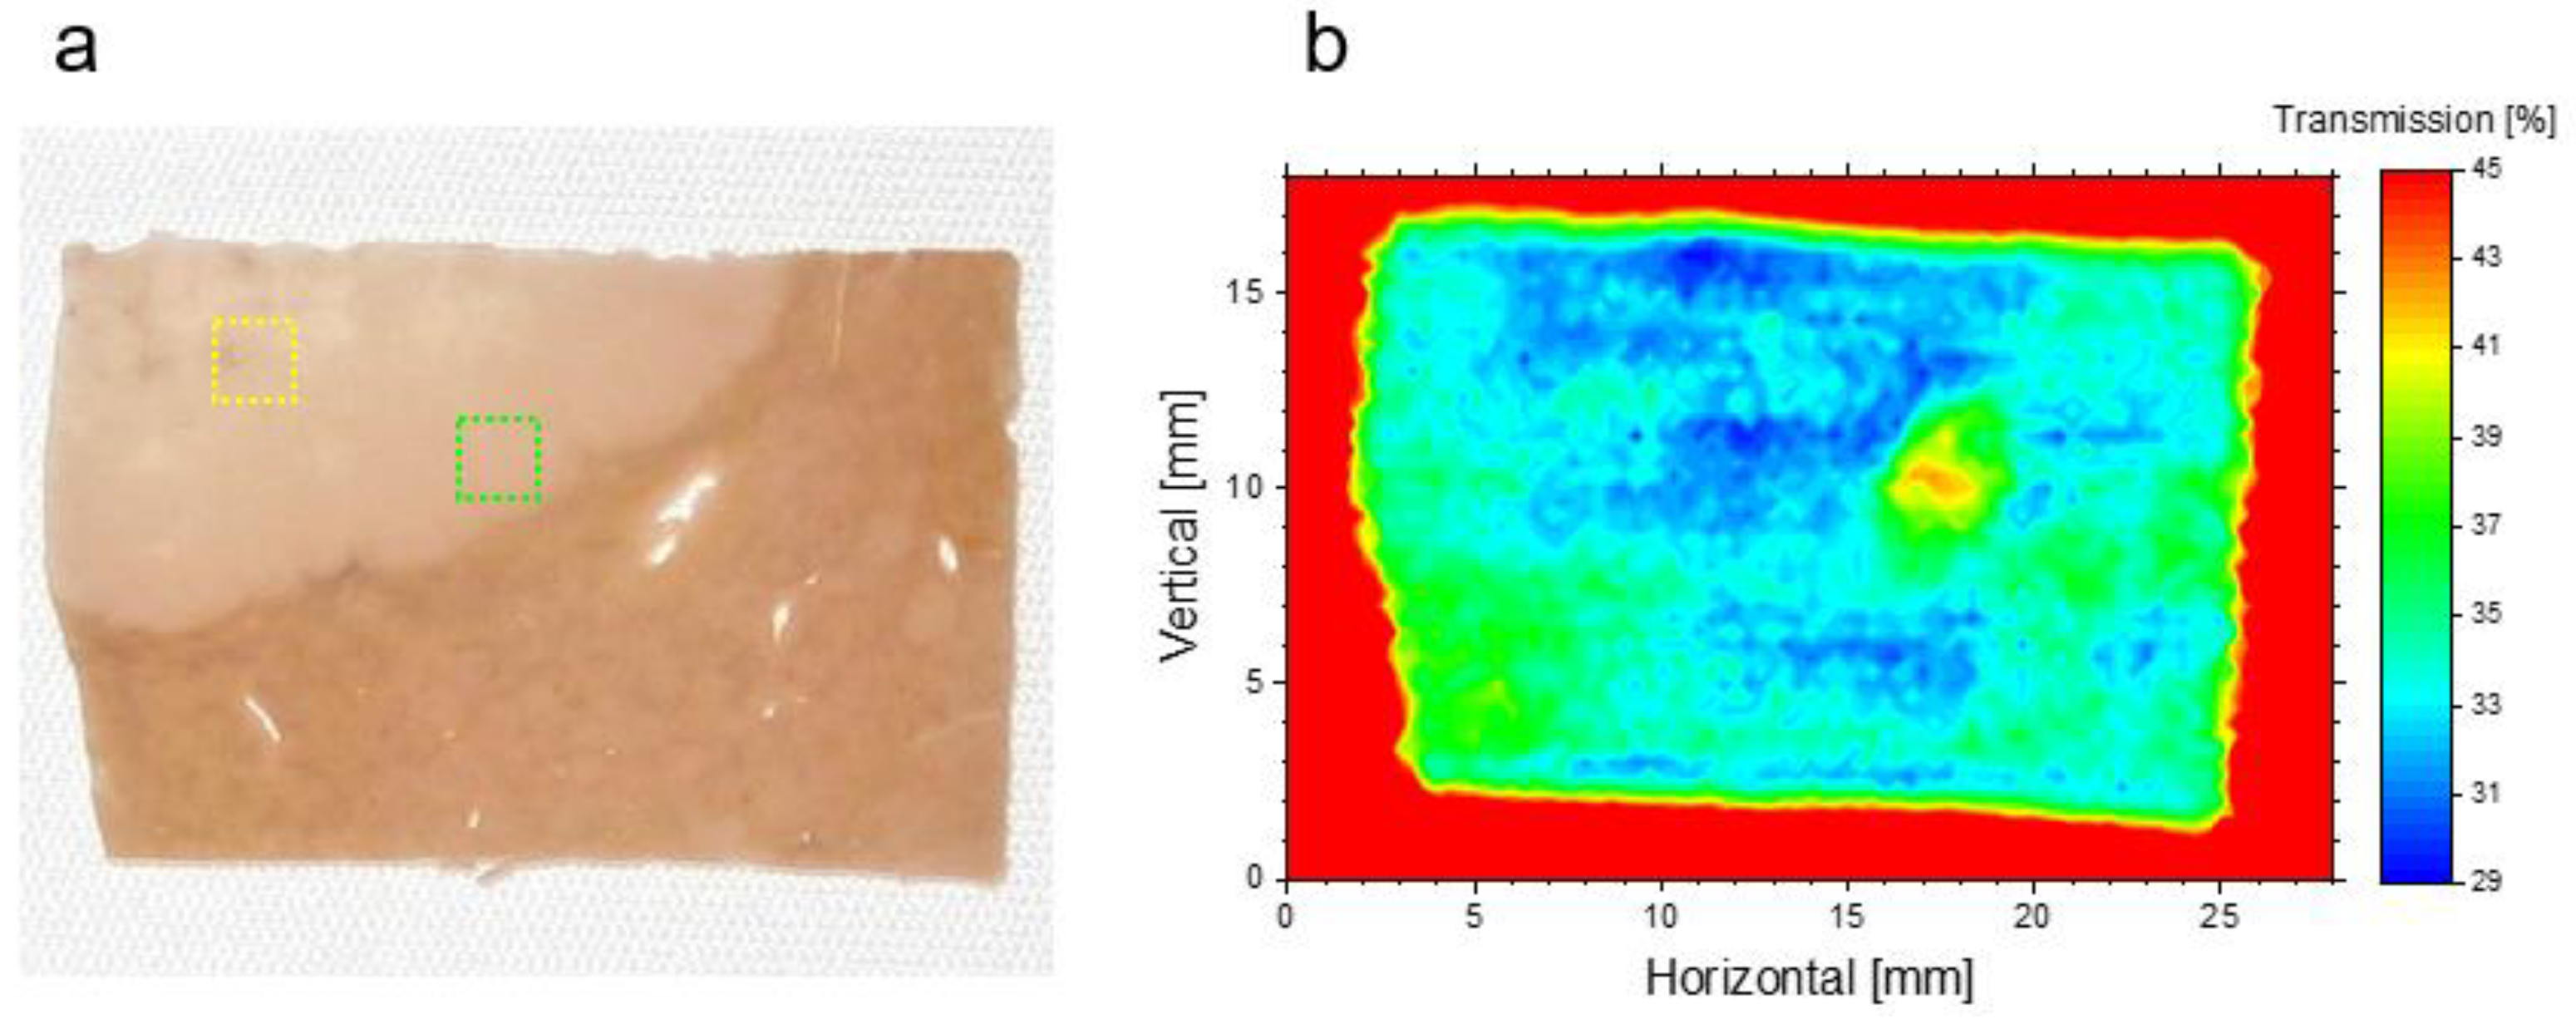
Contrary to the previous section, we performed THz imaging for a part of sample #4, in which the transmission of the tumor tissue was relatively low. As shown in Figure 6a, fibrosis tissue is present only in the upper left of the sample. The ratio of the fibrous tissue to the area where the transmission of the tumor tissue was measured in sample #4 was as low as 0–10% from the photograph. Corresponding to the light-colored tumor tissue in the visible image, the transmission in the THz imaging was low above an arc line connecting the point (21, 16) and the point (2, 9) in Figure 6b. The fluctuation of transmission was rather small in the region where fibrosis had not progressed. The average transmissions of the areas surrounded by yellow and green frames were 32.0 ± 1.0% and 31.9 ± 1.1%, respectively. It was revealed that the tumor tissue with less advanced fibrosis absorbed more THz waves and had lower transmission than the normal tissue.

4. Discussion

Using the THz CSR beam at LEBRA, we studied transmission imaging for formalin fixed samples in which normal liver tissue and malignant tumor tissue coexisted. Although the transmission of the normal tissue had little dispersion among the samples, the transmission of the malignant tumor tissue varied widely between samples [30,31,32,33]. We considered that the fibrous tissue and vacancies that developed surrounding the tumor tissue contributed to this variation. Imaging experiments confirmed that the fibrous tissue had a high transmission in the THz region by the imaging experiment. This experimental result indicated that fibrosis caused the tissue to lose water. Each sample showed progression of fibrosis around the tumor tissue. The tumor tissue with less advanced fibrosis had a lower transmission rate than the normal tissue. However, it was clarified that the transmission of tumor tissue averaged in the 2 mm2 area became higher than that of the normal tissue as the proportion of the fibrous tissue to the malignant tumor tissue increased.
In one sample, although the transmission of the malignant tumor tissue was lower than that of the normal tissue in the CSR THz imaging, there was no significant difference in the number of water molecules between the normal tissue and the tumor tissue in near infrared FEL imaging. THz waves are more easily absorbed by free water than by bound water in a living body [11,12]. This experimental result suggested that the tumor tissue had more free water than the normal tissue. This is consistent with the well-known diagnostic principle of magnetic resonance imaging [34].
The reason why the transmission of the tumor tissue was not stable for samples was that the influence of the fibrous tissue around the tumor tissue could not be ruled out in THz imaging. If the spatial resolution is improved to the order of 0.1 mm, the detection efficiency of the tumor tissue and the fibrous tissue will be further improved. It is necessary to increase the frequency used for imaging to 1 THz or more for high spatial resolution. To perform THz transmission imaging with a high spatial resolution, the power of the light source should be increased. Duan et al. showed that the THz frequency of 2.52 THz with high resolution can detect hepatocellular carcinoma [35]. We have used lower THz frequency compared with Duan et al., however, we have developed coherent edge radiation at the FEL undulator line that has an output 1000 times stronger than CSR and can be used in the frequency region of 0.1–2.5 THz. Our results suggested that lower THz frequency than past reports may be useful to discriminate between formalin fixed normal liver tissue, malignant tumor tissue, and malignant tumor tissues with advanced fibrosis. In the future, we plan to develop THz imaging for biological tissues using coherent edge radiation with an infrared FEL. However, an increase in the THz imaging resolution may have some problems. Firstly, we lose sensitivity to the tissue water content (to the intense low-frequency Debey relaxation band of water) with increasing frequency [14]. Secondly, the water vapor along the THz beam path can complicate (make unstable) collection and analysis of THz images at such high frequencies, while measurements of tissues in inert gas or even vacuum seem to be a daunting task [36,37].

5. Conclusions

In summary, we have demonstrated that transmission THz imaging was effective in discriminating between formalin fixed normal liver tissue, malignant tumor tissue, and malignant tumor tissues with advanced fibrosis. Infrared-FEL imaging indicated that the amount of water molecules in the formalin fixed tumor tissue was not different from that in the formalin fixed normal tissue. However, the transmission of the incipient malignant tumor tissue was lower than that of the normal tissue in THz imaging. It was found that the tumor tissue became more permeable owing to the development of fibrous tissue around it. To remove the influence of the fibrous tissue, it is effective to reduce the spatial resolution of the imaging to 0.1 mm or less by increasing the frequency of the light source to 1 THz or more. We will develop THz imaging for biological tissues using high-power and high-frequency coherent edge radiation developed at LEBRA.

Author Contributions

Conceptualization, Y.K. and N.S.; methodology, N.S.; software, T.S., Y.H. and N.S.; validation, N.S.; formal analysis, N.S.; investigation, Y.K. and N.S.; resources, S.M. and K.K.; data curation, N.S.; writing—original draft preparation, Y.K.; writing—review and editing, N.S.; visualization, S.M., K.K. and N.S.; supervision, N.S. and T.K.; project administration, N.S.; funding acquisition, N.S. All authors have read and agreed to the published version of the manuscript.

Funding

This research was funded supported by the Japan Society for the Promotion of Science KAKENHI H19H04406 and was conducted under the Visiting Researchers Program of Kyoto University Institute for Integrated Radiation and Nuclear Science R3035.

Institutional Review Board Statement

Ethical review and approval were waived for this study because the liver samples were completely anonymous. According to the “Ethical Guidelines for Medical and Health Research Involving Human Subjects” which was issued by Japan Ministry of Health, Labour and Welfare and Japan Ministry of education in 2018, the samples were categorized as “unidentifiably-processed personal information which has already been created”. This research utilizing only these samples shall not apply the guidelines. Therefore, the ethical review and approval were waived for this study.

Informed Consent Statement

Not applicable.

Data Availability Statement

Data underlying the results presented in this paper are not publicly available at this time but may be obtained from the authors upon reasonable request.

Conflicts of Interest

The authors declare no conflict of interest.

References

  1. Marble, C.B.; Yakovlev, V.V. Biomedical optics applications of advanced lasers and nonlinear optics. J. Biomed. Opt. 2020, 25, 040902. [Google Scholar]
  2. Yu, C.; Fan, S.; Sun, Y.; Pickwell-MacPherson, E. The potential of terahertz imaging for cancer diagnosis: A review of investigations to date. Quant. Imaging Med. Surg. 2012, 2, 33. [Google Scholar] [PubMed]
  3. Son, J.H.; Oh, S.J.; Cheon, H. Potential clinical applications of terahertz radiation. J. Appl. Phys. 2019, 125, 190901. [Google Scholar] [CrossRef]
  4. Cheon, H.; Paik, J.H.; Choi, M.; Yang, H.J.; Son, J.H. Detection and manipulation of methylation in blood cancer DNA using terahertz radiation. Sci. Rep. 2019, 23, 6413. [Google Scholar] [CrossRef] [Green Version]
  5. Geng, Z.; Zhang, X.; Fan, Z.; Lv, X.; Chen, H. A route to terahertz metamaterial biosensor integrated with microfluidics for liver cancer biomarker testing in early stage. Sci. Rep. 2017, 7, 1–11. [Google Scholar] [CrossRef] [Green Version]
  6. Ian, M.; Patrick, T.; Vadimir, K.; Markelz, A.G.; George, D.K.; Peter, S. SPIE 10902 Nonlinear Frequency Generation and Conversion: Materials and Devices XVIII. In Proceedings of the SPIE, San Francisco, CA, USA, 4 March 2019; p. 1090218. [Google Scholar]
  7. Zhang, L.; Zhong, H.; Deng, C.; Zhang, C.; Zhao, Y. Terahertz wave reference-free phase imaging for identification of explosives. Appl. Phys. Lett. 2008, 92, 091117. [Google Scholar] [CrossRef]
  8. Kawase, K.; Ogawa, Y.; Watanabe, Y.; Inoue, H. Non-destructive terahertz imaging of illicit drugs using spectral fingerprints. Opt. Express. 2003, 11, 2549–2554. [Google Scholar] [CrossRef] [Green Version]
  9. Ok, G.; Kim, H.J.; Chun, S.; Choi, S.W. Foreign-body detection in dry food using continuous sub-terahertz wave imaging. Food Control 2014, 42, 284–289. [Google Scholar] [CrossRef]
  10. Clothier, R.H.; Bourn, N. Effects of exposure on human primary keratinocyte differentiation and viability. J. Biol. Phys. 2003, 29, 179–185. [Google Scholar] [CrossRef]
  11. Sei, N.; Ogawa, H.; Hayakawa, K.; Tanaka, T.; Hayakawa, Y.; Nakao, K.; Sakai, T.; Nogami, K.; Inagaki, M. Complex light source composed from subterahertz-wave coherent synchrotron radiation and an infrared free-electron laser at the Laboratory for Electron Beam Research and Application. J. Opt. Soc. Am. 2014, B31, 2150–2156. [Google Scholar] [CrossRef]
  12. Sei, N.; Ogawa, H.; Hayakawa, K.; Tanaka, T.; Hayakawa, Y.; Nakao, K.; Sakai, T.; Nogami, K.; Inagaki, M. Observation of intense terahertz-wave coherent synchrotron radiation at LEBRA. J. Phys. D Appl. Phys. 2013, 46, 045104. [Google Scholar] [CrossRef]
  13. Zaytsev, K.I.; Dolganova, I.N.; Chernomyrdin, N.V.; Katyba, G.M.; Gavdush, A.A.; Cherkasova, O.P.; Komandin, G.A.; Shchedrina, M.A.; Khodan, A.N.; Ponomarev, D.S.; et al. The progress and perspectives of terahertz technology for diagnosis of neoplasms: A review. J. Opt. 2019, 22, 013001. [Google Scholar] [CrossRef]
  14. Smolyanskaya, O.A.; Chernomyrdin, N.V.; Konovko, A.A.; Zaytsev, K.I.; Ozheredov, I.A.; Cherkasova, O.P.; Nazarov, M.M.; Guillet, J.P.; Kozlov, S.A.; Kistenevg, Y.V.; et al. Terahertz biophotonics as a tool for studies of dielectric and spectral properties of biological tissues and liquids. Prog. Quantum Electron. 2019, 62, 1–77. [Google Scholar] [CrossRef]
  15. Joseph, C.S.; Patel, R.; Neel, V.A.; Giles, R.H.; Yaroslavsky, A.N. Imaging of ex vivo nonmelanoma skin cancers in the optical and terahertz spectral regions optical and terahertz skin cancers imaging. J. Biophotonics 2014, 7, 295–303. [Google Scholar] [CrossRef]
  16. Nikitkina, A.I.; Bikmulina, P.Y.; Gafarova, E.R.; Kosheleva, N.V.; Efremov, Y.M.; Bezrukov, E.A.; Butnaru, D.; Dolganova, I.N.; Chernomyrdin, N.V.; Cherkasova, O.P.; et al. Terahertz radiation and the skin: A review. J. Biomed. Opt. 2021, 26, 043005. [Google Scholar] [CrossRef]
  17. Titova, L.V.; Ayesheshim, A.K.; Golubov, A.; Rodriguez-Juarez, R.; Woycicki, R.; Hegmann, F.A.; Kovalchuk, O. Intense THz pulses down-regulate genes associated with skin cancer and psoriasis: A new therapeutic avenue? Sci. Rep. 2013, 3, 2363. [Google Scholar] [CrossRef]
  18. Doradla, P.; Alavi, K.; Joseph, C.S.; Giles, R.H. Detection of colon cancer by continuous-wave terahertz polarization imaging technique. J. Biomed. Opt. 2013, 18, 090504. [Google Scholar] [CrossRef]
  19. Doradla, P.; Alavi, K.; Joseph, C.S.; Giles, R.H. Terahertz polarization imaging for colon cancer detection. In Proceedings of the International Society for Optics and Photonics (SPIE), San Francisco, CA, USA, 19–22 December 2014; Volume 8985, pp. 49–56. [Google Scholar]
  20. Sim, Y.C.; Park, J.Y.; Ahn, K.M.; Park, C.; Son, J.H. Terahertz imaging of excised oral cancer at frozen temperature. Biomed. Opt. Express 2013, 4, 1413–1421. [Google Scholar] [CrossRef]
  21. Fitzgerald, A.J.; Wallace, V.P.; Linan, M.J.; Bobrow, L.; Pye, R.J.; Purushotham, A.D.; Arnone, D.D. Terahertz pulsed imaging of human breast tumors. Radiology 2006, 239, 533–540. [Google Scholar] [CrossRef]
  22. Arbab, M.H.; Winebrenner, D.P.; Dickey, T.C.; Chen, A.; Klein, M.B.; Mourad, P.D. Terahertz spectroscopy for the assessment of burn injuries in vivo. J. Biomed. Opt. 2013, 18, 077004. [Google Scholar] [CrossRef] [Green Version]
  23. Bennett, D.; Taylor, Z.; Tewari, P.; Sung, S.; Maccabi, A.; Singh, R.; Culjat, M.; Grundfest, W.; Hubschman, J.P.; Brown, E. Assessment of corneal hydration sensing in the terahertz band: In vivo results at 100 GHz. J. Biomed. Opt. 2012, 17, 97008. [Google Scholar] [CrossRef] [PubMed] [Green Version]
  24. Churchley, D.; Lynch, R.J.M.; Lippert, F.; Eder, J.S.O.; Alton, J.; Gonzalez-Cabezas, C. Terahertz pulsed imaging study to assess remineralization of artificial caries lesions. J. Biomed. Opt. 2001, 16, 026001. [Google Scholar] [CrossRef] [PubMed]
  25. Meng, K.; Chen, T.N.; Chen, T.; Zhu, L.G.; Liu, Q.; Li, Z.; Li, F.; Zhong, S.C.; Li, Z.R.; Feng, H.; et al. Terahertz pulsed spectroscopy of paraffin-embedded brain glioma. J. Biomed. Opt. 2014, 19, 077001. [Google Scholar] [CrossRef] [PubMed]
  26. Zhao, H.; Wang, Y.; Chen Shi, L.J.; Ma, K.; Tang, L.; Xu, D.; Yao, J.; Feng, H.; Chen, T. High-sensitivity terahertz imaging of traumatic brain injury in a rat model. J. Biomed. Opt. 2018, 23, 036015. [Google Scholar]
  27. Rong, L.; Latychevskaia, T.; Chen, C.; Wang, D.; Yu, Z.; Zhou, X.; Li, Z.; Huang, H.; Wang, Y.; Zhou, Z. Terahertz in-line digital holography of human hepatocellular carcinoma tissue. Sci. Rep. 2015, 5, 8445. [Google Scholar] [CrossRef] [Green Version]
  28. Yang, X.; Zhao, X.; Yang, K.; Liu, Y.; Liu, Y.; Fu, W.; Luo, Y. Biomedical applications of terahertz spectroscopy and imaging. Trends Biotechnol. 2016, 34, 810–824. [Google Scholar] [CrossRef]
  29. Pickwell-MacPherson, E.; Wallace, V.P. Terahertz pulsed imaging—A potential medical imaging modality? Photodiagnosis Photodyn. Ther. 2009, 6, 128–134. [Google Scholar] [CrossRef]
  30. Hayakawa, Y.; Sato, I.; Hayakawa, K.; Tanaka, T.; Nakazawa, H.; Yokoyama, K.; Kanno, K.; Sakai, T.; Ishiwata, K.; Enomoto, A.; et al. First lasing of LEBRA FEL at Nihon University at a wavelength of 1.5 μm. Nucl. Instrum. Meth. A 2002, 483, 29–33. [Google Scholar] [CrossRef]
  31. Danciu, M.; Alexa-Stratulat, T.; Stefanescu, C.; Dodi, G.; Tamba, B.I.; Mihai, C.T.; Stanciu, G.D.; Luca, A.; Spiridon, I.A.; Ungureanu, L.B.; et al. Terahertz spectroscopy and imaging: A cutting-edge method for diagnosing digestive cancers. Materials 2019, 12, 1519. [Google Scholar] [CrossRef] [Green Version]
  32. Parrott, E.P.J.; Sun, Y.; Pickwell-MacPherson, E. Terahertz spectroscopy: Its future role in medical diagnoses. J. Mol. Struct. 2011, 1006, 66–76. [Google Scholar] [CrossRef]
  33. Gong, A.; Qiu, Y.; Chen, X.; Zhao, Z.; Xia, L.; Shao, Y. Biomedical applications of terahertz technology. Appl. Spectrosc. Rev. 2020, 55, 418–438. [Google Scholar] [CrossRef]
  34. Storey, P. Introduction to magnetic resonance imaging and spectroscopy. Methods Mol. Med. 2006, 124, 3–57. [Google Scholar] [PubMed]
  35. Duan, F.; Wang, Y.Y.; Xu, D.G.; Shi, J.; Chen, L.Y.; Cui, L.; Bai, Y.H.; Xu, Y.; Yuan, J.; Chang, C. Feasibility of terahertz imaging for discrimination of human hepatocellular carcinoma. World J. Gastrointest. Oncol. 2019, 11, 153–160. [Google Scholar] [CrossRef] [PubMed]
  36. Chernomyrdin, N.V.; Kucheryavenko, A.S.; Kolontaeva, G.S.; Katyba, G.M.; Dolganova, I.N.; Karalkin, P.A.; Ponomarev, D.S.; Kurlov, V.N.; Reshetov, I.V.; Skorobogatiy, M.; et al. Reflection-mode continuous-wave 0.15 λ-resolution terahertz solid immersion microscopy of soft biological tissues. Appl. Phys. Lett. 2018, 113, 111102. [Google Scholar] [CrossRef]
  37. Okada, K.; Serita, K.; Cassar, Q.; Murakami, H.; MacGrogan, G.; Guillet, J.P.; Mounaix, P.; Tonouchi, M. Terahertz near-field microscopy of ductal carcinoma in situ (DCIS) of the breast. J. Phys. Photonics 2020, 2, 044008. [Google Scholar] [CrossRef]
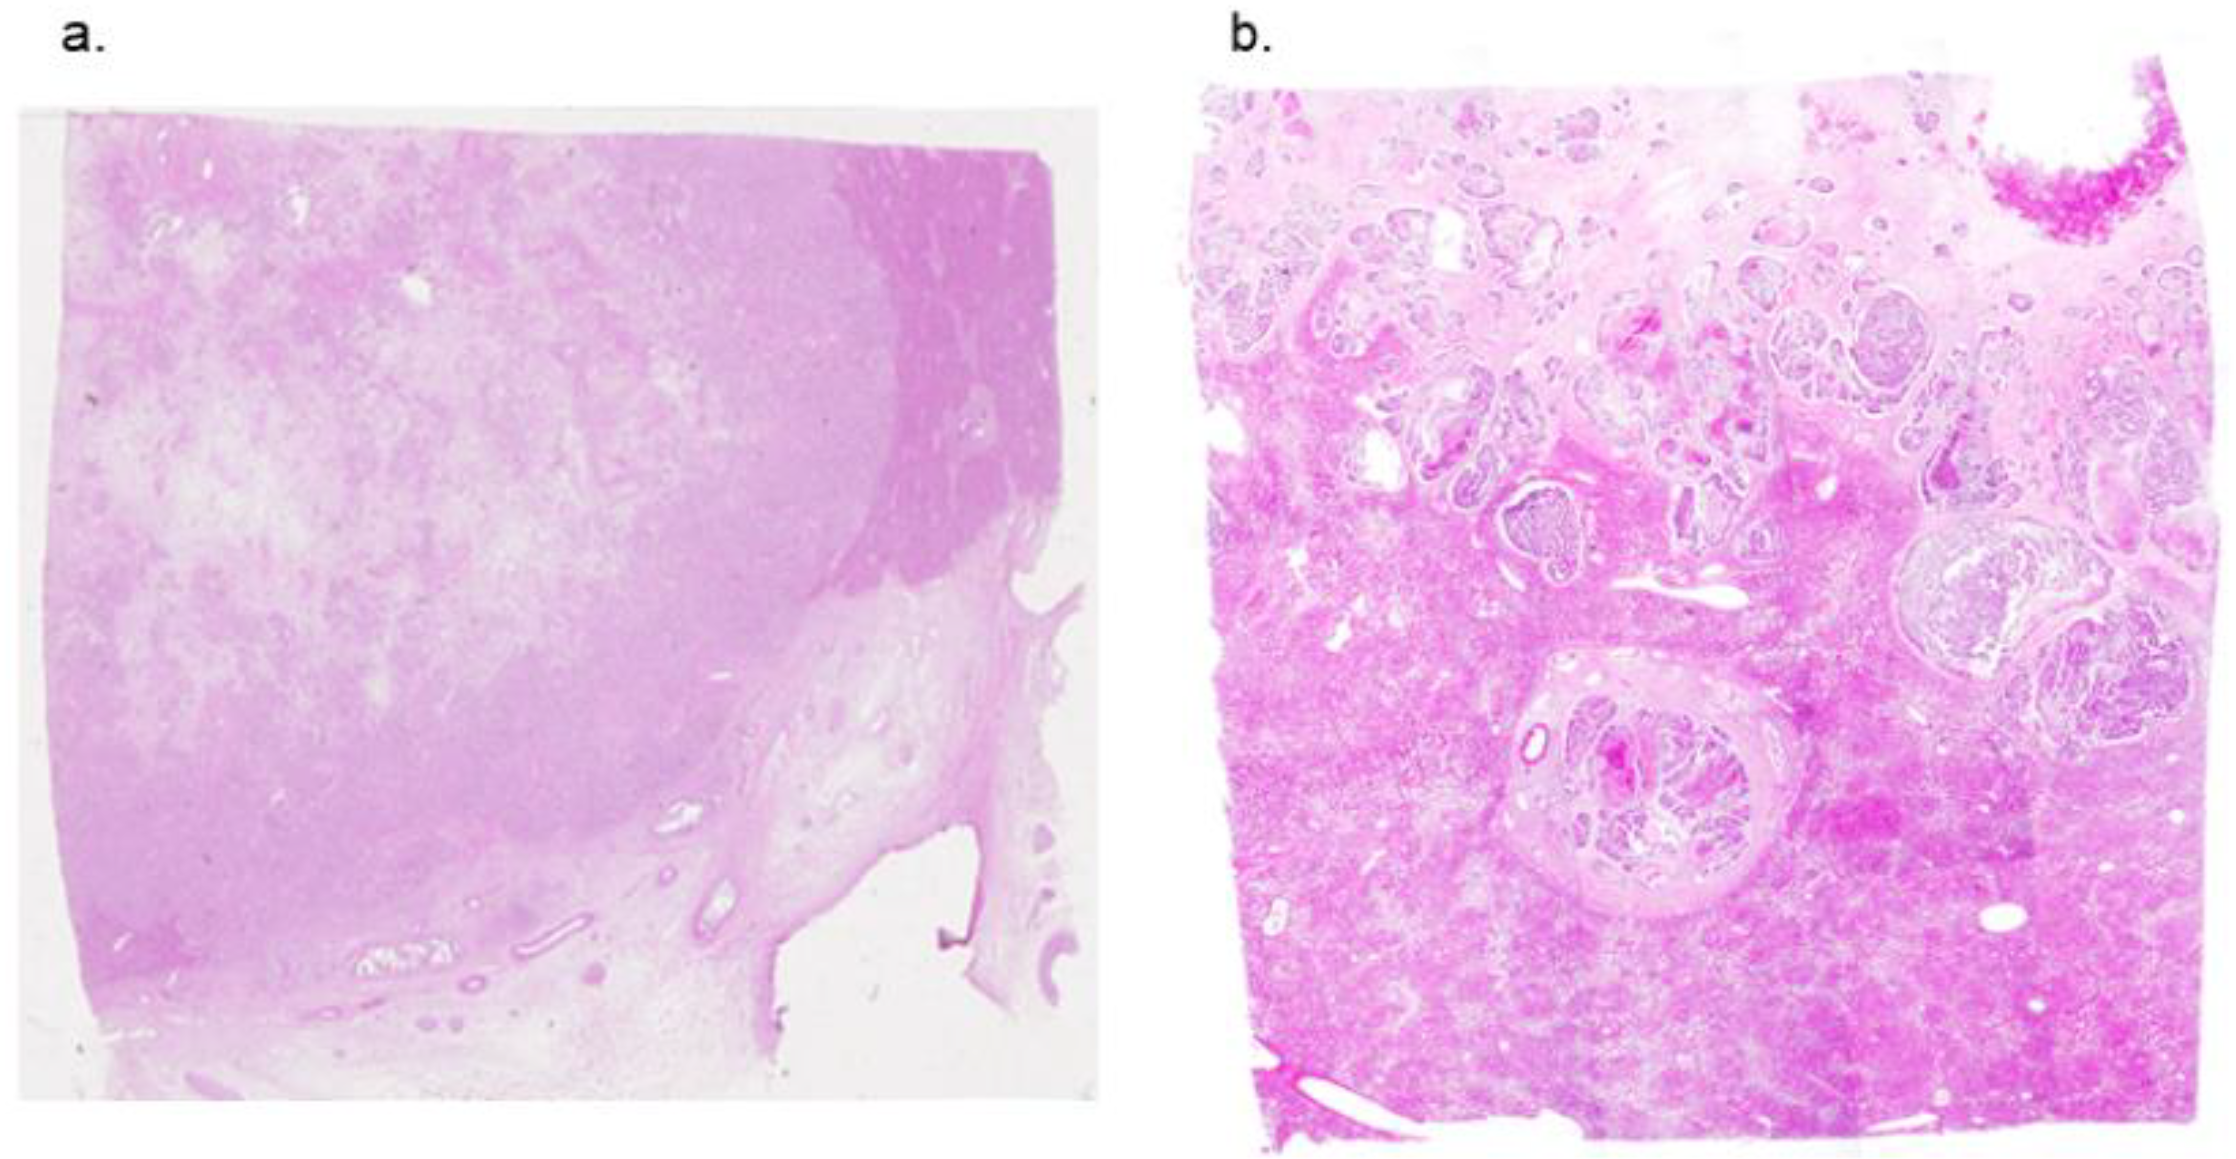
Figure 1. Hematoxylin and eosin-stained liver samples (a,b).
Applsci 12 02229 g001
Figure 2. Schematic layout of the (a) terahertz imaging system and (b) infrared free-electron laser imaging system.
Applsci 12 02229 g002
Figure 3. Transmissions of the normal tissue with widths of (a) 100 μm and (b) 200 μm in terahertz imaging. Each graph illustrates the transmission data for 7 × 7 points in 2 mm2 using the three-dimensional and two-dimensional hue maps.
Applsci 12 02229 g003
Figure 4. Images of sample #3 by (a) infrared free−electron laser imaging and (b) photograph. Stained images are shown for the blue, black, and green frames in (b).
Applsci 12 02229 g004
Figure 5. Terahertz (THz) imaging for a highly fibrotic tumor tissue (sample #1): (a) visible image, (b) THz image, and (c) transmissions averaged in the vertical direction. The regions where the normal tissue (green), the tumor tissue (black), and the fibrous tissue (red) are distributed are indicated by double-headed arrows in (c). The dotted line represents the average transmittance value for each tissue.
Applsci 12 02229 g005
Figure 6. The visible image of formalin fixed liver (a,b) terahertz image of a liver tissue with underdeveloped fibrosis (sample #4). The yellow and green frames in (a) indicate the regions where the average transmission of the tumor tissue is evaluated.
Applsci 12 02229 g006
Table 1. Measured transmissions of the normal tissue and the tumor tissue for each sample. Data are presented as means ± standard deviation.
Sample
Number
Number of
Data Point
Transmission of
Normal Tissue
Transmission of
Tumor Tissue
p-Value
#15536.07% ± 2.30%37.88% ± 2.85%<0.001
#25534.65% ± 1.34%31.11% ± 1.38%<0.001
#35536.74% ± 2.08%35.88% ± 2.09%0.033
#44933.06% ± 1.07%31.89% ± 1.09%<0.001
#54936.90% ± 1.37%38.35% ± 1.58%<0.001
#64934.47% ± 0.86%37.45% ± 1.40%<0.001
Publisher’s Note: MDPI stays neutral with regard to jurisdictional claims in published maps and institutional affiliations.