
Lithography Hotspot Detection Method Based on Transfer Learning Using Pre-Trained Deep Convolutional Neural Network


Abstract
:1. Introduction
2. Methods
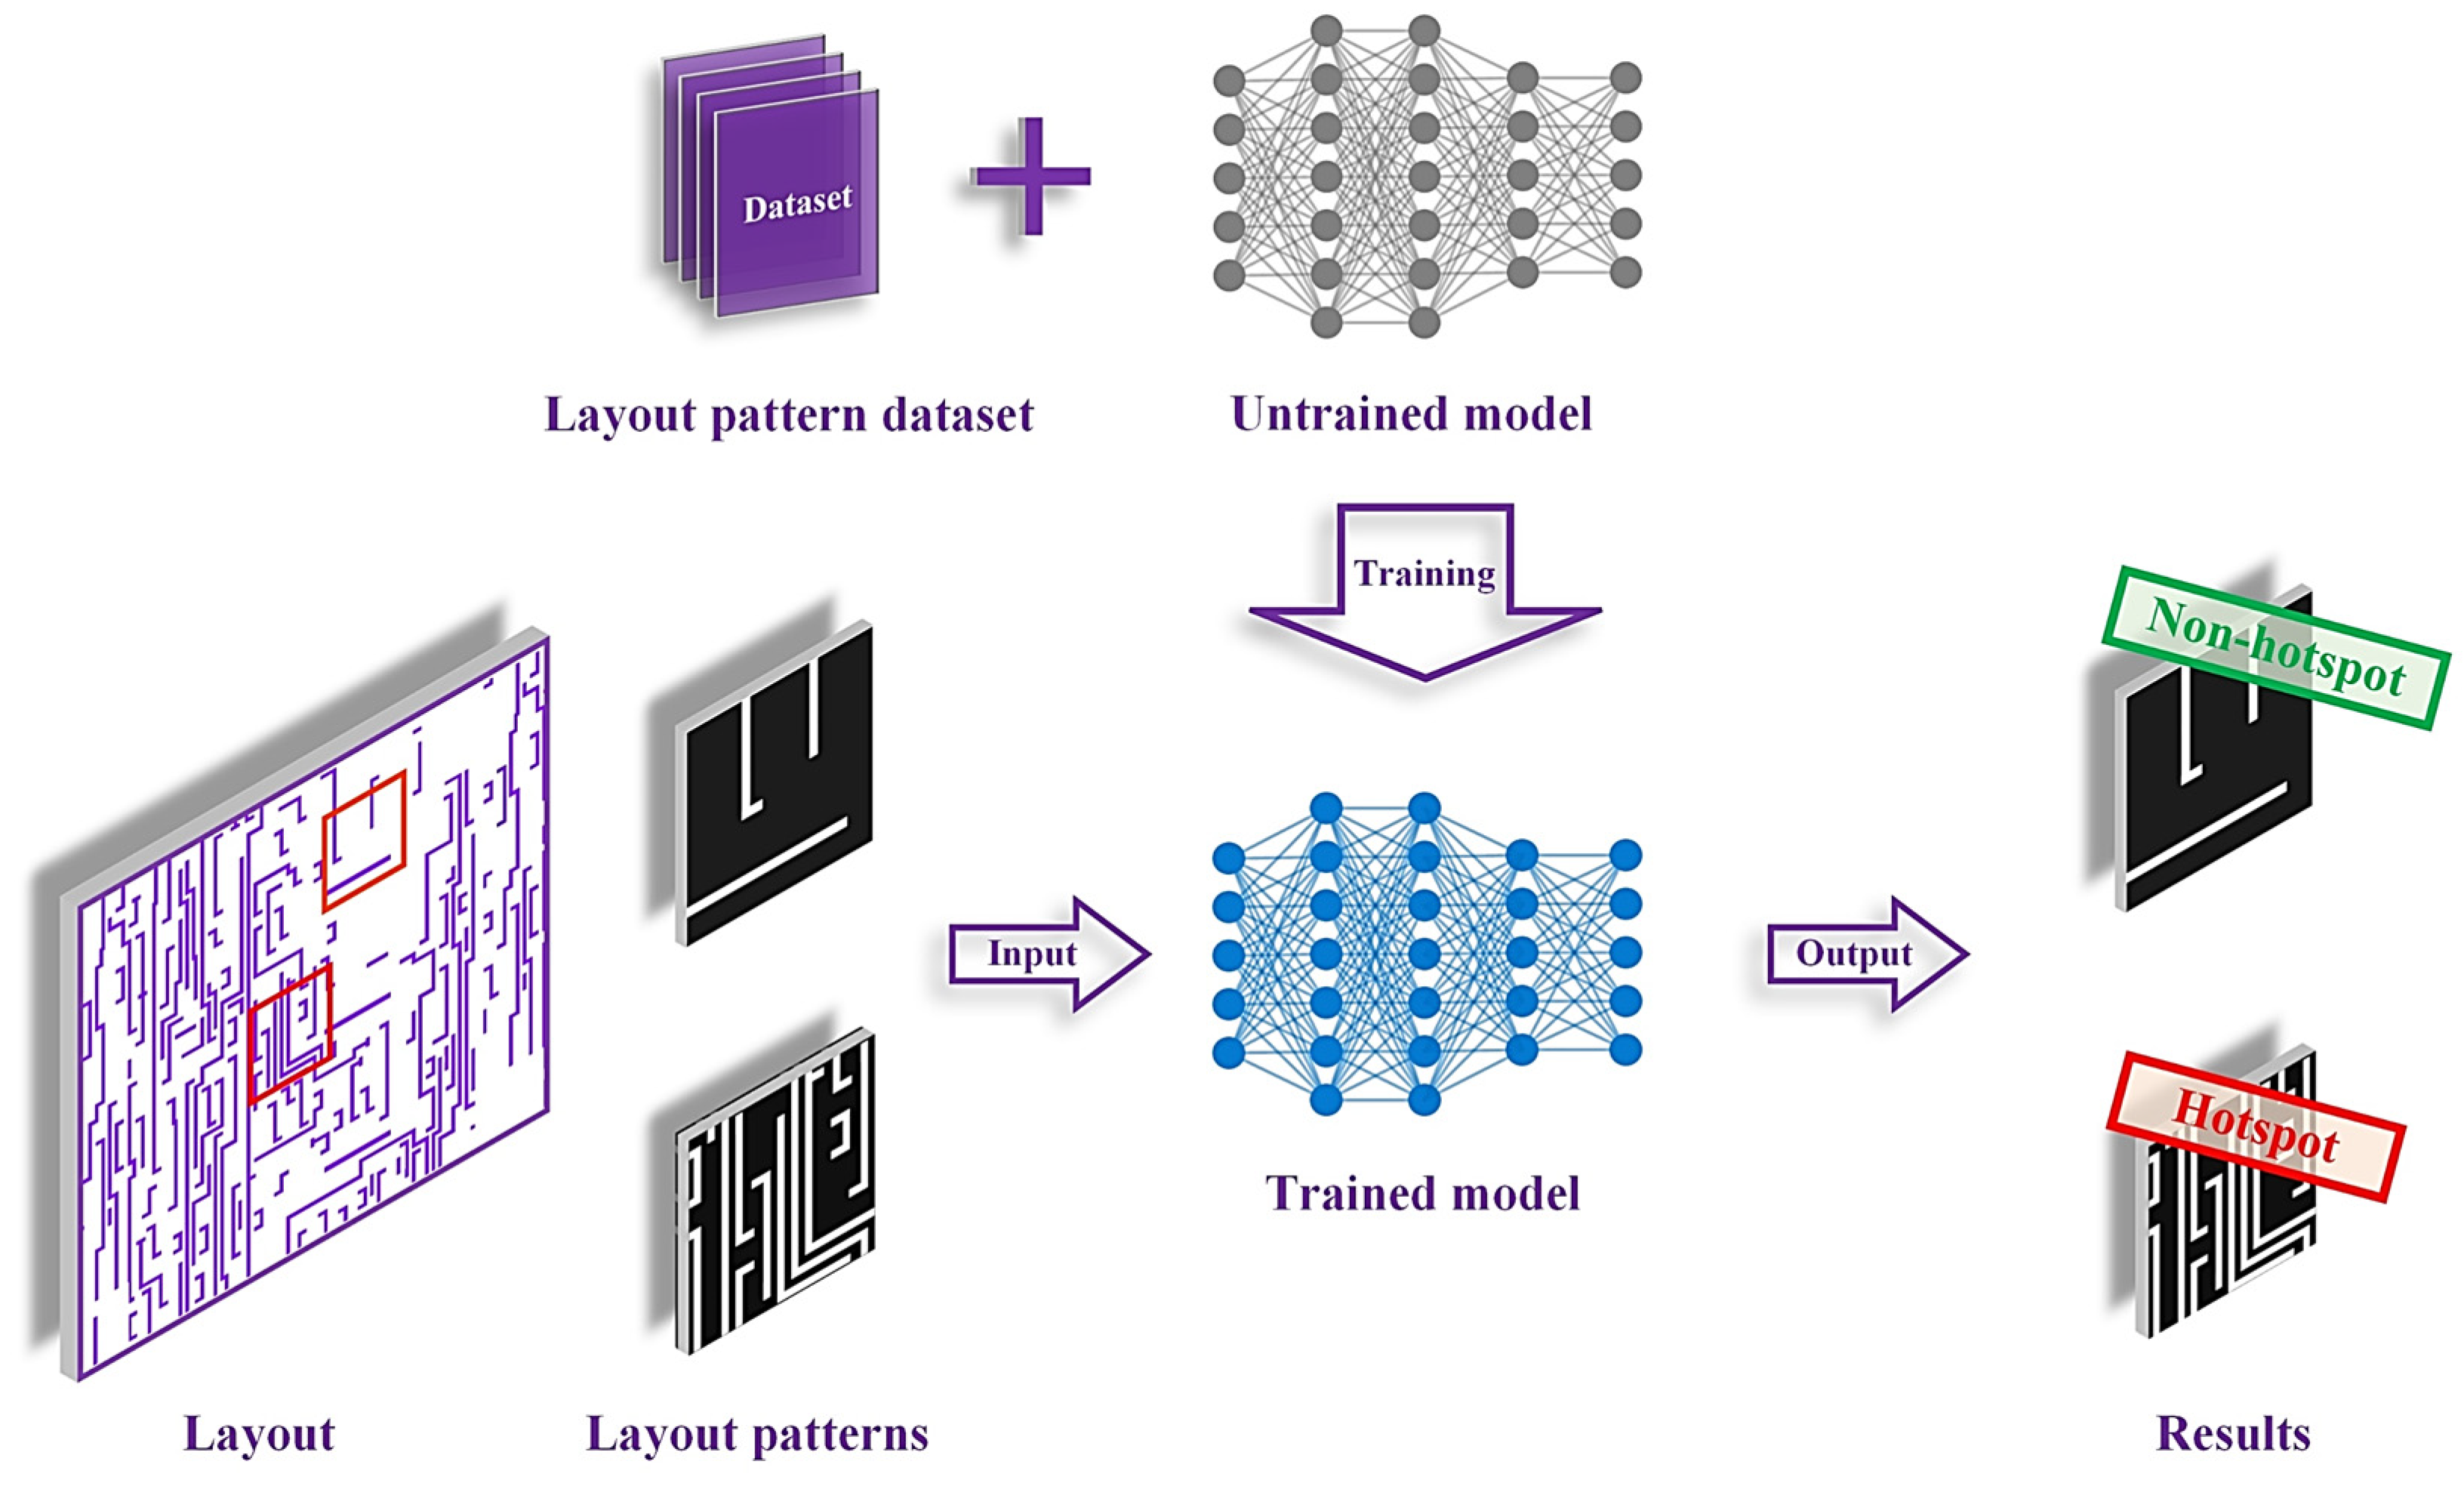
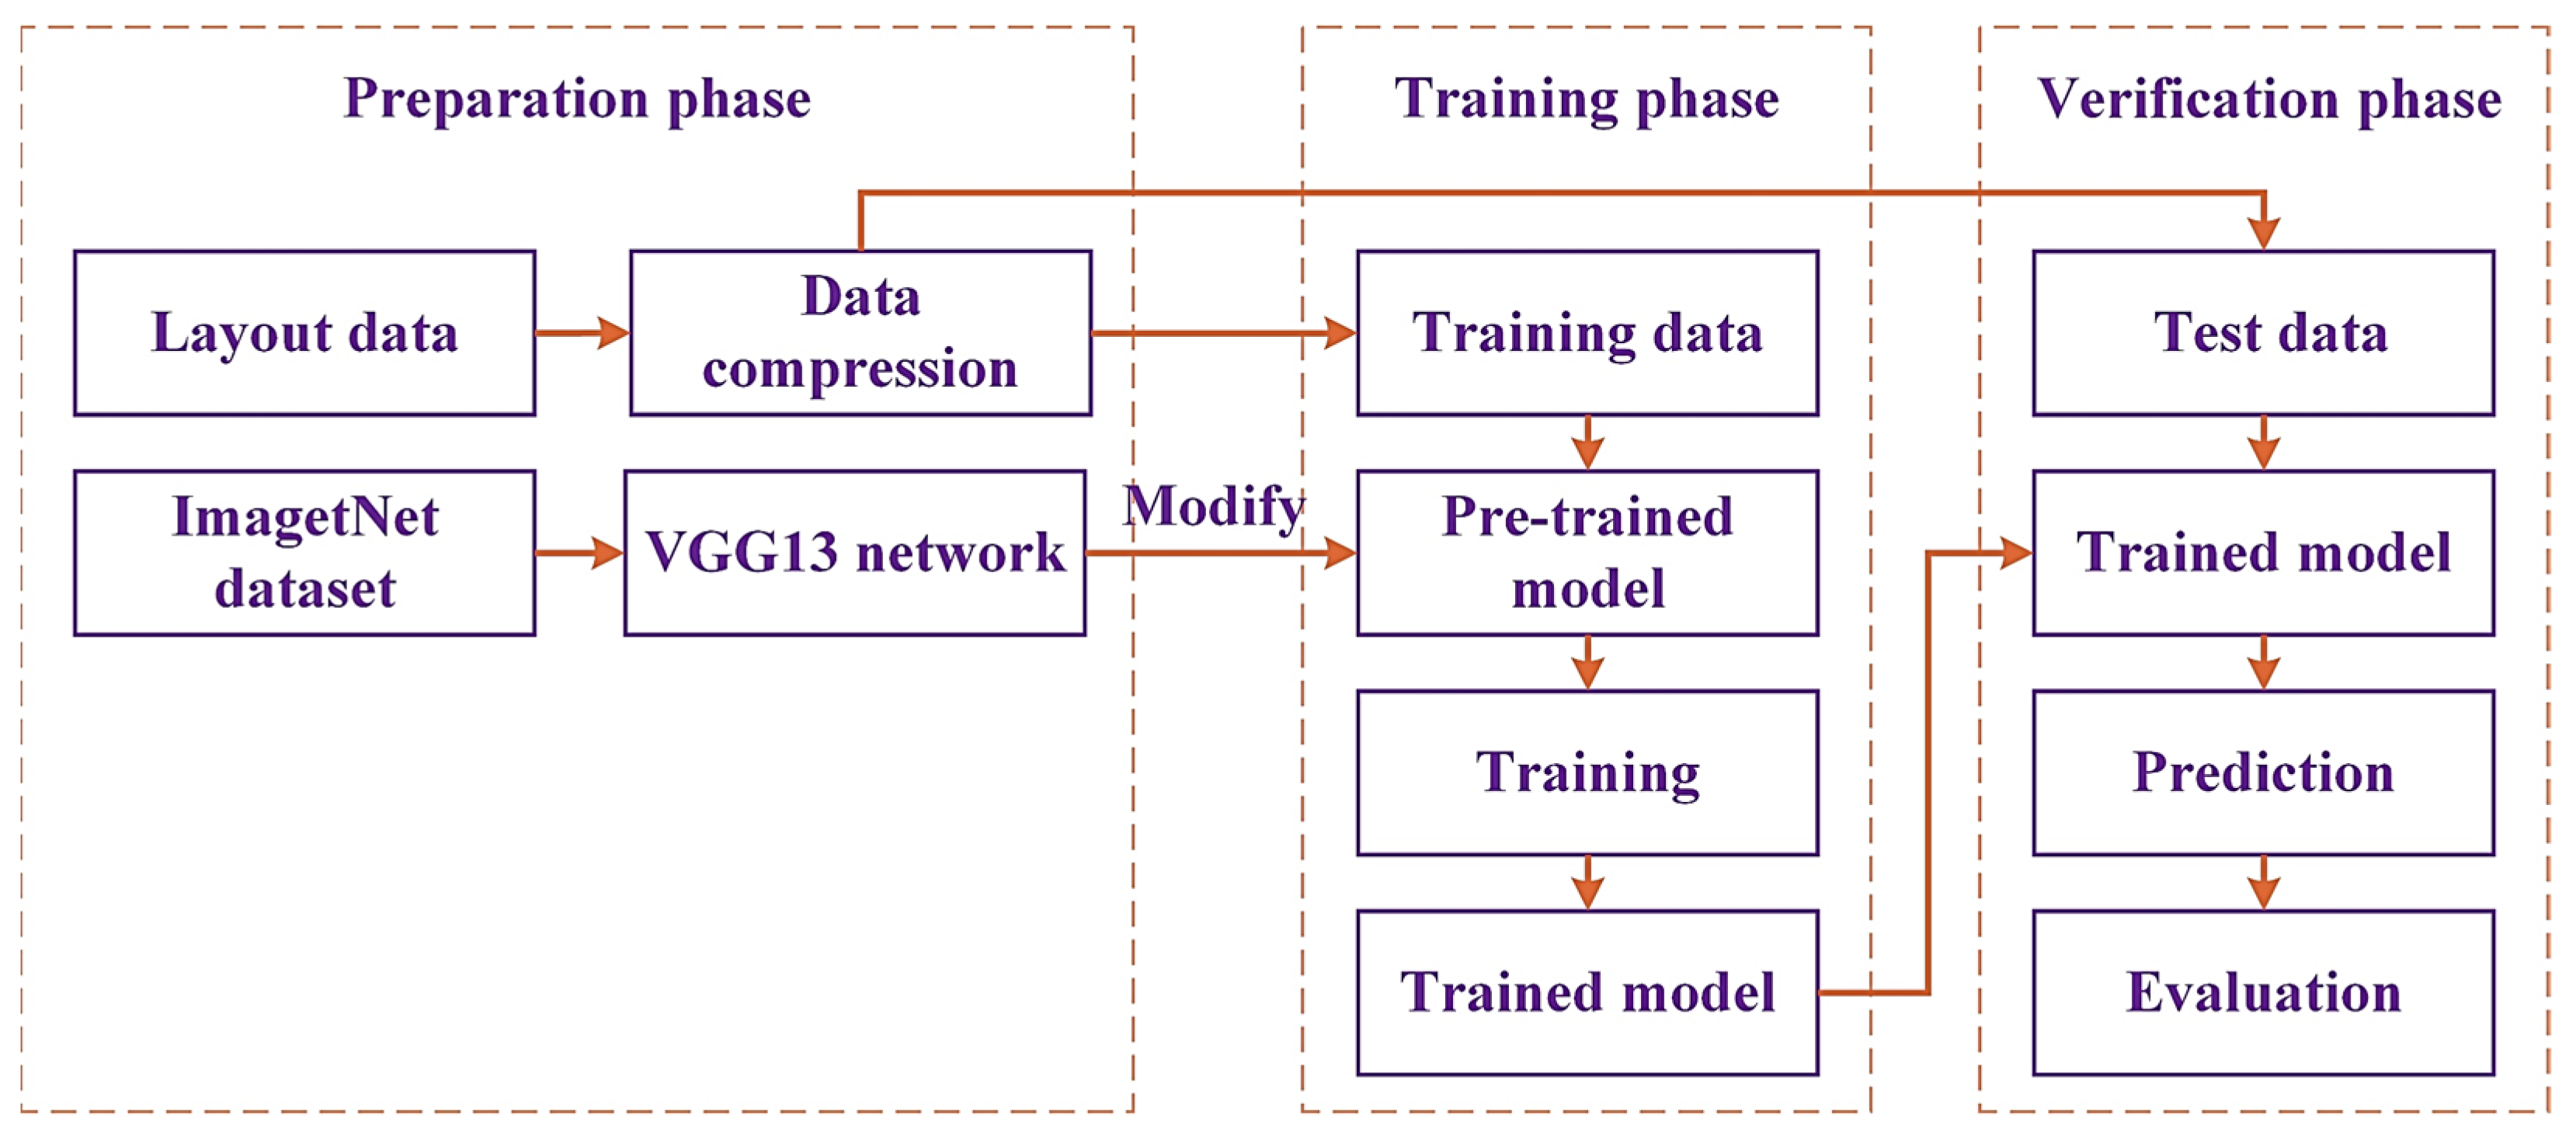
2.1. Workflow
2.2. Data Preparation
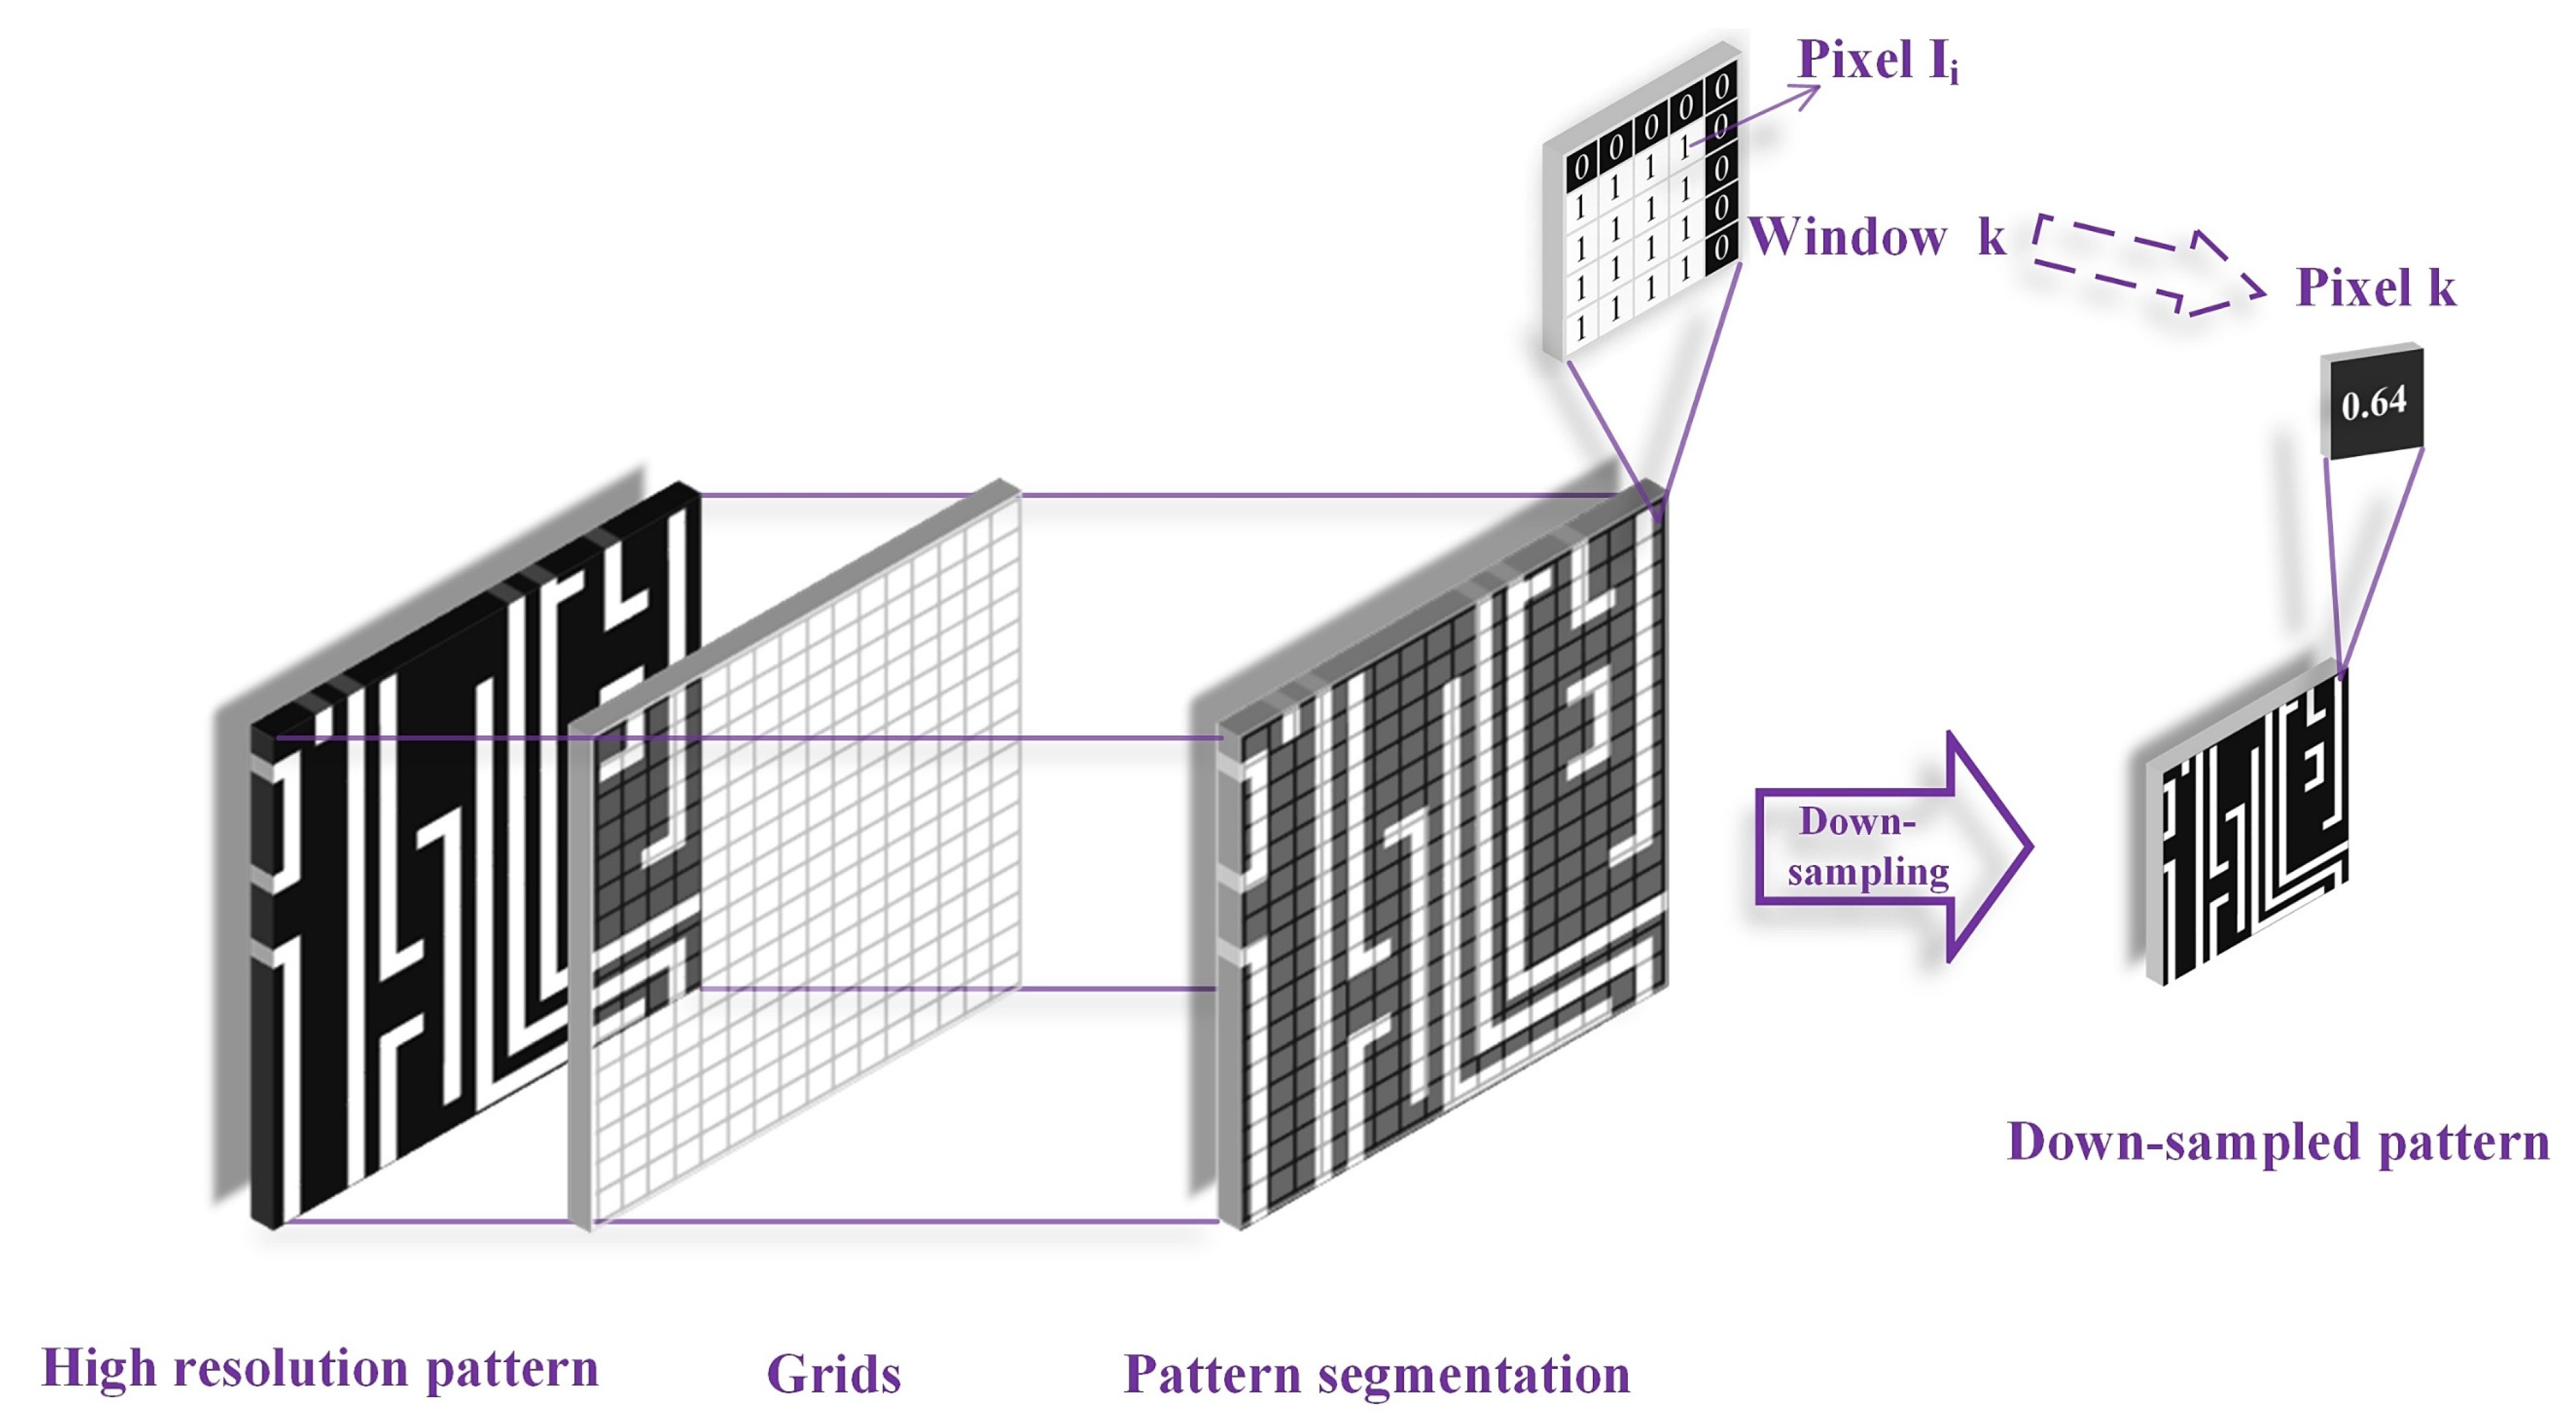
2.2.1. Data Compression
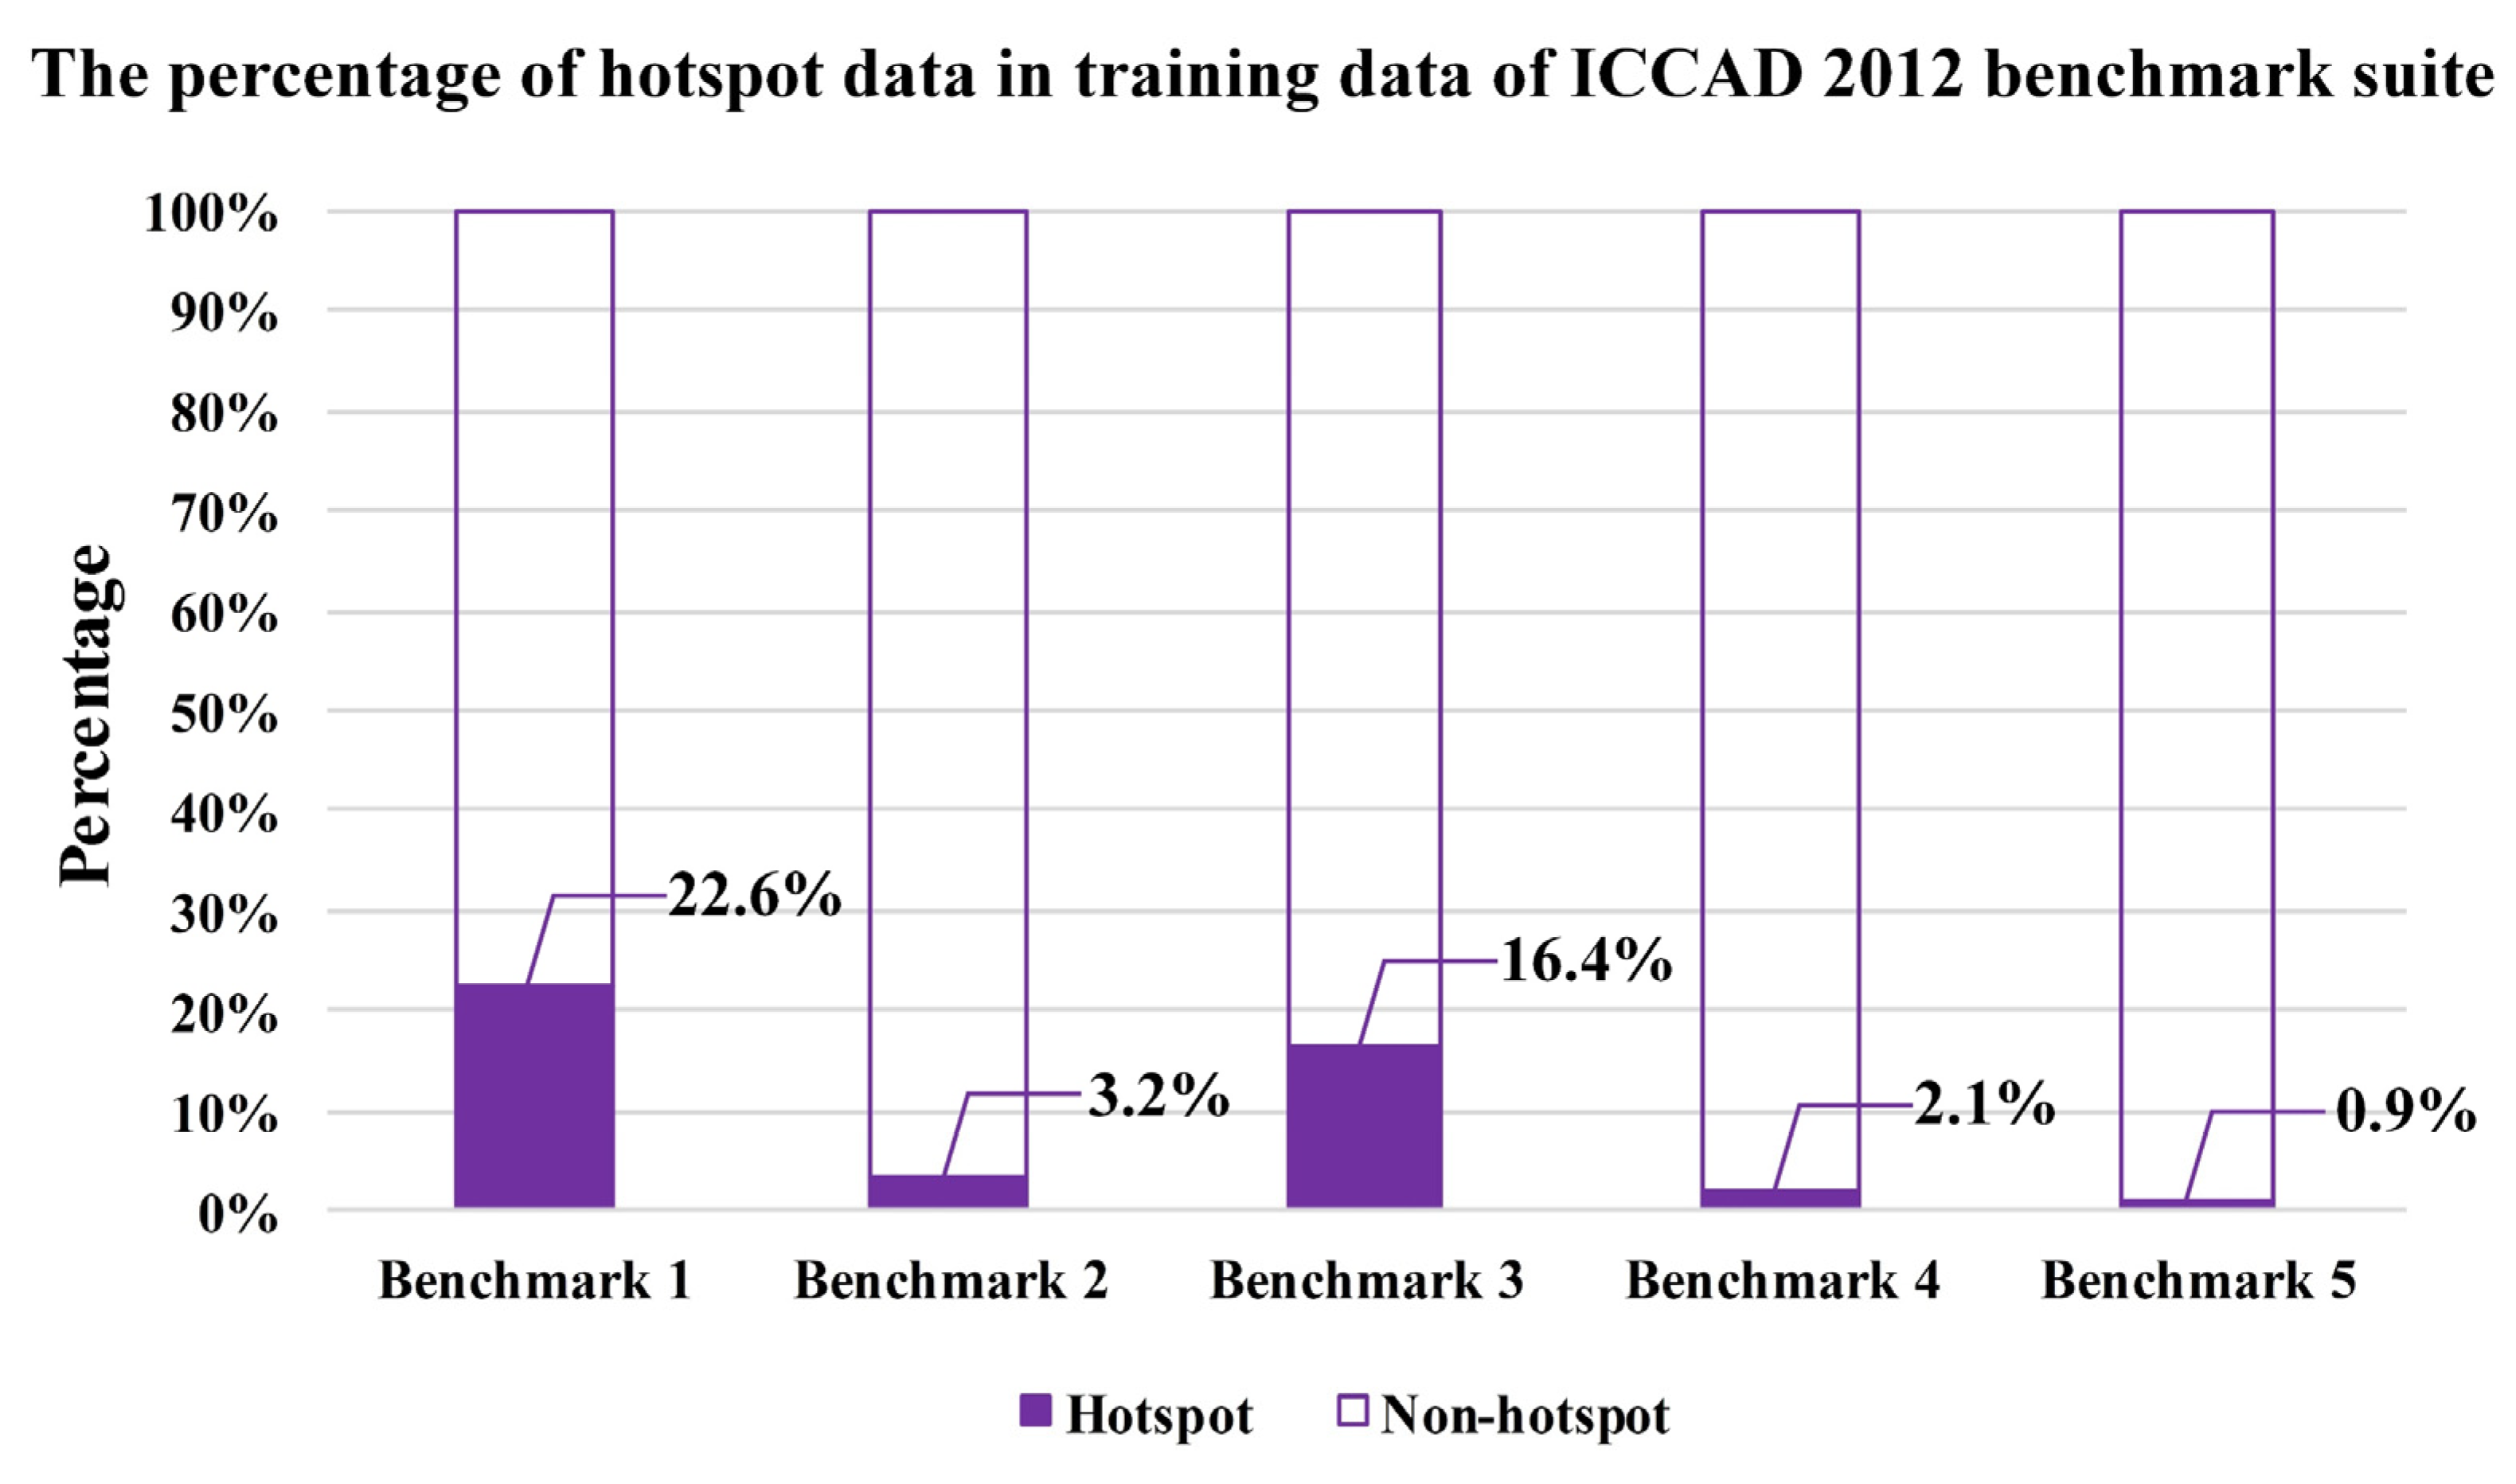
2.2.2. Data Balance
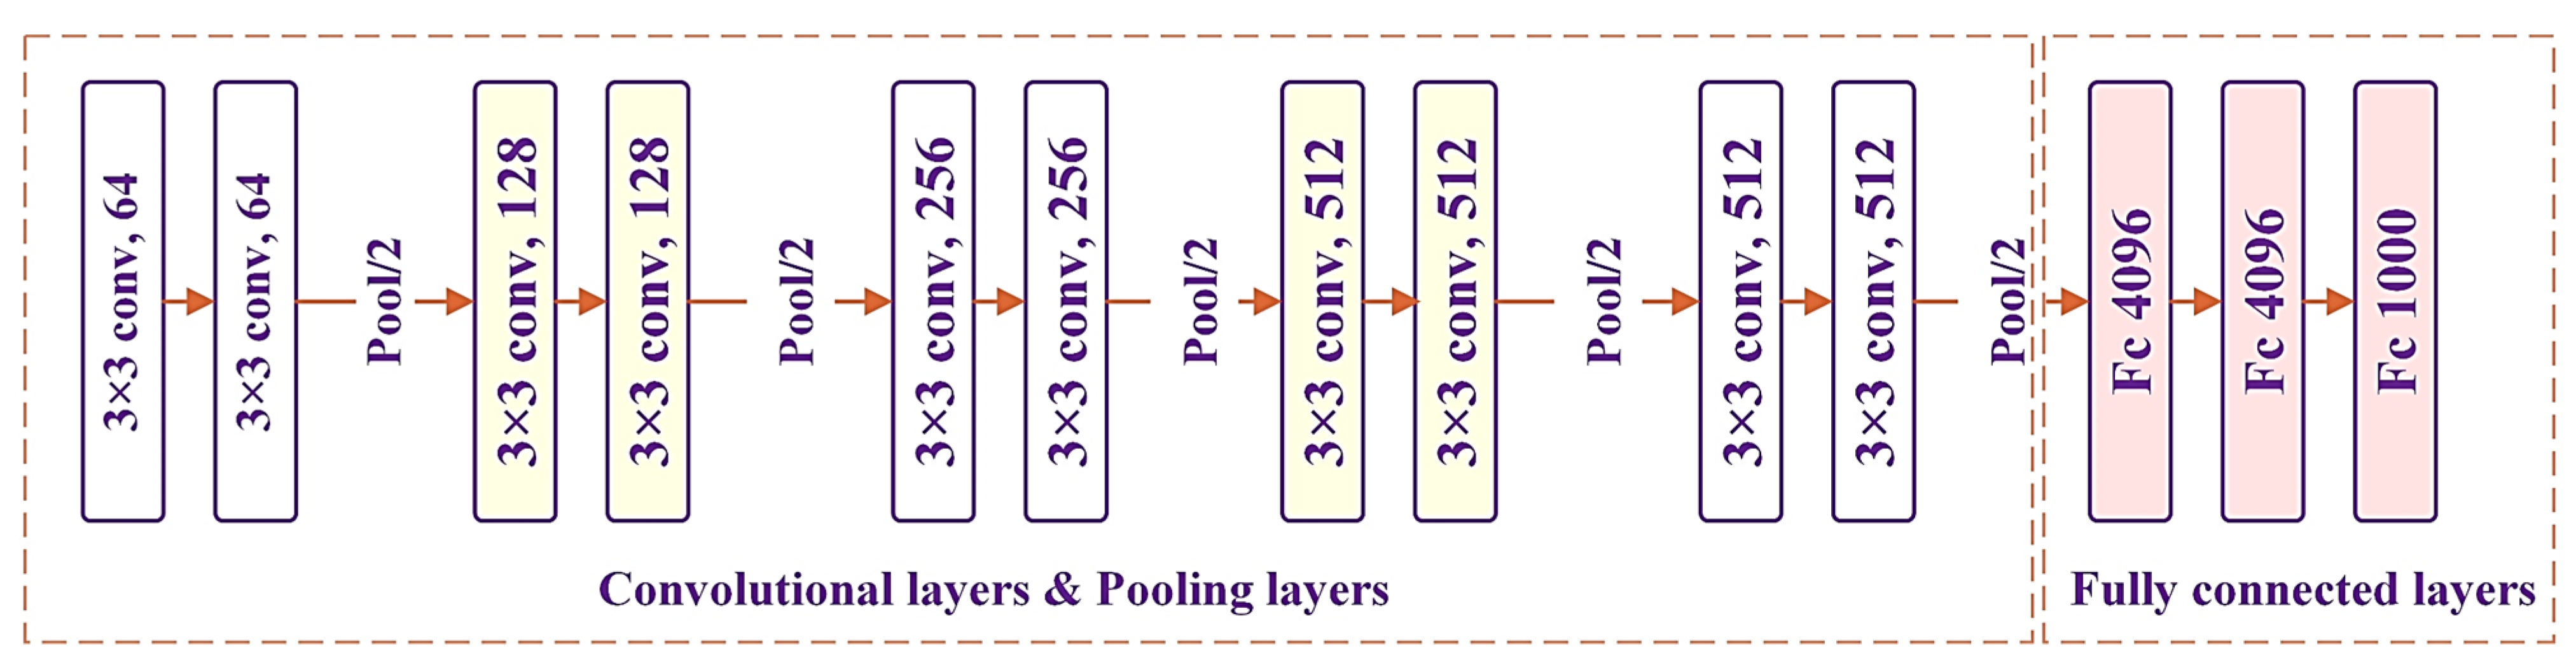
2.3. Model Modification and Model Training
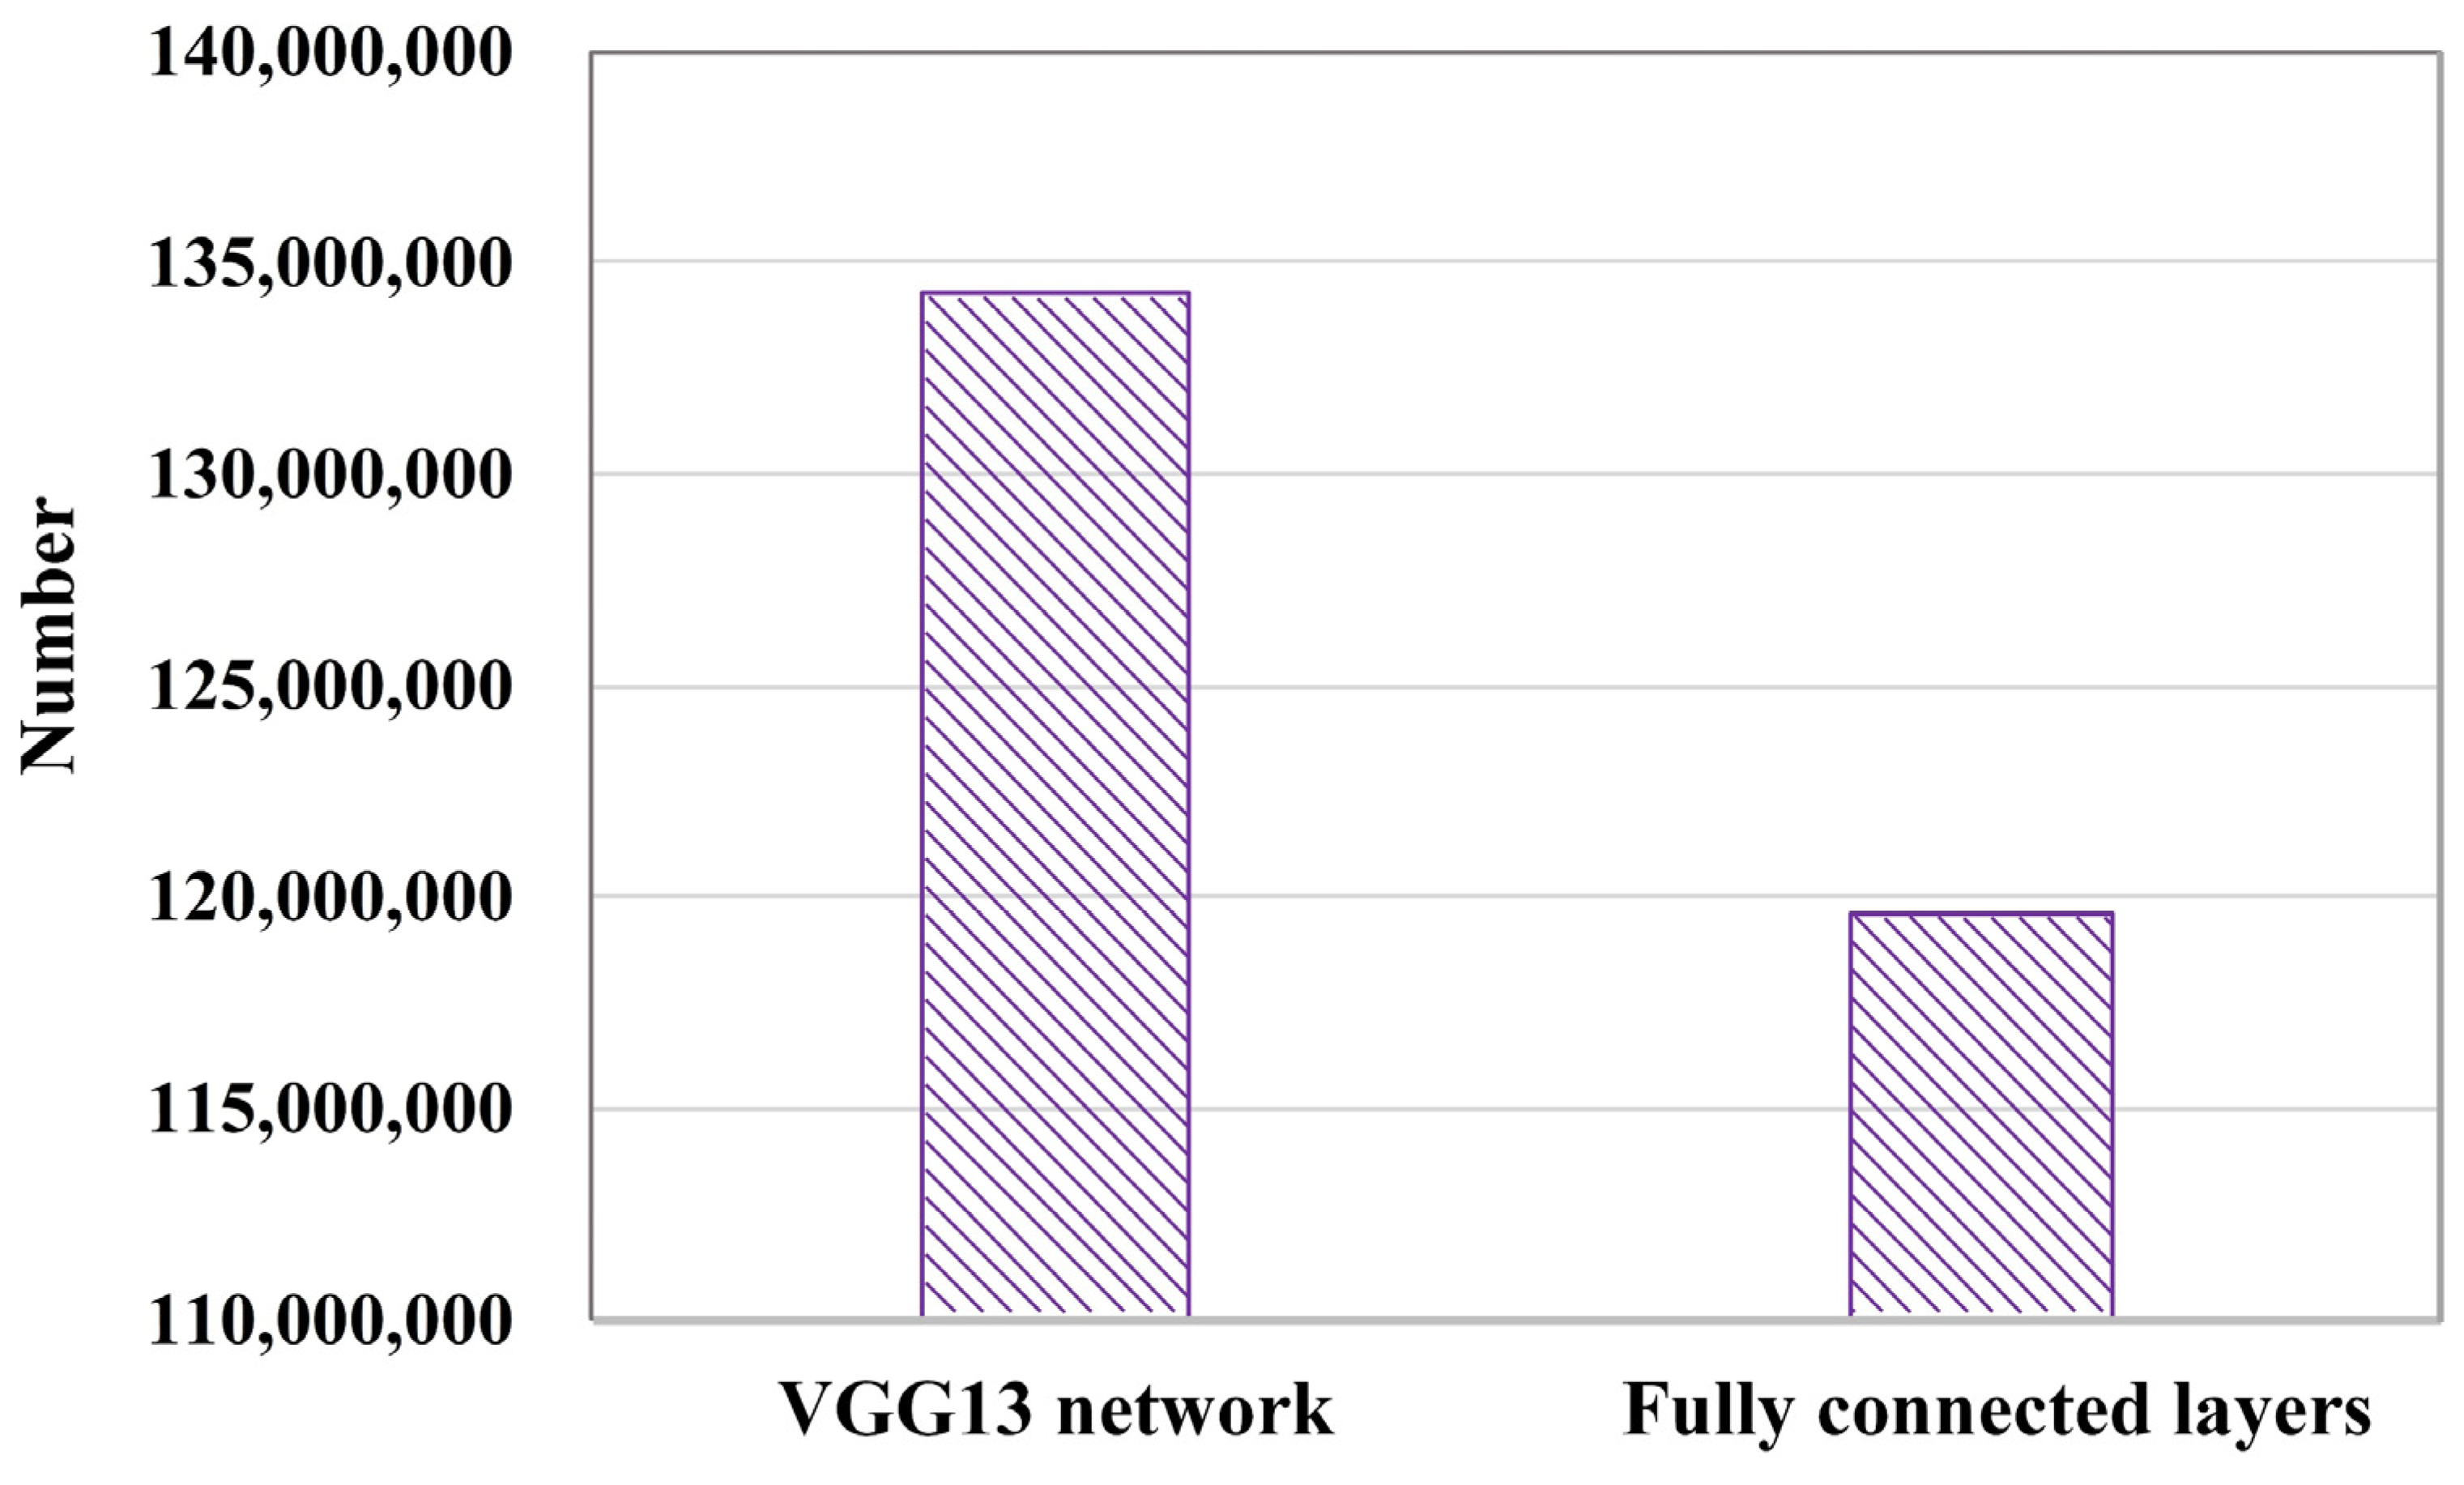
2.3.1. Model Modification
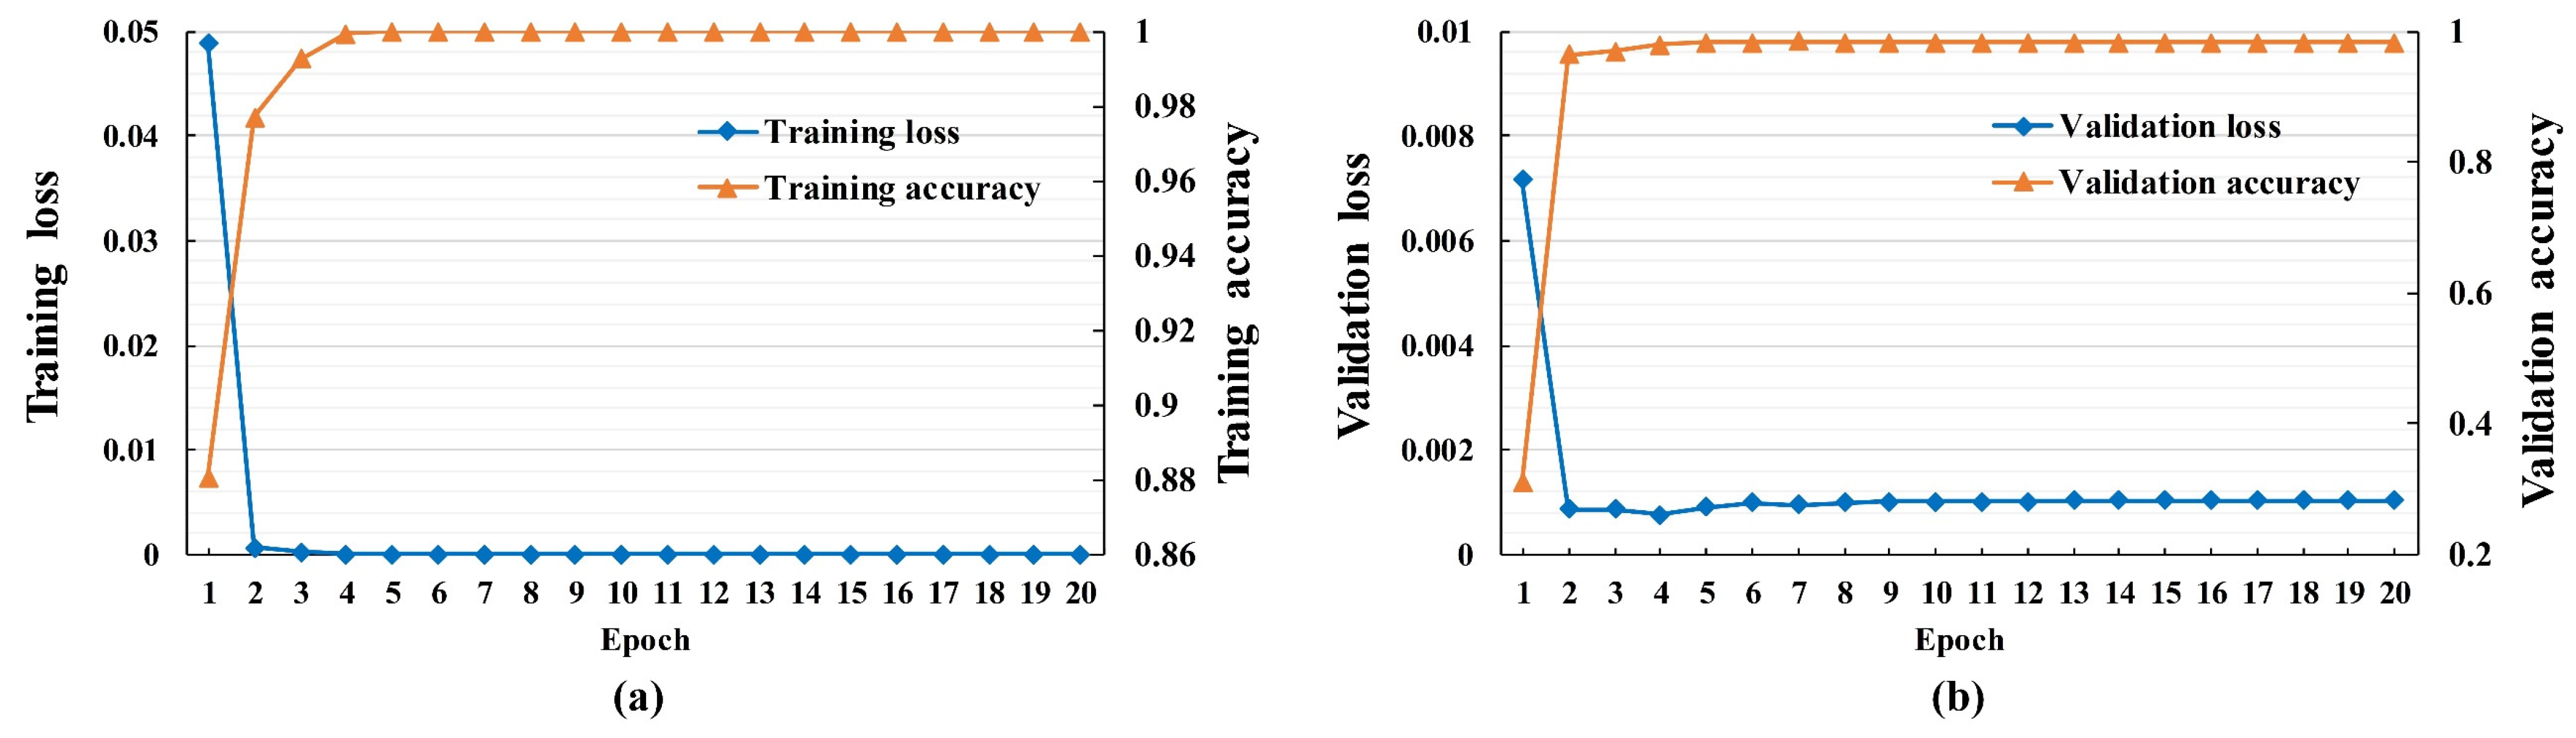
2.3.2. Model Training
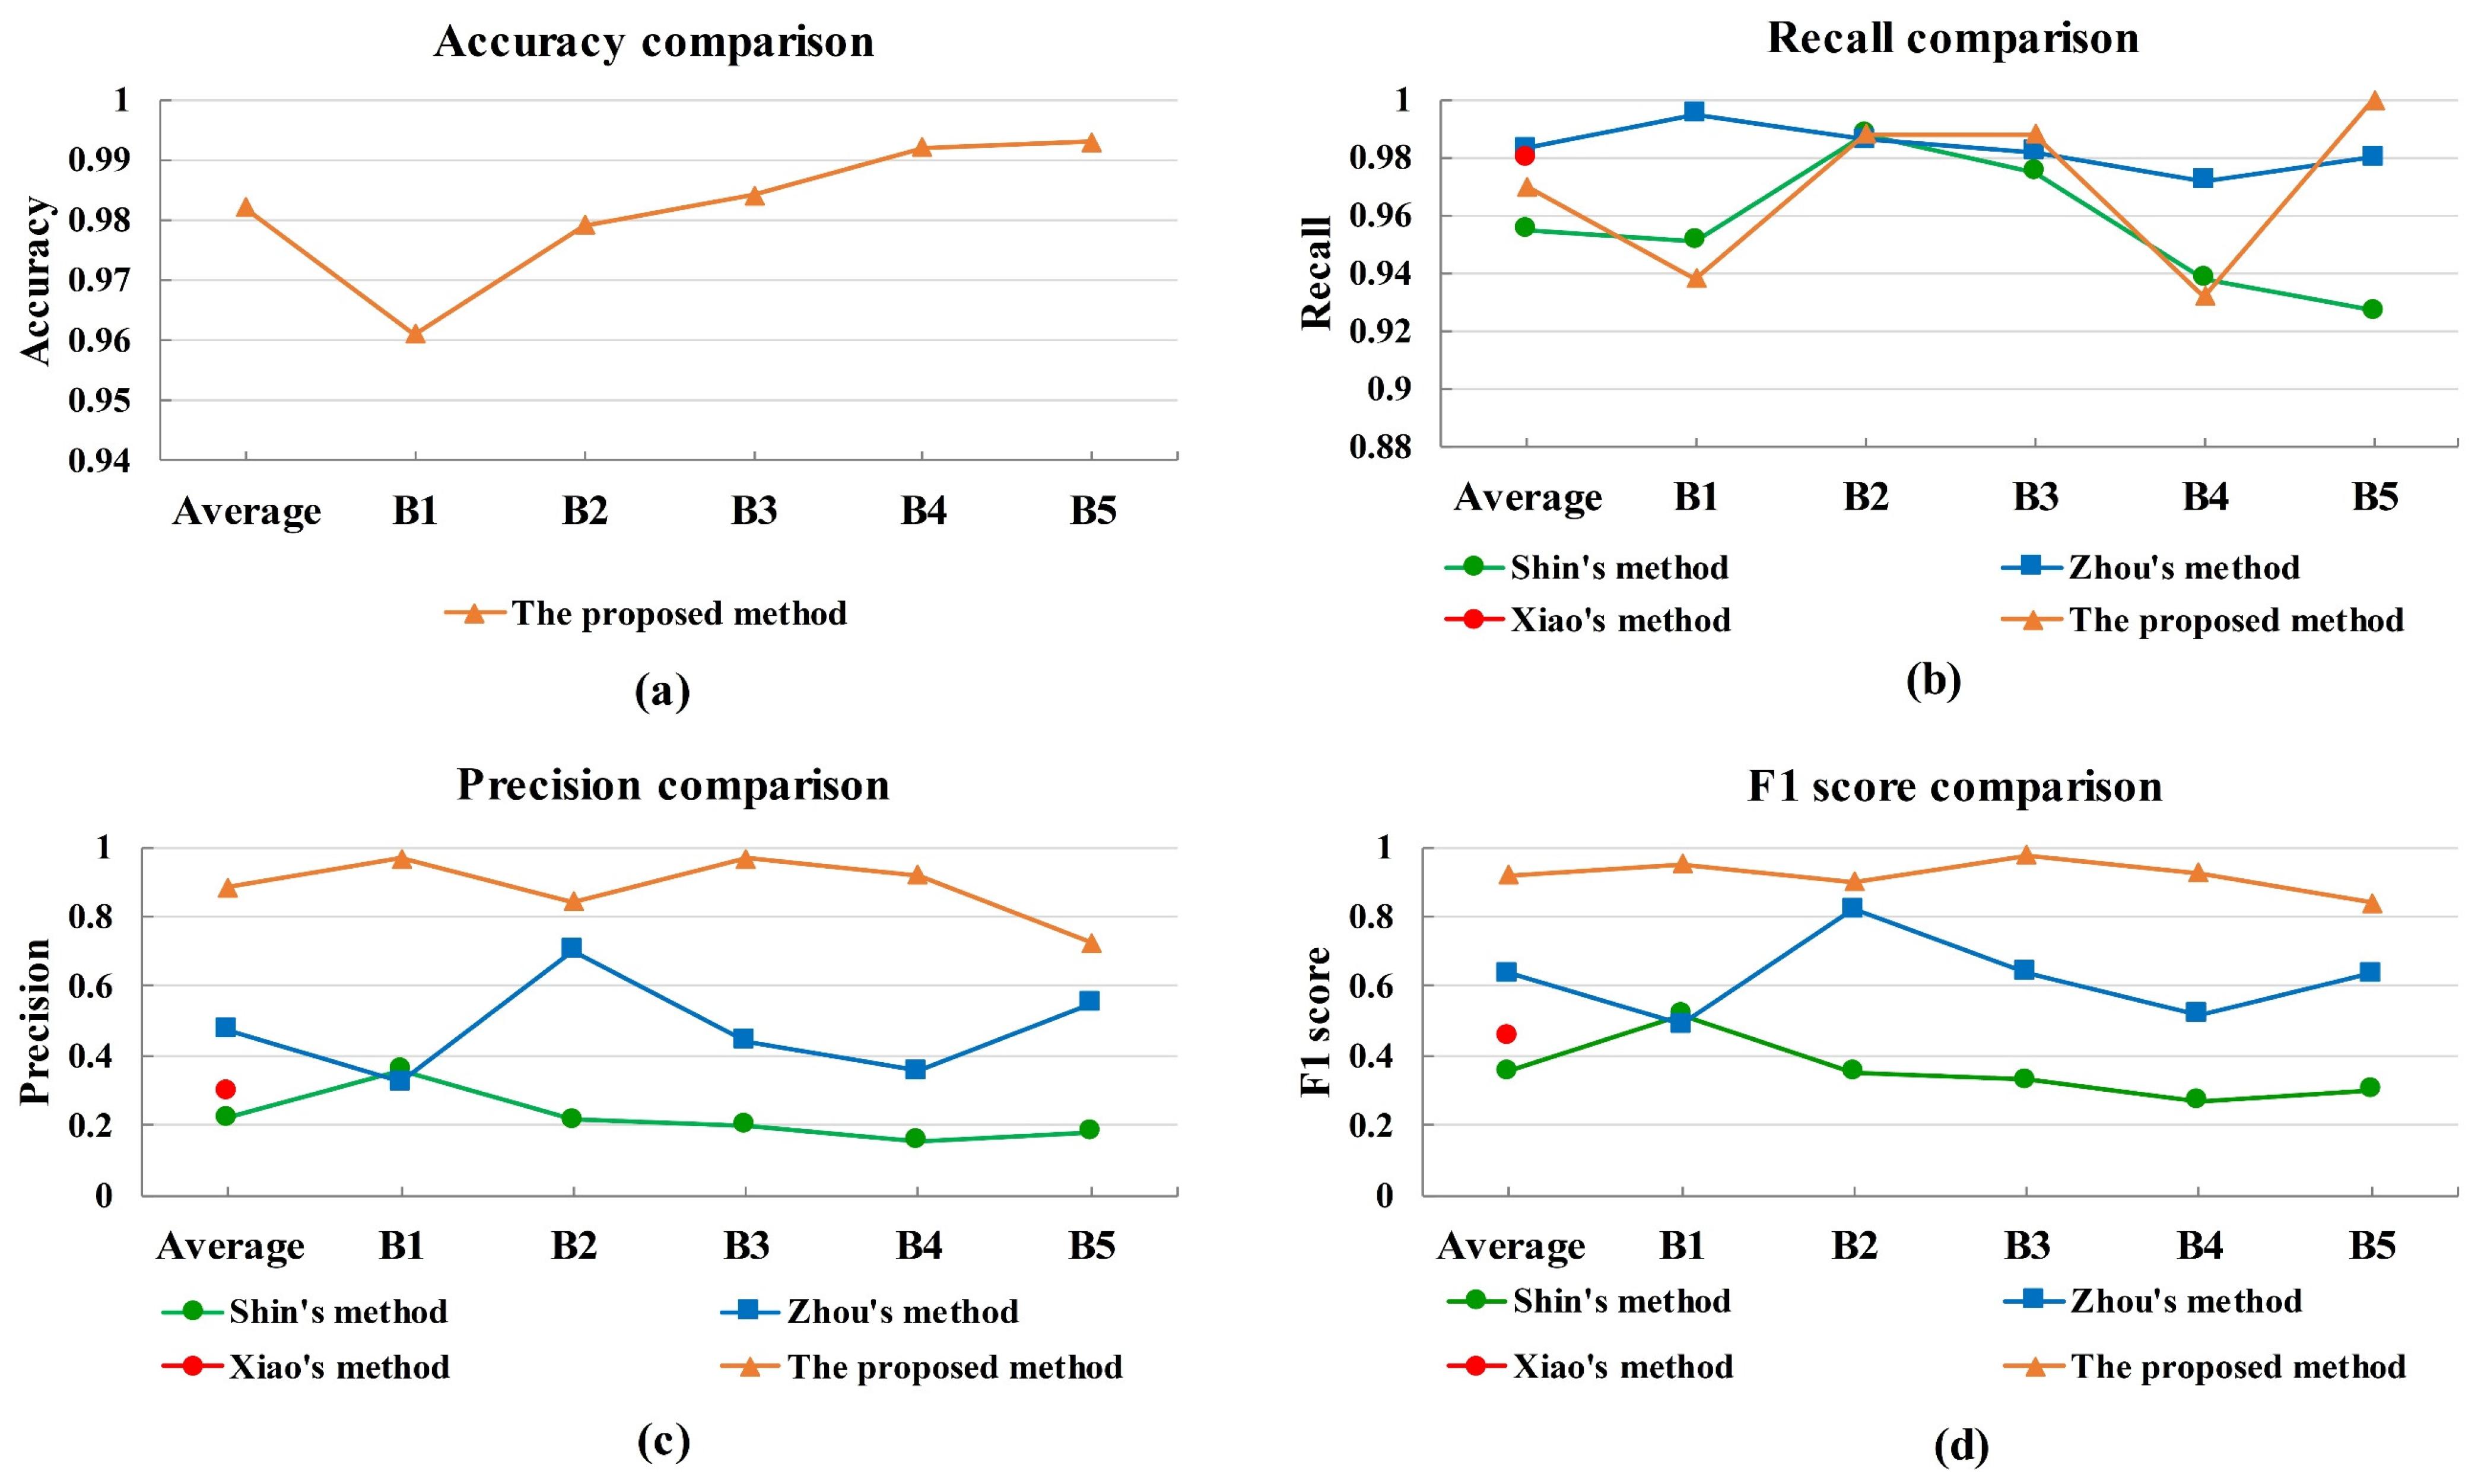
3. Results and Discussion
3.1. All Convolutional Layers Are Frozen
3.2. Partial Convolutional Layers Are Released
4. Conclusions
Author Contributions
Funding
Institutional Review Board Statement
Informed Consent Statement
Data Availability Statement
Acknowledgments
Conflicts of Interest
References
- Neisser, M. International Roadmap for Devices and Systems Lithography Roadmap. J. Micro/Nanopattern. Mater. Metrol. 2021, 20, 044601. [Google Scholar] [CrossRef]
- Wikipedia: Transistor Count. Available online: https://en.wikipedia.org/wiki/Transistor_count (accessed on 31 December 2021).
- Jochemsen, M.; Anunciado, R.; Timoshkov, V.; Hunsche, S.; Zhou, X.; Jones, C.; Callan, N. Process Window Limiting Hot Spot Monitoring for High-Volume Manufacturing. In Proceedings of the Metrology, Inspection, and Process Control for Microlithography XXX, San Jose, CA, USA, 21–25 February 2016; p. 97781R. [Google Scholar]
- Hunsche, S.; Jochemsen, M.; Jain, V.; Zhou, X.; Chen, F.; Vellanki, V.; Spence, C.; Halder, S.; van den Heuvel, D.; Truffert, V. A New Paradigm for In-Line Detection and Control of Patterning Defects. In Proceedings of the Metrology, Inspection, and Process Control for Microlithography XXIX, San Jose, CA, USA, 22–26 February 2015; p. 94241B. [Google Scholar]
- Nosato, H.; Sakanashi, H.; Takahashi, E.; Murakawa, M.; Matsunawa, T.; Maeda, S.; Tanaka, S.; Mimotogi, S. Hotspot Prevention and Detection Method Using An Image-Recognition Technique Based on Higher-Order Local Autocorrelation. J. Micro/Nanolith. MEMS MOEMS 2014, 13, 011007. [Google Scholar] [CrossRef]
- Weisbuch, F.; Thaler, T.; Buttgereit, U.; Stötzel, C.; Zeuner, T. Improving ORC Methods and Hotspot Detection with The Usage of Aerial Image Metrology. In Proceedings of the Optical Microlithography XXXIII, San Jose, CA, USA, 23–27 February 2020; p. 113270D. [Google Scholar]
- Kim, J.; Fan, M. Hotspot Detection on Post-OPC Layout Using Full-Chip Simulation-Based Verification Tool: A Case Study with Aerial Image Simulation. In Proceedings of the 23rd Annual BACUS Symposium on Photomask Technology, Monterey, CA, USA, 9–12 September 2003; pp. 919–925. [Google Scholar]
- Gupta, P.; Kahng, A.B.; Nakagawa, S.; Shah, S.; Sharma, P. Lithography Simulation-Based Full-Chip Design Analyses. In Proceedings of the Design and Process Integration for Microelectronic Manufacturing IV, San Jose, CA, USA, 19–24 February 2006; p. 61560T. [Google Scholar]
- Yao, H.; Sinha, S.; Chiang, C.; Hong, X.; Cai, Y. Efficient Process-Hotspot Detection Using Range Pattern Matching. In Proceedings of the 2006 IEEE/ACM International Conference on Computer Aided Design, San Jose, CA, USA, 5–9 November 2006; pp. 625–632. [Google Scholar]
- Yang, F.; Sinha, S.; Chiang, C.C.; Zeng, X.; Zhou, D. Improved Tangent Space-Based Distance Metric for Lithographic Hotspot Classification. IEEE Trans. Comput. -Aided Des. Integr. Circuits Syst. 2017, 36, 1545–1556. [Google Scholar] [CrossRef]
- Nagase, N.; Suzuki, K.; Takahashi, K.; Minemura, M.; Yamauchi, S.; Okada, T. Study of Hot Spot Detection Using Neural Network Judgment. In Proceedings of the Photomask and Next-Generation Lithography Mask Technology XIV, Yokohama, Japan, 17–19 April 2007; p. 66071B. [Google Scholar]
- Ding, D.; Wu, X.; Ghosh, J.; Pan, D.Z. Machine Learning Based Lithographic Hotspot Detection with Critical-Feature Extraction and Classification. In Proceedings of the 2009 IEEE International Conference on IC Design and Technology, Austin, TX, USA, 18–20 May 2009; pp. 1–4. [Google Scholar]
- Nakamura, S.; Matsunawa, T.; Kodama, C.; Urakami, T.; Furuta, N.; Kagaya, S.; Nojima, S.; Miyamoto, S. Clean Pattern Matching for Full Chip Verification. In Proceedings of the Design for Manufacturability through Design-Process Integration VI, San Jose, CA, USA, 14 March 2012; p. 83270T. [Google Scholar]
- Yu, Y.-T.; Lin, G.-H.; Jiang, I.H.-R.; Chiang, C. Machine-Learning-Based Hotspot Detection Using Topological Classification and Critical Feature Extraction. In Proceedings of the 2013 50th ACM/EDAC/IEEE Design Automation Conference (DAC), Austin, TX, USA, 29 May–7 June 2013; pp. 1–6. [Google Scholar]
- Duo, D.; Torres, J.A.; Pan, D.Z. High Performance Lithography Hotspot Detection With Successively Refined Pattern Identifications and Machine Learning. IEEE Trans. Comput.-Aided Des. Integr. Circuits Syst. 2011, 30, 1621–1634. [Google Scholar] [CrossRef]
- Shin, M.; Lee, J.-H. Accurate Lithography Hotspot Detection Using Deep Convolutional Neural Networks. J. Micro/Nanolith. MEMS MOEMS 2016, 15, 043507. [Google Scholar] [CrossRef]
- Zhang, H.; Yang, H.; Yu, B.; Young, E.F.Y. VLSI Layout Hotspot Detection Based on Discriminative Feature Extraction. In Proceedings of the 2016 IEEE Asia Pacific Conference on Circuits and Systems (APCCAS), Jeju, Korea, 25–28 October 2016; pp. 542–545. [Google Scholar]
- Yu, B.; Gao, J.-R.; Ding, D.; Zeng, X.; Pan, D.Z. Accurate Lithography Hotspot Detection Based on Principal Component Analysis-Support Vector Machine Classifier with Hierarchical Data Clustering. J. Micro/Nanolith. MEMS MOEMS 2014, 14, 011003. [Google Scholar] [CrossRef]
- Shin, M.; Lee, J.-H. CNN Based Lithography Hotspot Detection. Int. J. Fuzzy Log. Intell. Syst. 2016, 16, 208–215. [Google Scholar] [CrossRef] [Green Version]
- Yang, H.; Lin, Y.; Yu, B.; Young, E.F.Y. Lithography Hotspot Detection: From Shallow to Deep Learning. In Proceedings of the 2017 30th IEEE International System-on-Chip Conference (SOCC), Munich, Germany, 5–8 September 2017; pp. 233–238. [Google Scholar]
- Matsunawa, T.; Nojima, S.; Kotani, T. Automatic Layout Feature Extraction for Lithography Hotspot Detection Based on Deep Neural Network. In Proceedings of the Design-Process-Technology Co-optimization for Manufacturability X, San Jose, CA, USA, 16 March 2016; p. 97810H. [Google Scholar]
- Zhuang, F.; Qi, Z.; Duan, K.; Xi, D.; Zhu, Y.; Zhu, H.; Xiong, H.; He, Q. A Comprehensive Survey on Transfer Learning. Proc. IEEE 2021, 109, 43–76. [Google Scholar] [CrossRef]
- Pesciullesi, G.; Schwaller, P.; Laino, T.; Reymond, J.L. Transfer Learning Enables The Molecular Transformer To Predict Regio- and Stereoselective Reactions on Carbohydrates. Nat. Commun. 2020, 11, 4874. [Google Scholar] [CrossRef] [PubMed]
- Liu, E.; Yu, Z.; Wan, Z.; Shu, L.; Sun, K.; Gui, L.; Xu, K. Linearized Wideband and Multi-Carrier Link Based on TL-ANN. Chin. Opt. Lett. 2021, 19, 113901. [Google Scholar] [CrossRef]
- Xiao, Y.; Huang, X. Learning Lithography Hotspot Detection from ImageNet. In Proceedings of the 2019 14th IEEE International Conference on Electronic Measurement & Instruments, Changsha, China, 1–3 November 2019; pp. 266–273. [Google Scholar]
- Zhou, K.; Zhang, K.; Liu, J.; Liu, Y.; Liu, S.; Cao, G.; Zhu, J. An Imbalance Aware Lithography Hotspot Detection Method Based on HDAM and Pre-trained GoogLeNet. Meas. Sci. Technol. 2021, 32, 125008. [Google Scholar] [CrossRef]
- Zhou, Z.-H. Linear Models. In Maching Learning, 1st ed.; Springer: Singapore, 2021; pp. 32–36. [Google Scholar]
- Simonyan, K.; Zisserman, A. Very Deep Convolutional Networks for Large-Scale Image Recognition. In Proceedings of the 3rd International Conference on Learning Representations, San Diego, CA, USA, 7–9 May 2015; pp. 1–14. [Google Scholar]
- Russakovsky, O.; Deng, J.; Su, H.; Krause, J.; Satheesh, S.; Ma, S.; Huang, Z.; Karpathy, A.; Khosla, A.; Bernstein, M.; et al. ImageNet Large Scale Visual Recognition Challenge. Int. J. Comput.Vis. 2015, 115, 211–252. [Google Scholar] [CrossRef] [Green Version]
- Torres, J.A. ICCAD-2012 CAD Contest in Fuzzy Pattern Matching for Physical Verification and Benchmark Suite. In Proceedings of the 2012 IEEE/ACM International Conference on Computer-Aided Design (ICCAD), San Jose, CA, USA, 5–8 November 2012; pp. 349–350. [Google Scholar]
- Yang, H.; Luo, L.; Su, J.; Lin, C.; Yu, B. Imbalance Aware Lithography Hotspot Detection: A Deep Learning Approach. J. Micro/Nanolith. MEMS MOEMS 2017, 16, 033504. [Google Scholar] [CrossRef]
- Zhou, Z.-H. Model Selection and Evaluation. In Maching Learning, 1st ed.; Springer: Singapore, 2021; pp. 71–72. [Google Scholar]


| Benchmarks | Training Data | Testing Data | ||
|---|---|---|---|---|
| Hotspots | Non-Hotspots | Hotspots | Non-Hotspots | |
| Benchmark 1 (B1) | 99 | 340 | 224 | 319 |
| Benchmark 2 (B2) | 174 | 498 | 498 | 4146 |
| Benchmark 3 (B3) | 909 | 1808 | 1808 | 3541 |
| Benchmark 4 (B4) | 95 | 4452 | 177 | 3386 |
| Benchmark 5 (B5) | 26 | 2716 | 41 | 2111 |
| Benchmarks | Methods | Accuracy | Recall | Precision | F1 Score |
|---|---|---|---|---|---|
| Benchmark 1 | Ref. [16] | - | 0.951 | 0.358 | 0.520 |
| Ref. [26] | - | 0.995 | 0.324 | 0.489 | |
| The proposed method | 0.961 | 0.938 | 0.968 | 0.952 | |
| Benchmark 2 | Ref. [16] | - | 0.988 | 0.216 | 0.354 |
| Ref. [26] | - | 0.986 | 0.702 | 0.820 | |
| The proposed method | 0.979 | 0.988 | 0.843 | 0.901 | |
| Benchmark 3 | Ref. [16] | - | 0.975 | 0.199 | 0.331 |
| Ref. [26] | - | 0.982 | 0.443 | 0.640 | |
| The proposed method | 0.984 | 0.988 | 0.966 | 0.977 | |
| Benchmark 4 | Ref. [16] | - | 0.938 | 0.157 | 0.269 |
| Ref. [26] | - | 0.972 | 0.355 | 0.520 | |
| The proposed method | 0.992 | 0.932 | 0.918 | 0.925 | |
| Benchmark 5 | Ref. [16] | - | 0.927 | 0.181 | 0.303 |
| Ref. [26] | - | 0.980 | 0.549 | 0.635 | |
| The proposed method | 0.993 | 1.000 | 0.724 | 0.840 | |
| Average | Ref. [16] | - | 0.955 | 0.222 | 0.355 |
| Ref. [26] | - | 0.983 | 0.475 | 0.635 | |
| Ref. [25] | - | 0.980 | 0.300 | 0.458 | |
| The proposed method | 0.982 | 0.970 | 0.884 | 0.919 |
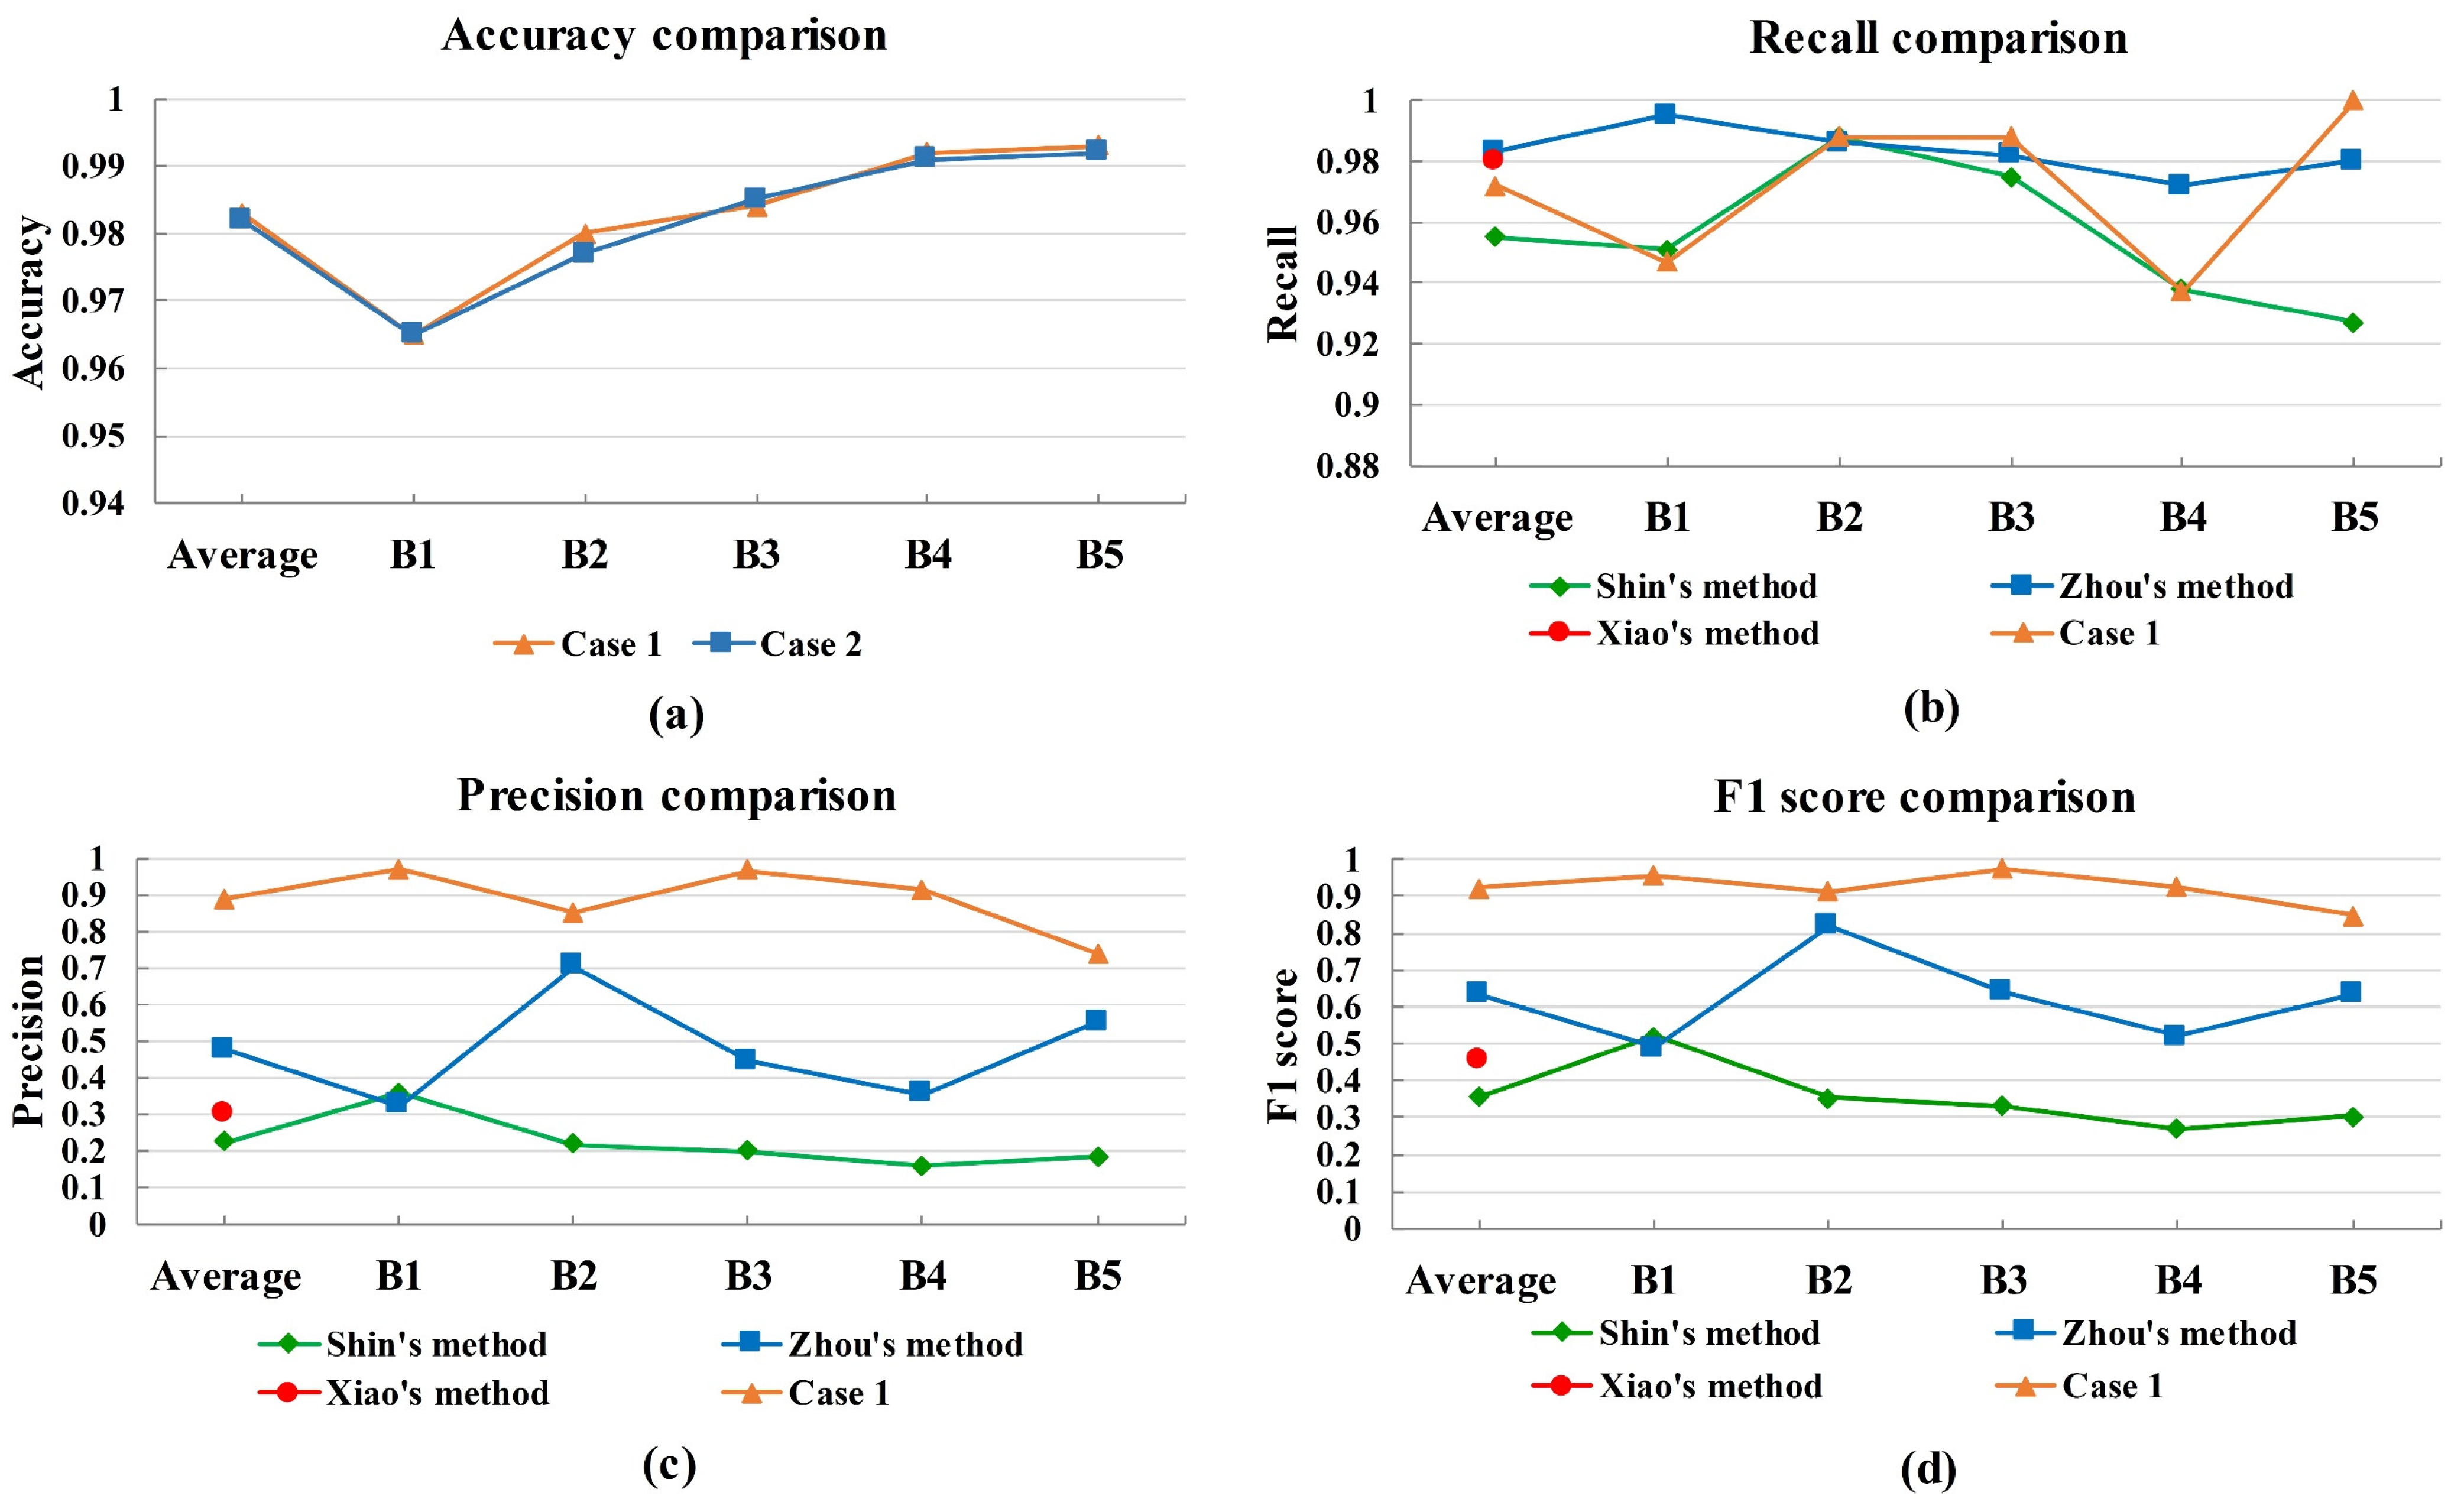
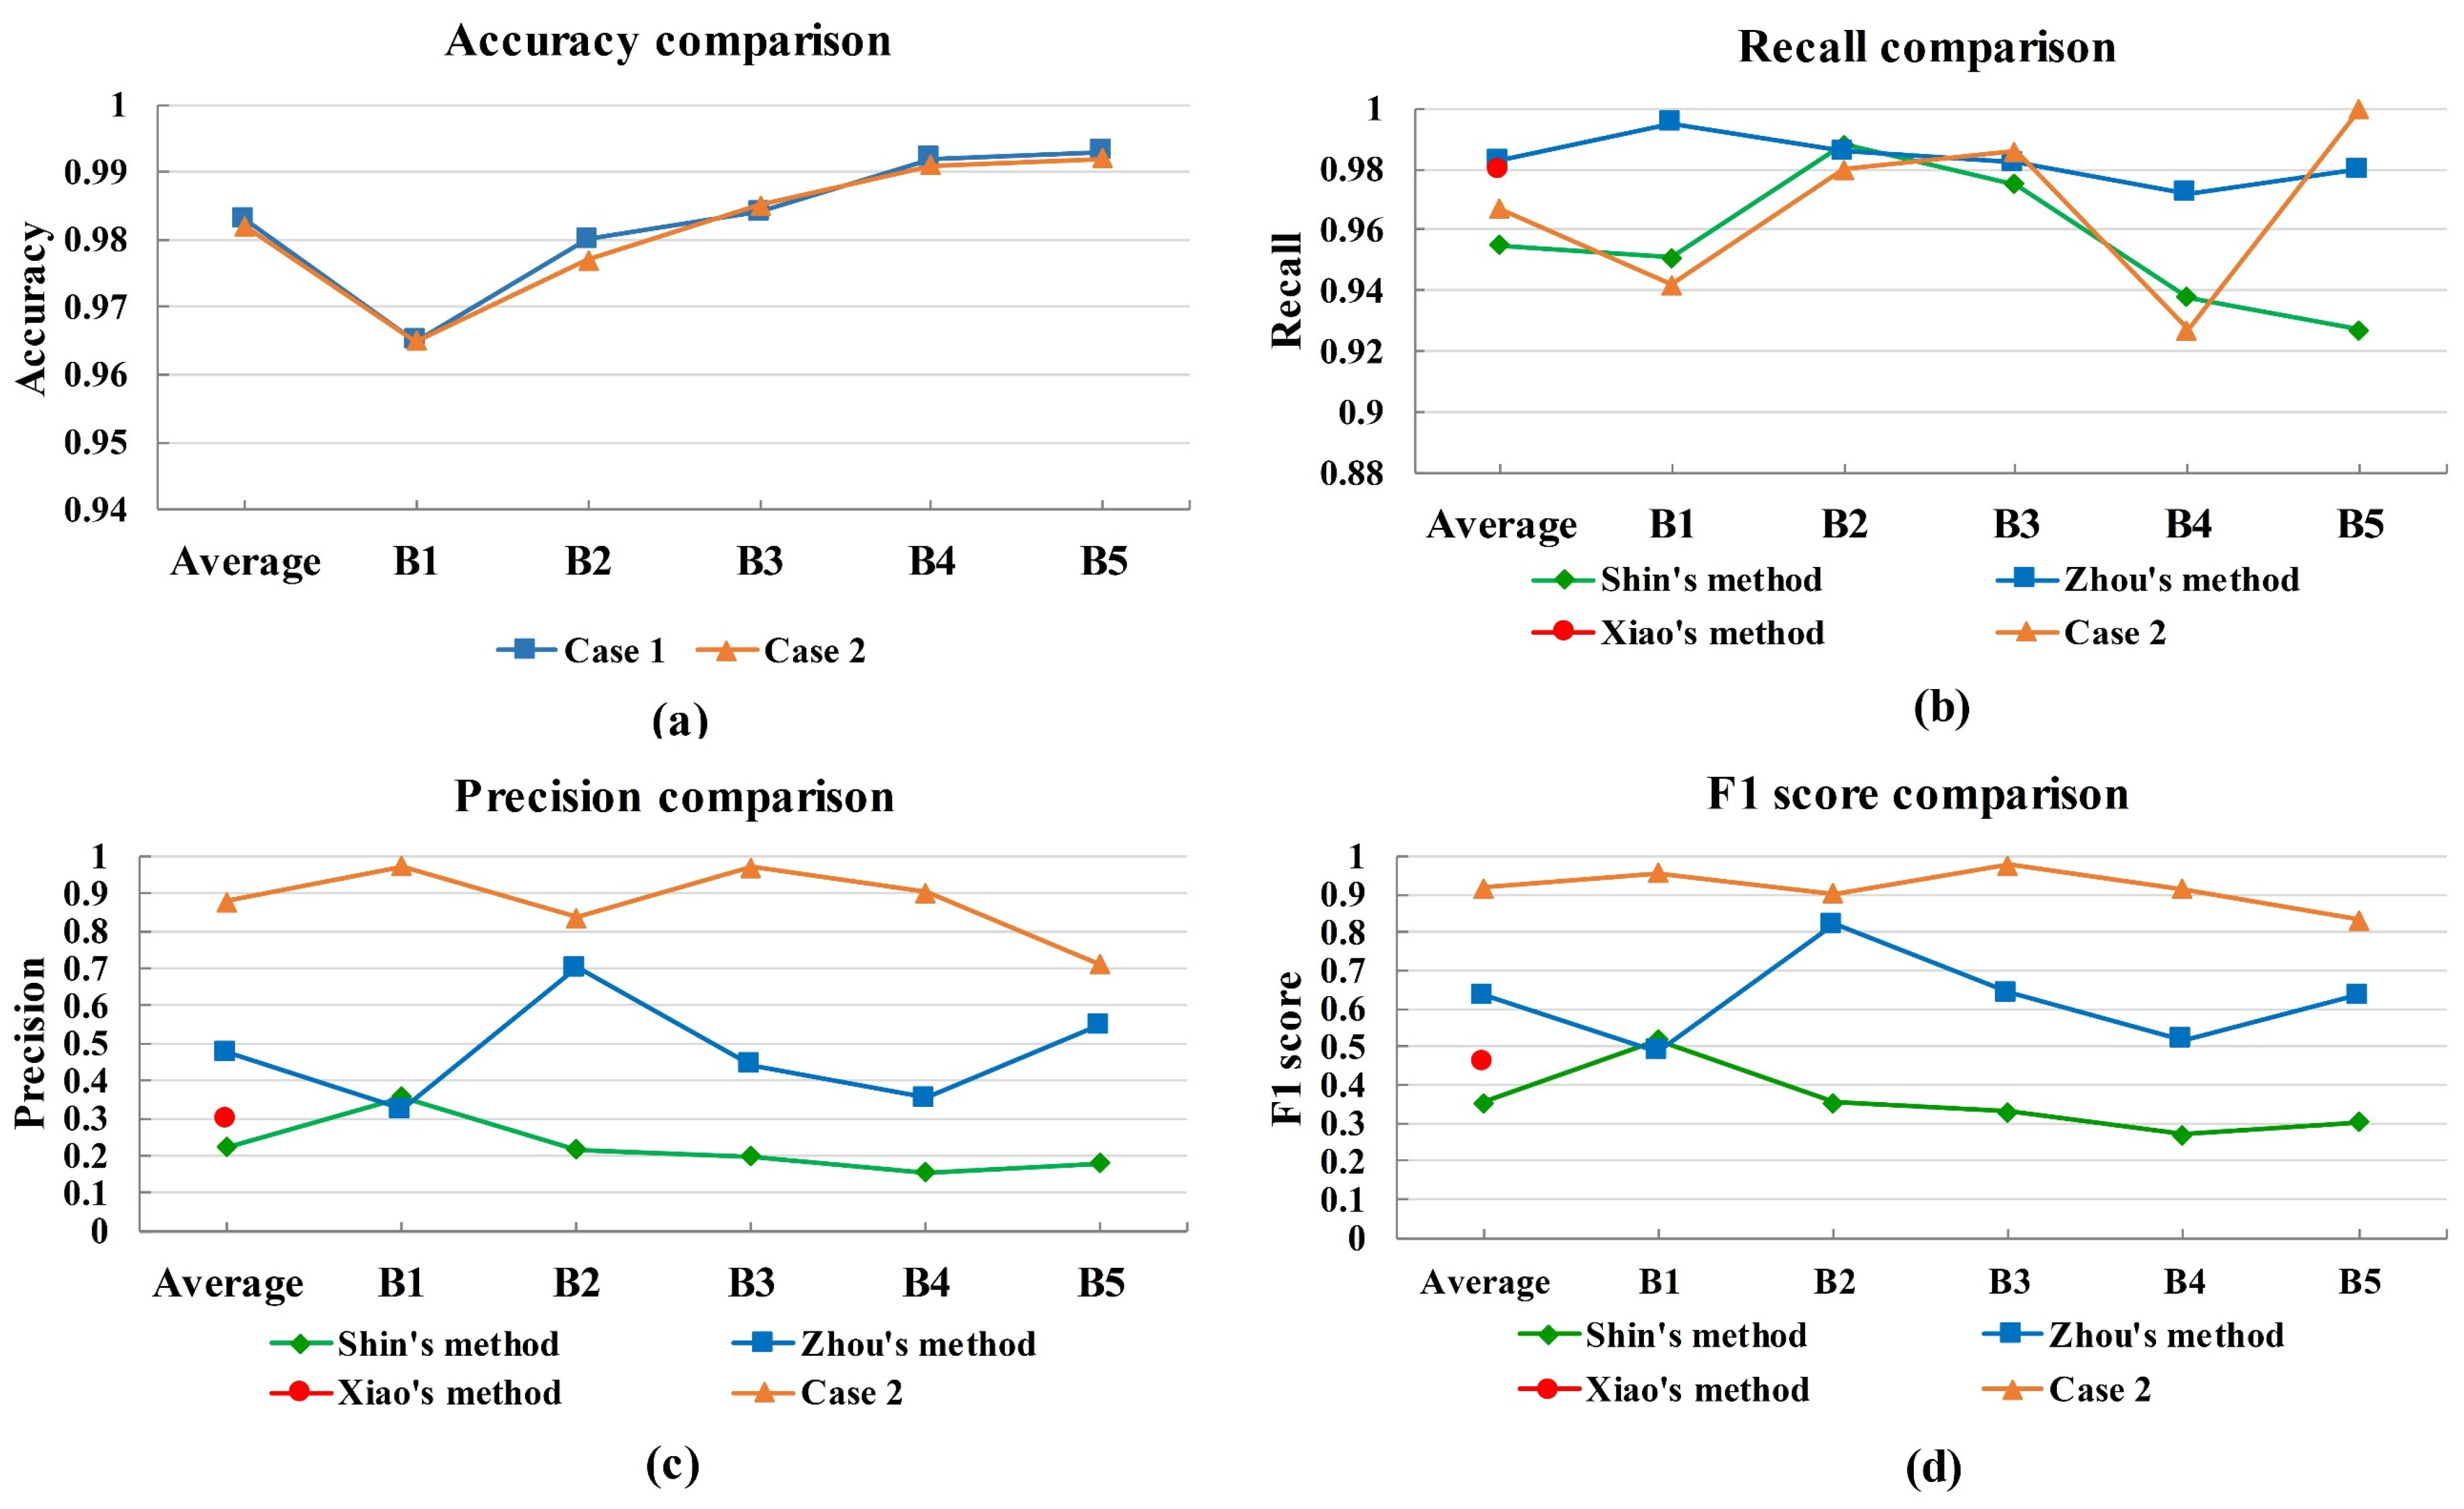
| Benchmarks | Methods | Accuracy | Recall | Precision | F1 Score |
|---|---|---|---|---|---|
| Benchmark 1 | Ref. [16] | - | 0.951 | 0.358 | 0.520 |
| Ref. [26] | - | 0.995 | 0.324 | 0.489 | |
| Case 1 | 0.965 | 0.947 | 0.968 | 0.957 | |
| Case 2 | 0.965 | 0.942 | 0.973 | 0.957 | |
| Benchmark 2 | Ref. [16] | - | 0.988 | 0.216 | 0.354 |
| Ref. [26] | - | 0.986 | 0.702 | 0.820 | |
| Case 1 | 0.980 | 0.988 | 0.850 | 0.914 | |
| Case 2 | 0.977 | 0.980 | 0.837 | 0.903 | |
| Benchmark 3 | Ref. [16] | - | 0.975 | 0.199 | 0.331 |
| Ref. [26] | - | 0.982 | 0.443 | 0.640 | |
| Case 1 | 0.984 | 0.988 | 0.967 | 0.977 | |
| Case 2 | 0.985 | 0.986 | 0.969 | 0.978 | |
| Benchmark 4 | Ref. [16] | - | 0.938 | 0.157 | 0.269 |
| Ref. [26] | - | 0.972 | 0.355 | 0.520 | |
| Case 1 | 0.992 | 0.937 | 0.913 | 0.925 | |
| Case 2 | 0.991 | 0.927 | 0.903 | 0.915 | |
| Benchmark 5 | Ref. [16] | - | 0.927 | 0.181 | 0.303 |
| Ref. [26] | - | 0.980 | 0.549 | 0.635 | |
| Case 1 | 0.993 | 1.000 | 0.737 | 0.848 | |
| Case 2 | 0.992 | 1.000 | 0.712 | 0.832 | |
| Average | Ref. [16] | - | 0.955 | 0.222 | 0.355 |
| Ref. [26] | - | 0.983 | 0.475 | 0.635 | |
| Ref. [25] | - | 0.980 | 0.300 | 0.458 | |
| Case 1 | 0.983 | 0.972 | 0.887 | 0.924 | |
| Case 2 | 0.982 | 0.967 | 0.879 | 0.917 |
Publisher’s Note: MDPI stays neutral with regard to jurisdictional claims in published maps and institutional affiliations. |
© 2022 by the authors. Licensee MDPI, Basel, Switzerland. This article is an open access article distributed under the terms and conditions of the Creative Commons Attribution (CC BY) license (https://creativecommons.org/licenses/by/4.0/).
Share and Cite
Liao, L.; Li, S.; Che, Y.; Shi, W.; Wang, X. Lithography Hotspot Detection Method Based on Transfer Learning Using Pre-Trained Deep Convolutional Neural Network. Appl. Sci. 2022, 12, 2192. https://doi.org/10.3390/app12042192
Liao L, Li S, Che Y, Shi W, Wang X. Lithography Hotspot Detection Method Based on Transfer Learning Using Pre-Trained Deep Convolutional Neural Network. Applied Sciences. 2022; 12(4):2192. https://doi.org/10.3390/app12042192
Chicago/Turabian StyleLiao, Lufeng, Sikun Li, Yongqiang Che, Weijie Shi, and Xiangzhao Wang. 2022. "Lithography Hotspot Detection Method Based on Transfer Learning Using Pre-Trained Deep Convolutional Neural Network" Applied Sciences 12, no. 4: 2192. https://doi.org/10.3390/app12042192
APA StyleLiao, L., Li, S., Che, Y., Shi, W., & Wang, X. (2022). Lithography Hotspot Detection Method Based on Transfer Learning Using Pre-Trained Deep Convolutional Neural Network. Applied Sciences, 12(4), 2192. https://doi.org/10.3390/app12042192