Article

The Effect of Clamping Force on the Wear Behavior of a Steam Generator Tube

1
Institute of Process Equipment and Control Engineering, College of Mechanical Engineering, Zhejiang University of Technology, Hangzhou 310023, China
2
Engineering Research Center of Process Equipment and Remanufacturing, Ministry of Education, Hangzhou 310023, China
3
Shanghai Nuclear Engineering Research & Design Institute Co., Ltd., Shanghai 200233, China
*
Author to whom correspondence should be addressed.
Appl. Sci. 2022, 12(4), 2163; https://doi.org/10.3390/app12042163
Submission received: 20 January 2022 / Revised: 9 February 2022 / Accepted: 14 February 2022 / Published: 18 February 2022

Abstract

:
Anti-vibration bars (AVBs) are essential components of a steam generator (SG) and are used to prevent steam generator tubes (SGTs) from vibrating intensely because of flow-induced vibration. However, the contact force generated at contact surfaces between AVBs and tubes can change the natural frequency and wear behavior of the tube. Contact force is represented by clamping force in this study. Considering the effect of the clamping force on the natural frequency and sliding distance of SGT, dynamic wear behavior under different clamping forces was analyzed based on the finite element method, and the natural frequency of the tube was measured in the present work. Moreover, the wear experiment was conducted at room temperature to verify the conclusions of dynamic behavior analysis. The increase in clamping force reduces the sliding distance of SGT, and wear depth affected by both clamping force and sliding distance also decreases.

1. Introduction

A steam generator (SG) is significant equipment in a pressurized water reactor nuclear power plant through which the heat generated by the nuclear reactor in the primary circuit is transferred to the secondary circuit. Steam generator tubes (SGTs) are the contact surface between the primary circuit medium and the secondary circuit medium, which requires high operational reliability. Once the SGT is damaged, it will cause the radioactive material in the primary circuit to overflow, posing a significant threat to the safety of the surrounding environment [1,2].
Affected by flow-induced vibration, SGTs will impact and rub against anti-vibration bars (AVBs) in the U-bend region [3]. Once the wear depth of the SGT reaches the limit value, the tube has to be plugged [4,5,6]. Many outages of nuclear power plant units caused by severe wear between AVBs and SGTs have been reported. Therefore, the influence of the AVB on wear behavior has attracted many researchers’ attention.
Clearances between AVBs and SGTs are designed below 0.1mm [7]. However, the uncertainty of clearances due to insufficient manufacturing processes and unforeseen operating conditions will affect the wear behavior of the SGT. For example, the contact force or an unexpected large clearance between the AVB and the SGT will be generated [8].
The clearance that exceeds a certain limit will cause the tube support to fail. A lot of research has been carried out on the effect of clearance on wear behavior. Lalonde et al. [9] studied different modes of the SGT under different clearances between a tube and an AVB. Nowlan et al. [10] used a straight tube to represent a u-shaped tube with the largest radius, studying the dynamic characteristics of a double-span tube by setting different parameters such as clearance and preload.
Many scholars have carried out fretting wear experiments and finite element analysis to study the effect of contact force [11,12,13,14,15,16]. Contact force is one of the most significant factors affecting the wear behavior of the SGT and can change the structural rigidity of the tube [17,18].
Contact force will change the sliding distance, and it is difficult to accurately illustrate the wear law with only a single variable. In this paper, contact force is represented by clamping force. The effect of clamping force on wear is measured by friction energy, which is affected by clamping force and sliding distance.
Wear experiments are carried out in this study, combined with tube motion based on finite element analysis, to study the dynamic wear behavior of the tube under different clamping forces. Long tube specimens of 4 m length are used in this work. In addition, the natural frequency of the tube is presented.

2. Experiment

2.1. Experimental Setup

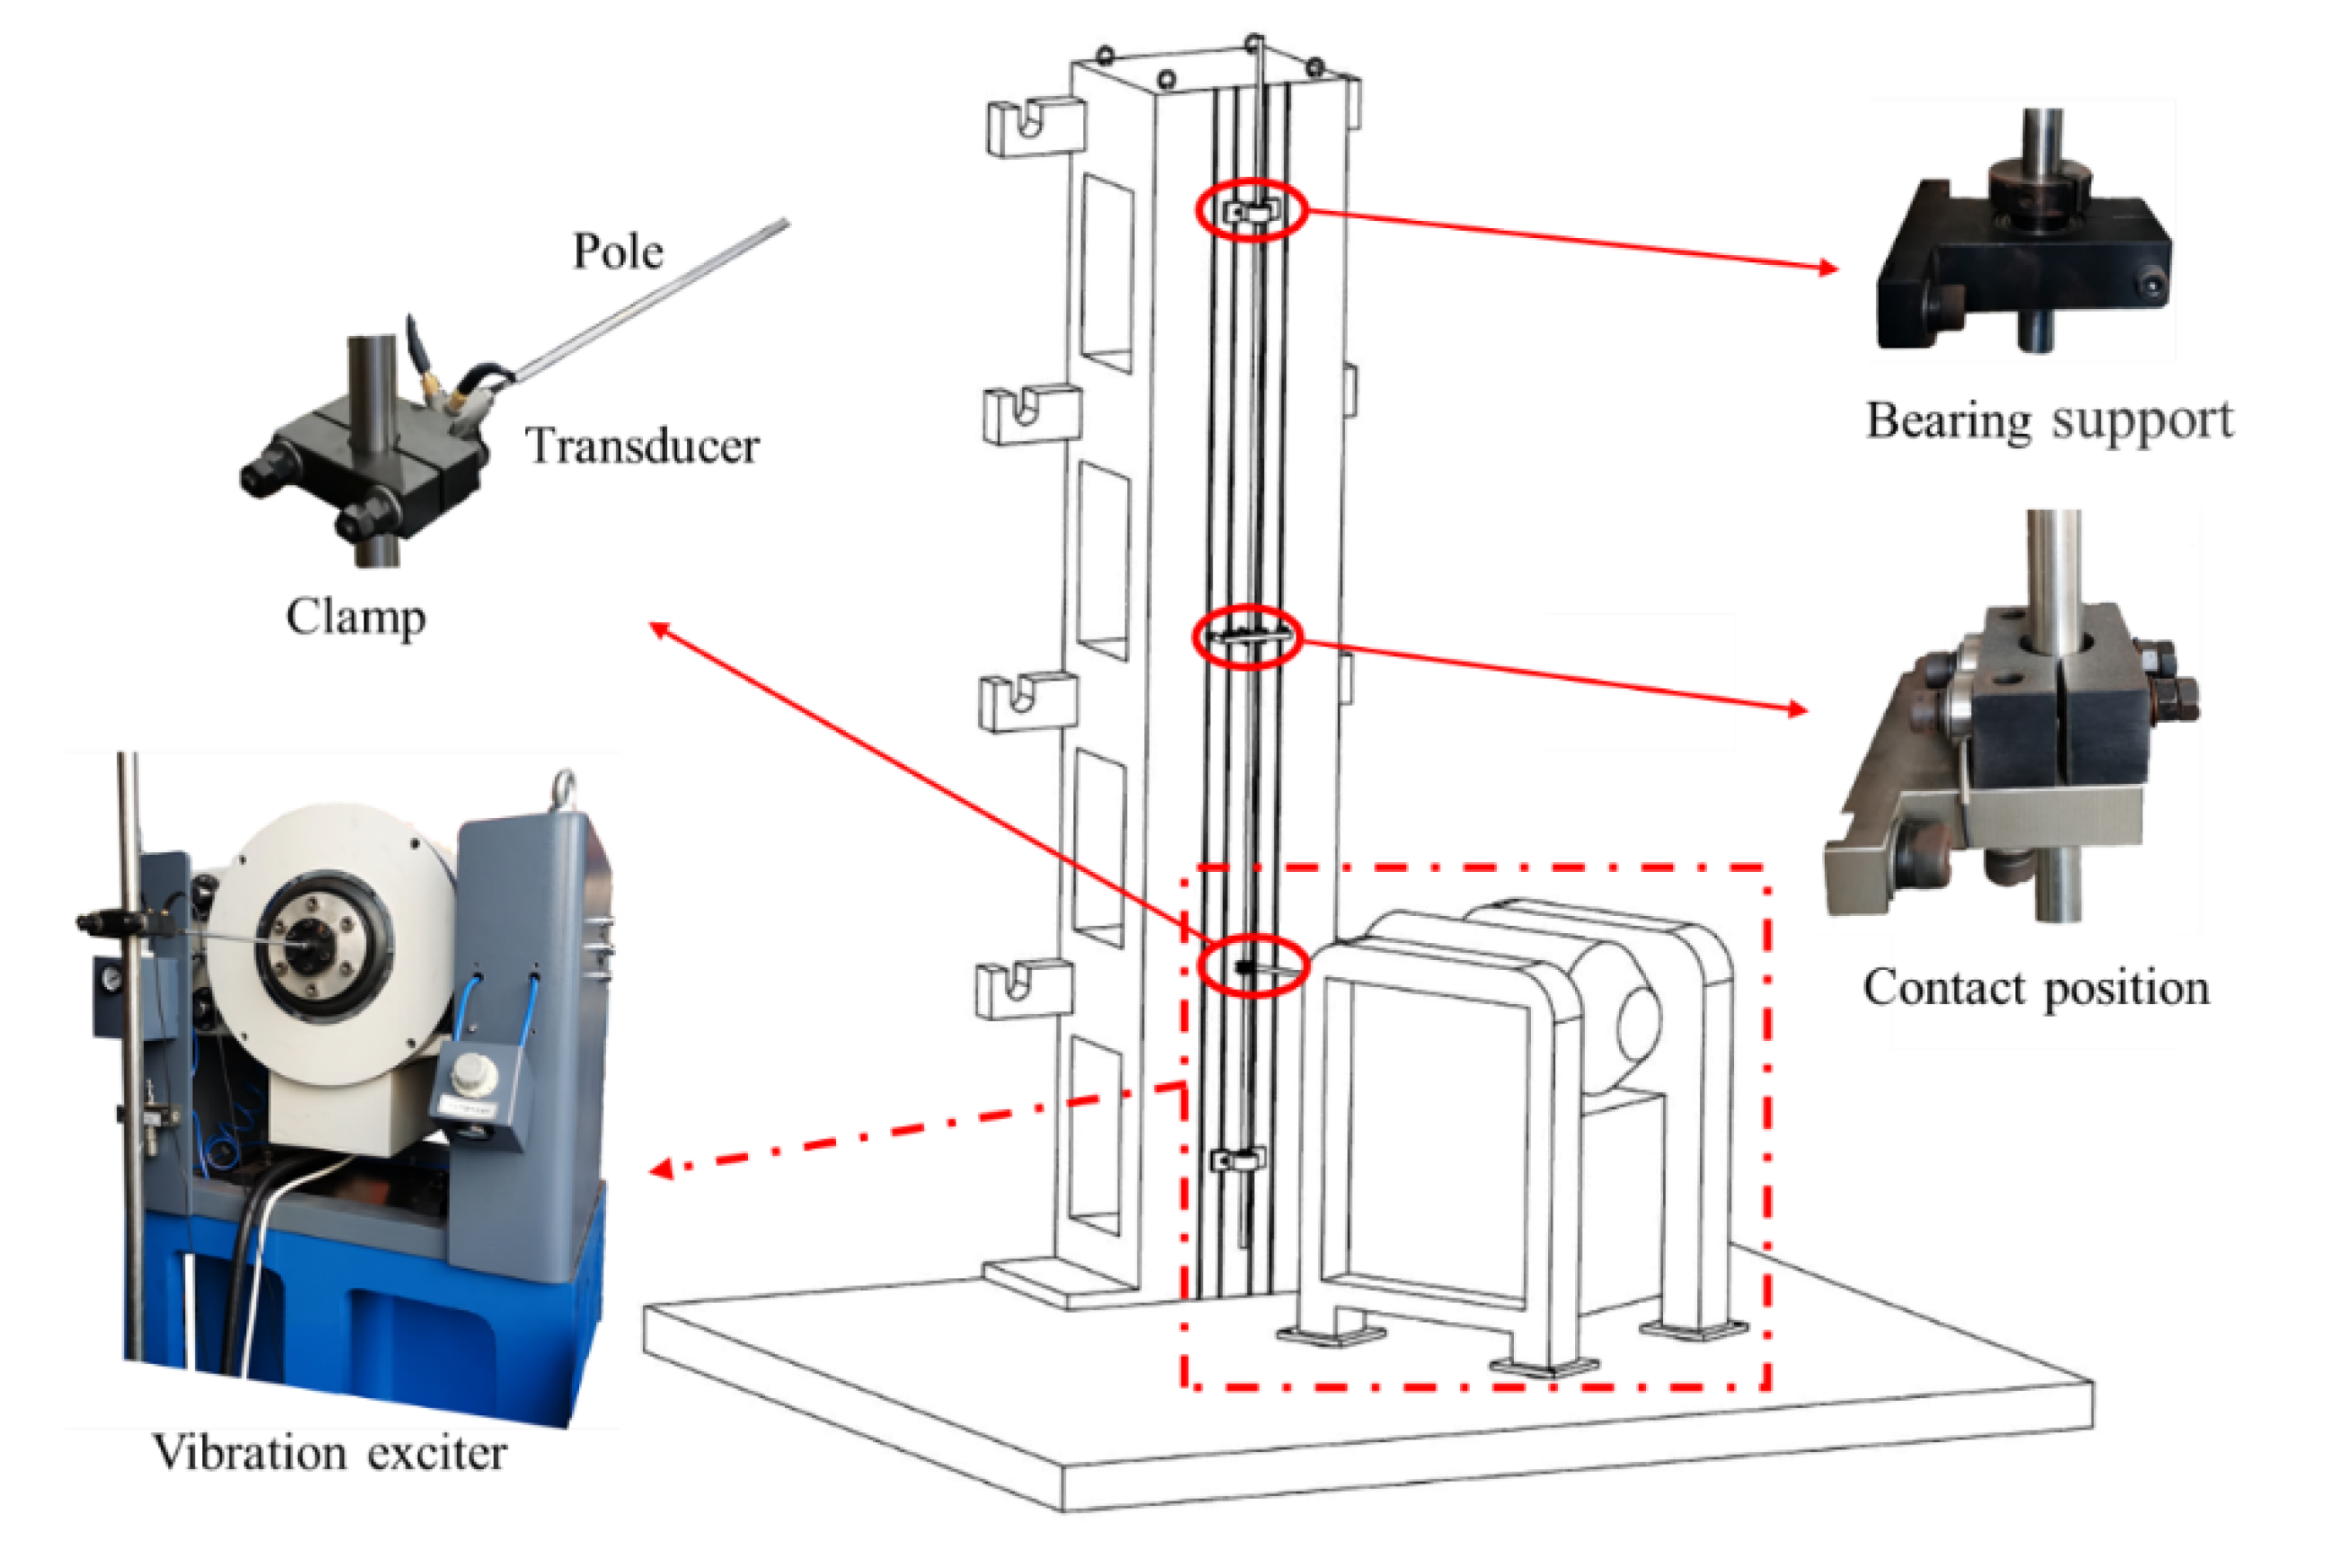
A straight tube is used instead of a U-tube to simplify the experimental device, for which the material used is chosen as Inconel 690 alloy. The experimental setup is shown in Figure 1. It consists of a mounting platform for installing the tube, a vibration exciter for outputting the excitation force, a controller for controlling the output of the excitation force, an anti-vibration bar assembly, transducers, and some fixed parts.
It is necessary to increase the natural frequency of the whole system to ensure that the resonance frequency of the entire system can avoid operating frequency during the experiment. It is not easy to increase the natural frequency significantly if only the structure of the mounting platform is optimized. Therefore, we fix the mounting platform on the shear wall with bolts, which dramatically improves the rigidity and natural frequency of the entire system.
The ES-1-150 vibration exciter manufactured by Dongling Vibration Company (Suzhou, China) is adopted in the experiment, with an excitation frequency range from 5 to 4500 Hz and an excitation force range from 0 to 1kN. The vibration exciter placed on the base is fixed to the ground with anchor bolts to ensure that its position does not change and that the excitation force does not deviate during the excitation process.
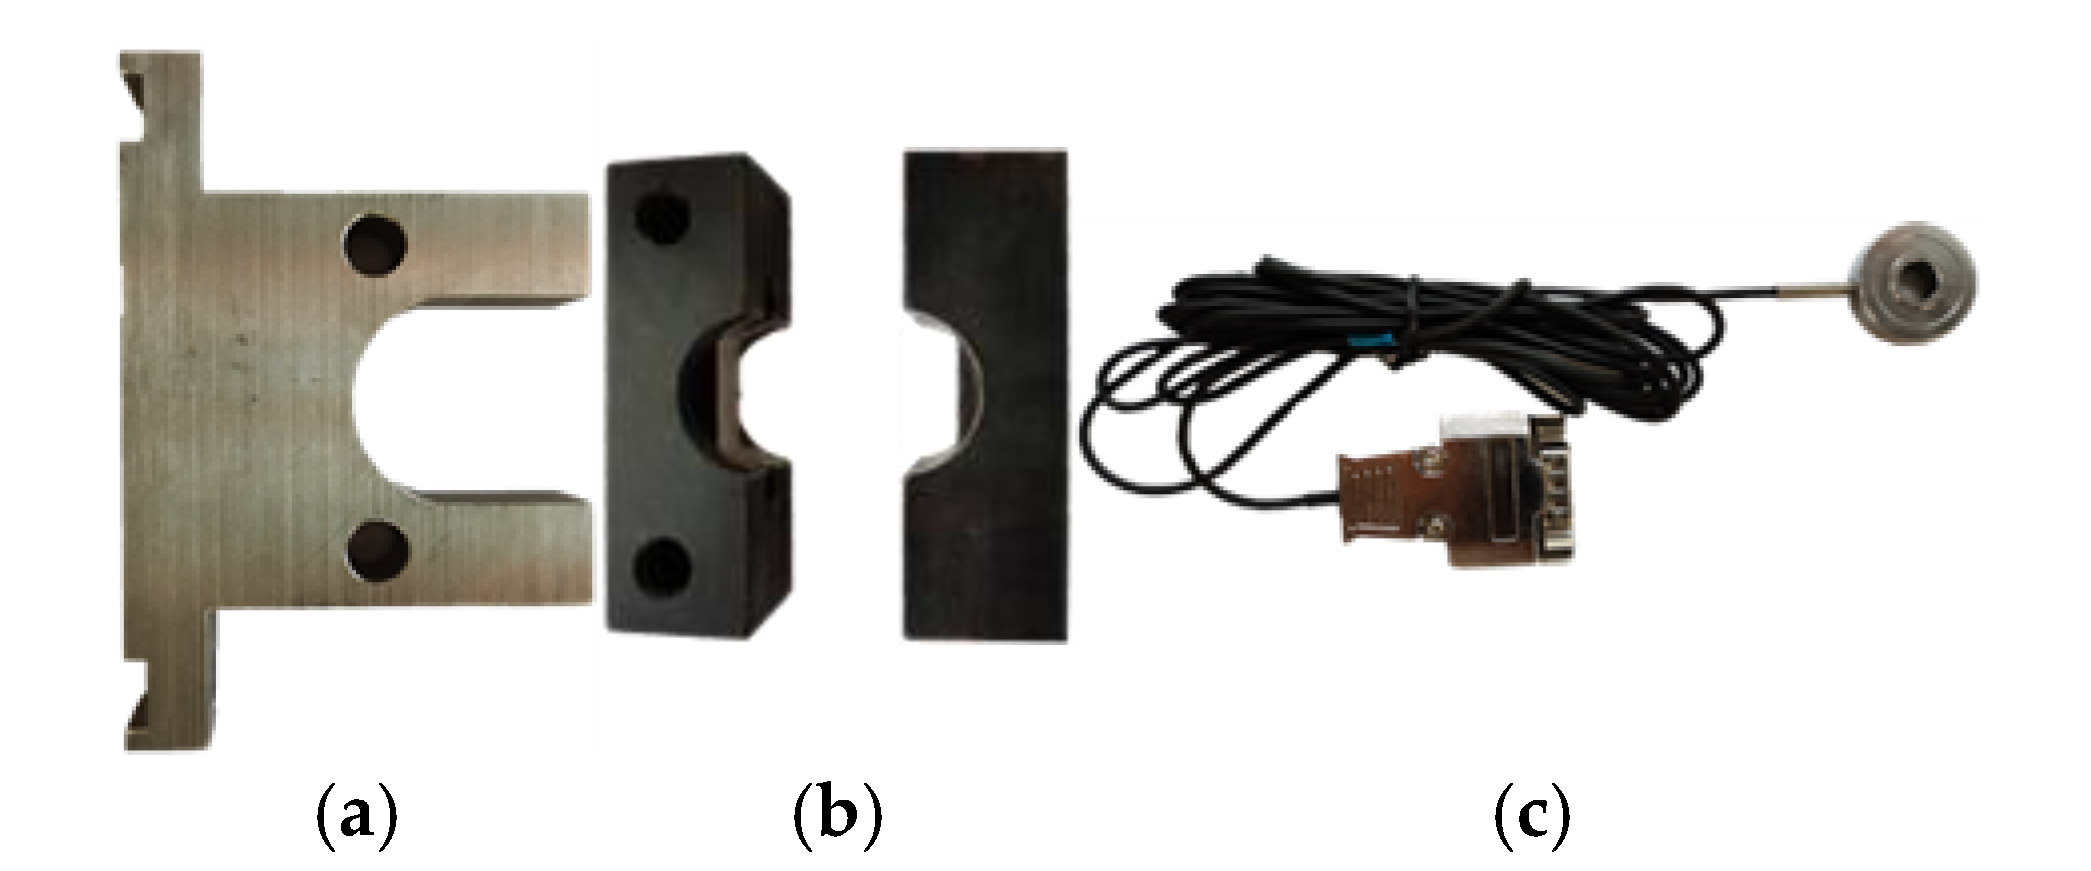
A straight tube of 4 m length, 17.48 mm outer diameter, and 1.01 mm thickness is firmly fixed on the bearing seat at both ends of the mounting platform, perpendicular to the ground. The bearing seats can slide up and down along the sliding groove of the mounting platform. The distance between bearing seats at both ends is adjusted to 3000 mm in the experiment. The anti-vibration bar assembly is divided into a bar base and two AVBs. The bar base is fixed at the midpoint of the upper and lower bearing seats by moving along the groove. The bolts through two AVBs are tightened to clamp the tube.
At a distance of 1035 mm from the lower end of the bearing seat, the excitation force output by the vibration exciter is transmitted to the tube through a pole. The axial direction of the pole and the normal direction of AVB are at an angle of 45°. Therefore, the vibration exciter gives the tube a force excitation in the direction of 45°.
The force transducer and acceleration transducer are located at the top of the pole, which measures the excitation force and the acceleration of the tube, respectively. The clamping force is measured by another force transducer mounted on the AVB.

2.2. Experimental Procedure

Above all, after the experimental device was assembled, natural frequencies of the single-span tube and of the double-span tube were measured, respectively. “Double-span” means that an anti-vibration bar is installed in the middle of the tube.
When performing frequency measurement, two acceleration transducers needed to be symmetrically attached to 1/3 length of the tube; their sensitivities are 10.01 mV/s2 and 10.05 mV/s2, respectively. Excited by the force hammer, the tube was forced to vibrate. The response signal of the tube detected by the acceleration transducer was transmitted to the dynamic signal test and analysis system (DH5922D, Donghua Test Corp., Taizhou, China). Using the Fourier transform method, we obtained the natural frequency of the tube in different orders. The hammer struck the tube three times in each measurement, and the value of the natural frequency was acquired in each strike. The average of these three values was used as the final measurement result. In this way, the excitation frequency applied in the subsequent wear experiment and dynamic behavior analysis could be determined.
After the frequencies of the tube were measured, wear experiments were carried out using the experimental device shown in Figure 1. The value of the clamping force was displayed on the digital readout instrument in real time, with bolts on the AVB tightened to give the tube clamping force. The anti-vibration bar assembly is shown in Figure 2. Then, the relevant parameters of the vibration exciter, such as excitation frequency, excitation force, and cycles, were set in PC.
The method of generating excitation force in the experiment is similar to that of Wen Zhang [19]; a flowchart of the control system is shown in Figure 3. The sine wave signal, generated by a controller (IM1608, Zhongpu Technology Corp., Hangzhou, China) and amplified by the power amplifier (DA-1020-65, Dongling Vibration Corp., Suzhou, China), drove the vibration exciter (ES-1-150, Dongling Vibration Corp., Suzhou, China) to excite the tube. Vibration singles sensed by the acceleration transducer and force transducer (504AF02, YMC Piezotronics Corp., Yangzhou, China), concluding the acceleration and excitation force, were sent back to the controller. In this way, a closed-loop control was obtained.
Wear experiments were grouped by different clamping forces. After the previous experiment was completed, the tube was moved 30 mm along the axis direction to ensure that the wear scars of the latter would not be damaged. Then subsequent experiments were carried out in the same procedure until all the experiments were completed.
After the experiments, the tube was removed from the device. The unworn area at both ends was cut off by a cutting machine, leaving a margin of about 15 cm to ensure that the cutting did not damage the wear scar. Finally, the wear depth of the wear scar was measured by a laser scanning confocal microscope (LSCM).

3. Finite Element Modeling

The SOLID185 element was used to model the steam generator tube in ANSYS software based on the experimental conditions. In addition, a rigid surface was used to simplify the structure of the AVB, and the contact relationship between the simplified AVB and the tube was established. Clamped supported boundary constraints are applied on both ends of the tube model.
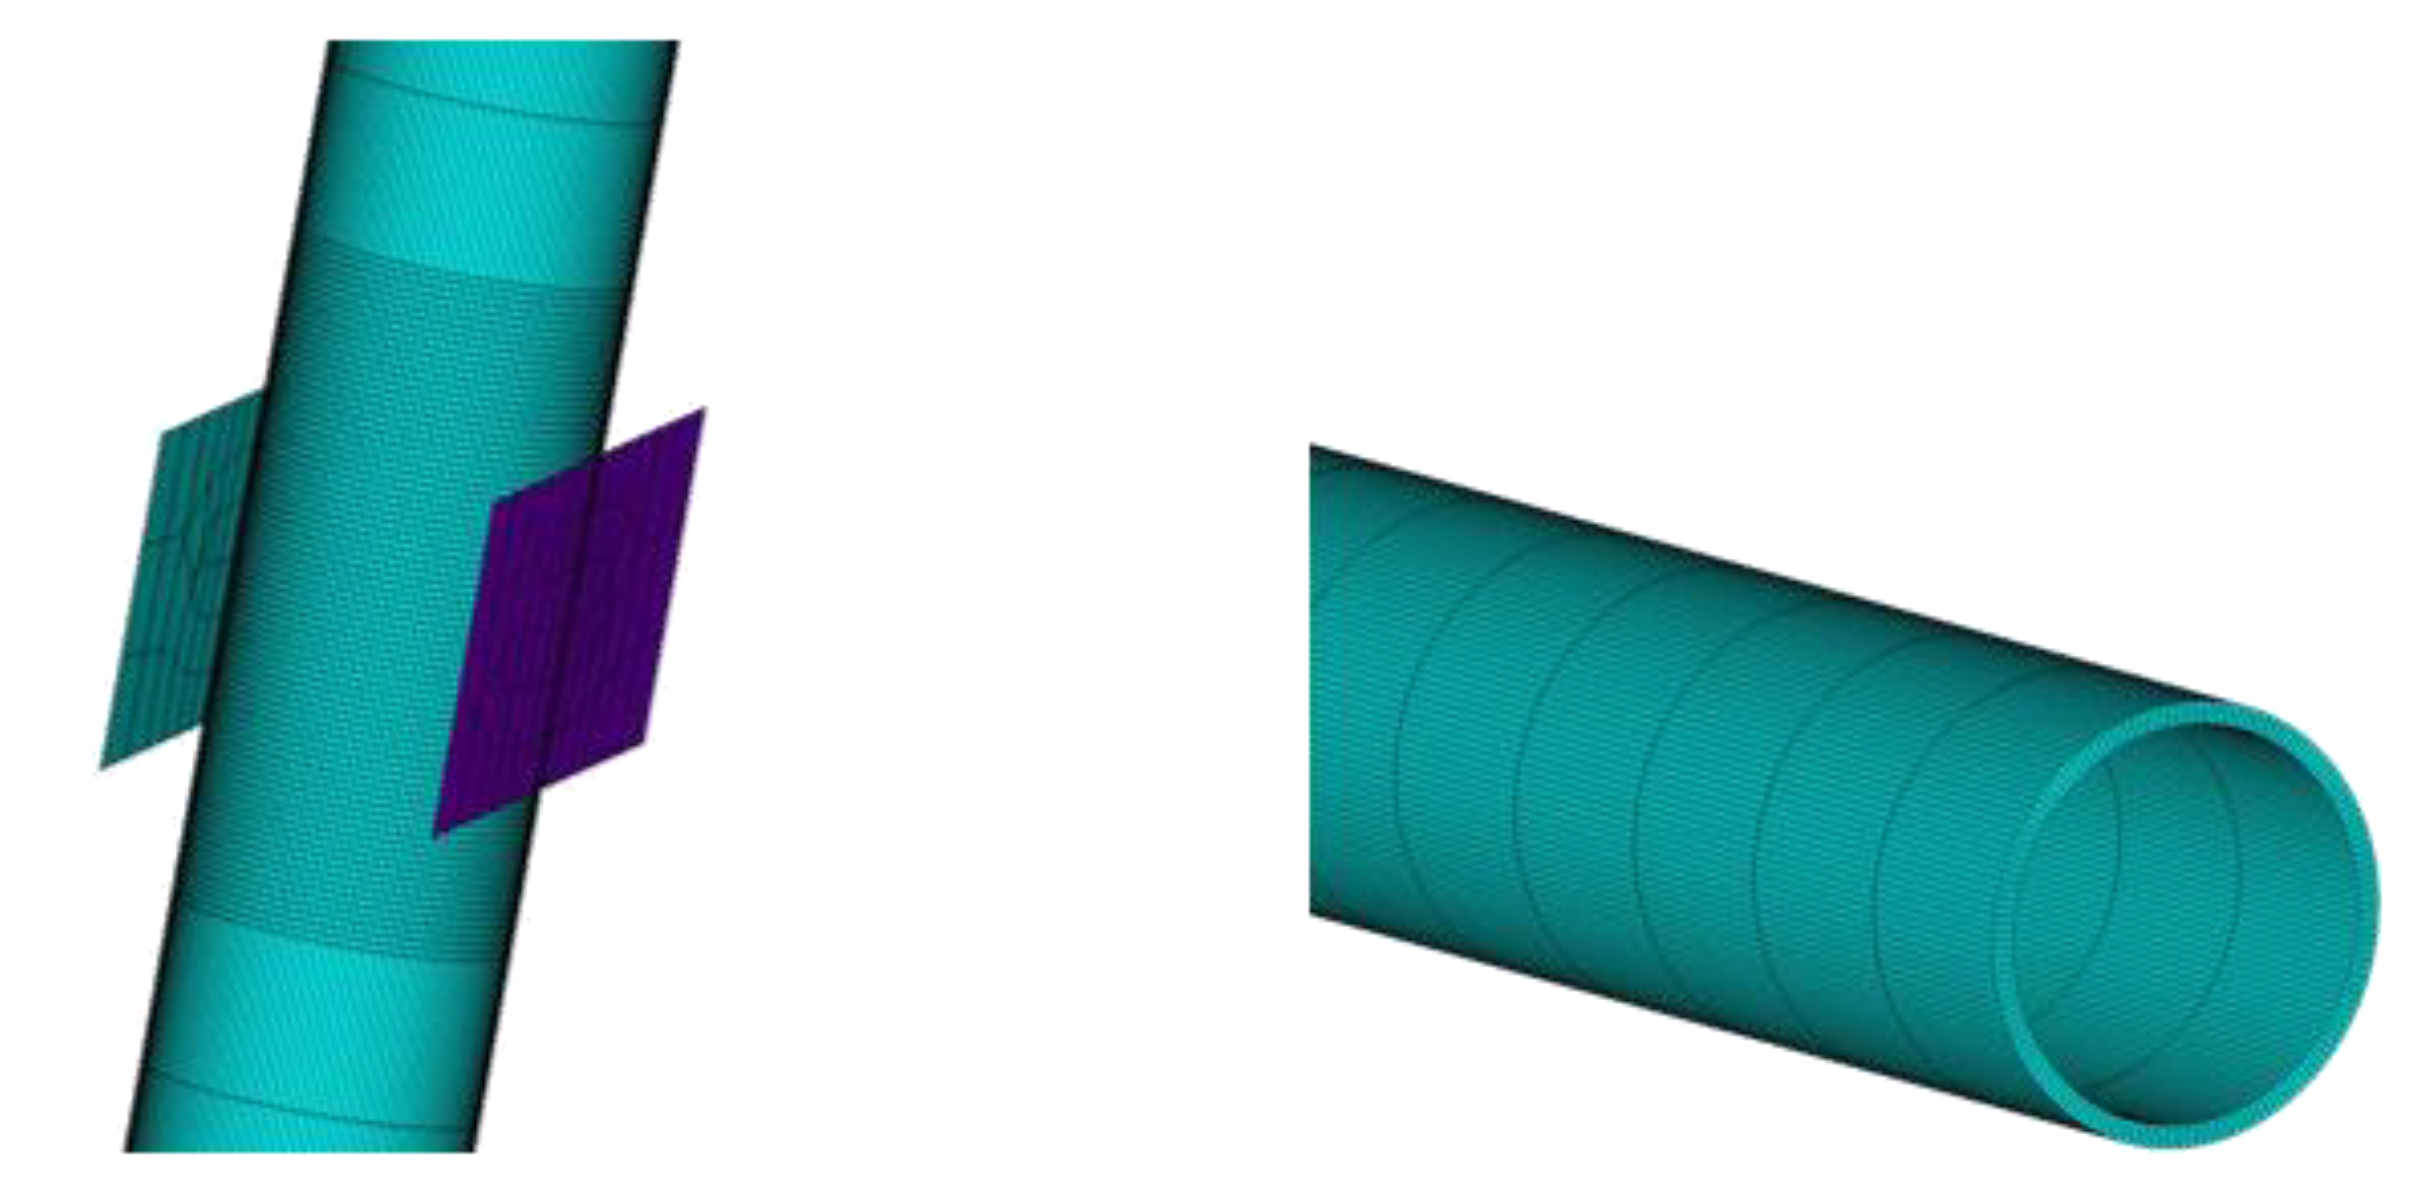
Meshes of the contact position and excitation position of the tube model were encrypted, as shown in Figure 4. The excitation force measured by a force transducer at the top of the pole includes the force that makes the tube and clamp vibrate. Hence, we insert a mass point in the center of the excitation surface. Further, clamp mass is assigned to the mass point, and all the displacement relationships of nodes in the excitation surface are coupled to this point. There were 308,163 nodes and 258,691 elements in the finite element model. The geometric parameters and material properties of the tube model are shown in Table 1.
The excitation frequency we set in ANSYS should avoid the natural frequency of the double-span tube measured in the experiments (see Section 4.1 for details). The excitation frequency selected in this paper was 300 Hz. Based on the model shown in Figure 4, a sinusoidal force with an amplitude of 200 N was applied to the coupling point. Taking into account the time and disk capacity consumed by nonlinear transient analysis, the number of excitation cycles was controlled to 45, and the step of each cycle was set to 20 steps, for a total of 900 time-steps.

4. Results and Discussion

4.1. Natural Frequencies under Different Clamping Forces

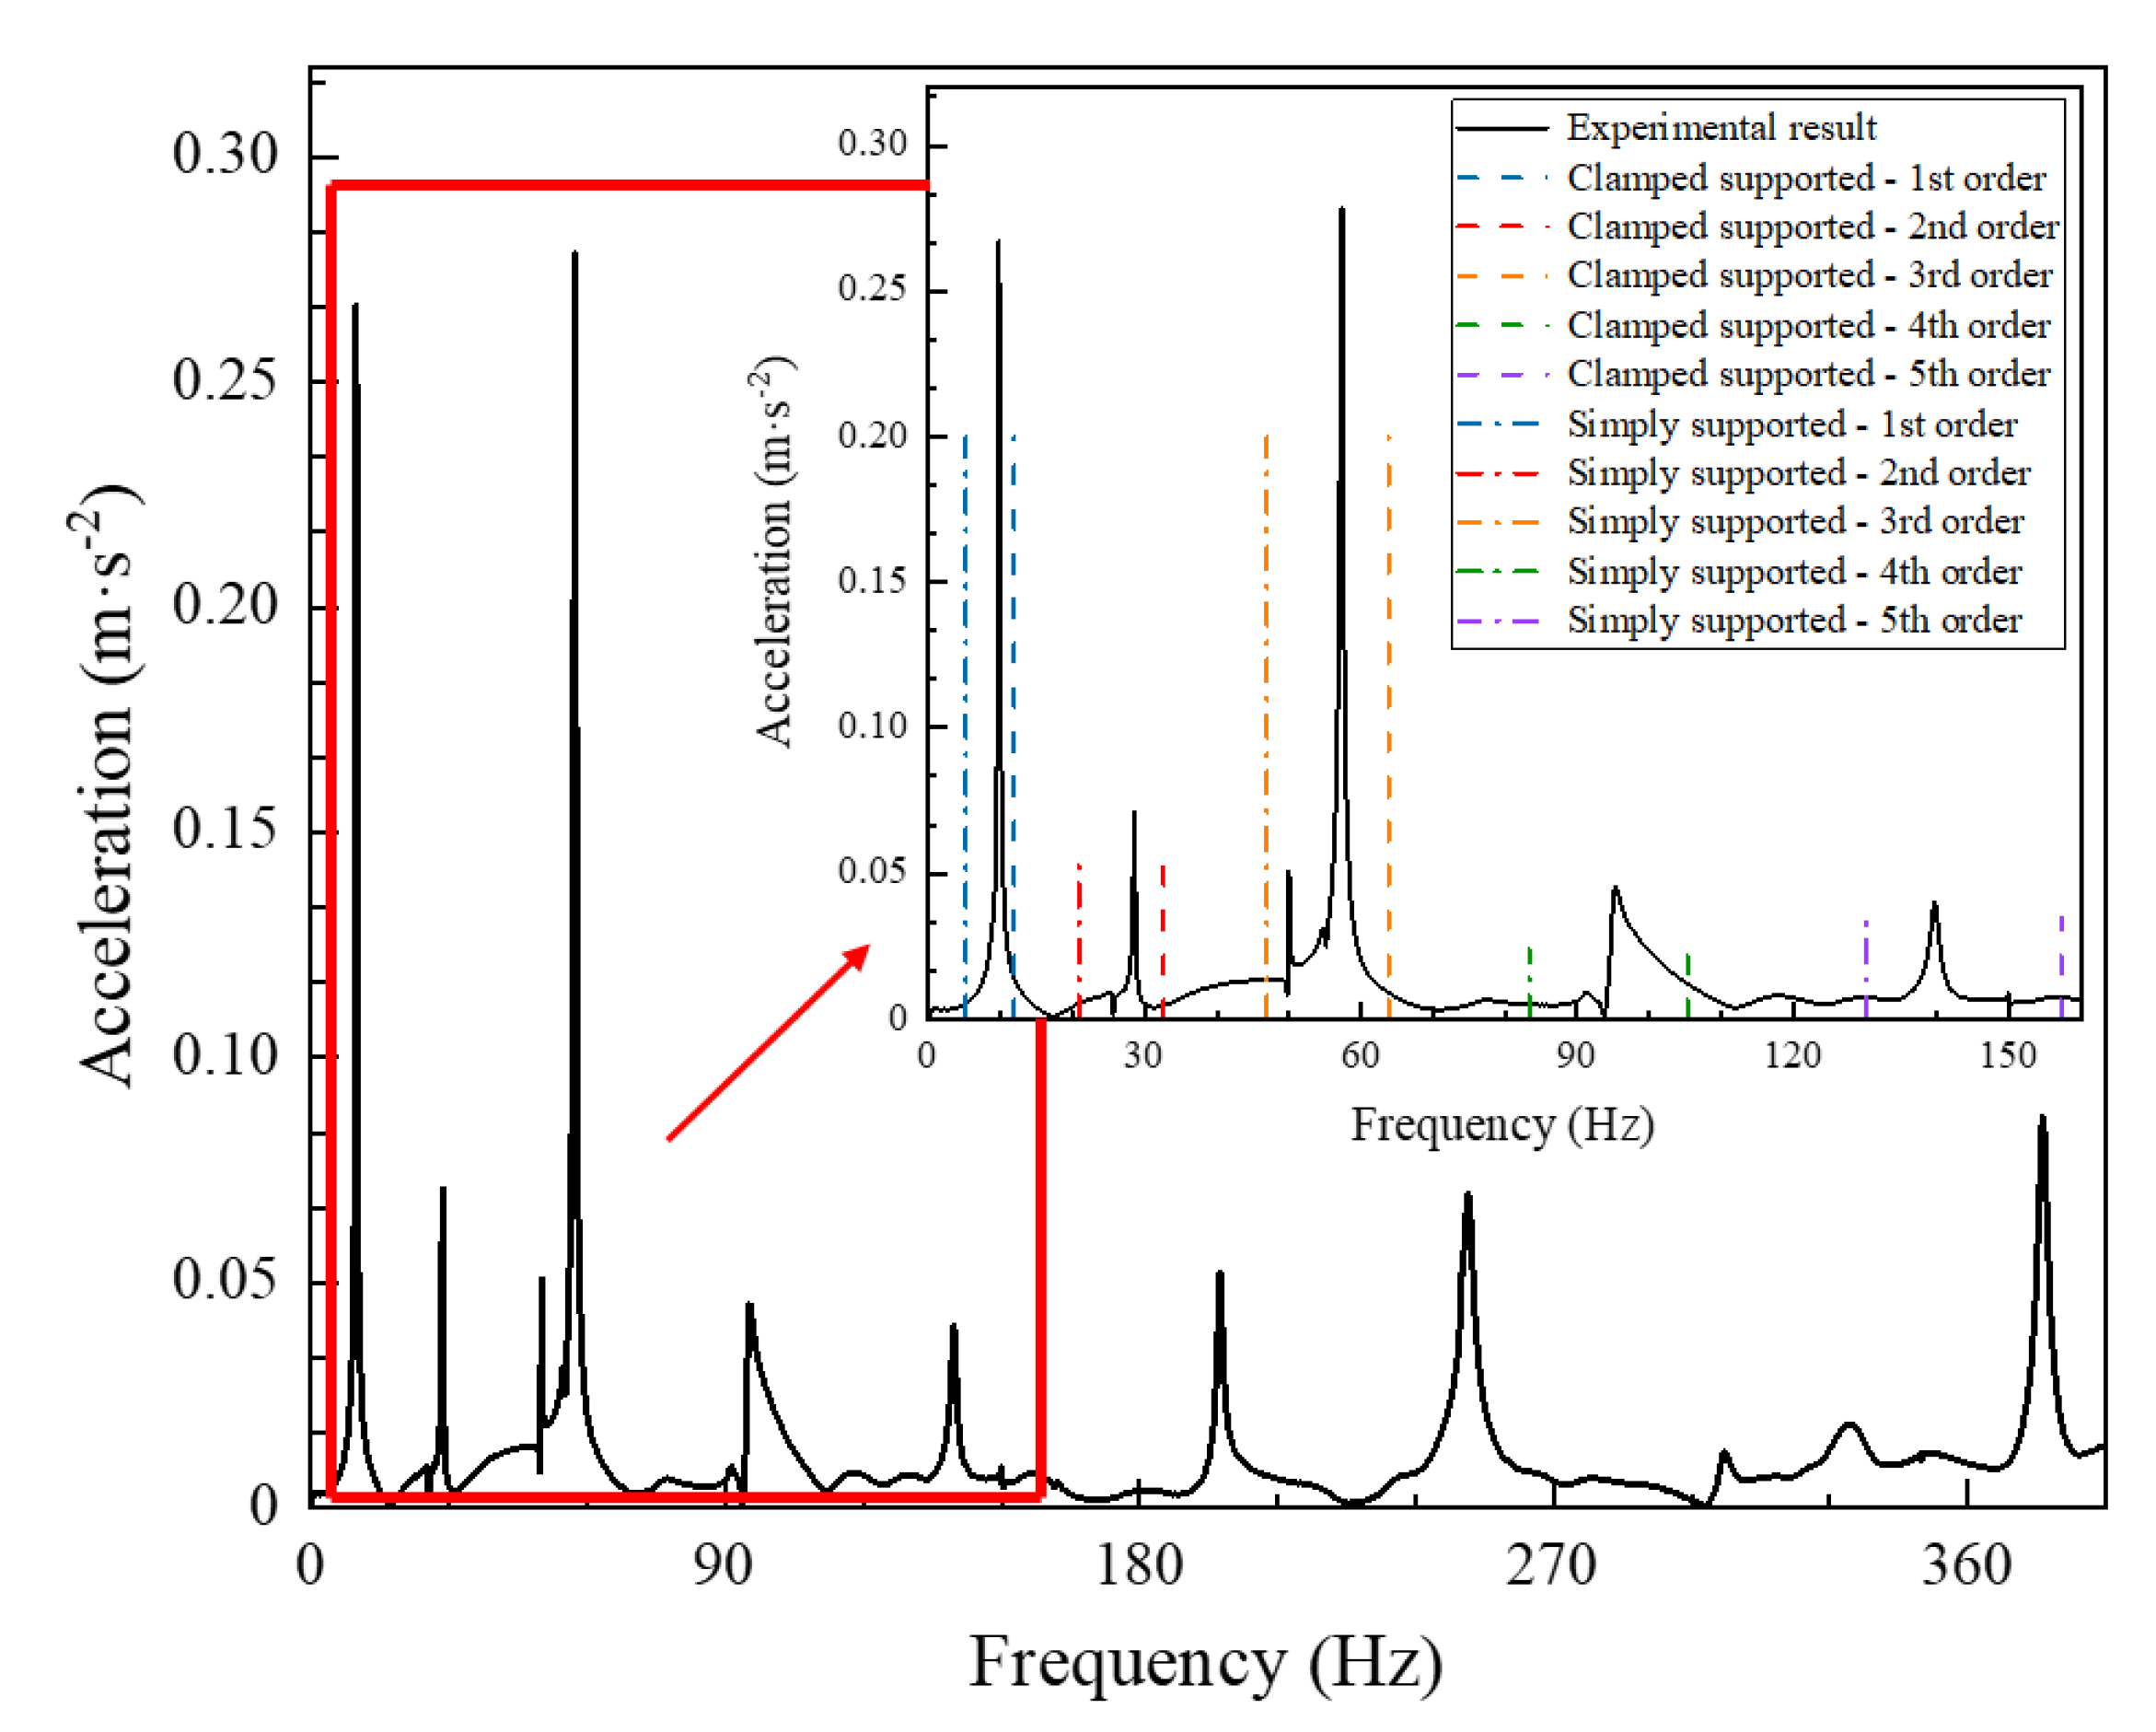
The natural frequency of the single-span tube measured in the experiment and the results of modal analysis based on the finite element method are shown in Figure 5. Among them, the experimental results are represented by a solid line, the simulated results of the tube with simply supported boundary conditions are represented by dotted lines, and the clamped constraints are represented by dashed lines.
The first five natural frequencies of the tube are selected in Figure 5. It is not difficult to find that the value of the natural frequency of the tube obtained in the experiment is within range of the simulation results in different boundary conditions. That indicates that the constraint at both ends of the tube is not simply a supported or clamped supported constraint, but a constraint between the simply supported and the clamped supported constraints.
The response amplitudes of the first three natural frequencies are greater than that of other orders in Figure 5. Consequently, the values of the first three frequencies are used to calculate the relative error given by Equation (1),
δ a v e = 1 3 × i = 1 3 ( f S i f E i f E i ) 2    ( i = 1 ,   2 ,   3 ) ,
where fSi is the frequency obtained by simulation, fEi is the frequency obtained in the experiment, and δave is the relative error.
The relative error of the first three natural frequencies under the simply supported boundary condition is greater than that under the clamped supported boundary condition, as shown in Table 2. Therefore, in finite element modeling, the clamped supported boundary conditions are adopted to simplify the calculation.
In addition, a small peak next to the large peak in the third-order natural frequency is shown in Figure 5. Considering that its amplitude is only about 18% of the nearby peak, combined with the modal analysis results of the tube under simply supported or clamped supported boundary conditions, it is inferred that the small wave peak is the interference peak caused by noise.
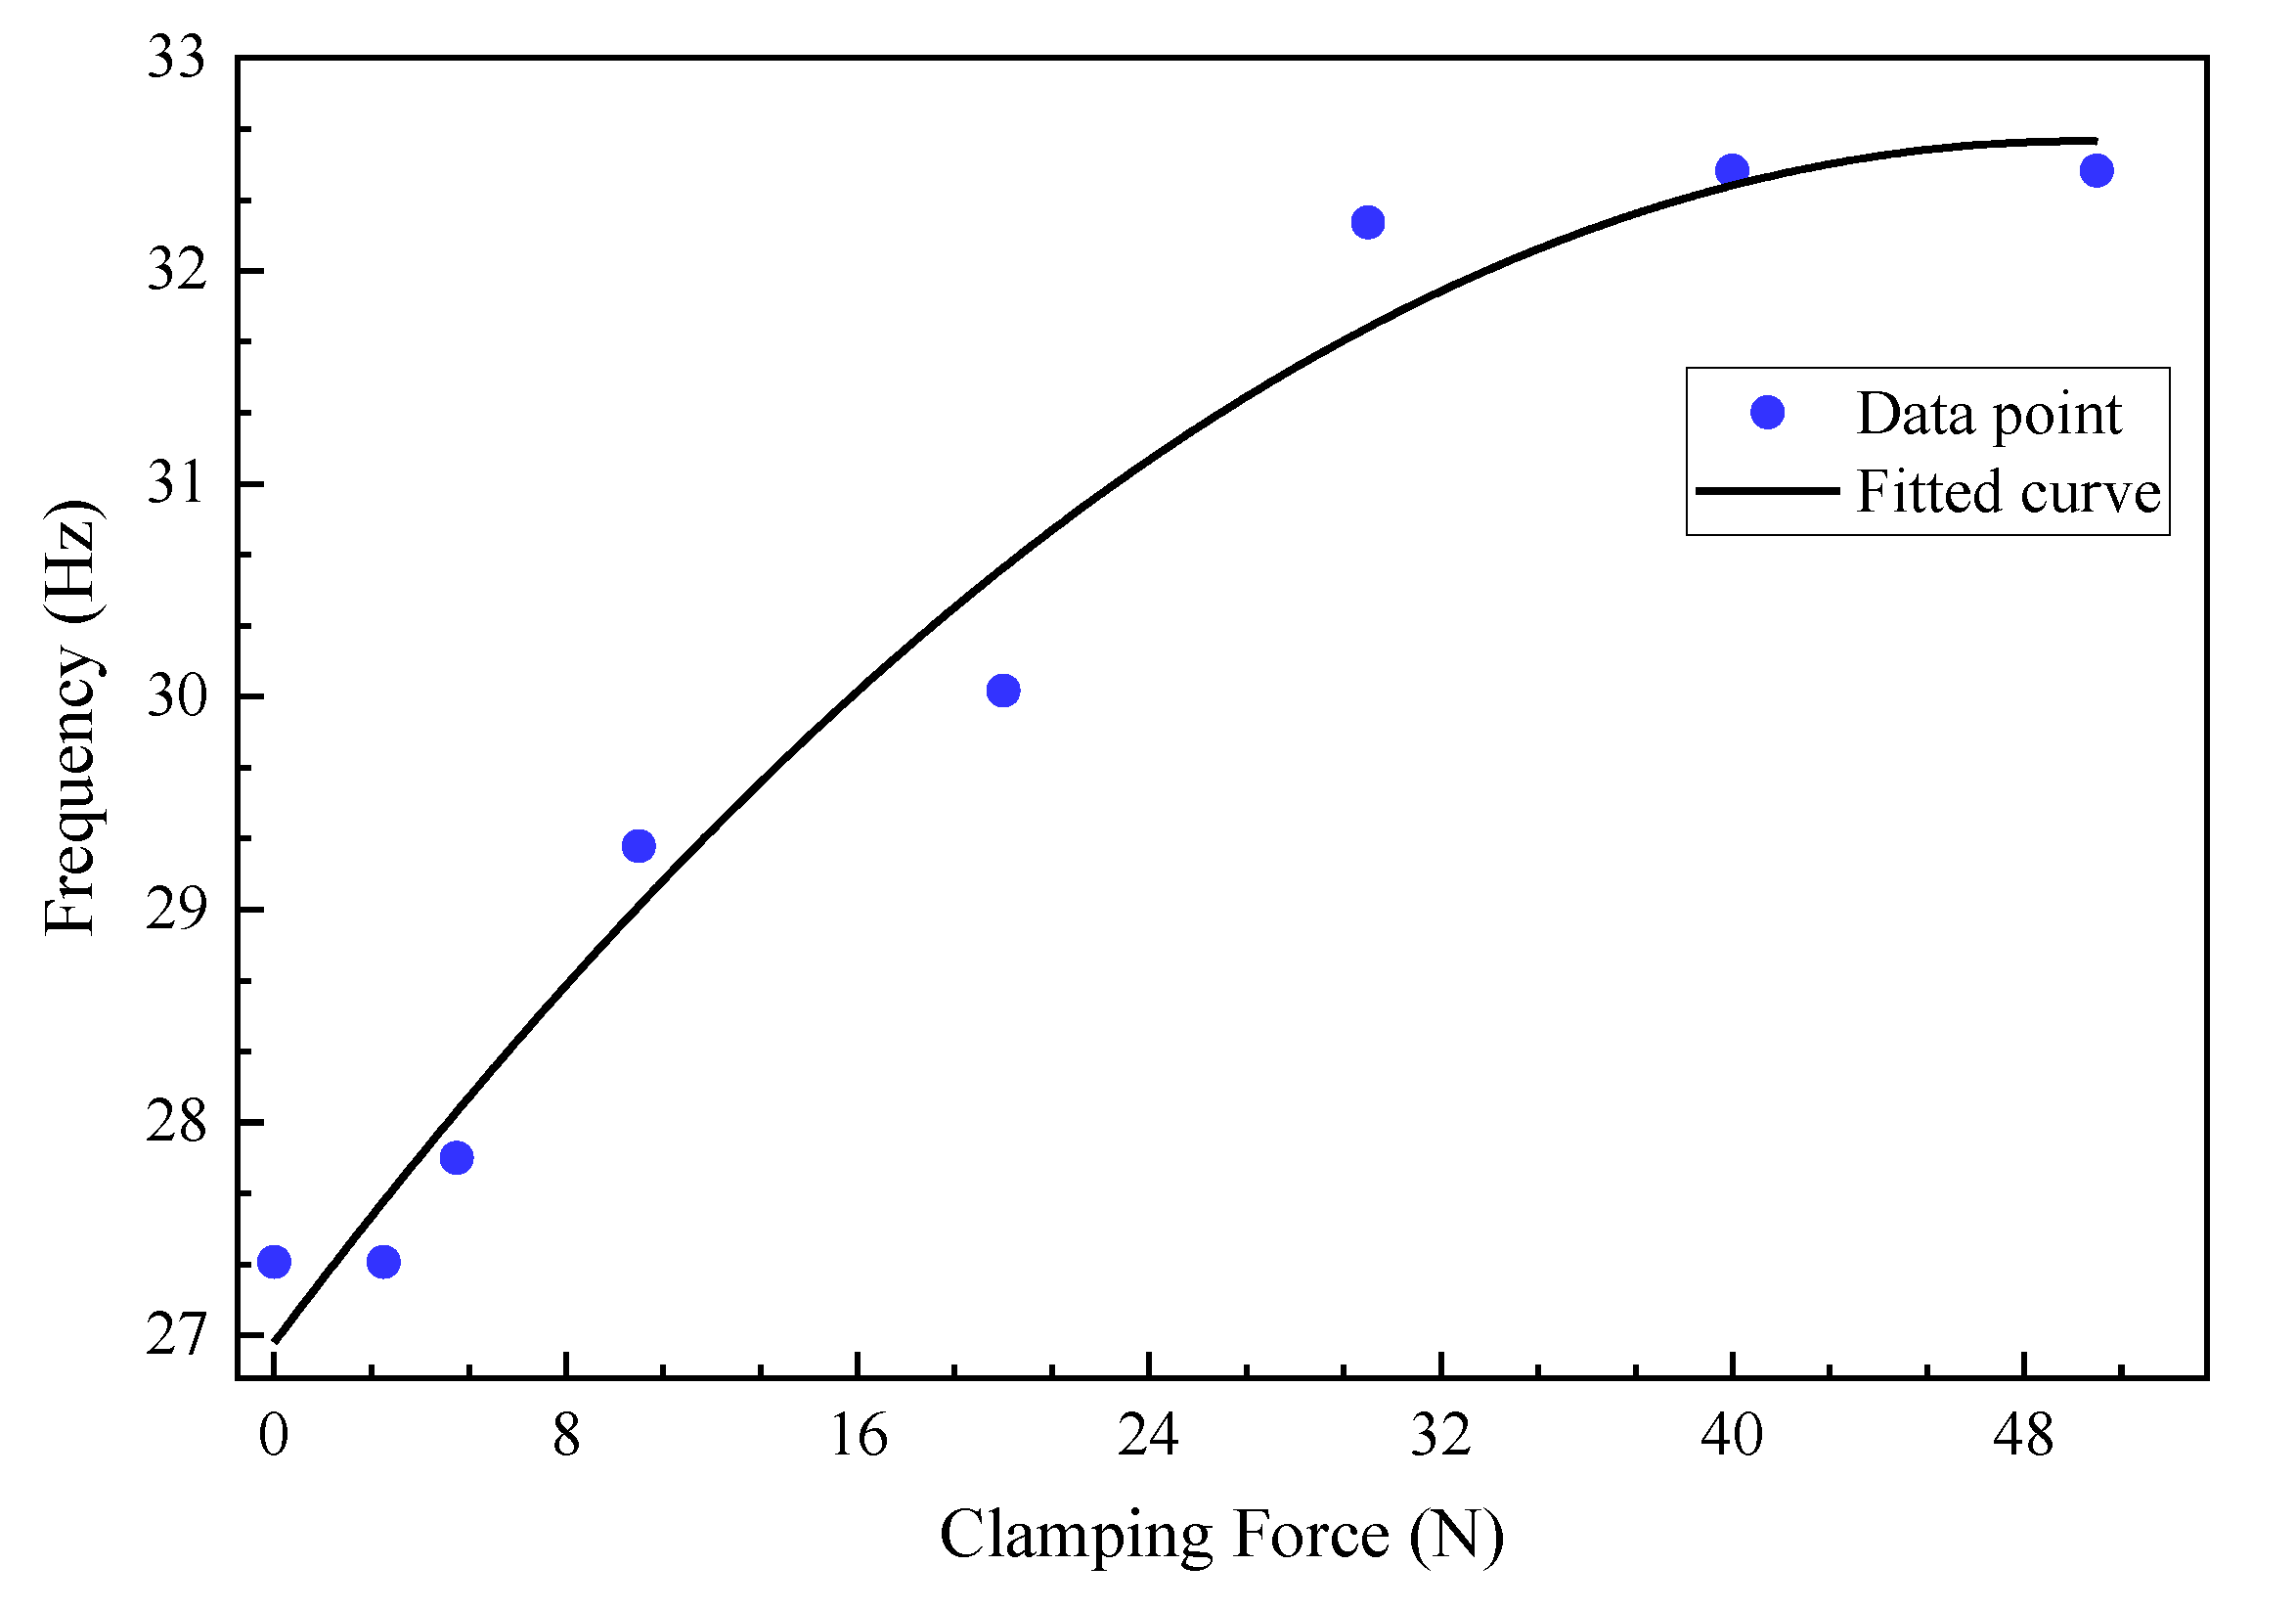
The state of the double-span tube is changed by applying different clamping forces at the AVB. The first-order natural frequencies of the tube under different clamping forces are shown in Figure 6. According to experimental results, when the AVB is in contact with the tube without clamping force being applied, the natural frequency of the tube is 27.344 Hz. In order to make it more intuitive, we performed a quadratic polynomial fit to the data points. It is easy to see that as the clamping force increases, the first-order natural frequency of the tube increases slightly, and the end of the curve tends to be flat.
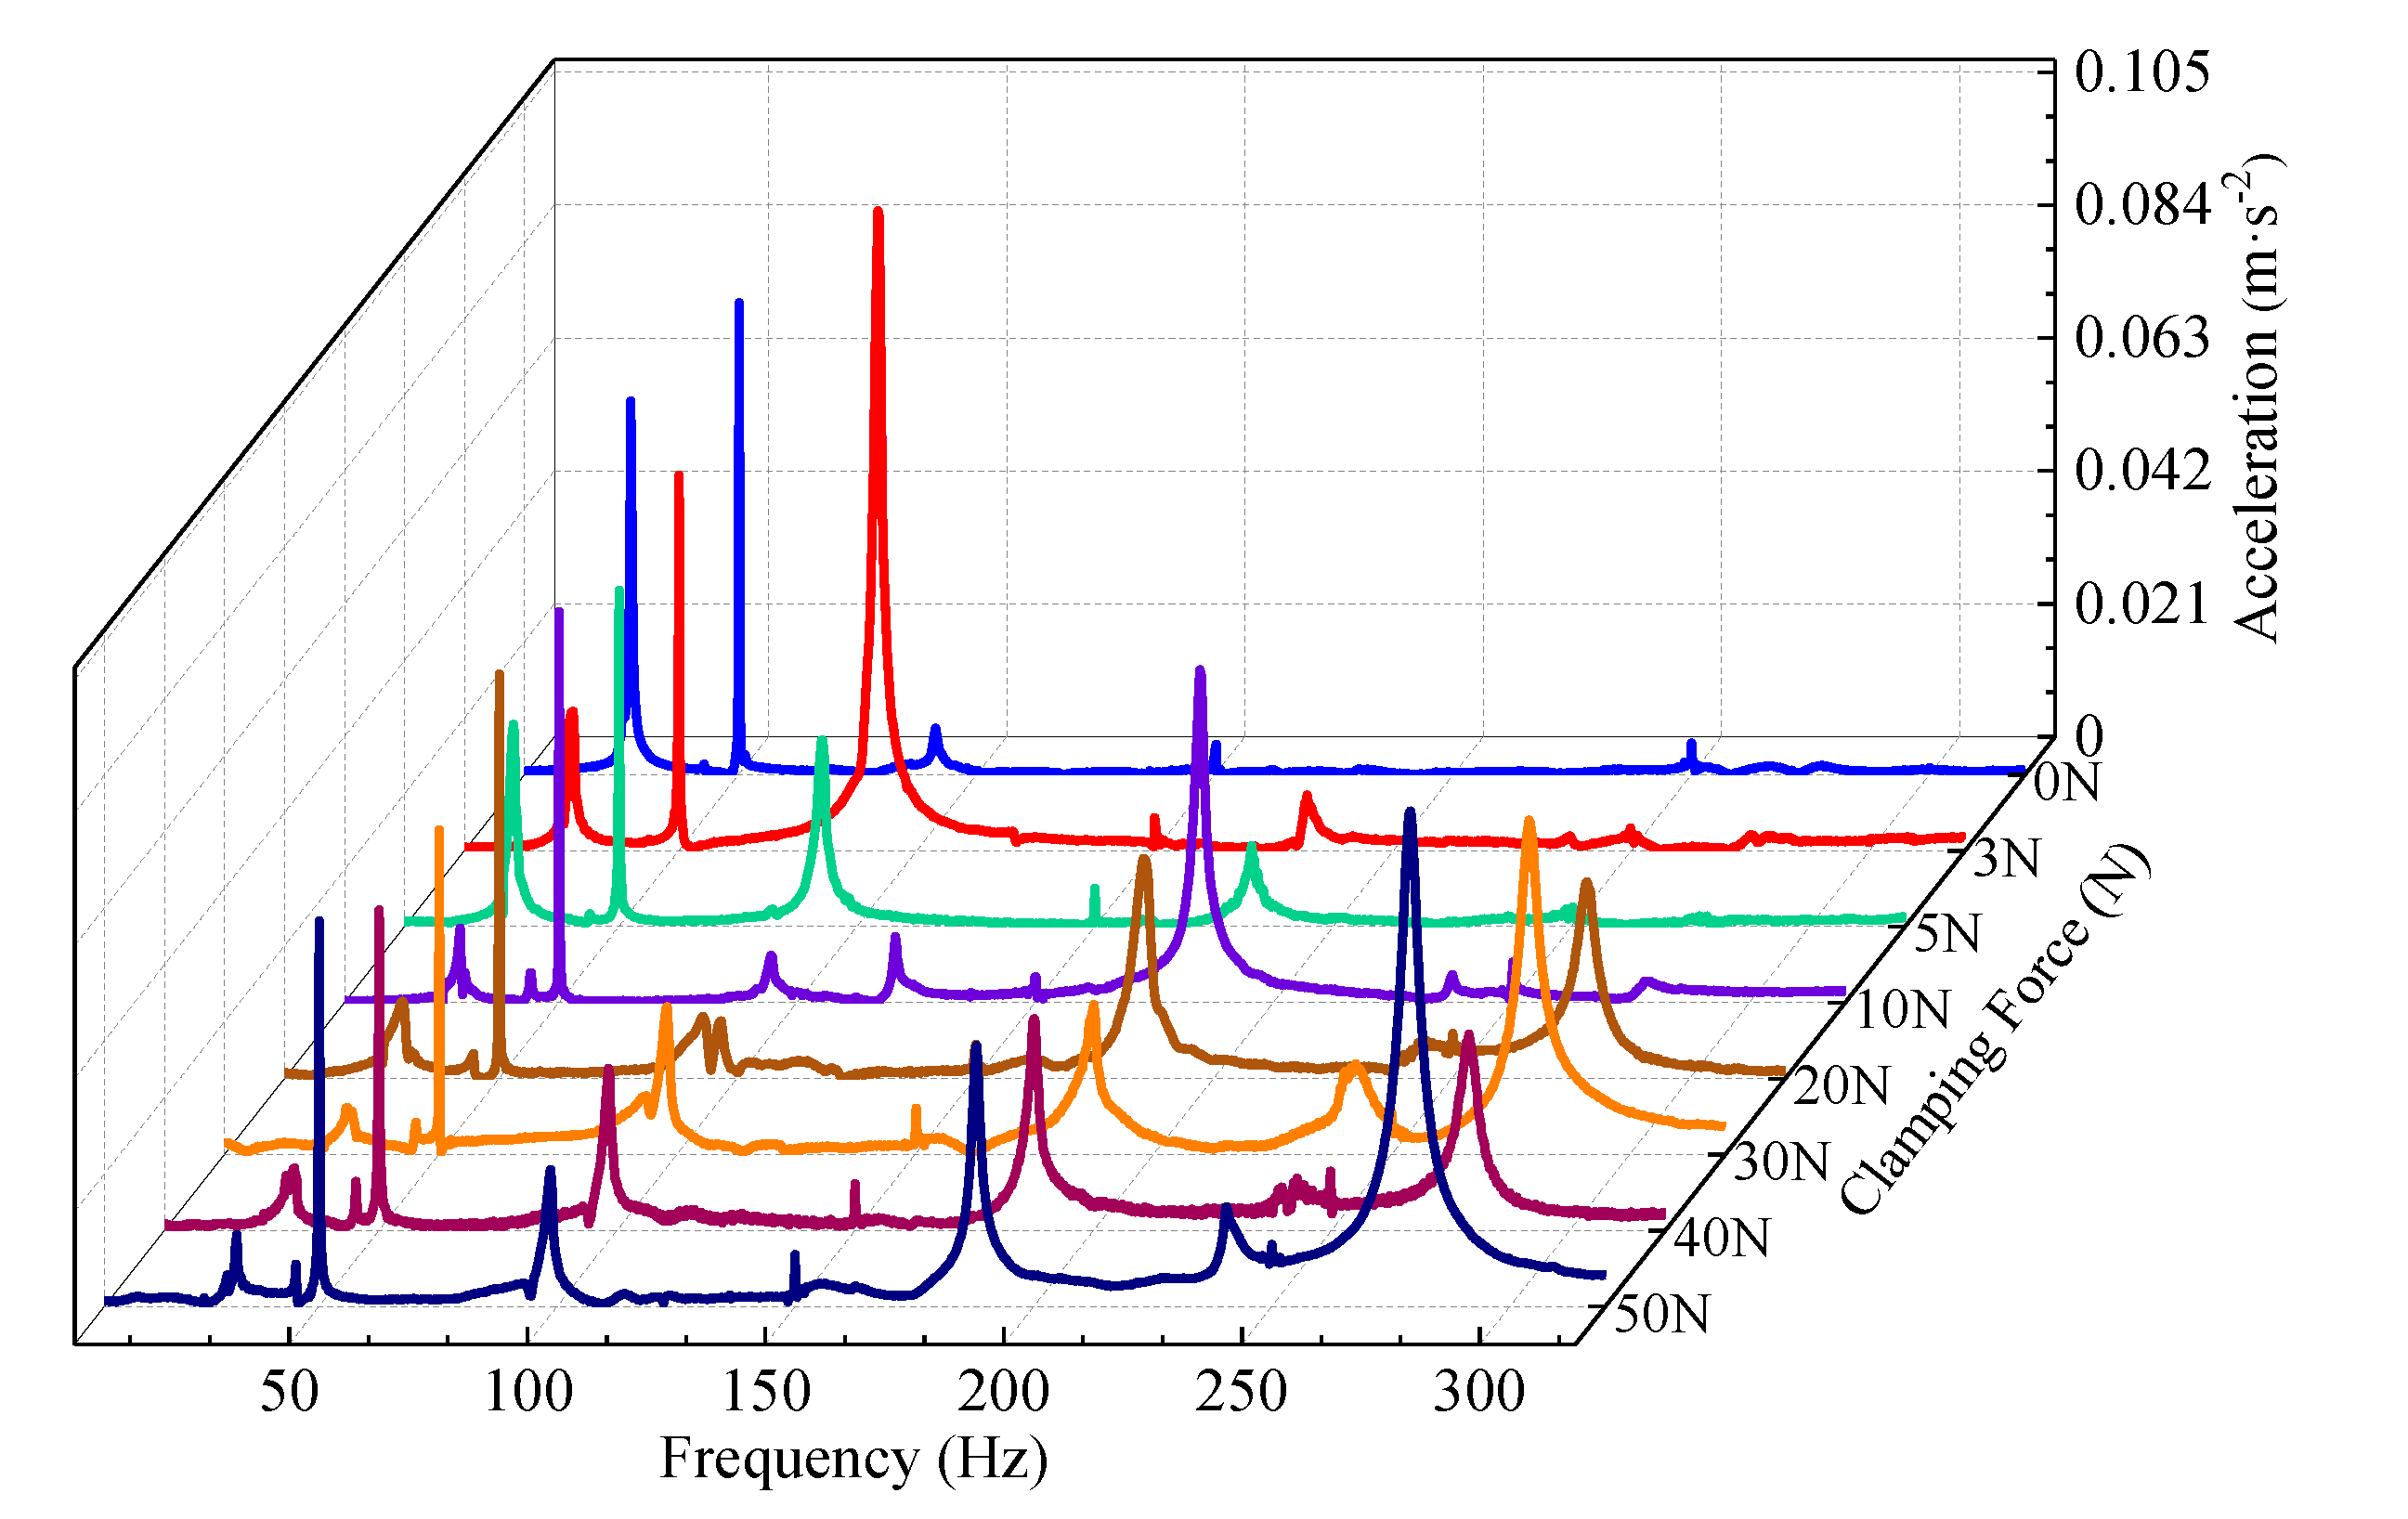
The first seven natural frequencies of the tube under different clamping forces are drawn in the form of waterfall diagrams, as shown in Figure 7. It can be seen from the figure that when the tube is subjected to a clamping force below 10 N, the response amplitudes of the first three orders are higher than that of the high-order frequencies. On the contrary, the response amplitude of the high-order frequencies becomes higher as the clamping force increases from 20 N to 50 N. Combining the experimental results on the natural frequency of the single-span tube, we infer that the greater clamping force causes the contact surface of the tube to be squeezed and slightly deformed, which causes the natural frequency of the double-span tube to change. The increment of the clamping force will not cause the value of tube frequency to increase significantly. However, it will cause the main frequency of the tube to shift to a frequency with a large value, and the number of large-amplitude responses of frequencies in different orders grows under increasing clamping force. It also means that the tube will be more likely to vibrate at large amplitudes under a random excitation.
Subsequent wear experiments and dynamic behavior analysis are all based on the double-span structure of the tube, and the frequency of the excitation force being controlled should avoid the natural frequency of the double-span tube.

4.2. Dynamic Behavior Analysis Based on the Finite Element Method

Wear volume is proportional to clamping force and sliding distance, according to the Archard equation [20]. Many scholars have carried out fretting wear experiments on the basis of Archard’s research, and experimental results have well proved this conclusion [21,22]. However, clamping force affects the sliding distance of the tube. The mutual influence between these two variables is taken into account in this section, and the friction energy at the contact position is used to measure the impact of the clamping force on the wear behavior of the tube.
For ease of explanation, we define the normal direction of AVB as y-direction, the axial direction of the tube as z-direction, and another as x-direction. To simulate the dynamic response of the tube under different clamping forces, we should determine how much force the normal displacement applied at the AVB corresponds to first. Therefore, in the static finite element analysis, the displacement in y-direction was applied to the AVB-1, and the clamped supported boundary condition was applied to AVB-2, as shown in Figure 8a. After the solution, the reaction force in y-direction at the contact position was obtained, representing the clamping force generated by tightening the bolts at AVB in the experiment. As a result, the relationship between the clamping force and the displacement constraint of AVB-1 was determined, as shown in Figure 8b. It can be seen intuitively in the figure that the clamping force observes a linear relationship with the displacement of AVB-1 in the y-direction, which is related to the elastic material property of the tube being set.
A node at the center of the contact surface is selected as an analysis object. The displacement and friction of the node along x-direction under different clamping forces are extracted. Simulation results under 45 excitation cycles are selected in the present work. The friction energy in each excitation cycle is calculated according to Equation (2).
E = i n ( F x , i + F x , i + 1 2 ) × ( s i + 1 s i )    ( 1 i n ) ,
where Fx is the friction, si is the tube displacement in the x-direction, and E is the friction energy.
The friction energy in each cycle under different clamping forces is shown in Figure 9a. Considering the monotonically increasing trend of friction energy during the first four cycles, which may be caused by the system being in an unsteady state, the data of the first four cycles are not shown in the figure. Moreover, the average friction energy of a single cycle and the maximum sliding distance under different clamping forces are shown in Figure 9b.
Obviously, as the clamping force increases from 53 N to 126 N, the maximum sliding distance of the tube at contact position decreases correspondingly, and the friction energy at the contact position becomes lower under increasing clamping force. Furthermore, when the value of the clamping force is at a high level, the friction energy decreases rapidly.

4.3. Experimental Validation

The contact type between the tube and the AVB in the experiment is line contact. The wear depth of the tube at the middle line in the contact area is the deepest so that it is selected as an analysis object. There is a corresponding relationship between wear depth and wear volume, which means that wear volume can be estimated as long as wear depth is obtained. Connors [5] divided the wear scar into two categories according to the vibration amplitude and gave the calculation method of the wear volume. RYU et al. [23] refined the types of wear scars based on the work of Connors. Four types of wear scars, such as round, crescent, flat and oblique, were analyzed in their study, and the calculation method for each kind of wear scar was proposed.
Wear scars in our experiments are not the regular flat-shaped type. To calculate the total volume of the scar, we divide it into n regular flat-shaped scars, as shown in Figure 10. The wear volume of each flat-shaped scar is calculated according to the method mentioned by the above scholars. Finally, the total wear volume in the irregular shape of the scar is obtained by summing the volume of n flat scars.
Wear scar in A-A view is shown in Figure 10b, where h represents the maximum wear depth of the tube, D represents the outer diameter of the tube, and θ represents the central angle of wear scar. The central angle and wear volume of the ith flat-shaped scar of the tube are calculated according to Equations (3) and (4).
θ i = arccos ( 1 2 h i D ) ,
V i = D 2 8 ( 2 θ i sin 2 θ i ) l i ,
The central angle θ expressed in radians can be calculated according to the wear depth measured by LSCM. Because of limited value on θ, Equations (3) and (4) are simplified to:
h i D θ i 2 4 ,
V i D 2 l i θ i 3 6 ,
Then we can obtain the relationship between the wear depth and the wear volume of the flat-shaped scar. On the basis of measured wear depth, corresponding wear volume can be estimated, as shown in Equations (7) and (8).
V i = 4 3 D 1 2 h i 3 2 l i ,
V t o t a l = i = 1 n 4 3 D 1 2 h i 3 2 l i ,
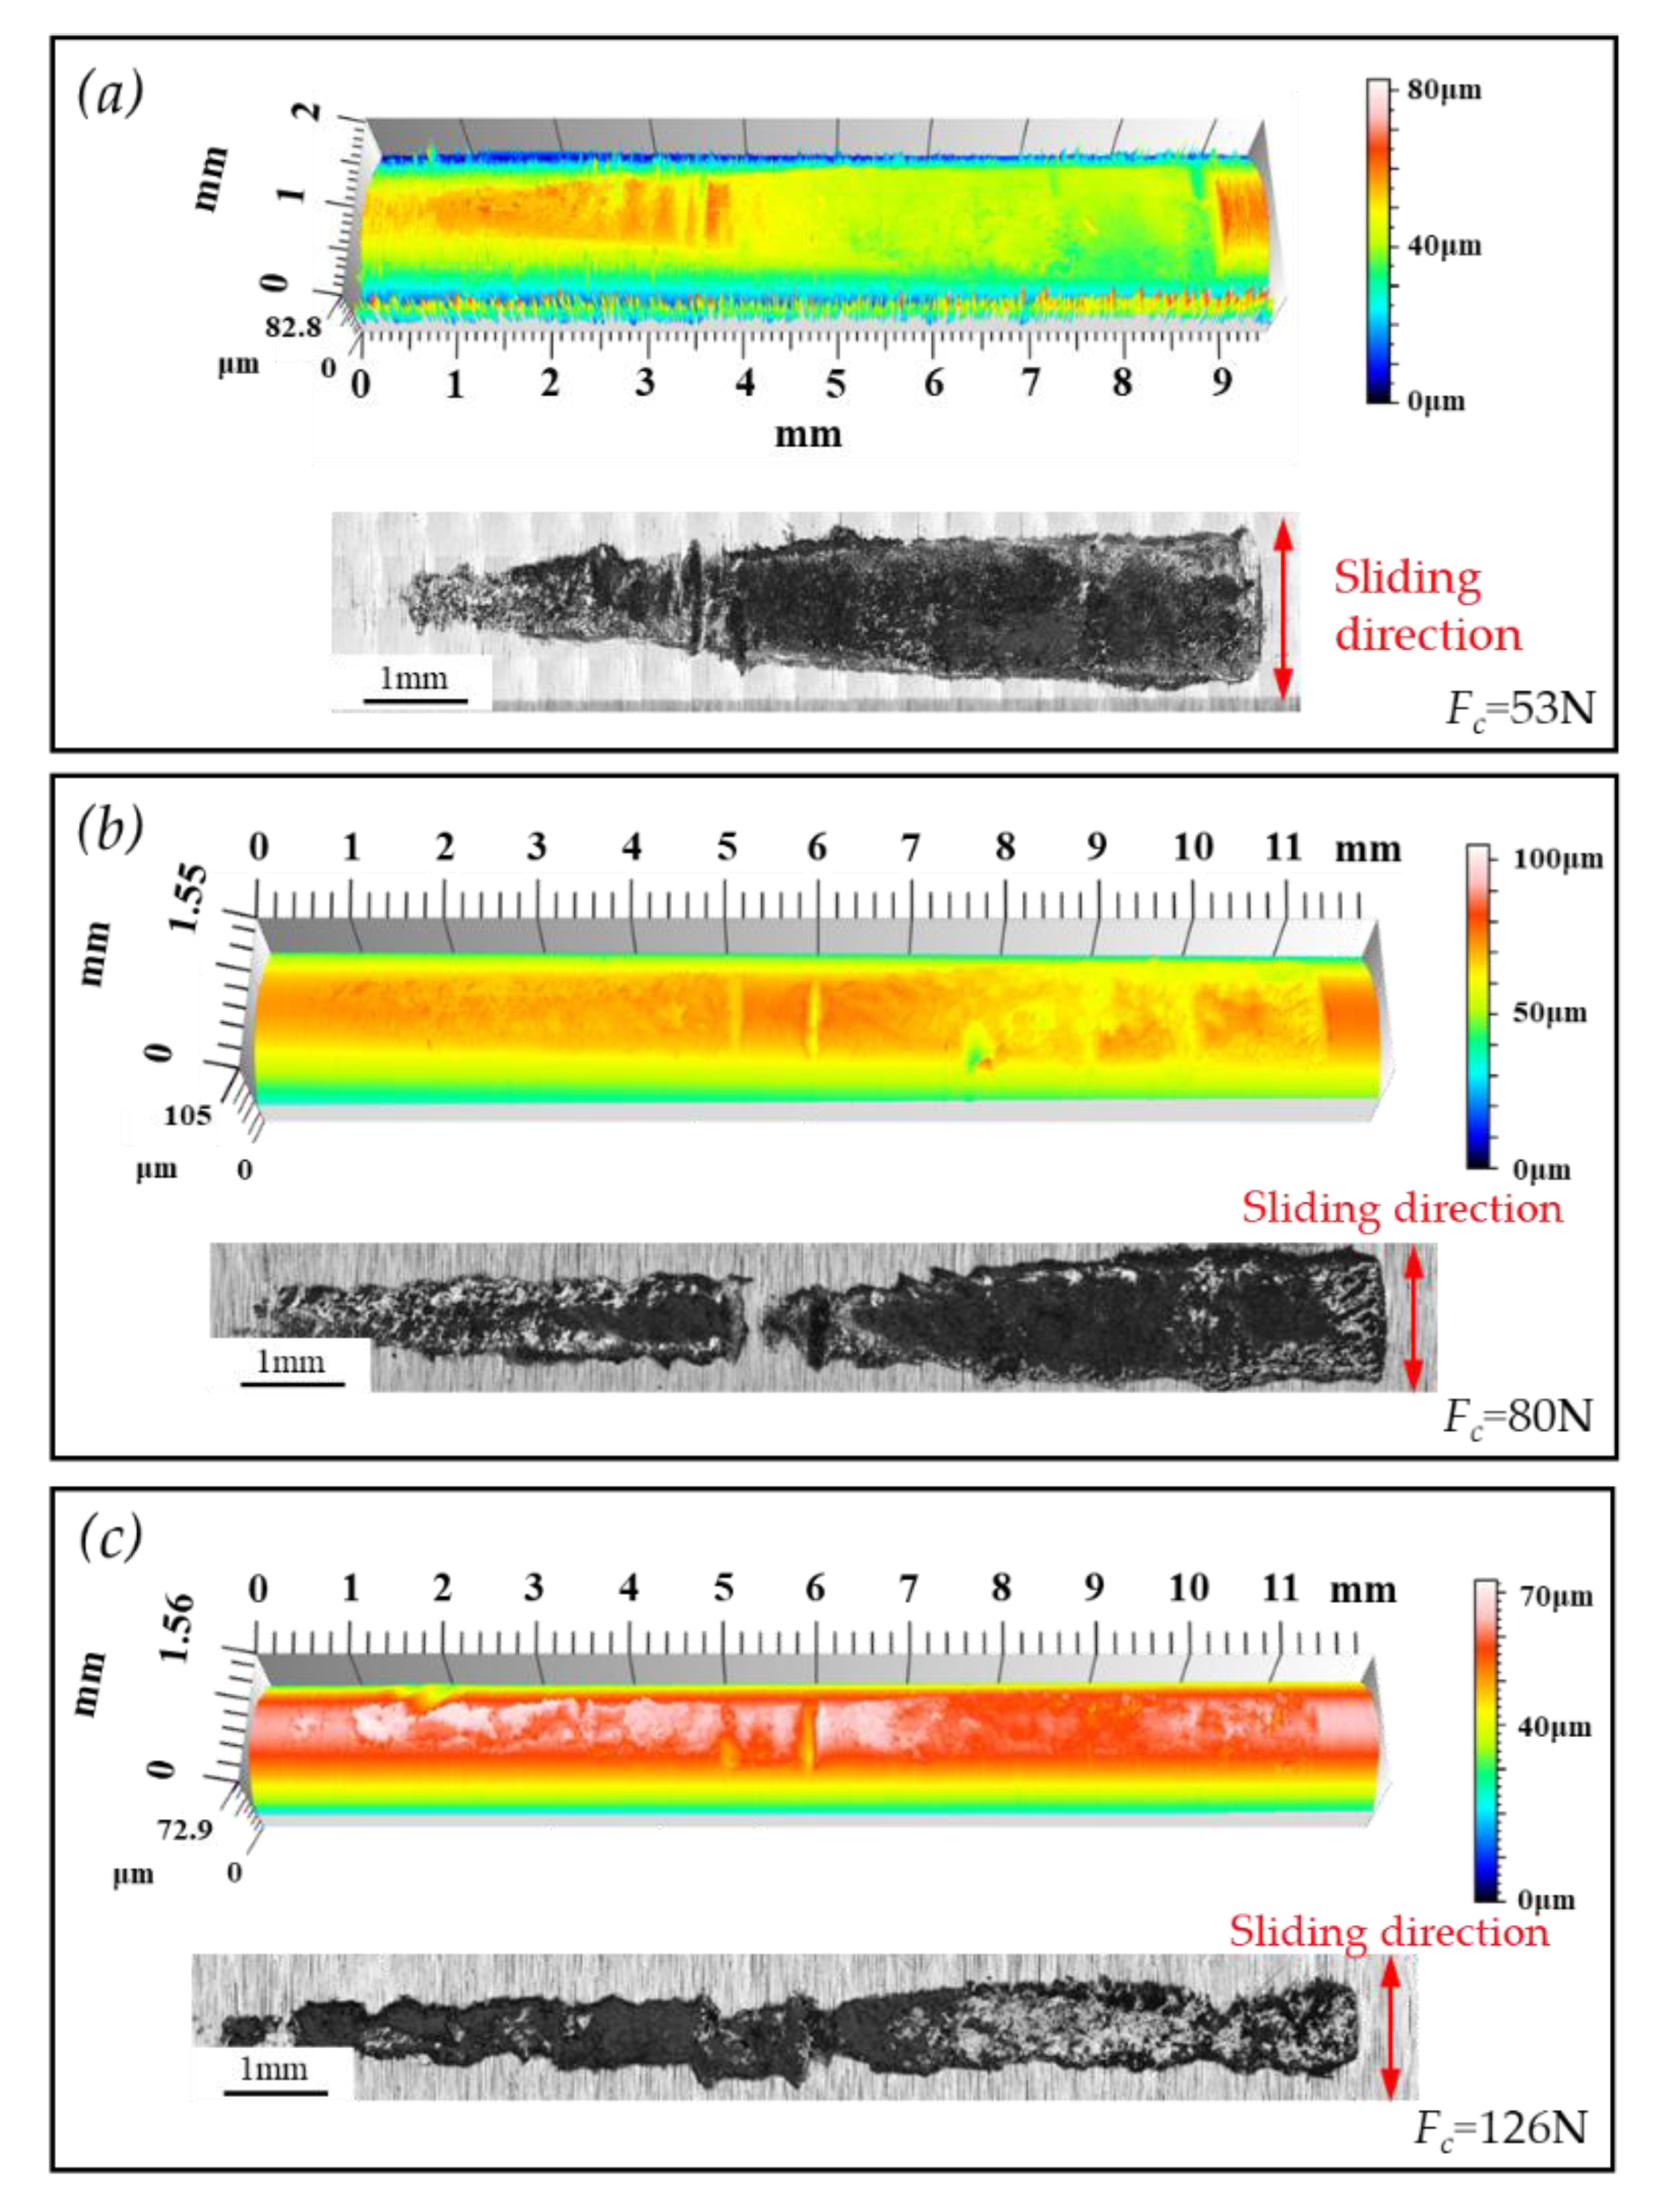
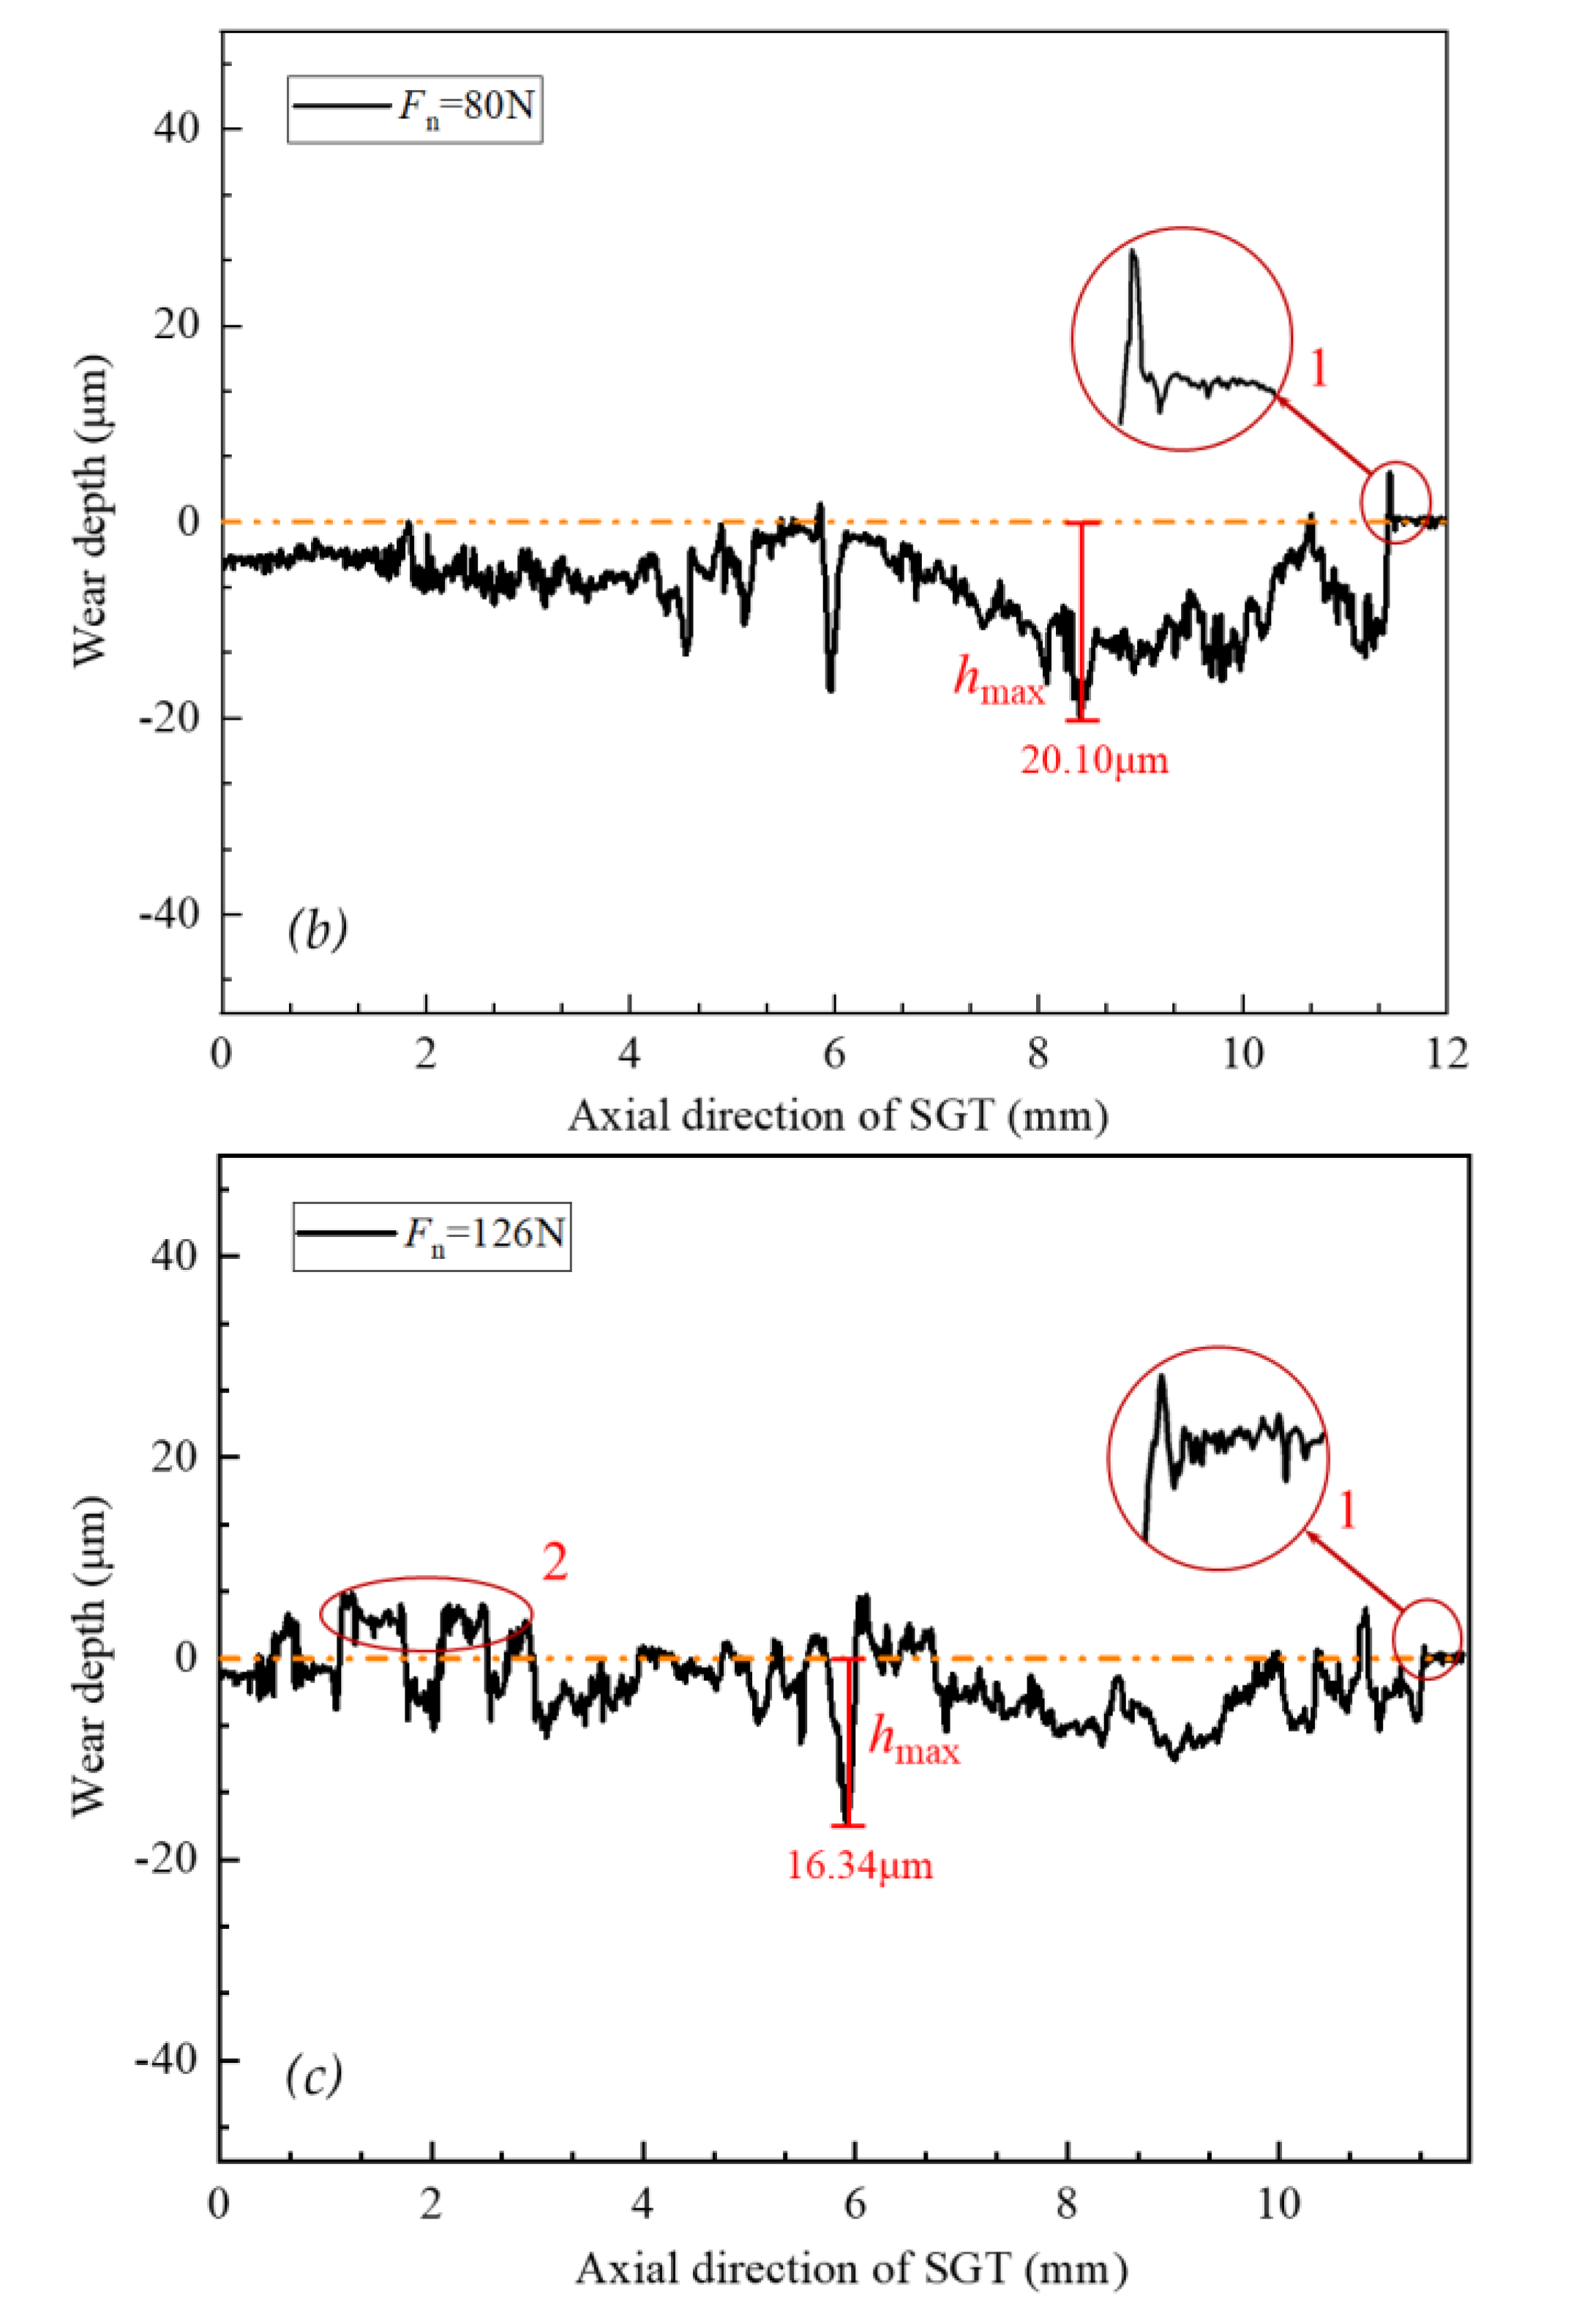
Figure 11 shows the 3D morphology of wear scars under different clamping forces. The corresponding wear depth along the axial direction of the tube is shown in Figure 12, and the wear data are shown in Table 3.
Mark 1 in Figure 12 illustrates that obvious boundaries were generated between the unworn surface and the worn surface, caused by the accumulation of wear debris during the wear process. Under the impact of greater clamping force, the wear debris of the AVB transfers to the worn surface of the tube, or plastic deformation occurs in the wear area, as shown in Mark 2 of Figure 12c.
The maximum wear depth with a clamping force of 53 N is largest among the three groups of wear experiments under different clamping forces, accounting for 2.35% of the thickness of the tube, and wear volume in this experiment is also the largest. Both maximum wear depth and wear volume in another experiment with a clamping force of 126 N are the smallest, with wear depth accounting for 1.62% of the thickness of the tube. Experimental data obtained under a clamping force ranging from 53 N to 126 N illustrates that wear volume decreases with an increase in clamping force.
According to the results of wear experiments and dynamic behavior analysis, the increase in clamping force will reduce the sliding distance at the contact position of the tube, and friction energy will also be reduced. Accordingly, damage of the tube is slowed down. Most scholars set the same sliding distance in the research of fretting wear, considering the influence of normal force on wear behavior separately. Therefore, the conclusions obtained in this paper are not contradictory to conclusions by other scholars on fretting wear.

4.4. Wear Coefficient

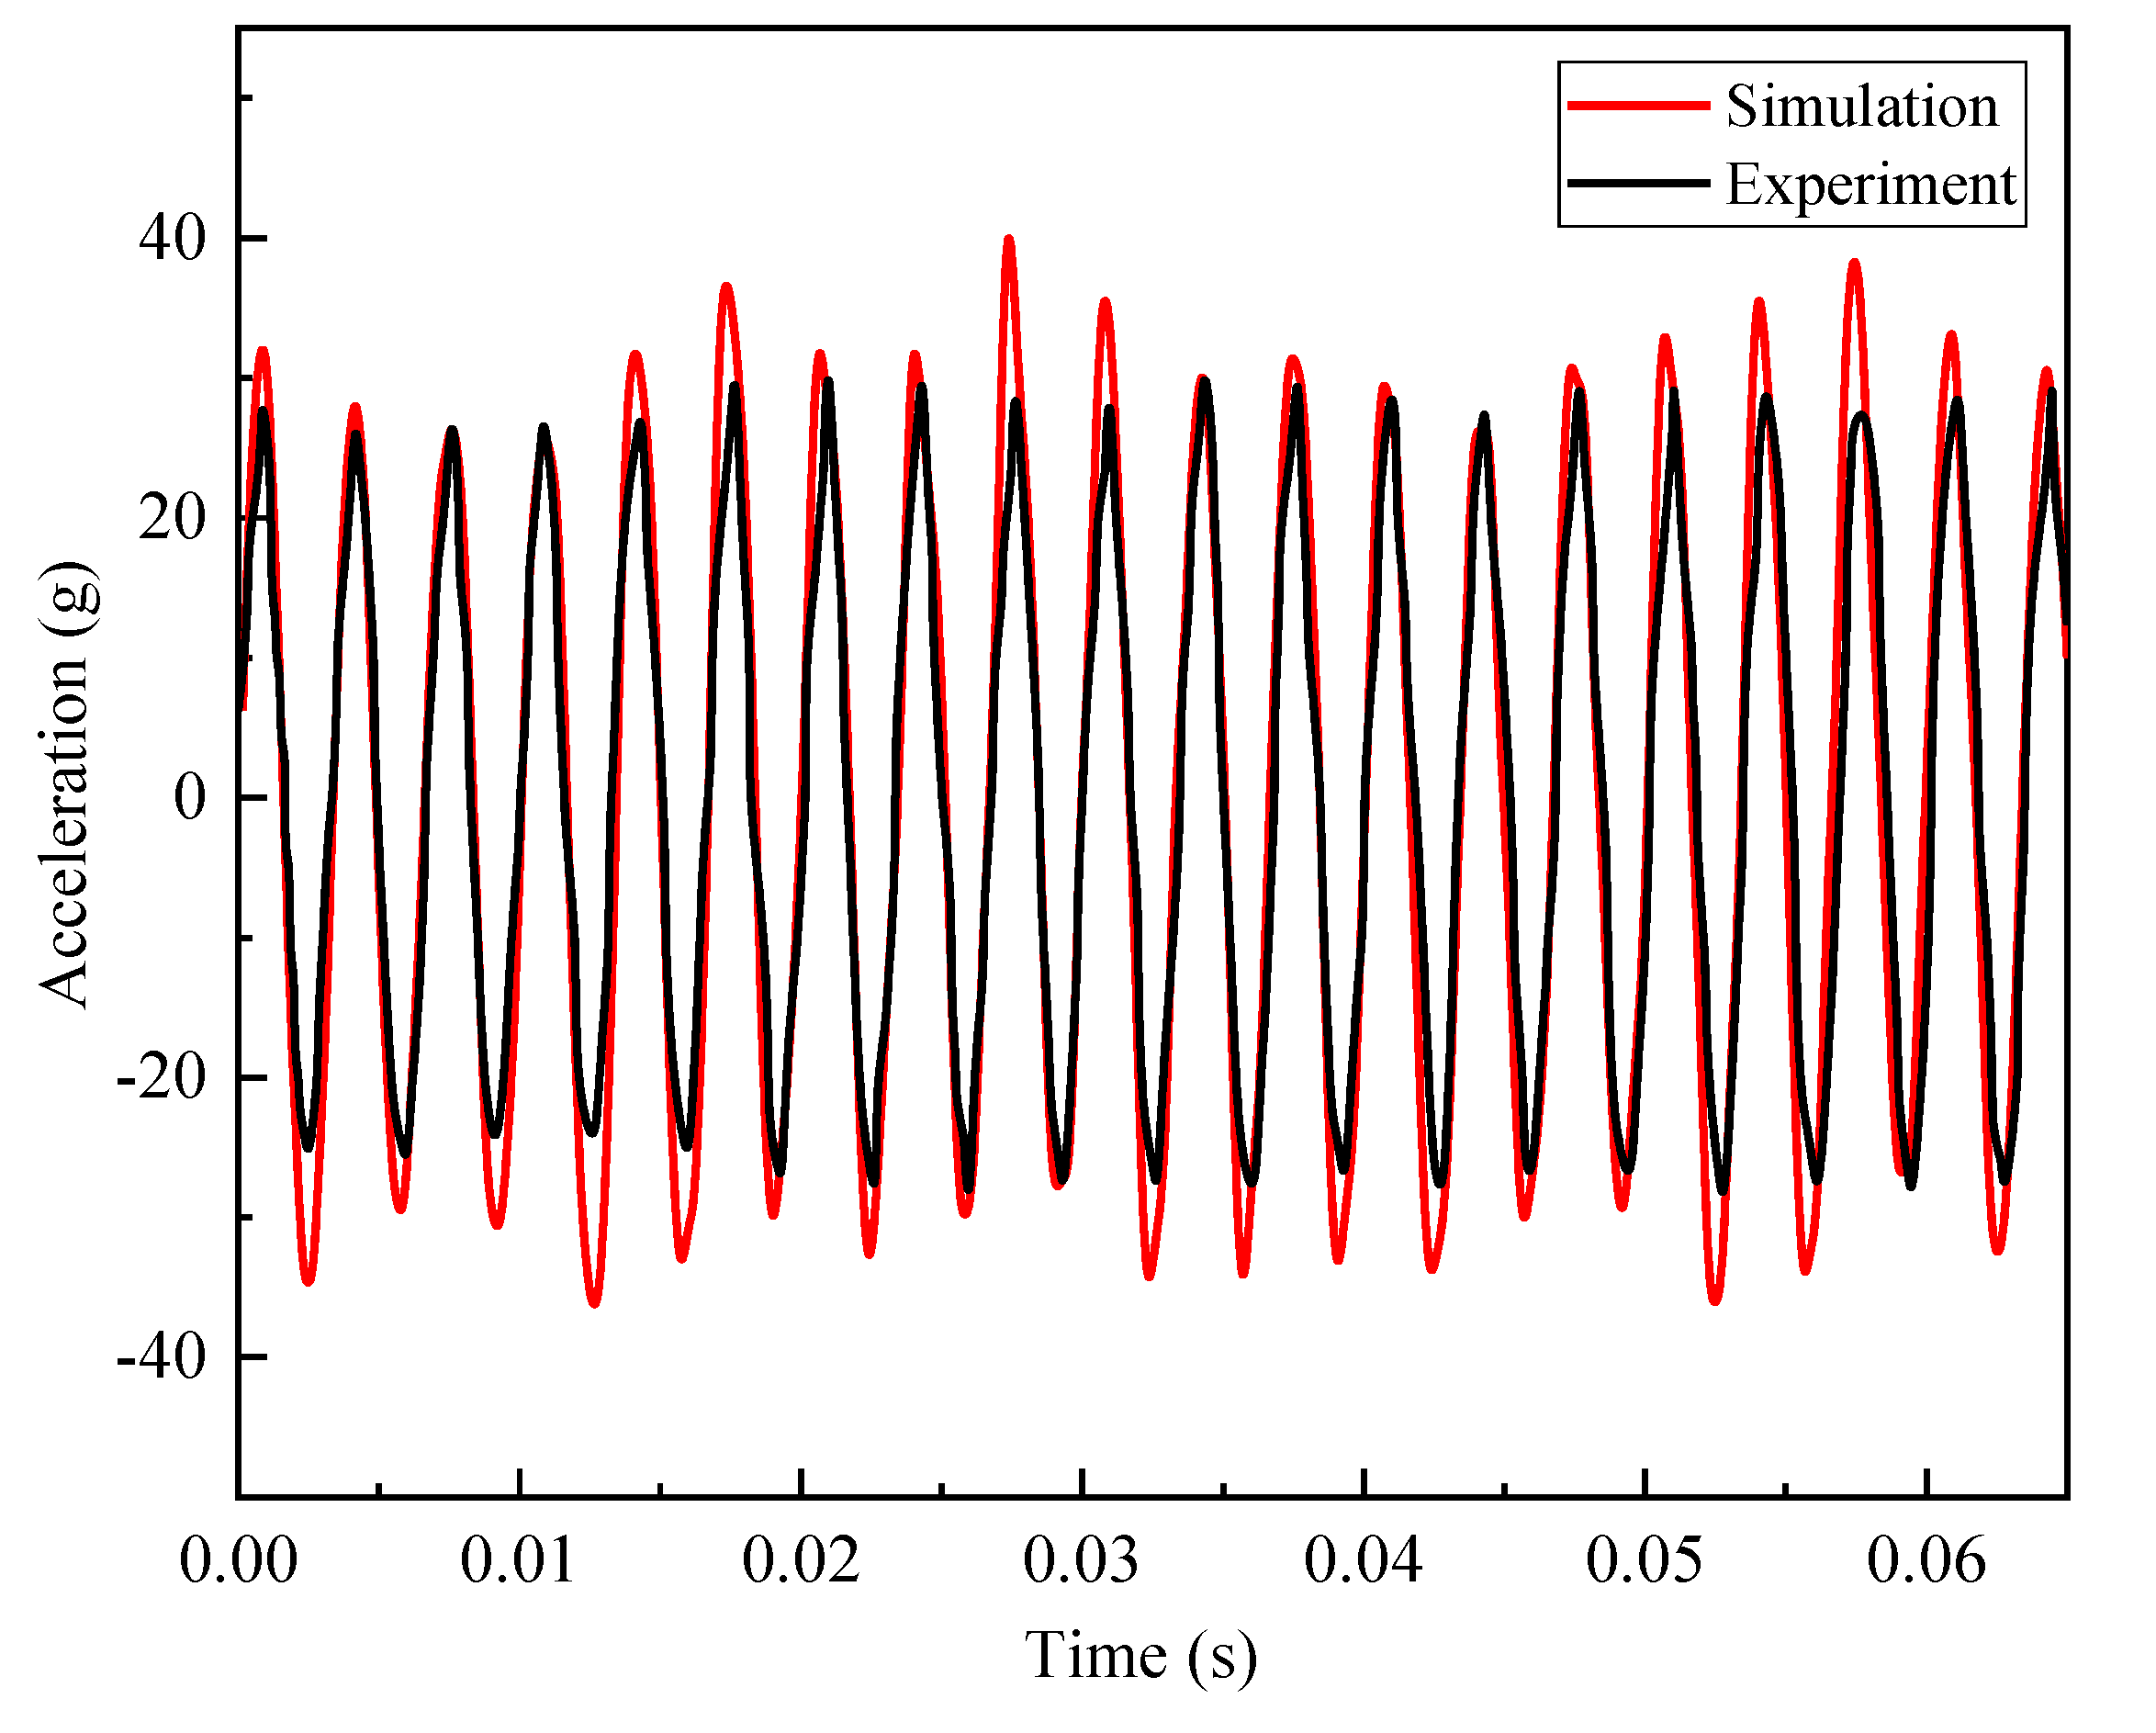
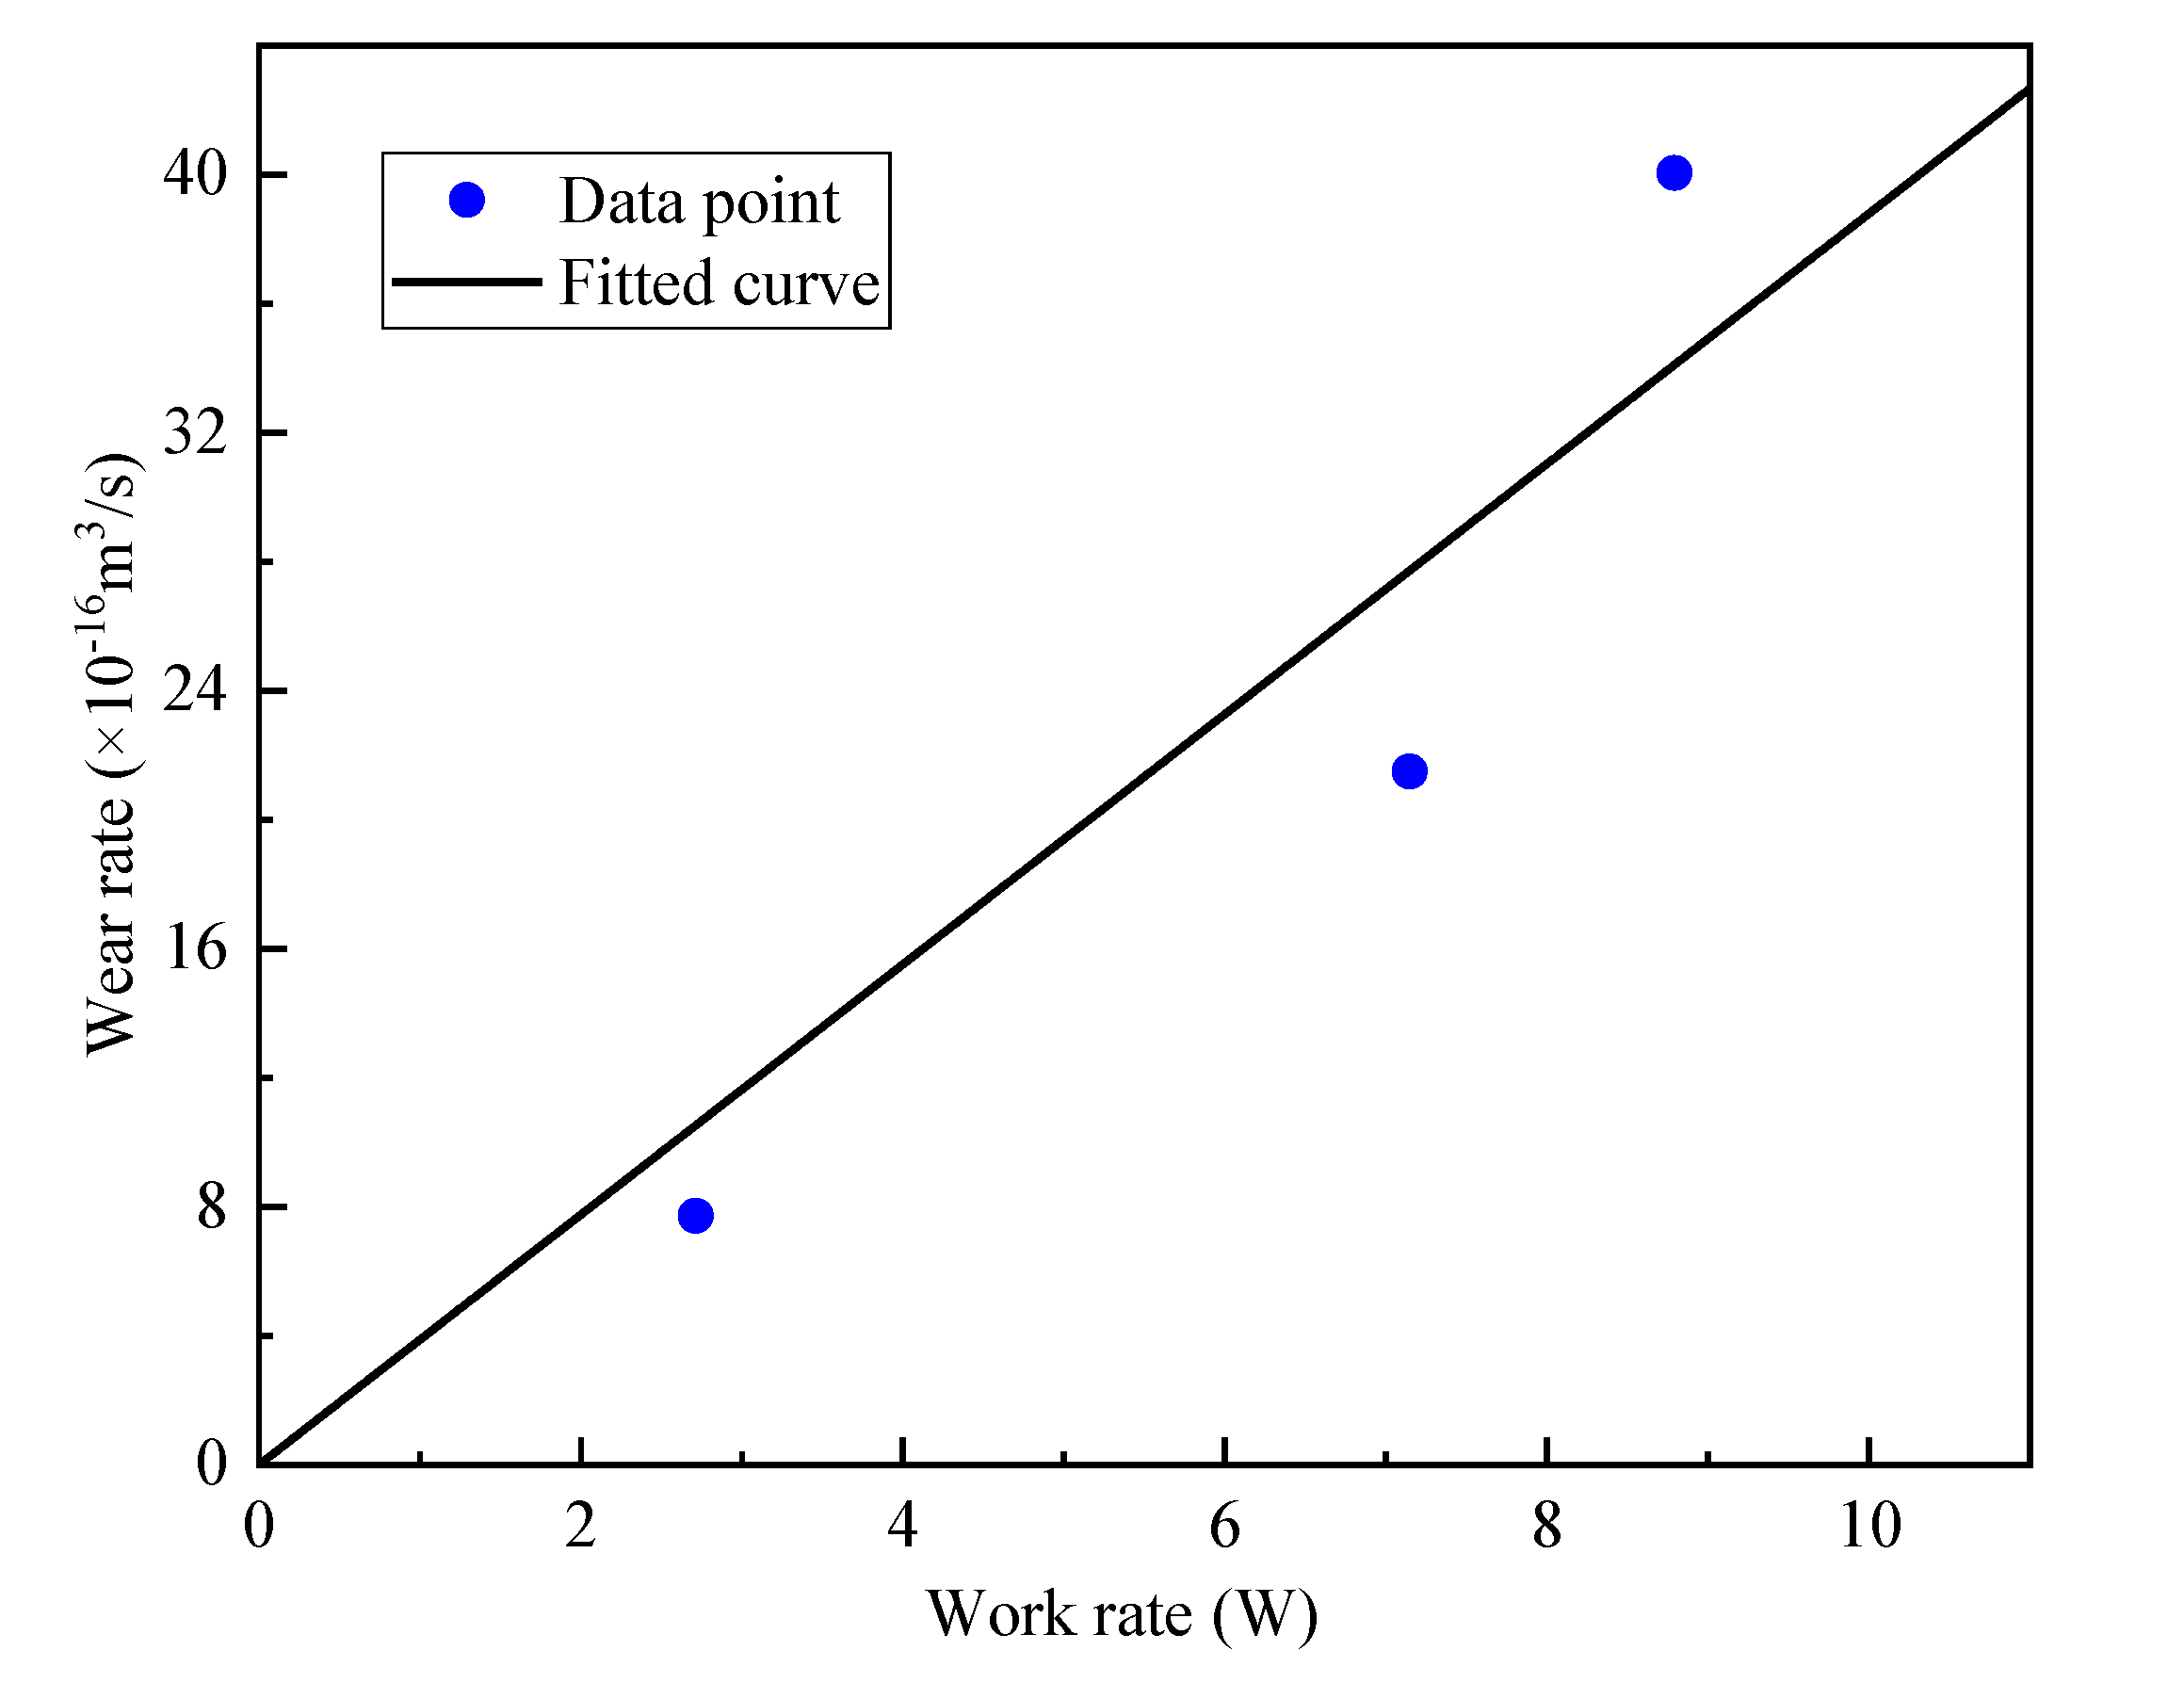
The ratio of wear rate to work rate is the wear coefficient K. However, the normal force at contact position is not easy to obtain in the experiment since it is affected by the clamping force and the excitation force. We extract normal force and sliding distance in the finite element model to attain the wear coefficient K of the tube in our experiment. The premise is that finite element results can approximate experimental results.
Therefore, we compared acceleration at the top of the pole with that in the simulation, as shown in Figure 13. It can be seen that the two are highly compatible.
The wear rate corresponding to the work rate is shown in Figure 14. Wear coefficient K of the tube can be obtained as 3.9 × 10⁻¹⁶ Pa−1 via linear fitting.
However, the method for calculating the wear coefficient with the work rate obtained by the finite element analysis is relatively simple. There are still some details that have not been considered in this method, which still needs to be improved.

5. Conclusions

The influence of contact force on wear behavior cannot be ignored. Natural frequencies of the tube under different clamping forces were measured in our work. Moreover, dynamic behavior analysis of tube vibration was carried out to obtain the friction energy of the tube. Finally, wear experiments under different clamping forces were completed to verify the conclusion of dynamic wear behavior analysis based on the finite element method. The following conclusions are drawn.
  • The main frequency of the double-span tube shifts to a higher frequency while the clamping force increases. Moreover, the first-order natural frequency of the tube grows under an increasing clamping force.
  • The sliding distance of the tube is affected by the clamping force from results of dynamic behavior analysis. As the clamping force increases, both the sliding distance of the tube and friction energy decrease.
  • Both maximum wear depth and wear volume reduce while the clamping force increases from 53 N to 126 N under a constant excitation frequency. Furthermore, the conclusion of the experiment is consistent with that of dynamic behavior analysis.
  • Considering that the contact force of the tube is not easy to measure in the experiment, we estimate the wear coefficient through the contact force obtained by the finite element model.

Author Contributions

Conceptualization, Z.G. and W.J.; methodology, X.D., M.Z., Y.L. and L.T.; investigation, X.D. and K.X.; data curation, X.D. and K.X.; writing—original draft preparation, X.D.; writing—review and editing, M.Z. and Y.L.; project administration, M.Z. and Y.L.; funding acquisition, M.Z. All authors have read and agreed to the published version of the manuscript.

Funding

This research was funded by the National Key R&D Program of China (Project No. 2018YFC0808800), the National Natural Science Foundation of China (Project No. 11602219), and Shanghai Rising-Star Program (20QB1403000).

Institutional Review Board Statement

Not applicable.

Informed Consent Statement

Not applicable.

Data Availability Statement

Not applicable.

Acknowledgments

The authors are grateful for the support provided by the National Key R&D Program of China (Project No. 2018YFC0808800), the National Natural Science Foundation of China (Project No. 11602219), and the Shanghai Rising-Star Program (20QB1403000).

Conflicts of Interest

The authors declare no conflict of interest.

References

  1. Auvinen, A.; Jokiniemi, J.K.; Lähde, A.; Routamo, T.; Lundström, P.; Tuomisto, H.; Dienstbier, J.; Güntay, S.; Suckow, D.; Dehbi, A.; et al. Steam generator tube rupture (SGTR) scenarios. Nucl. Eng. Des. 2005, 235, 457–472. [Google Scholar] [CrossRef]
  2. Chen, X.; He, X.; Tang, L.; Li, Y.; Zhou, M.; Jin, W.; Gao, Z. A heat transfer tube wear reliability analysis method based on first-order reliability method. J. Comput. Des. Eng. 2020, 7, 803–815. [Google Scholar] [CrossRef]
  3. Phalippou, C.; Ruffet, F.; Herms, E.; Balestreri, F. PWR steam generator tube and AVB wear under perpendicular impacting. In Proceedings of the Pressure Vessels and Piping Conference, Paris, France, 14–18 July 2013. [Google Scholar]
  4. He, X.; Xu, X.; Tian, W.; Li, Y.; Jin, W.; Zhou, M. Markov stochastic process modeling for evolution of wear depth in steam generator tubes. Adv. Mech. Eng. 2019, 11, 1–9. [Google Scholar] [CrossRef]
  5. Connors, H.J. Flow-induced vibration and wear of steam generator tubes. Nucl. Technol. 1981, 55, 311–331. [Google Scholar] [CrossRef]
  6. Diercks, D.; Shack, W.; Muscara, J. Overview of steam generator tube degradation and integrity issues. Nucl. Eng. Des. 1999, 194, 19–30. [Google Scholar] [CrossRef]
  7. Pettigrew, M.J.; Taylor, C.E. Vibration analysis of shell-and-tube heat exchangers: An overview—Part 2: Vibration response, fretting-wear, guidelines. J. Fluids Struct. 2003, 18, 485–500. [Google Scholar] [CrossRef]
  8. Fricker, A.J. Numerical analysis of the fluidelastic vibration of a steam generator tube with loose supports. J. Fluids Struct. 1992, 6, 85–107. [Google Scholar] [CrossRef]
  9. Lalonde, V.; Ross, A.; Pettigrew, M.J.; Nowlan, I. Experimental Study of Dynamic Interaction Between a Steam Generator Tube and an Anti-Vibration Bar. In Proceedings of the ASME 2010 3rd Joint US-European Fluids Engineering Summer Meeting collocated with 8th International Conference on Nanochannels, Microchannels, and Minichannels, Montreal, QC, Canada, 1–5 August 2010. [Google Scholar]
  10. Nowlan, I.; Ross, A.; Pettigrew, M.J. Dynamic Interaction Between a Straight Tube and an Anti-Vibration Bar. In Proceedings of the Asme Pressure Vessels and Piping Division Conference, Prague, Czech Republic, 26–30 July 2009. [Google Scholar]
  11. Mi, X.; Bai, X.; Tang, P.; Xie, H.; Peng, J.; Zhu, M. The role of the third body in the fretting wear of 690 alloy. Int. J. Mod. Phys. B 2020, 34, 2050077. [Google Scholar] [CrossRef]
  12. Soria, S.R.; Tolley, A.; Yawny, A. Running condition and material response fretting maps of incoloy 800 steam generator tubes against AISI 304L pads in air and room temperature. Tribol. Int. 2019, 135, 408–420. [Google Scholar] [CrossRef]
  13. Mi, X.; Wang, W.; Xiong, X.; Qian, H.; Tang, L.; Xie, Y.; Peng, J.; Cai, Z.; Zhu, M. Investigation of fretting wear behavior of Inconel 690 alloy in tube/plate contact configuration. Wear 2015, 328, 582–590. [Google Scholar] [CrossRef]
  14. Tang, P.; Mi, X.; Zhang, J.; Xiong, F.R.; Zheng, B.; Shao, X.J.; Peng, J.F.; Zhu, M.H. Evolution of wear damage in 690 alloy tube mated with 405 stainless steel plate due to fretting conditions. Tribol. Int. 2021, 163, 107177. [Google Scholar] [CrossRef]
  15. Chung, I.; Lee, M. An experimental study on fretting wear behavior of cross-contacting Inconel 690 tubes. Nucl. Eng. Des. 2011, 241, 4103–4110. [Google Scholar] [CrossRef]
  16. McColl, I.R.; Ding, J.; Leen, S.B. Finite element simulation and experimental validation of fretting wear. Wear 2004, 256, 1114–1127. [Google Scholar] [CrossRef]
  17. Guan, H.; Cai, Z.; Ren, Y.; Jing, J.; Wang, W.; Zhu, M. Impact-fretting wear behavior of Inconel 690 alloy tubes effected by pre-compressive stress. J. Alloys Compd. 2017, 724, 910–920. [Google Scholar] [CrossRef]
  18. Ming, H.; Liu, X.; Lai, J.; Wang, J.; Gao, L.; Han, E. Fretting wear between Alloy 690 and 405 stainless steel in high temperature pressurized water with different normal force and displacement. J. Nucl. Mater. 2020, 529, 151930. [Google Scholar] [CrossRef]
  19. Zhang, W.; Cui, D.; Ying, Y. Nondestructive measurement of pear texture by acoustic vibration method. Postharvest Biol. Tec. 2014, 96, 99–105. [Google Scholar] [CrossRef]
  20. Archard, J.; Hirst, W. The wear of metals under unlubricated conditions. Proc. R. Soc. A 1956, 236, 397–410. [Google Scholar]
  21. Xin, L.; Yang, B.; Wang, Z.; Li, J.; Lu, Y.; Shoji, T. Effect of normal force on fretting wear behavior and mechanism of Alloy 690TT in high temperature water. Wear 2016, 368, 210–218. [Google Scholar] [CrossRef]
  22. Ming, H.; Liu, X.; Zhang, Z.; Wang, J.; Han, E. Effect of normal force on the fretting wear behavior of Inconel 690 TT against 304 stainless steel in simulated secondary water of pressurized water reactor. Tribol. Int. 2018, 126, 133–143. [Google Scholar] [CrossRef]
  23. Ryu, K.W.; Park, C.Y.; Kim, H.N.; Rhee, H. Prediction of Fretting Wear Depth for Steam Generator Tubes Based on Various Types of Wear Scars. J. Nucl. Sci. Technol. 2010, 47, 449–456. [Google Scholar] [CrossRef]
Figure 1. Experimental setup.
Applsci 12 02163 g001
Figure 2. Anti-vibration bar assembly: (a) bar support; (b) AVB; (c) force transducer.
Applsci 12 02163 g002
Figure 3. Flowchart of the control system.
Applsci 12 02163 g003
Figure 4. Mesh generation.
Applsci 12 02163 g004
Figure 5. The natural frequency of the single-span tube.
Applsci 12 02163 g005
Figure 6. Natural frequencies of the first order under different clamping forces (double-span tube).
Applsci 12 02163 g006
Figure 7. Natural frequencies of the double-span tube under different clamping forces.
Applsci 12 02163 g007
Figure 8. Static finite element analysis: (a) schematic diagram of static loading; (b) clamping force-displacement curve.
Applsci 12 02163 g008
Figure 9. (a) Friction energy in each cycle; (b) Maximum sliding distance and average friction energy under different clamping forces.
Applsci 12 02163 g009
Figure 10. Irregular flat-shaped wear scar: (a) n regular flat-shaped scars; (b) wear scar in A-A view.
Applsci 12 02163 g010
Figure 11. 3D morphology of wear scar and worn surface under operating conditions: (a) clamping force of 53 N; (b) clamping force of 80 N; (c) clamping force of 126 N.
Applsci 12 02163 g011
Figure 12. Wear depth under different clamping forces: (a) clamping force of 53 N; (b) clamping force of 80 N; (c) clamping force of 126 N.
Applsci 12 02163 g012aApplsci 12 02163 g012b
Figure 13. Comparison of acceleration at excitation position.
Applsci 12 02163 g013
Figure 14. Wear rate and work rate of the tube.
Applsci 12 02163 g014
Table 1. Parameters of modeling.
ParameterValue
Material propertyYoung’s modulusE = 211 GPa
Poisson’s ratioΥ = 0.3
DensityΡ = 8190 kg/m3
Geometric parameterLength2985 mm
Outer diameter17.48 mm
Thickness1.01 mm
Table 2. The first three natural frequencies of the tube.
First-OrderSecond-OrderThird-Orderδave
Experimental result9.766 Hz28.564 Hz57.373 Hz/
Clamped supported11.821 Hz32.567 Hz63.800 Hz0.160
Simply supported5.2165 Hz20.860 Hz46.915 Hz0.328
Table 3. Maximum wear depth and wear volume under different clamping forces.
Fc (N)hmax (μm)Percentage of tVtotal (μm3)
5323.702.35%7.20894 × 10⁷
8020.101.99%3.86827 × 10⁷
12616.341.62%1.38893 × 10⁷
Fc: clamping force; hmax: maximum wear depth; t: thickness of the tube.
Publisher’s Note: MDPI stays neutral with regard to jurisdictional claims in published maps and institutional affiliations.