Abstract
The advent of social networks and micro-blogging sites online has led to an abundance of user-generated content. Hence, the enormous amount of content is viewed as inappropriate and unimportant information by many users on social media. Therefore, there is a need to use personalization to select information related to users’ interests or searchers on social media platforms. Therefore, in recent years, user interest mining has been a prominent research area. However, almost all of the emerging research suffers from significant gaps and drawbacks. Firstly, it suffers from focusing on the explicit content of the users to determine the interests of the users while neglecting the multiple facts as the personality of the users; demographic data may be a valuable source of influence on the interests of the users. Secondly, existing work represents users with their interesting topics without considering the semantic similarity between the topics based on clusters to extract the users’ implicit interests. This paper is aims to propose a novel user interest mining approach and model based on demographic data, big five personality traits and similarity between the topics based on clusters. To demonstrate the leverage of combining user personality traits and demographic data into interest investigation, various experiments were conducted on the collected data. The experimental results showed that looking at personality and demographic data gives more accurate results in mining systems, increases utility, and can help address cold start problems for new users. Moreover, the results also showed that interesting topics were the dominant factor. On the other hand, the results showed that the current users’ implicit interests can be predicted through the cluster based on similar topics. Moreover, the hybrid model based on graphs facilitates the study of the patterns of interaction between users and topics. This model can be beneficial for researchers, people on social media, and for certain research in related fields.
1. Introduction
There is no doubt that the internet and the services it provides have achieved great success and popularity worldwide. The internet has led to a total transformation of society by creating virtual societies comprised of groups of people who, despite not actually meeting in person, can share ideas, opinions, data, and information. As a result, the internet has given rise to a variety of information sharing networks, such as online social networking sites (OSN) and web forums [1]. The social aspects of the internet have created a large community of users who rely on the internet as a source of information, communication tools, shopping, and much more. The emergence of these various tools and functions represents the inception of social media [2].
Social media is becoming increasingly widespread; statistics published in 2020 indicate that the total number of internet users surpassed 4.41 billion. Statistics indicate that by 2025, the number of users will be 6.3 billion, representing an increase of approximately 24% [3]. This growth in social media use has resulted from the spread of internet-enabled mobile devices such as smartphones and tablets. Due to their ability to connect to internet, these devices facilitated access to the outside world (the internet). Furthermore, the internet includes a number of applications and programmes that have made it easier for users to search for and access information, knowledge and news, as well as to communicate with other people in various locations, eliminating the constraints of space and time. Platforms such as Facebook and Twitter have become an essential part of everyday life for many individuals. Additionally, the use of social media has surpassed being an outlet only for those who prefer interacting in cyberspace by also permitting interactions that would otherwise not be possible due to distance, time differences or events such as disasters or epidemics. While it was once a means of communication between users through text messages, pictures, and videos, social media growth has imposed close interrelationships between individuals and institutions. Furthermore, platforms have been developed that bring consumers and companies, as well as citizens and governments, together. The platform through which a user communicates can achieve numerous goals for all parties, including electronic marketing; diffusion of knowledge, information and news; direct communication; and prioritising the requirements of customers and achieving their satisfaction.
The remarkable evolution of social media platforms and the enormous amount of information and content that users generate can cause confusion and distraction to users and can consume users’ time. Hence, social media users find it difficult to obtain information close to their interests or that concerns them. At the same time, the abundance of information that users produce provides new possibilities for extracting user interests, which can then be used to offer users personalised recommendations, thereby alleviating the problems of time consumption and user distraction. Therefore, many service providers personalise content for end-users, such as job recommendations on LinkedIn, friend recommendations on Facebook, video recommendations on YouTube, and follower suggestions on Twitter and Instagram. Modelling user interests is key to personalisation and recommendation systems, and social media is a remarkable source of knowledge of user interests.
Modelling users’ interests can be achieved by collecting the facts a user presents about themselves through their posts and other information they provide. However, user interest models should not rely too heavily on answers provided explicitly by the user. Rather, a user interest profile should make inferences based on users’ activities and impacts on social media. One of the disadvantages of relying on the expressed interests of users during the registration process is that, oftentimes, the user is not able to provide accurate information because they may not know the answers, do not want to talk about them, or fill the responses in quickly to access the provided service. Moreover, users interest their expressed during the registration cannot automatically adjust to shifts and changing in users’ interests.
User interest prediction methods that auto-discover users’ preferences for active social media topics have emerged as a growing research area due to their potential to enhance the effectiveness of applications such as retweet prediction [4] and news recommendations [5]. The majority of current user interest identification research focuses on inferring explicit interests based on the written data provided by users [6,7]. However, most social network users are inactive, and the content available to them is limited and does not reveal enough information about their interests; this is known as the sparsity problem. In contrast, new users do not offer historical information or any content and, therefore, personalised recommendations cannot be made for them; this is known as the cold start problem. Nonetheless, many researchers still try to solve these two problems by modelling user interests and focusing on inferring users’ implicit interests (has explanation in Appendix A) [8,9].
Many researchers have introduced a graph-based relation prediction system that integrates user and topic parameters into a single representation model to examine the appropriateness of users’ social interactions and topic connectedness in implicit interest identification [10,11]. However, user modeling (has explanation in Appendix A) and mining users’ interests face many problems that affect the efficiency and reduce the quality of the system. In addition, almost all of the emerging research suffers from significant gaps and drawbacks. Firstly, user modeling refers to capturing specific aspects of a particular user. It can also express it in the user’s actual representation, through which it can explore the user’s interests. For example, there is a user on Twitter, so the tweets’ text represents the central part of modeling this user. Moreover, most research focuses on one fact of representing the user’s interests and neglecting other significant facts that precisely influence and support user modeling, such as the user’s personality and demographic data (has explanation in Appendix A). Based on user modeling’s various dimensions, users’ multiple aspects and views are considered, instead of focusing on user content only. Multi-faceted user interest profiles (has explanation in Appendix A) should be given further consideration, as prior research has shown that they are more effective than a single facet [12]. Secondly, relevant and related factors in inferring users’ interests include the significant relationships between users and the relationships between topics. Moreover, studying the interaction patterns between the users and the topics helps to infer the users’ implicit interests. On the other hand, the researchers provided a hybrid diagram-based model to represent the topics and users. However, the field still requires further investigation and possesses some limitations, e.g., whether the user’s interests are meaningful, or whether they are linked together cooperatively. In other words, if the user holds an explicit interest (has explanation in Appendix A) in a topic, one can infer that the user may also be interested in topics linguistically or collaboratively related to their explicit interests [13,14]. Thirdly, providing a recommendation or customizing a tremendous amount of information based on users’ interests still suffers from a cold-start problem due to the lack of information available to new users. Researchers have presented solutions to this problem; however, it still requires further investigation [13,14,15]. Finally, even though there are several investigations in this field, they do not compare their suggested approach with earlier studies, leading to a shortage of common datasets and benchmarks in the perspective of user interest modeling from social networking sites [12,13]. Therefore, this paper aimed to propose a model for mining the explicit interests of social media users by modelling users and topics based on their similarities, according to essential factors in identifying similar users and topics. Furthermore, it aimed to examine the interaction patterns between users and topics through a hybrid graph based on clustering to model user interrelationships and topic interrelationships. Besides, the proposed model contributes to alleviating the cold start problem (has explanation in Appendix A). There are three types of experiments that have been carried out to achieve the research objectives. In the first experiment, we extracted each user’s interests, in addition to clustering similar topics into clusters. In the second experiment, found similarities between users based on a combination of factors. The third experiment generated a heterogeneous graph based on users and topics. The quality and performance of the interest topics that have been inferred for each user was determined using hamming loss, precision, recall, f1-score, accuracy, and match score as essential aspects. Moreover, performance was evaluated by measuring the inferred interest against actual interests obtained from users’ tweets and biographies. Based on ground truth, the results accuracy was 85%, as we reviewed the exiting methods in our study [16].
The contributions of this research can be viewed from four points:
- Building a novel model that extracts the explicit and implicit user interests’ topics: dependence on user modelling based on multi-faceted demographic data, big five personality (has explanation in Appendix A) traits and interests topics. Demographic data include user age and gender, while big five personality traits include openness, conscientiousness, extraversion, agreeableness, neuroticism. On the other hand, the big five model is the most popular and B extensively used in the literature to determine personality trait.
- Alleviating the cold start problem on social media: finding similar users to new user; these users must be similar in age, gender and personality traits, as these factors greatly affect the interests of the users.
- Building a heterogeneous hybrid graph model that examines the patterns of interaction between users and topics, as well as finding implicit user interests based on topics clustering and semantic similarities between topics.
- Building introductory dataset including factors that have been studied in this research that influence and support explicit and implicit user interests mining.
This research answers the following research questions:
Q1: What effects do demographic data, big five personality traits and interests’ topics hold on making inferences about users’ interests?
Q2: Does multi-faceted user modelling mitigate the problem of cold start?
Q3: How effective is the hybrid model based on a heterogeneous graph between user and topic to enhance inferences about implicit user interests?
The remaining sections of this paper are organized as follows. In Section 2, we presented related studies in user interests mining. Section 3 discussed proposed materials and methods. In Section 4, we presented our experiment and results. In Section 5, we discussed our results. The final section concludes the paper with a summary.
2. Related Studies
This section presents an extensive review of the literature on all studies related, directly or indirectly, to exploring users’ interests mining methods [17,18]. Another name for mining users’ interests is personalized recommendation systems. It works the same as regular recommendation systems but differs from it by looking for topics of interest to the user instead of items. We also reviewed the literature on heterogeneous information networks [7,19,20,21] which is the nature of the social network, recommendation systems [22,23,24], and personality computing [25,26,27].
Kang and Lee [28] proposed a novel approach to recognize users’ explicit social media interests by outlining social data through newsgroups. The proposed framework consists of a term-based feature generator to converts individual documents from a message of a social media user (internal information source) or newsgroups into a term vector. Moreover, they solved the gap among messages from social media and news categories by using a term-based feature generator. On the other hand, the framework consists of Wikipedia-based feature generators (external information source).
Shi et al. [29] proposed an original embedding method to embed the heterogeneous information network. The embedding of the recommender system with a heterogeneous information system is termed as the HERec method and includes two main components. First, they proposed a novel heterogeneous network (has explanation in Appendix A) embedding technique to examine the user/object embedding from HINs. Next, they increased the classic matrix factorization method via means of incorporating the discovered embedding using an amenable set of fusion functions.
Herce-Zelaya [30] proposed a recommendation method through a predictive representation using behavioral data derived from social media to alleviate the cold start problem. In addition, the aimed to identify users and create predictions based on this classification using machine learning methods such as random forests and classification trees [31]. The approach of this study will be based on the use of random forests and decision trees. The point of departure is a model to treat the social stream for each indivisible user.
Ferwerda & Schedl [32] developed a framework for music recommendation using the personality characteristics of users as the fundamental model. They explored various methods to extract personal features of users from user-generated information on social networking sites and links between the personality of users and their actions, interests and needs. Their study resulted in new approaches to exploitation and personality models and showed how these models can be used for the better use of the user experience with a music advisory framework.
Ferwerda et al. [33] aimed to see if there were any variations in music listening habits between age categories. They examined at a dataset that included 1415 users’ music listening histories as well as details about their personalities. Their findings corroborate previous research that identified personality-based music listening preferences. Their findings, however, indicate that the contracts they discovered are often split into different age groups, while in other cases, additional associations were discovered within age groups. Based on findings, personality-based systems can make accurate song recommendations that are appropriate for the user’s age.
Tkalčič et al. [34] introduced a novel method for computing user similarity in collaborative-based recommendation systems based on the five-factor personality model. Experimental findings demonstrated that the developed measures work as well as or more accurate than ratings-based measures used in state-of-the-art collaborative filtering frameworks. This proves that the emerging method for measuring user similarities, with its advantages in terms of computation time, is a very interesting one for its potential to actually impact collaborative recommendation.
The point of view used to analyze the rest of the literature covered in this research is through looking at how they solve the user interests mining problem. The factors considered are the type of study, demographic data, personality, heterogeneous information network, user content, and approach, as shown in Table 1. As a note, most of the studies did not use demographic and personal data with each other. Besides that, most of the content they studied are ratings of products instead of extractions of the topic of interest from the users’ textual content.

Table 1.
Summary of important factors in the literature.
3. Materials & Methods
The research proposes a novel model for mining user interest from social media based on personality and demographic data. Moreover, it proposes an interactive social network graph based on clustering. The proposed system can increase the accuracy of the system and alleviate the cold start problem. The mining of user interest consists of two main phases: topic modelling and user modelling. First, the topic modelling phase aims to extract interest topics for each user and to find similar topics based on semantic similarity. Furthermore, it builds a cluster of similar topics. Second, the user modelling phase aims to find similar users and relationships between users based on substantial factors.
The purpose of the mining process is to present and recommend topics of interest to a user or to find similar people with similar interests. Finding a closely related topic or similar user can alleviate the cold start problem. The problem with the cold start is that, if a new user joins the social network, there is no available or historical information that can contribute to finding people who are similar to this user or topics that may be of interest. The appropriate solution is to examine different factors to find patterns of similarity between the users. Therefore, the decision can be taken to find similar users to this new user from the current network users. Consequently, this new user can be offered the appropriate recommendation.
Several methods have been proposed in the mining system of user interests, but most suffer from a major issue, which is a cold start. Several researchers have attempted to address the cold start problem; however, they were largely unsuccessful. Some studies suggest demographic data as a solution to this problem, while others suggest personality [39,40,41]. Each of them plays a critical role in determining the interests of users, as the users’ personality represents a rich and explicit source of prediction of interests, as is the case with demographic data. Nevertheless, the fact that demographic and personal data are complementary to each other is often neglected; both are indispensable for predicting and recommending users’ interests. Therefore, this research proposes a hybrid method combining personality traits, demographic features, and topics of interest with the traditional calculation of score-based similarities. Personal data was primarily classified into five personality characteristics: openness, consciousness, agreeableness, consent, and neuroticism. Figure 1 shows the general system architecture for the mining process and extracting topics of interest.

Figure 1.
General System Architecture for Mining User Interest from Social Medial.
The previous researchers have also neglected to study the relationships and the extent of closeness between topics into a cluster to predict implicit users’ interests. For instance, if user A is interested in several topics and a considerable part of them are in the same cluster, it can, therefore, be expected that the rest of the cluster topics are important to this user.
In this research, two factors to extract the users’ interests were considered: (1) the demographic/personality/interests topics similarities through users, and (2) the semantic similarities through interests’ topics, as shown in Figure 2.
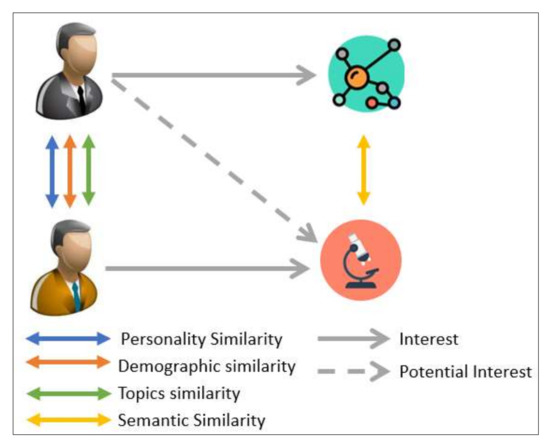
Figure 2.
Proposed Approach to Find Similar Users and Topics.
3.1. Model Architecture
This section presented a model that clarifies the stages of work required to achieve the final objectives. The proposed model is shown in Figure 3. This model consists of five primary phases: data collection, data pre-processing, topic modeling, users modeling and graph modeling. The first phase consisted in collecting data and building the dataset and including the essential factors in implementing the proposed idea. Next, the data is cleaned and prepared for work. The proposed idea consists of three phases: topic modeling, user modeling, and graph modeling. These are examined in the following subsections.
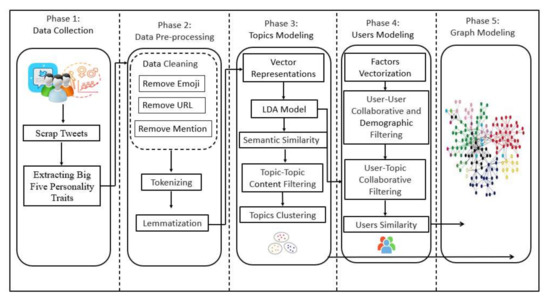
Figure 3.
Proposed Model.
Extracting users’ interests through the posts they publish on social media sites or discovering the topics in which they are interested is not an easy process. It requires a lot of time to read all the user’s tweets and then judge their interest. Accordingly, extracting interests requires analyzing and mining texts by topic modeling. Topic modeling identifies keywords clusters that often co-occur in user posts. Moreover, the keywords in a topic with the highest probability reveal what the topic is about [42].
Let D = {} be a set of documents, where each document represents a collection of texts generated by a single user. For example, document one represents all texts generated by the first user only, and document two is generated by the second user, and so on. In order to transform the documents, bag-of-word (BOW) vector representations were applied. Subsequently, latent Dirichlet allocation (LDA) was employed to extract a set of interested topics [43]. This is subsequently carried out for each user Z = {}. In order to ascertain the close relationships and semantic similarities between the topics, fasttext word embeddings were applied [44]. In fasttext, each word appears as a bag of character n-gram, which is the adjacent series of n items from a specific character or word sample. This process is reliant on the skip-gram model, where the objective of this model is to maximize the log-likelihood and scoring function s, and is calculated as follows:
where is the set of n-grams appearing in word w, associate each vector to each n-gram and represent word vector. Additionally, the k-means algorithm is applied to cluster extracted topics based on semantic similarities.
3.2. User Modeling
User modeling represents all types of information related to user and user context. In this research required user information: personality, demographic data, and interest topics and similarities between users [45].
The similarities between users relied on three substantial factors: personality, demographic data, and interest topics. More specifically, it is supposed that U = {} is the set of users and is the big five personality trait, vector, is the demographic data vector, and is the interest topics vectors for specific user u. To measure the similarity between users based on personality (user to user similarity), the Pearson correlation is used between the personality traits vector, as shown in the following equation:
The notations used in this equation are explained in Table 2.
Table 2.
Notation Used in Personality Similarity.
Demographic data in terms of age and gender were used to define similarities between users based on demographics (user to user similarity). Potential gender-based preferences were considered, that is, perhaps male interests differ from females. On the other hand, the age group plays a crucial role in determining the interests, as the interests of teenagers differ from the interests of the young, and the interests of the elderly. In this case, cosine similarity is used, as demonstrated in the following equation:
where represent age and gender vector for users u and v, respectively.
Similarity between users based on interested topics (user to user similarity), count vectorizer was applied to transform interested topics for each user, and for this case, cosine similarity was used as in demographic similarity. Our analysis was based on these three factors rather than relying on one singular aspect only, such as users’ personality or demographics. In other words, the users’ personalities may be similar, but their interests may differ. For example, there may be two similar users in terms of personality, where the first user is 15 years old and the second user is 50 years old; hence, they will not have the same interests despite their similarities in personality. Therefore, demographic data and personality characteristics complement each other and cannot be dispensed. Nevertheless, interest topics are the most critical factor in determining the similarity between users because they express real interests coming from the users themselves. Consequently, the final equation to find similar users can be expressed as follows:
where refers to similarity based on personality, indicate to similarity based on demographics, indicate similarity based on topics and is a weight parameter controls the percentage of similarity between users.
Personality and demographic data hold the same weight, and interest topics hold a higher weight, which affects the similarity between users and allows one to determine the patterns of social network users with higher accuracy. On other hand, there are potential interactions between demographics and big five characteristics by deriving single similarity measures that combines personality and demographics. However, this is outside the scope of the current study.
The user modelling phase is described in Algorithm 1. Firstly, this algorithm is defined to find a similarity between any two users based on substantiality factors. The first factor in observing similarities and studying relationships between users is personality traits. The vector of the big five personality must be established for each user, then the similarity between users can be computed using the Pearson correlation (line 5–8). The second factor is demographic data. Hence, the vector of age and gender must be established for each user so as to enable the computation of similarities between users based on demographics. To calculate similarity, the cosine similarity measure is utilised (line 9–12). The third factor depends on the interested topics extracted for each user. Actually, every user holds a number of topics of interest. Consequently, vectors for these topics are created, which then enables the cosine similarity measure to be applied to users with similar interests (line 13–16). After that, we adjusted the weight factor to control the percentage of similarity between users. Both demographic and personality data take an equal weight in importance, while the interested topics take a higher weight for their matter in evaluating the similarity results (line 17–18). Finally, similarities between users were identified based on these three factors, which makes a significant contribution to effectively solving the cold start problem (line 19–20).
| Algorithm 1 Get Similarity between Users | |
| 1: | Input: |
| 2: | |
| 3: | Output: Similarity between Users |
| 4: | |
| 5: | Compute Similarity of big five personality traits |
| 6: | |
| 7: | |
| 8: | |
| 9: | Compute similarity based on demographic data |
| 10: | |
| 11: | |
| 12: | |
| 13: | Interested topics extracted from each user |
| 14: | |
| 15: | Calculate similarity from topic vectors |
| 16: | |
| 17: | Set weight |
| 18: | |
| 19: | Get Users similarity |
| 20: | |
| 21: | End |
3.3. Graph Modeling
The section describes the graph modelling of the proposed model. Graph modelling depends on graph theory and consists of nodes and edges. Due to the focus on the three specific areas (users and the relationships between them, topics and their relationships to each other, and the orientation between users and interested topics for each user), the proposed system is represented as a heterogeneous graph [46]. This differs from a homogeneous graph where all vertices represent identical entity classes, and all the edges link them [47]. Generally, this heterogeneous network consists of a users’ graph and a topics graph. In the user graph, nodes will be users in a social network and edges connect similar users and have a weight of similarity. On the other hand, topics graph nodes will be topics in social media network which users discuss around. Furthermore, edges in topics graph connect similar topics and possess a weight based on semantic similarity, as shown in Figure 4.
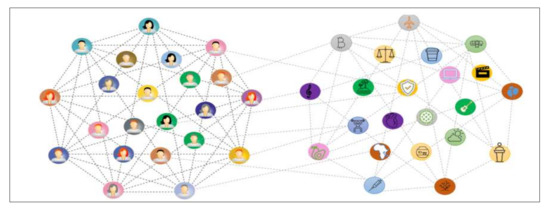
Figure 4.
Users-Topic Heterogeneous Graph.
Subsequently, the topics are closeted in the topics graph to study the interests of users with a clarity and certainty, as the interests of users can be concentrated in one cluster. This facilitates recommendations for this user in terms of topics from the clusters that are concentrated in the user interest topics, as shown in Figure 5.
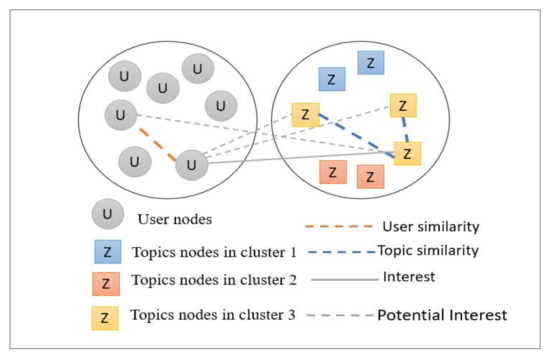
Figure 5.
The Proposed Clustering Idea.
There are also a set of topics Z and a set of users U, as illustrated in Figure 6. Moreover, the model is represented as a heterogeneous graph G that is constructed from the merger of three subgraphs, such that . In the first case (User to User), the vertices of : U → U represent a set of users, whereas its edges represent user relationships (user similarity, which is primarily personality relationships, demographic similarities, and topics similarity). For the second case (Topic to Topic): Z → Z, the vertices represent a set of users, whereas its edges represent topics relationships (semantic similarity).
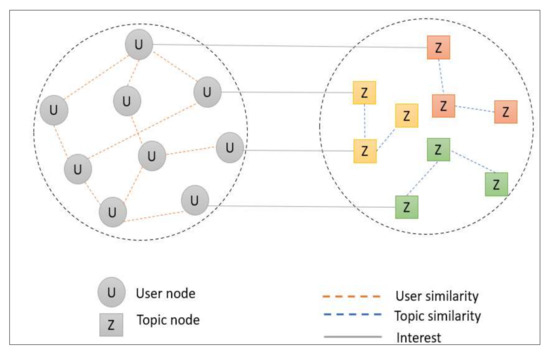
Figure 6.
The Proposed Schema of Heterogeneous Graph.
Additionally, it establishes interest topics in clusters. For the third case (User to Topic) : U → , this is a directed graph in which each edge links user and topic when user u is interested in a topic z.
In other words, in the graph network, there are three types of links, as shown in Figure 7. The first type is based on collaborative and demographic filtering (User similarity), as presented in Figure 7a. The second type represents the users’ interest in a specific topic, as shown in Figure 7b. The final type is based on the content filtering (Topics similarity), as depicted in Figure 7c.

Figure 7.
Link Types in Heterogeneous Graph.
The generation users graph is described in detail in Algorithm 2. The initial building of the heterogeneous graph was carried out by generating three subgraphs: user-user graph, topic-topic graph, user-topic graph. In the user-user graph, was assigned as the new empty graph, where node represented the user and edge represented similar users (line 4–5). User nodes were created and added to the user graph and the node attributes were set as gender and age (line 6–10). The edges between users mean this user is similar, which is based on threshold value; for example, if user A is similar to user B according to the similarity matrix and measures calculated in the previous section, and based on threshold value, then a link between these two nodes is added and weight is assigned to it. The weight between the nodes denotes the similarity value (line 12–18).
The generation topics graph is described in detail in Algorithm 3. First, semantic similarity (has explanation in Appendix A) between topics is found (line 4). Moreover, Z = { } is the set of topics where denotes the set of interesting topics for user u. Next, the k-means algorithm is applied, resulting in a set of k cluster centres. An issue here was that some topics belong to more than one cluster, but this was resolved by defining the top cluster per topic, as well as by finding all clusters containing this topic with a score for this topic in each cluster. Next, the highest score is selected for the topic and it is assigned to this cluster (line 5–13). For the topics graph, the same procedure as the user graph was followed; the difference will be in assigned as the new empty graph where the node represents topics in the cluster and the edge represents a similar topic based on threshold value. Furthermore, topic nodes were created and added to the topic graph and clustering is used to assign the topics node to a particular group (15–29).
| Algorithm 2 Generate User Graph | |
| 1: | Input: |
| 2: | Output: |
| 3: | Begin |
| 4: | \\ Assign as new empty graph |
| 5: | |
| 6: | \\ Add user nodes |
| 7: | for do |
| 8: | Create node for user |
| 9: | Add node to graph |
| 10: | end for |
| 11: | \\ Add user edges |
| 12: | for do |
| 13: | |
| 14: | if then |
| 15: | Create edge between , |
| 16: | Add edge to graph |
| 17: | end if |
| 18: | end for |
| 19: | return |
| 20: | End |
| Algorithm 3 Generate Topic Graph | |
| 1: | Input: |
| 2: | Output: |
| 3: | Begin |
| 4: | Initialize semantic similarity matrix between topics |
| 5: | Initialize topic cluster assignment matrix |
| 6: | k-means clustering on Z to get a set of k cluster centers |
| 7: | for do |
| 8: | |
| 9: | where is score of ith cluster of topics |
| 10: | |
| 11: | Assign topic cluster as maximum cluster |
| 12: | |
| 13: | end for |
| 14: | \\ Assign as new entry graph |
| 15: | |
| 16: | \\ Add topic nodes |
| 17: | for do |
| 18: | Create node for topic |
| 19: | Assign node group to and set node color |
| 20: | Add node to graph |
| 21: | end for |
| 22: | \\ Add topic edges |
| 23: | for do |
| 24: | |
| 25: | if then |
| 26: | Create edge between , |
| 27: | Add edge to graph |
| 28: | end if |
| 29: | end for |
| 30: | return |
| 31: | End |
The generation heterogenous graph phase is described in Algorithm 4, which is a heterogenous graph with two types of nodes: user and topic ; is assigned as the heterogeneous graph between subgraphs and. The link between user and topic represents interest; for example, user A is interested in topic C.
Finally, the data analysis process is aided and clutter in the graph network is reduced by generating an interactive graph. An interactive graph enables the visualisation of all three subgraphs: users graph, topics graph, and users to topics graph. It also allows an overview of all users interested in a specific topic. Moreover, it shows the relationships between specific users.
| Algorithm 4 Generate Heterogeneous Graphs with two types of nodes | |
| 1: | Input: |
| 2: | Output: |
| 3: | Begin |
| 4: | \\ Assign as heterogeneous graph between subgraphs |
| 5: | and |
| 6: | |
| 7: | \\ Add user topic edges |
| 8: | for do |
| 9: | |
| 10: | for each topic in do |
| 11: | Create edge between , and |
| 12: | Add edge to graph |
| 13: | end for |
| 14: | end for |
| 15: | return |
| 16: | End |
4. Experiment and Results
This section gives an overview of the results and the conducted experiments. There are three types of experiments that have been carried out to achieve the research objectives. In the first experiment, we extracted each user’s interests, in addition to clustering similar topics into clusters. In the second experiment, we found similarities between users based on a combination of factors. Moreover, we found similarities between topics based on semantic similarity. The third experiment generated a heterogeneous graph based on users and topics. Moreover, we evaluated results according to ground truth and quantitative analysis. It is a suitable method for evaluating data mining research in general, extracting interests, and studying relationships between users.
Using raw data for users from social networking sites, where this research’s priority was to deal with users individually and derive their interests through their writing, is an appropriate method to study their patterns, feelings, interests, and opinions. Moreover, we obtained the five personality traits and demographic data to conduct the rest of the proposed model phases. The description of the dataset, the experiment settings and the results of the three experiments are discussed in the next sections.
4.1. Dataset
This section focuses on explaining information about the dataset used in this research and representing its content. As mentioned in the previous section, these data were collected from Twitter in order to implement and prove the claims of this research. The primary purpose of data collection is to implement the proposed approach and model to study and verify the idea. On the other hand, no available dataset contains all the required factors to conduct the research, which is one of the reasons for building a new dataset.
Details of the collected data are shown in Table 3, which contains demographic data and big five personalities and tweets for each user. Moreover, only English language tweets were utilised for this purpose. For the users, the collected data include username, user ID, age, and gender and big five personality. For the tweet, the data collected include both tweets and reply. All were collected in the period spanning from 14 January 2021, to 1 February 2021. Moreover, the anonymization process was applied on the collected data.
Table 3.
Attributes Description of Collected Data.
Table 4 describes the age groupings of users present in the Twitter-derived dataset, wherein it is clear that almost all age groups of people in real life are represented in the derived dataset. Most of the users were aged from 19 to 40, representing youth groups. This is due to them being the group that uses the most social networking sites. However, there are a small number of social network users in the young and old categories.
Table 4.
Age Description.
The general details of data collected, as shown in Table 5, are that a total of 86,258 tweets from 100 users were collected. The number of users whose profile contained more than 1000 tweets, was 73 users; in contrast, there were 24 users with fewer than 1000 tweets. Moreover, for each user, the tweets were collected over different years; for example, a user may have 1000 tweets from 2011 to 2021, while others may only span a three-year period from 2017, etc. the gender distribution within the data set is equal, with fifty males and fifty females.
Table 5.
Dataset Description.
4.2. Experiments Settings
This section focuses on explaining the experiments that were performed to implement this research. First, this section presents the tools and devices used to implement the proposed approach and model. It then provides a conceptual description of each scenario and experiment that has been used to prove our claims. The details of these experiments are presented in the next sections in more detail, along with each experiment’s results.
This research was carried out using a Lenovo desktop device using anaconda, Jupiter notebook, and network, and the installed Python programming language, explicitly, version 3.8. It also requires configuring and preparing the environment from anaconda and installation of the libraries in this environment.
The primary purpose of the second part of this section is to provide a general description of the experiments carried out in this research, which consists of three groups of experiments. Firstly, extracting the topics of interest for each user and clustering interesting topics into different groups. Secondly, finding the relationships, similarities and differences between users along with the semantic similarities between topics. Thirdly, representing both users and interesting topics for each user in an interactive, heterogeneous graph.
The primary objective of the first group of experiments was to create a topics model representing each user’s interest topics. The first experiment applied LDA topic modelling to produce interest topics. The second experiment was based on clustering interesting topics into different groups.
The main aim of the second set of experiments was to find similar users based on the proposed approach. The similarity between users depended on three essential factors: interesting topics, big five personality traits [48], and demographic data. These experiments calculated the similarity between users based on each factor separately, while the last experiment calculated similarity based on the three factors. The second investigation aimed to find semantic similarities between the topics.
The objective of the third set of experiments was to build a heterogeneous graph with two types of node: users and topics. These experiments created a user graph and a topic graph, and combined them to create a user-topic graph. Additional functionalities were then added to ensure that the visualisations are interactive.
4.3. Interest Topics Experiment
During the first experiment, LDA models were built based on BOW to extract interest topics for each user. The inputs for the LDA model are a dictionary and corpus. Dictionaries refer to unique words in the document and possess a unique id for each word. Corpus refers to the number of times a specific word appears in each document. The training phase of LDA is considered to adjust some parameters to get optimal performance—the number of topics extracted was 8.
The results of the LDA model are a group of words with which each topic of interest is correlated, each with its own probability in relation to the topic. Of interest is that, in some situations, topic keywords might not be sufficient to understand what a topic is about. Consequently, it must find the dominant topic, which is the topic number in the user’s tweets with the highest percentage contribution. This research depends on five top dominant topics to infer interest topics for each user.
The extracted LDA topics for all users are illustrated in Figure 8. A range of interesting topics were identified, including those such as racism, games, and videos.
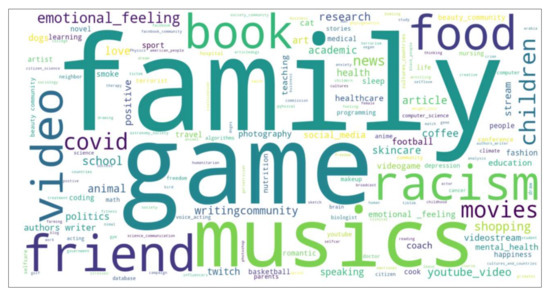
Figure 8.
The Extracted LDA topics.
This research also analysed the lengths of interest topics for each individual user. It has been observed that the lengths of users’ interests differ from one person to another, due to the fact that each person hold different interests from others, as shown in Figure 9. To illustrate this, consider that, while a given individual may have a sole focus, another may be concerned with six.

Figure 9.
Lengths of Interest Topics.
During the second experiment, k-means models were implemented based on the elbow method of choosing the optimal value for k. The main purpose of the elbow method is to ensure good results for the cluster. The optimal value of k is known when the inertia does not decrease significantly, as shown in Figure 10, where the optimal value of k is 12.
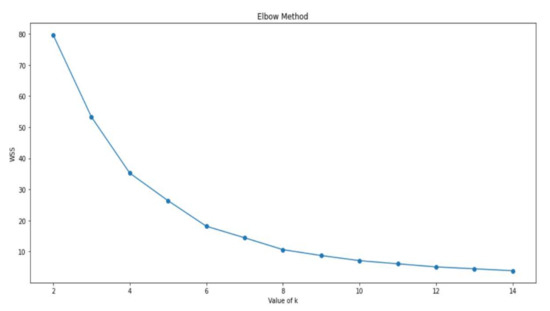
Figure 10.
Optimal k Value based on Elbow Method.
4.4. Proposed Similarity Measure Experiment
This section introduces the experiments that were performed to find similarities between users. Four experiments were conducted at this phase. The first experiment examined the similarity between users based on the big five personality traits. The following step sought out inter-user likenesses from a demography perspective. In contrast, the third study explored the similarity between users based on each user’s interests. The last experiment studied the similarities based on the enhanced equation, including the three previously identified factors: big five personality traits, demographic data, and interested topics.
During the first experiment, the similarity between users was calculated based on the big five personality traits.
The similarity between users based on personality was calculated using Pearson correlation similarity. The similarity matrix between sample of six users shown in Table 6.
Table 6.
Similarity Matrix based on Personality.
The second experiment calculated the similarity between users based on the demographic data. The demographic data in this experiment were age and gender. Data transformation was applied to these attributes to replace them with a numerical value. For example, the male is one, and the female is zero.
The similarity between users based on demographic data was calculated using cosine similarity. The resulting similarity matrix for previous sample shown in Table 7.
Table 7.
Similarity Matrix based on Demographic.
The third avenue for exploration considered topical similarities between users. The similarity data was calculated using cosine similarity. The resulting similarity matrix sample is shown in Table 8.
Table 8.
Similarity Matrix based on Topics.
The final experiment calculated the similarity between users based on three essential factors, namely the big five personality traits, demographic data, and topics of interest. Based on these three factors, the similarity between users was calculated using both Pearson correlation and cosine similarity. The resulting similarity matrix sample is shown in Table 9.
Table 9.
The Enhanced Similarity Matrix.
During the topic similarity experiment, the Gensim FastText model was applied based on word to vector embedding. The Gensim FastText model was trained with a skip-gram training algorithm. Moreover, Word vector dimensions were set up with a 60-window size. Furthermore, the worker was set up as 12, which indicates multicore machines that will allow for faster preparation.
The result of this experiment was semantic similarity between topics. For example, the semantics between the game and videogame topics were 85%, which indicated a more accurate result. Moreover, the semantic between author and writing community was 82%. Consequently, the results from the Gensim FastText model used to calculate the semantic similarity gave accurate results.
4.5. Graph-Based Experiment
This section introduces a set of experiments performed to generate the heterogeneous graph. Broadly, it can be divided into two extensive experiments, and in each investigation, a group of experiments. The first experiment creates a heterogeneous graph with two types of nodes using the NetworkX library. The second experiment creates an interactive graph based on the first using the Plotly library. Indeed, each experiment is discussed in more detail in the next subsections.
During the first experiment, the user graph was created, where the node indicated users in the dataset, and edges were drawn if users were similar. The user node contains features such as username, age, and gender. The edge or link between users possesses a weight to indicate similarity based on a threshold value. This similarity between users was based on the similarity equation calculated in the user similarity experiment. The result from this experiment was the user graph, which was useful to analyze predicting similar users and interested topics.
During the second experiment, a topic graph was created, wherein nodes indicated the topic. The topic node indicated exciting topics for all users, which were extracted from the previously described experiment inferring interest topics. In this case, an edge was drawn if topics were similar, with weight of the edge or link between topics indicating semantic similarity based on a threshold value. The semantic similarity between topics was based on the semantic similarity determined in the topic similarity experiment. The result of this experiment was the topic graph.
The third experiment starts by adjusting the position of every node in the user and topic graphs using the Kamada–Kawai path-length layout, in preparation for generating a user to topic graph. The distances between nodes for each graph are computed using the short path length method, with node position manipulated for each graph using the dictionary with nodes and adding layout x and y coordinates as node attributes. After this, the two graphs could be combined into a single heterogeneous graph with two types of node: user and topic. In this instance, the edges or links between users and topics were drawn when the user was interested in a topic node. The result from this experiment was the user-to-topic graph.
During generation of the interactive graph experiment, the heterogeneous graph drawn was obtained from the previous experiment in Plotly. Initial topic clustering was performed as described in the preceding section. The prepared user and topic nodes, along with three types of edge—user to user link, user to topic link, and topic to topic link—were plotted in a graph. The preparatory process was conducted using traces, which were used network data, and were plotted as graphical objects with specific x and y values. The legend function was then created. The result from this scenario is the user-to-topic graph drawn in Plotly, which shows topic clusters as seen in Figure 11.

Figure 11.
The sample of Heterogeneous Graph in Plotly Library.
Moreover, functionality and events have been added that facilitate analysis and reading information from the network and reduce clutter to produce a more interactive graph. Four dropdown lists were included—graph type, topic, user one, and user two (these can be seen in Figure 12). These drops are discussed in the following scenarios.
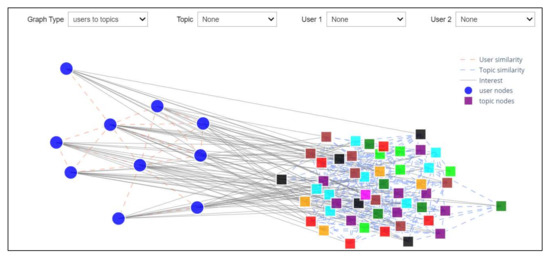
Figure 12.
Graph with Functionality.
Scenario 1: Graph Types
This scenario investigated the first drop-down list, which was able to choose the type of graph to be displayed. This drop-down list options: user-to-user graph, topic-to-topic graph, and user-to-topic graph. The first type (shown in Figure 13a) presents users along with the degree of similarity between them, which enables the study of inter-user relationships. The second type (Figure 13b) presents topics and the degree of similarity between them, which allows for the investigation of the links between given topics. The third type (Figure 13c) presents users and topics in which each user is interested.
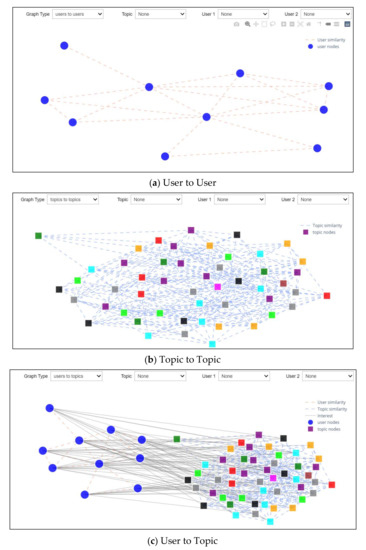
Figure 13.
Graph-Types Scenario.
Scenario 2: Interest Topics
This scenario investigated the second drop-down list and was able to choose any interest topics from it, as shown in Figure 14a. After selecting one of the topics, it will show all users interested in this topic specifically (see Figure 14b). An example of this might be that the selection of racism as the topic for consideration would provide a figure portraying three users with an interest in this subject.
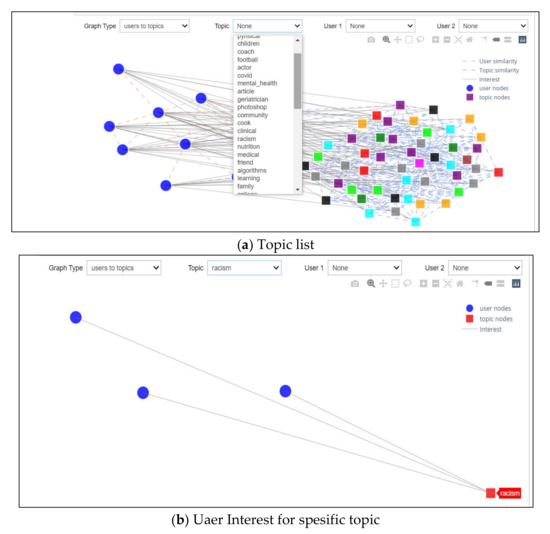
Figure 14.
Interest Topic Scenario.
Scenario 3: User Interests
This scenario investigated the third drop-down list and was able to choose any users from the drop-down list, as shown in Figure 15a. Selecting one of the users will show all topics that this user was interested in. An example of this can be seen in Figure 15b.
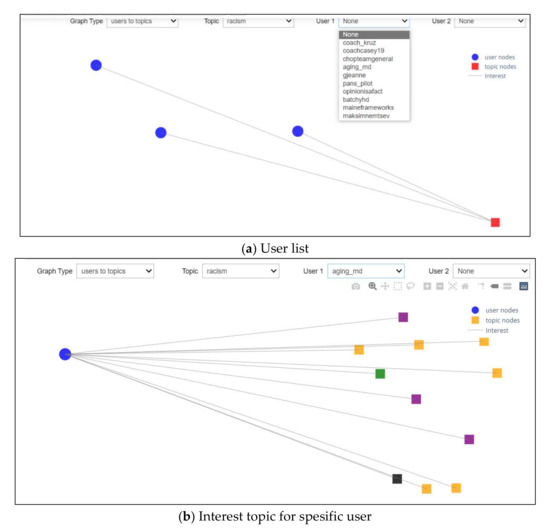
Figure 15.
User Interests Scenario.
Scenario 4: Relationships between Users
This scenario investigated the fourth drop-down list and, as shown in Figure 16a, was able to choose any users from a drop-down list. After selecting one of the users from the user list and selecting another from the third drop-down, it will produce a graphic representation of their collective interests, which enables one to study the inter-user relationships with interest topics, as shown in Figure 16a. In this example, these two users were similar and, hence, there was a link between them, while in Figure 16b, the users were dissimilar and, therefore, there was no correlation between them.
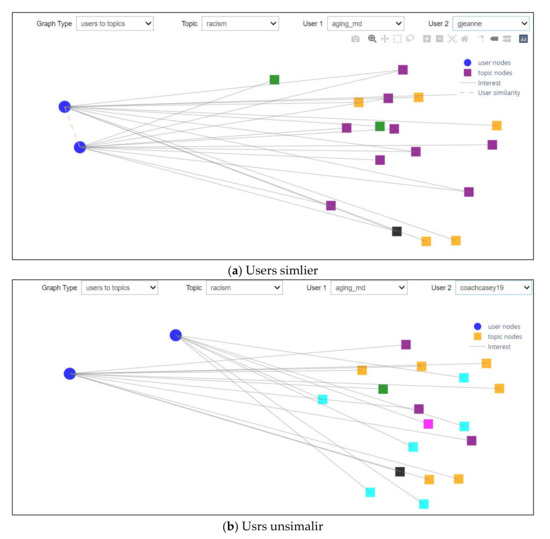
Figure 16.
Relationships between Users Scenarios.
5. Results
This section focuses on clarifying the results of this research’s evaluation from two points of view: ground truth and qualitative analysis.
The quality and performance of the interest topics that were inferred for each user were determined using a ground truth table with hamming loss, precision, recall, f1-score, accuracy, and match score are essential aspects. Moreover, ground truth is evaluated by measuring the inferred interest extracted by LDA against actual interest obtained from users’ tweets and biography. This research used hamming loss, precision, recall, f1-score, accuracy, and match score to evaluate the multi-class and multi-label data. The hamming loss consequential method for evaluating the multi-class and multi-label data, which is the number of incorrect label predictions, is calculated as:
where is a Boolean value that indicates whether the i-th predicted the l-th label and denotes exclusive OR.
Precision refers to the number of the outcomes graded as positive were truly positive and recall refers to the number of true positives recalled while F-measure depends on precision and recall. To measure the accuracy, two paramount matrixes must be calculated: sensitivity and specificity. The metric that calculates an ability to estimate true positives in each available class is called sensitivity. The metric that measures ability to anticipate true negatives is called specificity. Accuracy depends on sensitivity and specificity, while match score indicates the percentage of correct predictions over true labels. All measures used for evaluation are shown in Table 10.
Table 10.
Measures used for evaluation.
The results of hamming loss, precision, recall, f1-score, accuracy, and match score are shown in Table 11.
Table 11.
The Results of Ground Truth Evaluation.
The inferred process’s efficiency was high; precision indicates how valid the interests extracted are, while recall refers to the ability to infer a large portion of the user’s interests. It is of note that the f1 score thread contains both precision and recall, and that the accuracy percentage for topics predicted successfully as interest and properly categorised as not of interest is over the maximum number of topics of user interest. Moreover, the match score indicates the percentage of correct interest over true labels, whereas hamming loss indicates the number of incorrectly labelled interest predictions.
The above table shows that the user interests are extracted with high accuracy of 85%, which means that it extracted many of the user’s interests correctly.
In the quantitative analysis we present an analytical study of a group of users in the dataset to study similarities and differences. As a way to verify the validity of the claims presented in this research, three factors will be assessed: the big five personality traits, demographic data, and interest topics. The first to be verified is the big five personality traits factors independently, followed by the demographic data alone. The following stage considered user similarities from the perspective of their interests. Finally, the similarity was analysed based on all three factors together. All possible cases are, thus, covered in this qualitative analysis as follow:
- Case 1: Similar Personality, Demographics Data and Interests
- Case 2: Similar Personality but Different in Demographics Data (Age), and Interests
- Case 3: Similar Personality and Different Demographics Data (Age and Gender) and Interests
- Case 4: Different Personality, Interests and Similar Demographics Data (Age and Gender)
6. Result Discussion
This section provides a clear discussion of this research and explanations for the results obtained.
Social media content is rich in user interests and current trends. Predicting users’ interests is an essential part of many applications, such as custom searches and recommendations. This research addresses identifying users’ interests in social networking sites through fundamentally new factors that may alleviate the cold start problem and, thus, can propose recommendations for current users.
Moreover, it studies the relationships between users and those between the subjects of interest and determines user patterns in social networks. Social media networks consist of several users, which are often represented as nodes, with links between nodes signifying the relationships between them. This research used a social network graph as a hybrid model to study inter-user relationships and inter-topic relationships and to visualise the social network graph. This is an appropriate way to present users and their interests and to study the relationships between them, as it facilitates reading information and gives a comprehensive overview of users’ social network types, patterns, and interests.
Due to the importance of the topics in finding similarities between users, the enhanced equation proposed takes the highest weight between personality factor and demographic data. As a result, the inferred topics’ accuracy was calculated and represented 85%, which indicates the optimal results in topics inferring and, thus, the validity of the equation results.
The results of this research indicate that there is validity in the factors that were relied upon to find similarities between users. Based on the enhanced equation results, users’ interests can be determined precisely and can, thus, suggest topics to users based on those of interest to similar user profiles. This research proved that similar users often have the same interests, which can mitigate the cold start problem according to observations based on all cases on dataset. In the case of a new user joining a social network, similar users can be identified in the demographic data and big five personality traits. According to this, these users will have interests that will likely be of interest to the new users. It is also possible to determine the interests of current users in the network by searching for topics similar to their interest topics.
The case studies presented above allow the following summary to be provided:
- Depending on the first case, if the personality and demographic data are similar, such as age and gender, then the likelihood of having the same interests and similarity rate is high and confident.
- Based on the second and third cases, if the personalities of users are similar and the demographic (age/gender) data differ, either one or both, then the state of confidence here is that their interests will often be different. It has also been observed that similarity in the demographic data mathematically gives a very high result, which is due to the encoding of gender to zero and one, and this makes it mathematically close to the first case; however, theoretically, and in reality, they are different. Hence, the interests were diverse for this reason; thus, a higher weight for interest topics was placed in the improved equation. Consequently, the similarity percentage decreased dramatically between the users, something which is in stark contrast to the initial example presented.
- The fourth case showed a difference between users’ personality traits, even though their demographic data were identical, and from which it could be seen that their interests differed. Thus, both demographic data and personality characteristics are intrinsic factors in determining users’ interests and neither can be overlooked.
Overall, when we compare our research with other research in the same field, we find that the method that has been relied upon to find users’ interests based on personal and demographic data and interested topics is a very feasible and useful method that gives more accurate results than previous research. As shown in Table 12, comparing the proposed system against different previous systems, the results show that incorporating the personality traits, demographic data and interested topics improved the proposed system.
Table 12.
Compared to previous research.
In general terms, the enhanced equation proposed in this research achieved the desired goal of finding similar users with higher accuracy, thus, providing customized recommendations and solving the cold start problem and implicit interests. The improved equation contributes to giving results that outperform the baseline similarity equation because it gives greater importance to the topics of interest to each user because they are, in fact, coming from the users themselves and this is the reason why it excels with this high precision despite the difference in the concept mathematically. Moreover, there are several limitations encountered in this research, as follows:
- Including the location from the demographic data to rely upon in extracting the users’ implicit interests, as the users are affected by the community’s culture to which they belong. Often, the inhabitants of the same geographic region revolve around the same interests. Geographical data is currently excluded from this research because the majority of Twitter users did not disclose their data in general, or the location field mentions other information that is not related to reality.
- It was difficult to obtain Twitter data as there are many restrictions from Twitter as it gives few tweets that are collected daily.
7. Conclusions
Recently, the popularity of the internet has increased dramatically, as it has crossed the boundaries of time and space and has brought people closer; moreover, there is no doubt that social networking sites are one of the applications that have accommodated the internet’s spread and led to a massive revolution in the world. As a result, the number of the internet users increased considerably, which eventually led to an explosion of information and an enormous increase in content. Nevertheless, the massive amount of inappropriate and unimportant information caused the need to use personalization to select data related to users’ interests or searchers in social media platforms.
This research is aimed at proposed a model for extracting explicit and implicit user interests from social media by modeling users and topics. The model focused on addressing problems in mining users’ interests in social media: providing a personalized recommendation, multi-faceted user interest profiles, cold start problem, prediction implicit interests. The proposed was divided into five phases: data collection, data pre-processing, topic modeling, users modeling and graph modeling. First, the data collection phase extracted users’ tweets from the social networking platform Twitter, in addition to extracting personality characteristics, age, and gender data for all users. Secondly, due to the data’s unstructured and noisy nature, the data were pre-processed and cleaned. Third, topics modeling (has explanation in Appendix A) uses the LDA model to infer the topics that each user is interested in and to research the extent of the convergence of semantic and language topics. Fourthly, modeling users based on multiple facts, which are the subjects of interest for each user, personality traits, and demographic data, depending on their similarity. Finaly, building a hybrid model based on the graph represents both users and topics and researching the pattern of interaction between them. Moreover, topics were clustered into groups based on semantic similarity to predict users’ implicit interests.
The evaluation process for this research was based on two methods, namely, ground truth table and quantitative analysis. Ground truth table was used to evaluated interest topics extracted for each user. On the other hand, the quantitative analysis was used to evaluate the proposed multi-faceted user modeling.
There are several approaches for developing the currently proposed idea as follows:
- Enable the cross-system models, which study the user’s account in more than one social media platform. However, it leads to data integration challenges.
- Study users’ interests in social media based on time and link predication. That is, examining the change in user interests over the years, enabling future interests to be anticipated. For example, a study of Users A, B, and C interests from the first year they joined social networking sites, suppose the first year 2016, i.e., a study of interests in 2016–2021.
Author Contributions
Conceptualization, M.M.A. and W.M.S.Y.; methodology, M.M.A. and W.M.S.Y.; software, M.M.A. and W.M.S.Y.; validation, M.M.A. and W.M.S.Y.; formal analysis, M.M.A. and W.M.S.Y.; investigation, M.M.A. and W.M.S.Y.; resources, M.M.A.; data curation, M.M.A. and W.M.S.Y.; writing—original draft preparation, M.M.A.; writing—review and editing, M.M.A., W.M.S.Y. and A.A.; visualization, M.M.A.; supervision, W.M.S.Y.; project administration, M.M.A., W.M.S.Y. and A.A.; funding acquisition, A.-H.M.E., H.A.A. and A.S. All authors have read and agreed to the published version of the manuscript.
Funding
The authors would like to extend their gratitude to King Saud University (Riyadh, Saudi Arabia) for funding this research through Researchers Supporting Project number (RSP-2021/260).
Institutional Review Board Statement
Not applicable.
Informed Consent Statement
Not applicable.
Data Availability Statement
The authors confirm that the data supporting the findings of this are publicly available in https://www.kaggle.com/marwa34a/user-tweet-dataset (accessed on 28 November 2021).
Acknowledgments
The authors would like to extend their gratitude to King Saud University (Riyadh, Saudi Arabia) for funding this research through Researchers Supporting Project number (RSP-2021/260).
Conflicts of Interest
The authors declare no conflict of interest.
Appendix A
This section provides clarification of the terms frequently used in this research.
Definition 1. Demographic Data
Refers to socioeconomic information people based on factors such as age, gender, residential location, social status, etc. This research is based on age and gender [49].
Example 1. Demographic Data for User A
For instance, the demographic data for user A: Age: 25, Gender: Male.
Definition 2. Big Five Personality
The five-factor model or big five model is one of the most renowned models in the area of personality traits prediction [50]. The five different types of personality as illustrated by the five-factor model are as following:
- Openness to Experience (a measure of Adventure seekers, Openness to new experience)
- Conscientiousness (a measure of the ability of any person to be organized)
- Extraversion (a measure of the tendency to seek stimulation in the external world)
- Agreeableness (a measure of tender tender-mindness)
- Neuroticism (a measure of the tendency for any user to be impulsive)
Example 2. Big Five Personality for User A
For instance, the personality data for user A: O = 3.14, C = 2.16, E = 4.16, A = 1.12, N = 3.36.
Definition 3. Topics Modeling
Topic modeling identifies keyword clusters that frequently appear together in user posts. Furthermore, the keywords in a topic that have the greatest likelihood of revealing what the topic is about [51].
Example 3. Topics Modeling for User A
Suppose the user A has 100 tweets, it was extracted three topics as follows:
Topic 1: Apple, snack, coffee, breakfast, bread, and break
Topic 2: Library, university, lecture, conference, science and students
Topic 3: Games, video, community of players, Snap and Facebook.
Then the inferring process is to extract the main topics as follows:
Topic 1: food, Topic 2: Academic, Topic 3: Games.
Definition 4. Semantic Similarity
Semantic similarity means a relationship in terms of the meaning and constituent semantics. In this research, the semantic similarity between the topics was used. Therefore, determined the correlation of two subjects based on the semantic concepts that make up [52].
Example 4. Semantic Similarity between Topics
Suppose that the two topics, games and food, are similar in semantics.
Definition 5. User Modeling
The procedure represents all user characteristics and information related to a user in user context to gain user interests. This research required user information: personality, demographic data, and interest topics, and similarities between users [53].
Example 5. User Modeling for User A
The user modeling for user A as follows:
Age: 25, Gender: Male
Interests’ topics: food, Academic and Games
Personality = O = 3.14, C = 2.16, E = 4.16, A = 1.12, N = 3.36
Similarity: similar to user B, C and F.
Definition 6. Explicit interest
Explicit user interests can be viewed from user generated content explicitly. In other word, it can be detection by the user shares what in social media or by the user’s own activities (such as social postings and social relationships) [54].
Example 6. Explicit interest
User A writes the term Real Madrid or follows the official account of Real Madrid, one can infer that this person is interested in football, in Real Madrid.
Definition 7. Implicit interest
The user interests implicitly are potential interests’ candidates which a user did not specifically discuss but which may have an interest in [54].
Example 7. Implicit interest
User A interest in Topic A, Topic A and Topic B similar in semantic, then user A may be in interest in Topic B.
Definition 8. Multi-faceted user interest profiles
Various facets of users on the basis of multiple users modeling aspects which including data source, the user interest dynamics and level of representation [55].
Example 8. Multi-faceted user interest profiles
User A has content, demographic, personality, location and social status
Definition 9. Cold start problem
Represent new users who do not have historical information or any content. Therefore, inability to make judgments on new users to facilitate topic recommendations [56].
Example 9. Cold start problem
Suppose user A joins now to the social media platform, which topics should recommend to this user. How one can know user A interests?
Definition 10. Hybrid Heterogeneous Network
Is a graph based on inter user and topic interactions that are both significant to user interest and are merged into a single heterogeneous model based to view them both at the same time [14].
Example 10. Hybrid Heterogeneous Network
Three sub-graphs: users’ graph, topics graph, the graph that connects the users to the topics they are interested in, and it represents a hybrid model of two graphs and heterogeneous because it contains two types of the node user and the topic.
References
- Alhujaili, R.F.; Yafooz, W.M. Sentiment Analysis for YouTube Videos with User Comments. In Proceedings of the International Conference on Artificial Intelligence and Smart Systems (ICAIS), Pichanur, India, 25–27 March 2021. [Google Scholar]
- De Salve, A.; Guidi, B.; Ricci, L.; Mori, P. Discovering Homophily in Online Social Networks. Mob. Netw. Appl. 2018, 23, 1715–1726. [Google Scholar] [CrossRef]
- Clement, J. Number of Social Media Users 2025, Statista. 2020. Available online: https://www.statista.com/statistics/278414/number-of-worldwide-social-network-users/ (accessed on 23 January 2021).
- Feng, W.; Wang, J. Retweet or not? Personalized tweet re-ranking. In Proceedings of the 6th ACM International Conference on Web Search and Data Mining, Rome, Italy, 4–8 February 2013. [Google Scholar]
- Konstan, J.A.; Conejo, R.; Marzo, J.L.; Oliver, N. Lecture Notes in Computer Science (including subseries Lecture Notes in Artificial Intelligence and Lecture Notes in Bioinformatics). In Proceedings of the 19th International Conference on User Modeling, Adaptation and Personalization, Girona, Spain, 11 July 2011. [Google Scholar]
- Kapanipathi, P.; Jain, P.; Venkataramani, C.; Sheth, A. User interests identification on Twitter using a hierarchical knowledge base. Lecture Notes in Computer Science (Including Subseries Lecture Notes in Artificial Intelligence and Lecture Notes in Bioinformatics). In Proceedings of the European Semantic Web Conference, Crete, Greece, 25–29 May 2014. [Google Scholar]
- Zarrinkalam, F.; Fani, H.; Bagheri, E.; Kahani, M.; Du, W. Semantics-enabled user interest detection from Twitter. In Proceedings of the 2015 IEEE/WIC/ACM International Joint Conference on Web Intelligence and Intelligent Agent Technology, Singapore, 6–9 December 2015. [Google Scholar]
- Li, J.; Wang, Z.L.; Zhao, H.; Gravina, R.; Fortino, G.; Jiang, Y.; Tang, K. Networked human motion capture system based on quaternion navigation. In Proceedings of the BodyNets International Conference on Body Area Networks, Dalian, China, 28–29 September 2017. [Google Scholar]
- Piao, G.; Breslin, J.G. Inferring user interests for passive users on Twitter. In Proceedings of the HT ‘17: 28th ACM Conference on Hypertext and Social Media, Prague, Czech Republic, 4–7 July 2017. [Google Scholar]
- Shen, W.; Wang, J.; Luo, P.; Wang, M. Linking named entities in tweets with knowledge base via user interest modeling. In Proceedings of the ACM SIGKDD International Conference on Knowledge Discovery and Data Mining, Chicago, IL, USA, 11–14 August 2013. [Google Scholar]
- Zarrinkalam, F.; Fani, H.; Bagheri, E.; Kahani, M. Inferring implicit topical interests on twitter. Lecture Notes in Computer Science (Including Subseries Lecture Notes in Artificial Intelligence and Lecture Notes in Bioinformatics). In Proceedings of the European Conference on Information Retrieval, Padua, Italy, 20–23 March 2016. [Google Scholar]
- Piao, G.; Breslin, J.G. Transfer learning for item recommendations and knowledge graph completion in item related domains via a co-factorization model. In Proceedings of the European Semantic Web Conference, Heraklion, Greece, 3–7 June 2018. [Google Scholar]
- Zarrinkalam, F.; Fani, H.; Bagheri, E. Extracting, Mining and Predicting Users’ Interests from Social Networks. In Proceedings of the 42nd International ACM SIGIR Conference on Research and Development in Information Retrieval, Paris, France, 21–25 July 2019. [Google Scholar]
- Zarrinkalam, F.; Fani, H.; Bagheri, E. Social user interest mining: Methods and applications. In Proceedings of the 25th ACM SIGKDD International Conference on Knowledge Discovery & Data Mining, Anchorage, AK, USA, 4–8 August 2019. [Google Scholar]
- Kuanr, M.; Mohapatra, P. Recent Challenges in Recommender Systems: A Survey. In Progress in Advanced Computing and Intelligent Engineering; Kacprzyk, J., Ed.; Springer: Singapore, 2021; Volume 1199, pp. 353–365. [Google Scholar]
- Alrehili, M.M.; Yafooz, W.M. A Review of Extracting and Mining User Interest from Social Media Based on Personality. In Proceedings of the 3rd International Youth Conference on Radio Electronics, Electrical and Power Engineering (REEPE), Moscow, Russia, 11–13 March 2021. [Google Scholar]
- Kumar, M.R.; Venkatesh, J.; Rahman, A.M.J. Data mining and machine learning in retail business: Developing efficiencies for better customer retention. J. Ambient. Intell. Humaniz. Comput. 2021, 1–13. [Google Scholar] [CrossRef]
- Li, Y.; Guo, X.; Lin, W.; Zhong, M.; Li, Q.; Liu, Z.; Zhong, W.; Zhu, Z. Learning Dynamic User Interest Sequence in Knowledge Graphs for Click-Through Rate Prediction; IEEE Transactions on Knowledge and Data Engineering: New York, NY, USA, 2021. [Google Scholar] [CrossRef]
- Kang, S.; Ji, L.; Zhang, J.; Kang, S.; Ji, L.; Zhang, J. Heterogeneous Information Network Representation Learning Framework Based on Graph Attention Network. J. Electron. Inf. Technol. 2021, 43, 915–922. [Google Scholar]
- Shi, C.; Ding, J.; Cao, X.; Hu, L.; Wu, B.; Li, X. Entity set expansion in knowledge graph: A heterogeneous information network perspective. Front. Comput. Sci. 2020, 15, 1–12. [Google Scholar] [CrossRef]
- Xie, T.; Xu, Y.; Chen, L.; Liu, Y.; Zheng, Z. Sequential Recommendation on Dynamic Heterogeneous Information Network. In Proceedings of the IEEE 37th International Conference on Data Engineering (ICDE), Chania, Greece, 22 June 2021. [Google Scholar]
- Chen, Y.C.; Hui, L.; Thaipisutikul, T. A collaborative filtering recommendation system with dynamic time decay. J. Supercomput. 2021, 77, 244–262. [Google Scholar] [CrossRef]
- Ma, B.; Lu, M.; Taniguchi, Y.; Konomi, S. Exploration and explanation: An interactive course recommendation system for university environments. In Proceedings of the IUI ‘21 Companion: 26th International Conference on Intelligent User Interfaces—Companion, College Station, TX, USA, 14–17 April 2021. [Google Scholar]
- Tahmasebi, F.; Meghdadi, M.; Ahmadian, S.; Valiallahi, K. A hybrid recommendation system based on profile expansion technique to alleviate cold start problem. Multimed. Tools Appl. 2020, 80, 2339–2354. [Google Scholar] [CrossRef]
- Roccas, S.; Sagiv, L.; Schwartz, S.H.; Knafo, A. The big five personality factors and personal values. Personal. Soc. Psychol. Bull. 2002, 28, 789–801. [Google Scholar] [CrossRef]
- Dhelim, S.; Aung, N.; Bouras, M.A.; Ning, H.; Cambria, E. A Survey on Personality-Aware Recommendation Systems. Artifcial Intelligence Review, Published Online, 19 September 2021. Available online: https://link.springer.com/content/pdf/10.1007/s10462-021-10063-7.pdf (accessed on 11 January 2021).
- Singh, B.K.; Katiyar, M.; Gupta, S.; Ganpatrao, N.G. A Survey on: Personality Prediction from Multimedia through Machine Learning. In Proceedings of the 5th International Conference on Computing Methodologies and Communication, Erode, India, 8–10 April 2021. [Google Scholar]
- Kang, J.; Lee, H. Modeling user interest in social media using news media and wikipedia. Inf. Syst. 2017, 65, 52–64. [Google Scholar] [CrossRef]
- Shi, C.; Hu, B.; Zhao, W.X.; Yu, P.S. Heterogeneous information network embedding for recommendation. IEEE Trans. Knowl. Data Eng. 2019, 31, 357–370. [Google Scholar] [CrossRef] [Green Version]
- Herce-Zelaya, J.; Porcel, C.; Bernabé-Moreno, J.; Tejeda-Lorente, A.; Herrera-Viedma, E. New technique to alleviate the cold start problem in recommender systems using information from social media and random decision forests. Inf. Sci. 2020, 536, 156–170. [Google Scholar] [CrossRef]
- Yafooz, W.M.; Hizam, E.A.; Alromema, W.A. Arabic Sentiment Analysis on Chewing Khat Leaves using Machine Learning and Ensemble Methods. Eng. Technol. Appl. Sci. Res. 2021, 11, 6845–6848. [Google Scholar] [CrossRef]
- Ferwerda, B.; Schedl, M. Personality-based user modeling for music recommender systems. In Joint European Conference on Machine Learning and Knowledge Discovery in Databases; Lecture Notes in Computer Science (Including Subseries Lecture Notes in Artificial Intelligence and Lecture Notes in Bioinformatics), 9853 LNCS; Springer: Cham, Switzerland, 2016; pp. 254–257. [Google Scholar] [CrossRef]
- Ferwerda, B.; Tkalcic, M.; Schedl, M. Personality traits and music genre preferences: How music taste varies over age groups. CEUR Workshop Proc. 2017, 1922, 16–20. [Google Scholar]
- Tkalčič, M.; Kunaver, M.; Tasič, J.; Košir, A. Personality Based User Similarity Measure for a Collaborative Recommender System. In Proceedings of the 5th Workshop on Emotion in Human-Computer Interaction-Real World Challenges, Cambridge, UK, 1 September 2009; Available online: http://publica.fraunhofer.de/documents/N-113443.html (accessed on 11 January 2021).
- Hemkiran, S.; Sudha Sadasivam, G. A review of similarity measures and link prediction models in social networks. Int. J. Comput. Digit. Syst. 2020, 9, 239–248. [Google Scholar] [CrossRef]
- Jiao, Y.; Zhang, J.; Xiong, Y.; Zhu, Y. Collective link prediction oriented network embedding with hierarchical graph attention. In Proceedings of the 28th ACM International Conference on Information and Knowledge Management, Beijing, China, 3–7 November 2019; pp. 419–428. [Google Scholar] [CrossRef] [Green Version]
- Al-Shamri, M.Y.H. User profiling approaches for demographic recommender systems. Knowl.-Based Syst. 2016, 100, 175–187. [Google Scholar] [CrossRef]
- Hawashin, B.; Lafi, M.; Kanan, T.; Mansour, A. An efficient hybrid similarity measure based on user interests for recommender systems. Expert Syst. 2020, 37, e12471. [Google Scholar] [CrossRef]
- Asabere, N.Y.; Acakpovi, A.; Michael, M.B. Improving Socially-Aware Recommendation Accuracy through Personality. IEEE Trans. Affect. Comput. 2018, 9, 351–361. [Google Scholar] [CrossRef]
- Bahrani, P.; Minaei-Bidgoli, B.; Parvin, H.; Mirzarezaee, M.; Keshavarz, A.; Alinejad-Rokny, H. User and item profile expansion for dealing with cold start problem. J. Intell. Fuzzy Syst. 2020, 38, 4471–4483. [Google Scholar] [CrossRef]
- Dhelim, S.; Aung, N.; Ning, H. Mining user interest based on personality-aware hybrid filtering in social networks. Knowl. -Based Syst. 2020, 206, 106227. [Google Scholar] [CrossRef]
- Jelodar, H.; Wang, Y.; Yuan, C.; Feng, X.; Jiang, X.; Li, Y.; Zhao, L. Latent Dirichlet allocation (LDA) and topic modeling: Models, applications, a survey. Multimed. Tools Appl. 2019, 78, 15169–15211. [Google Scholar] [CrossRef] [Green Version]
- Blei, D.M.; Ng, A.Y.; Jordan, M.I. Latent Dirichlet allocation. J. Mach. Learn. Res. 2003, 3, 993–1022. [Google Scholar] [CrossRef]
- Bojanowski, P.; Grave, E.; Joulin, A.; Mikolov, T. Enriching Word Vectors with Subword Information. Trans. Assoc. Comput. Linguist. 2017, 5, 135–146. [Google Scholar] [CrossRef] [Green Version]
- Zhao, Y. Based on user interest level of modeling scenarios and browse content. In Proceedings of the AIP Conference, Chongqing, China, 27–28 May 2017. [Google Scholar]
- Wang, X.; Ji, H.; Cui, P.; Yu, P.; Shi, C.; Wang, B.; Ye, Y. Heterogeneous graph attention network. In Proceedings of the Web Conference 2019—The World Wide Web Conference, San Francisco, CA, USA, 13–17 May 2019. [Google Scholar]
- Yun, S.; Jeong, M.; Kim, R.; Kang, J.; Kim, H.J. Graph transformer networks. Adv. Neural Inf. Process. Syst. 2019, 32, 11983–11993. [Google Scholar]
- Cobb-Clark, D.A.; Schurer, S. The stability of big-five personality traits. Econ. Lett. 2012, 115, 11–15. [Google Scholar] [CrossRef] [Green Version]
- Larson, L.M.; Rottinghaus, P.J.; Borgen, F.H. Meta-analyses of Big Six Interests and Big Five Personality Factors. J. Vocat. Behav. 2002, 61, 217–239. [Google Scholar] [CrossRef]
- Golino, H.; Christensen, A.; Moulder, R.G.; Kim, S.; Boker, S. Modeling latent topics in social media using Dynamic Exploratory Graph Analysis: The case of the right-wing and left-wing trolls in the 2016 US elections. Psychometrika 2021, 1–32. [Google Scholar] [CrossRef] [PubMed]
- Khalil Ibrahim, R.; Jacksi, K.; Rafeeq Mohammed Zeebaree, S. Survey on Semantic Similarity Based on Document Clustering Performance Analysis of Different Clus-ter-based and None Cluster-based Web Servers in Normal and Under TCP SYN Flood DDoS Attack View pro-ject Parallel processing View project Survey on Semantic Si. Adv. Sci. Technol. Eng. Syst. J. 2019, 4, 115–122. [Google Scholar] [CrossRef]
- Dhillon, P.S.; Aral, S. Modeling Dynamic User Interests: A Neural Matrix Factorization Approach. Mark. Sci. 2021, 40, 1059–1080. [Google Scholar] [CrossRef]
- Najafabadi, M.K.; Mohamed, A.H.; Mahrin, M.N. A survey on data mining techniques in recommender systems. Soft Comput. 2019, 23, 627–654. [Google Scholar] [CrossRef]
- Connelly, L.M. Demographic data in research studies. MedSurg Nurs. 2013, 22, 269–271. [Google Scholar]
- Mauro, N.; Ardissono, L.; Filippo, H.Z. Multi-faceted Trust-based Collaborative Filtering. In Proceedings of the UMAP 19: 27th Conference on User Modeling, Adaptation and Personalization, Larnaca, Cyprus, 9–12 June 2019; pp. 216–224. [Google Scholar] [CrossRef] [Green Version]
- Lesly, A.; Gonzalez, C.; Alves Souza, S.N. Social network data to alleviate cold-start in recommender system: A systematic review. Inf. Process. Manag. 2018, 54, 529–544. [Google Scholar] [CrossRef]
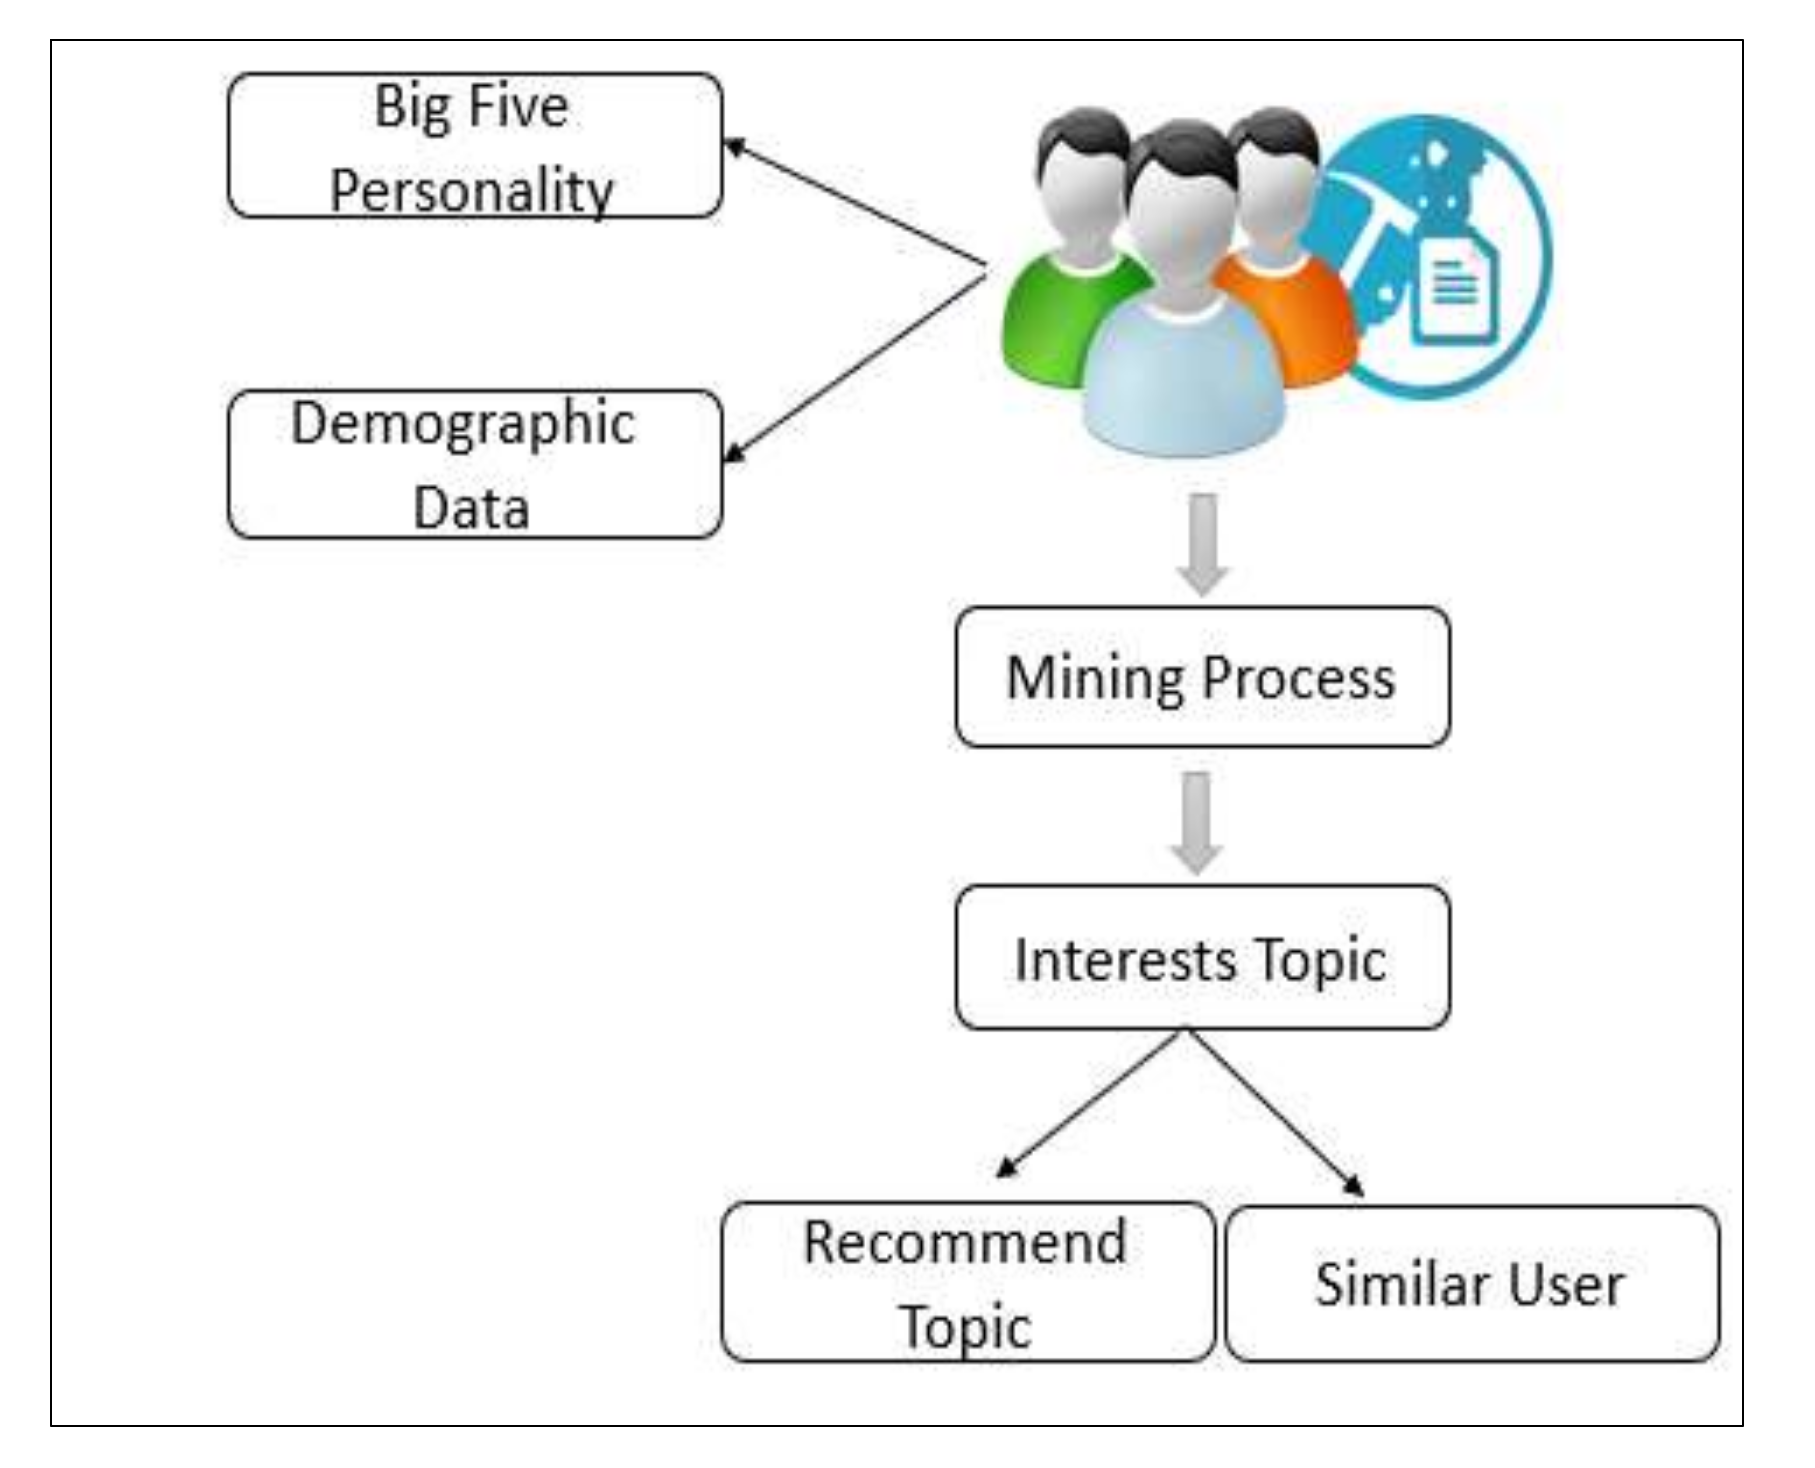

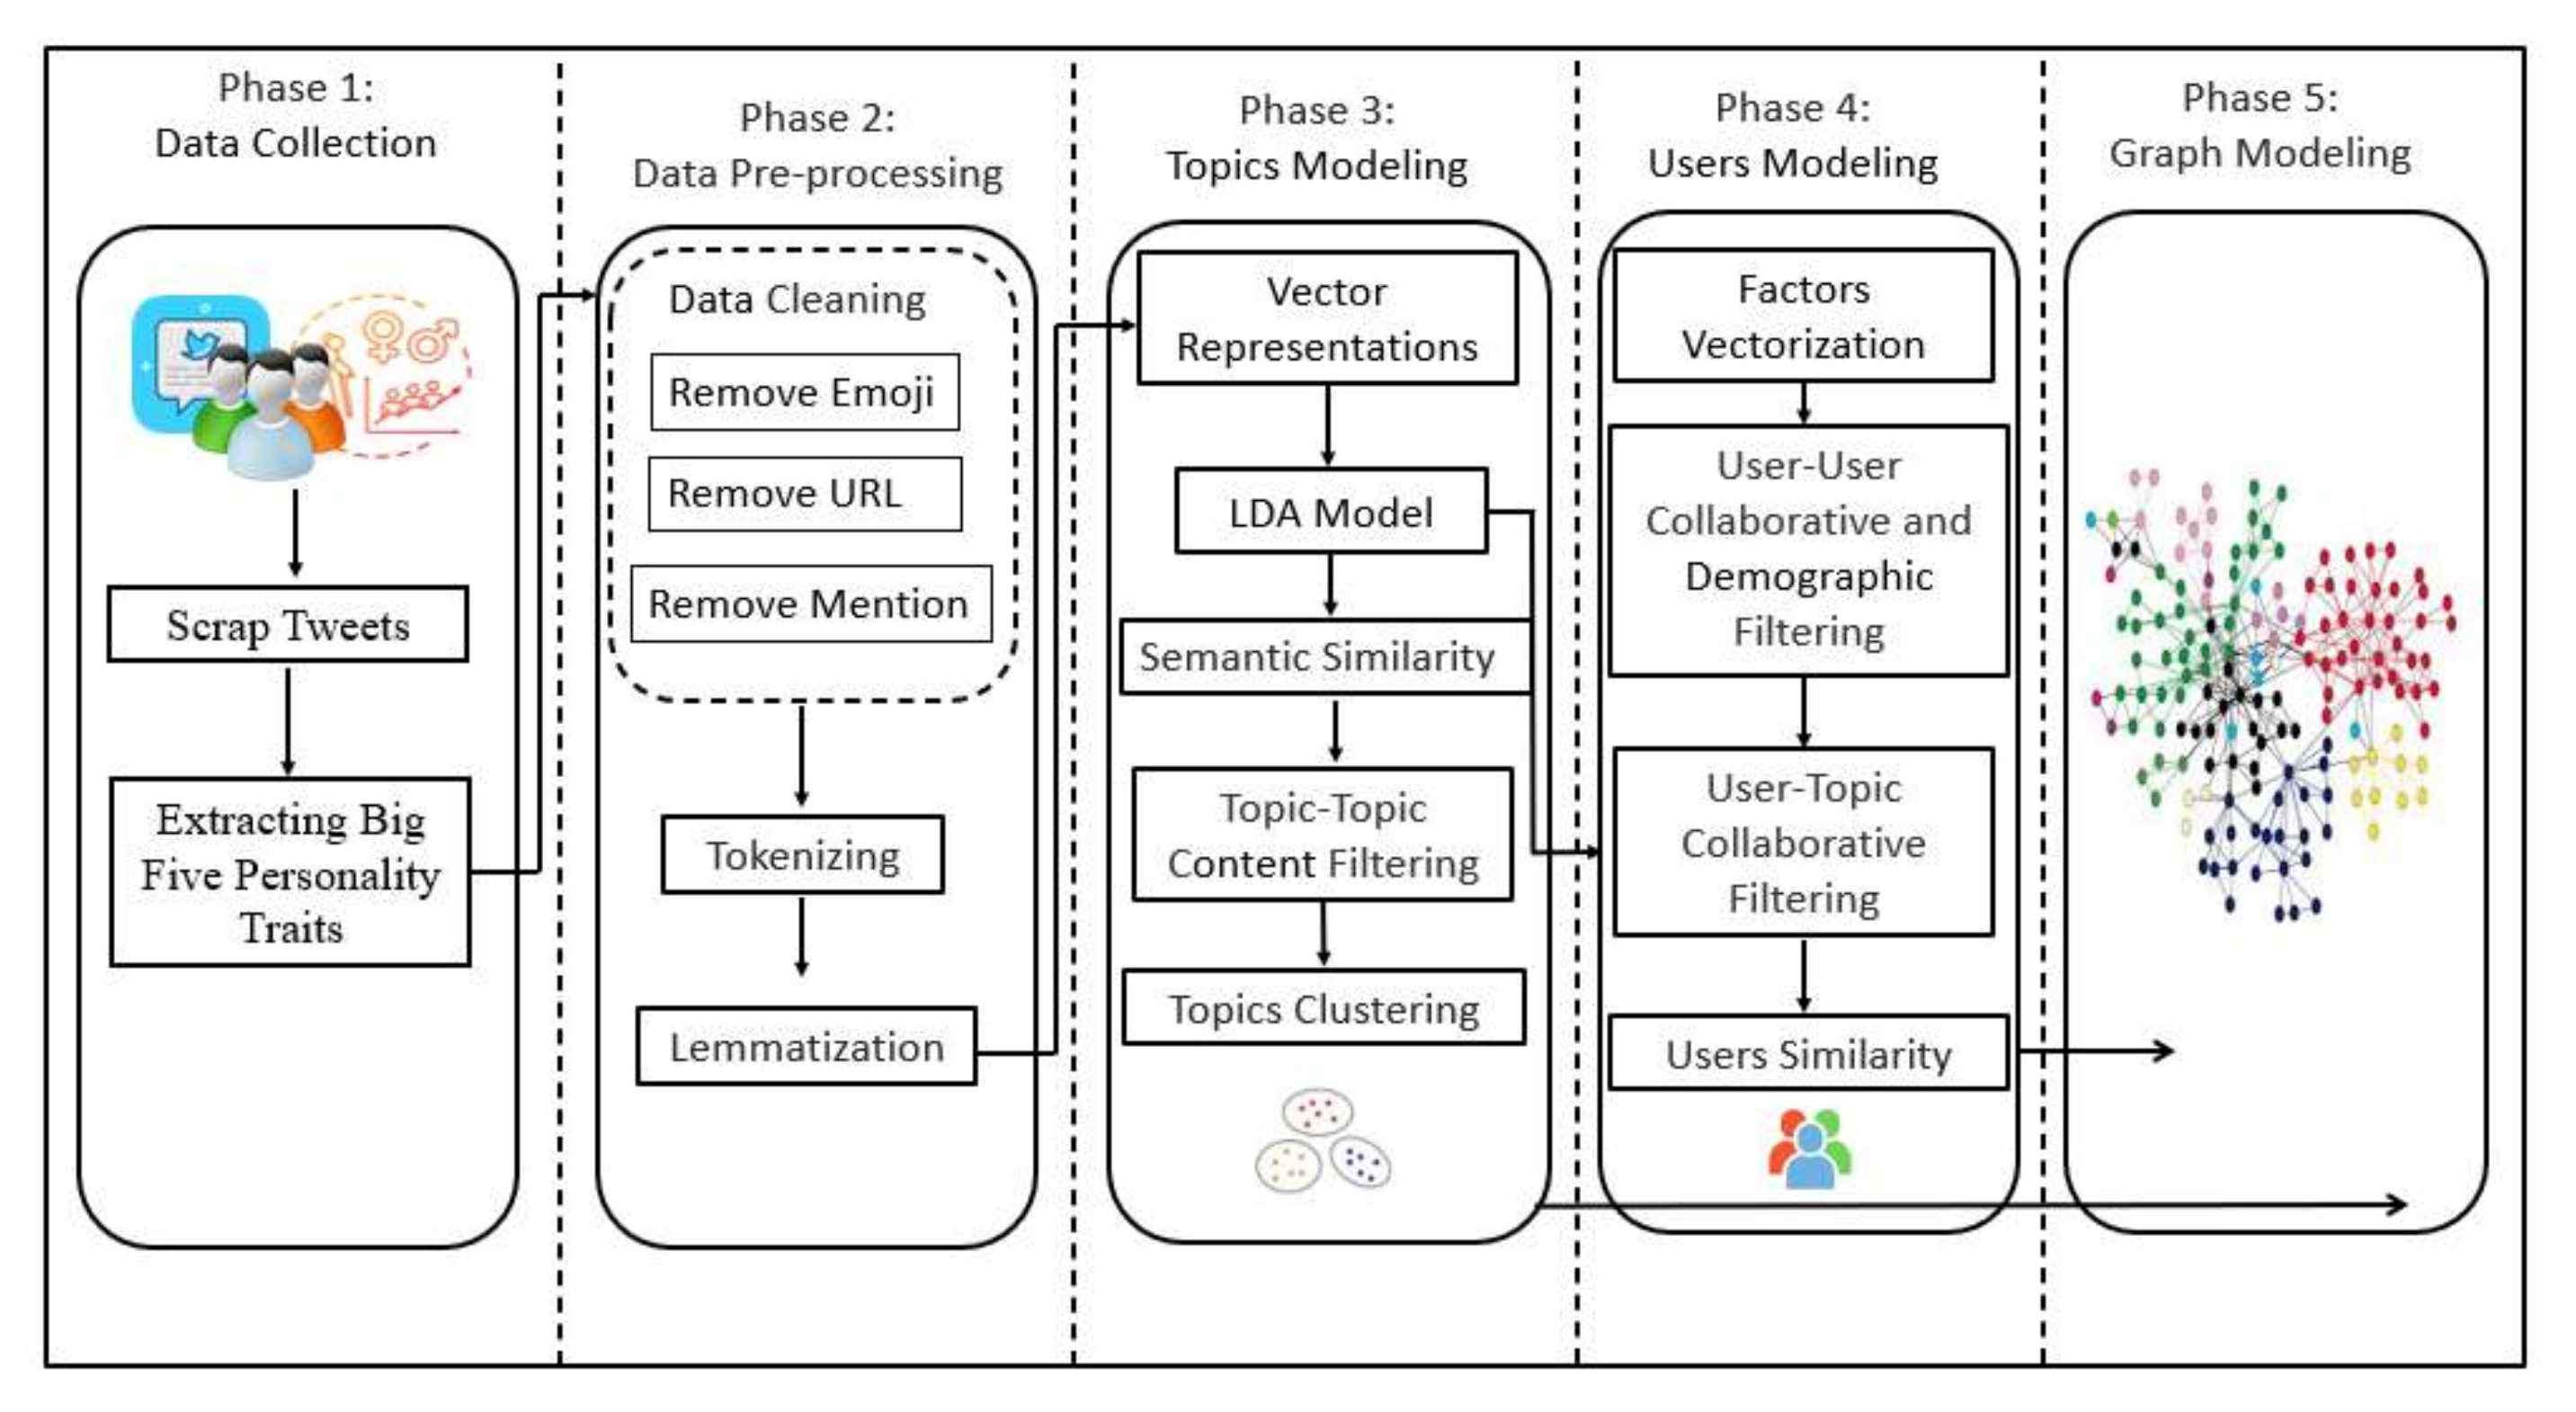

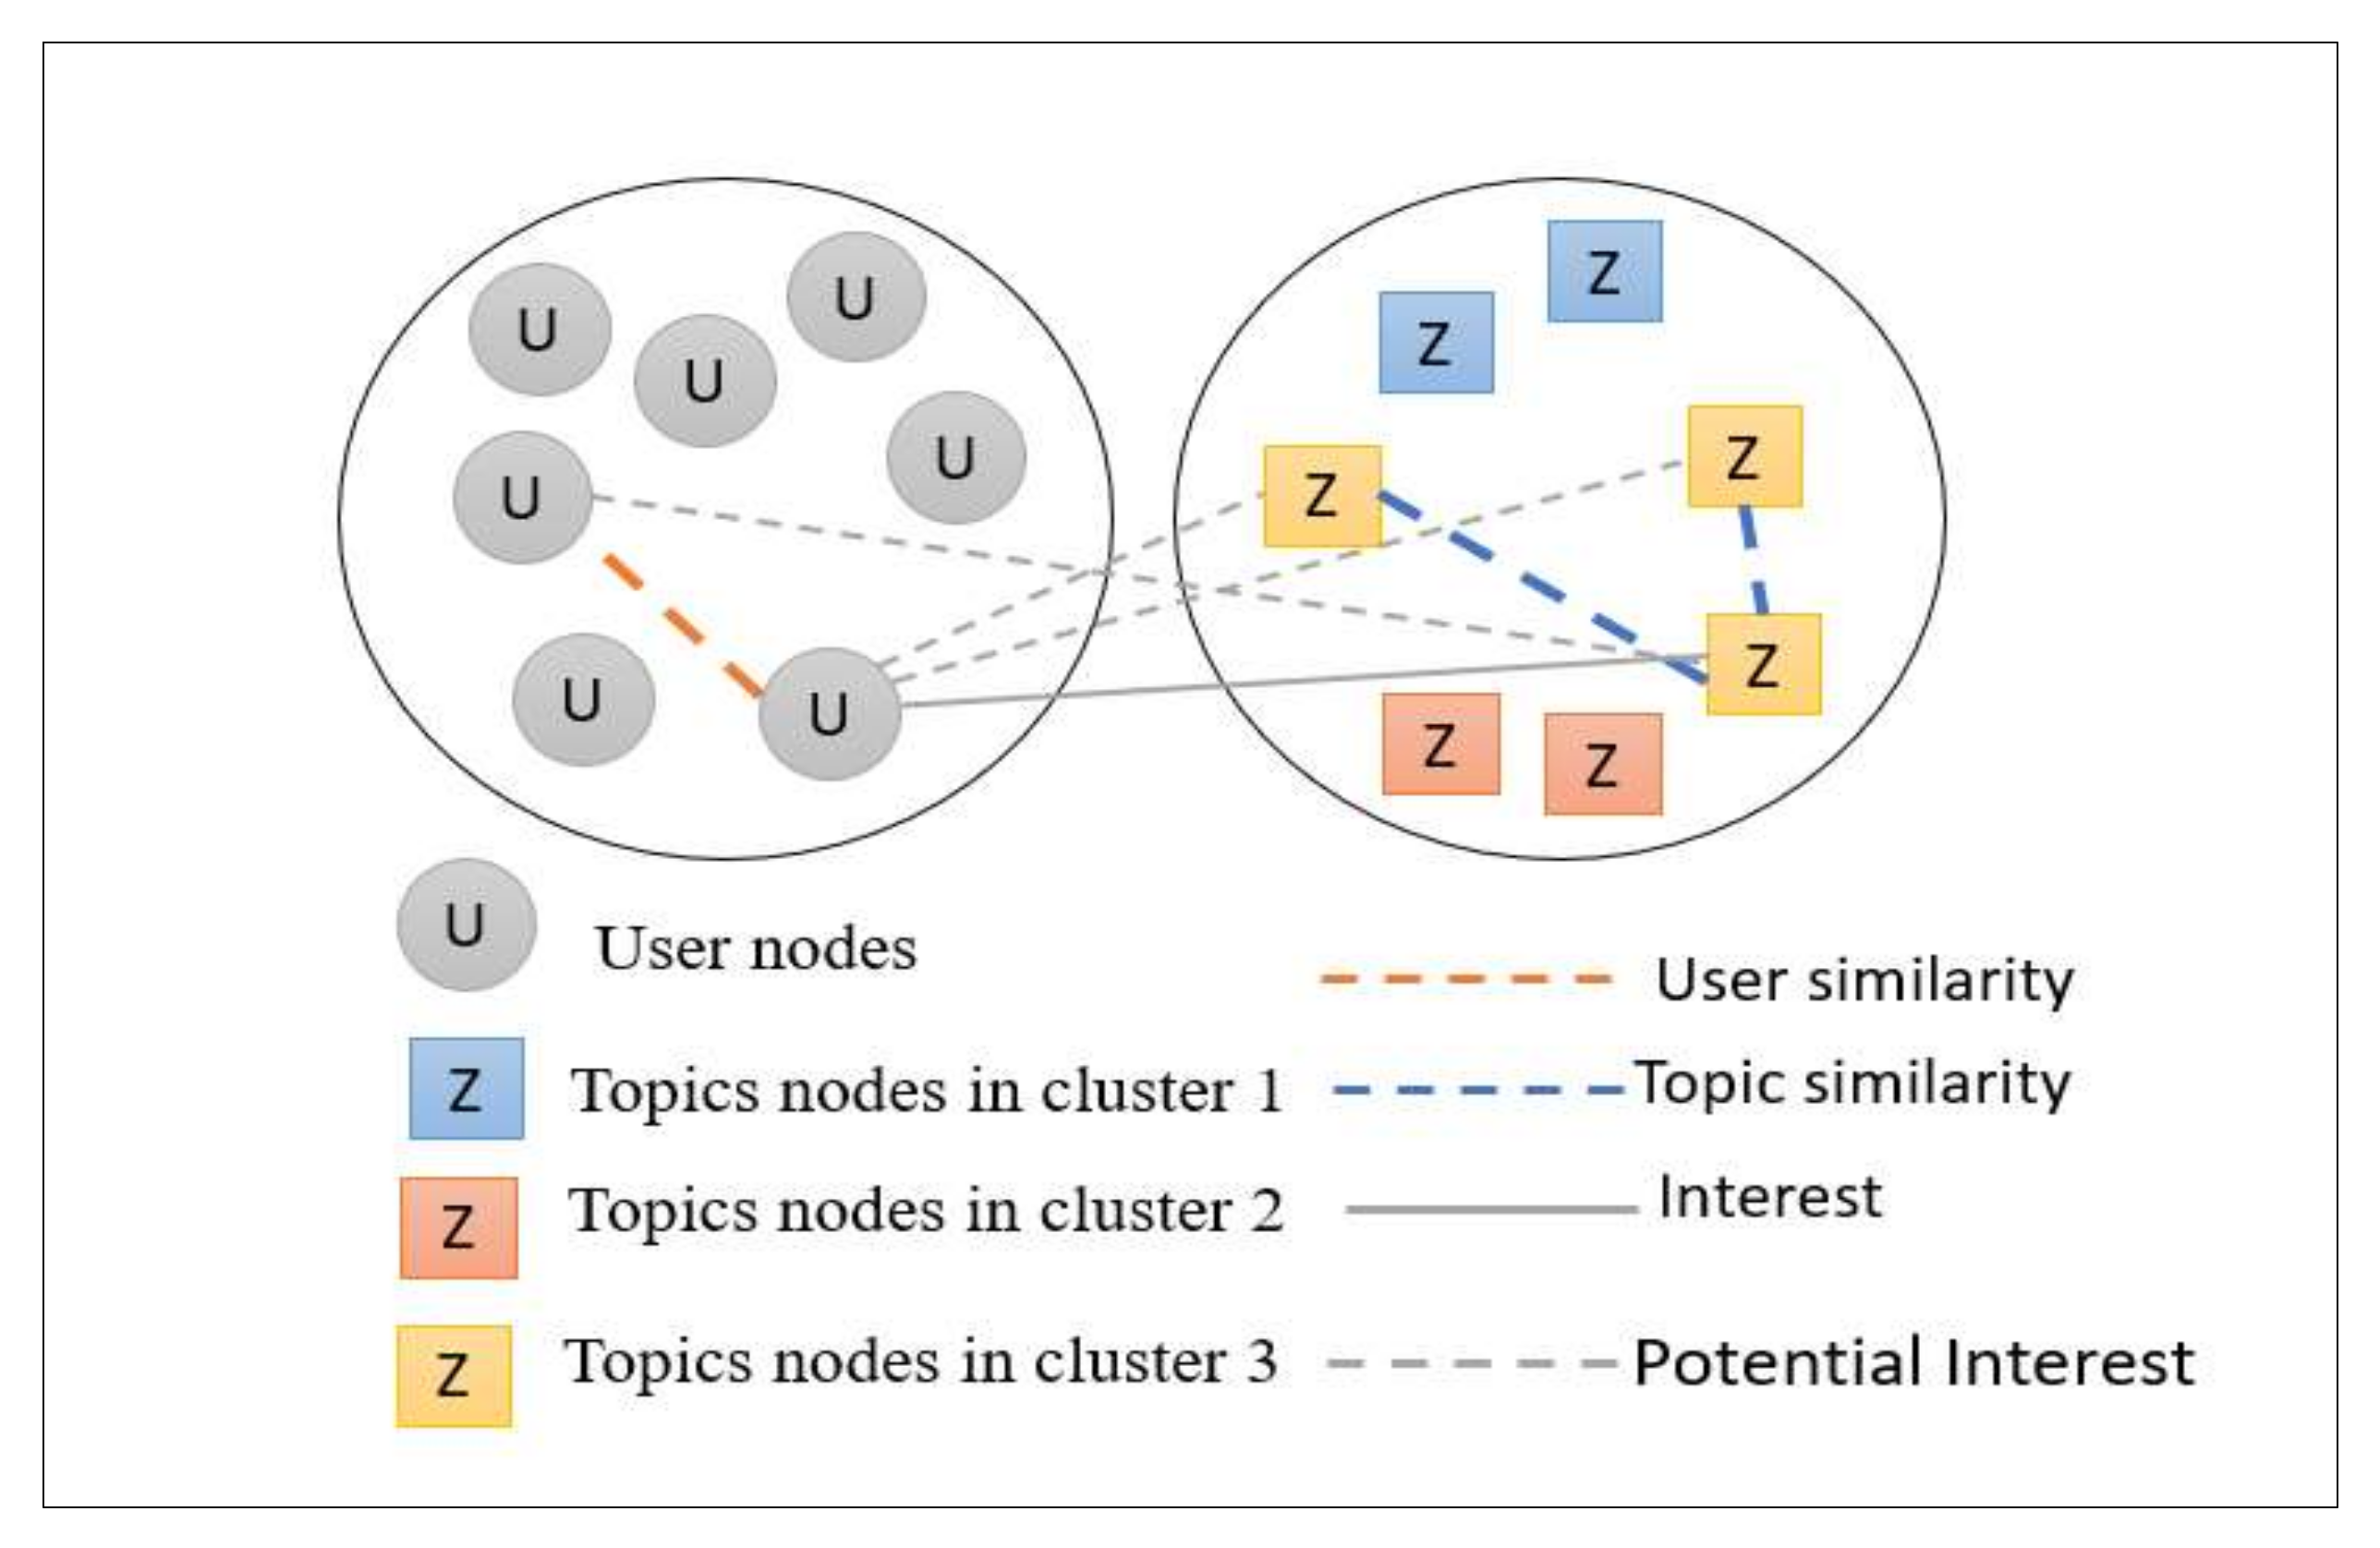

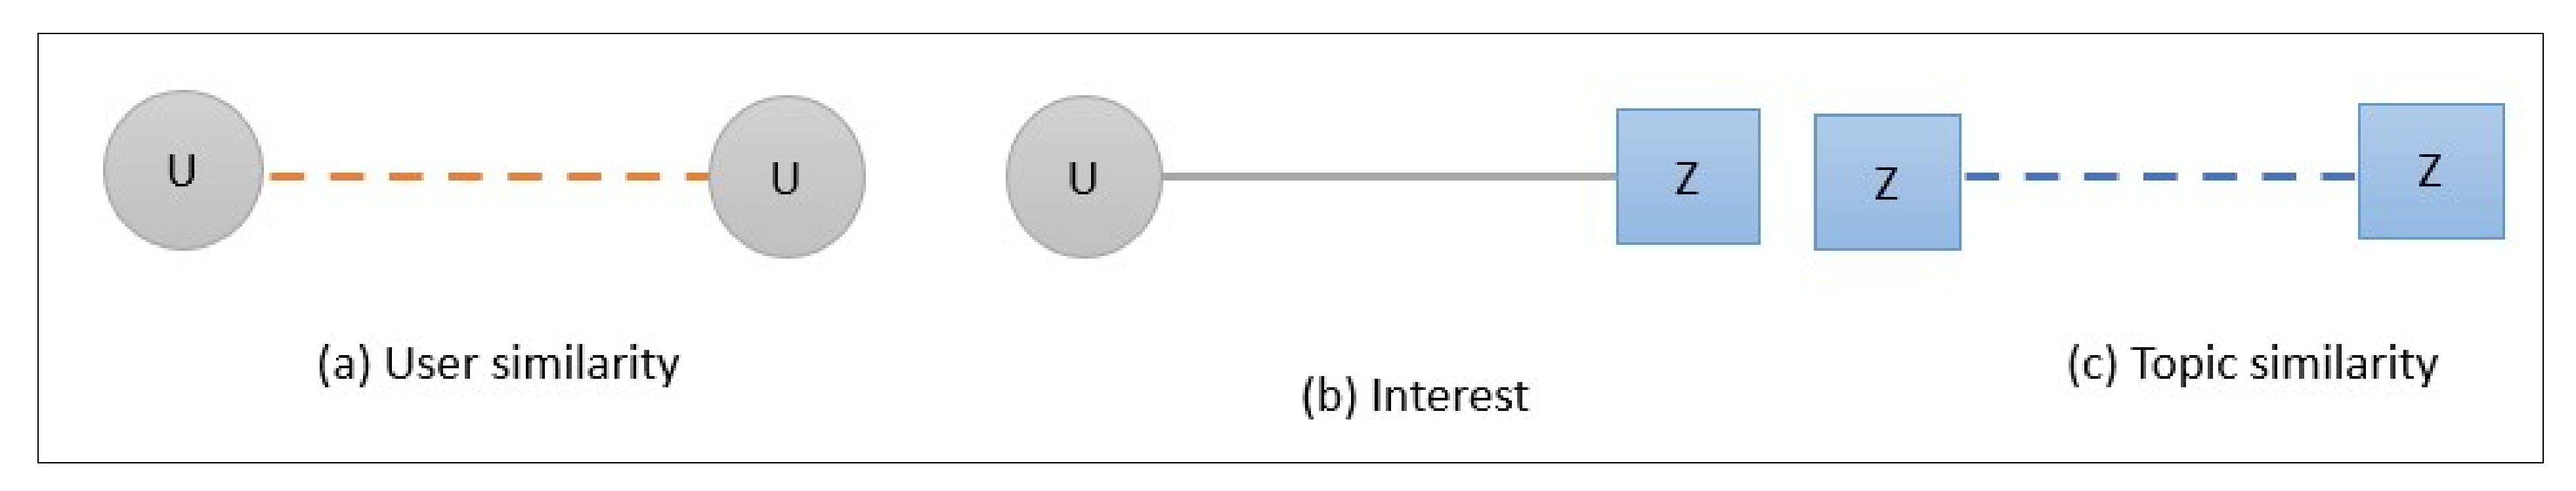
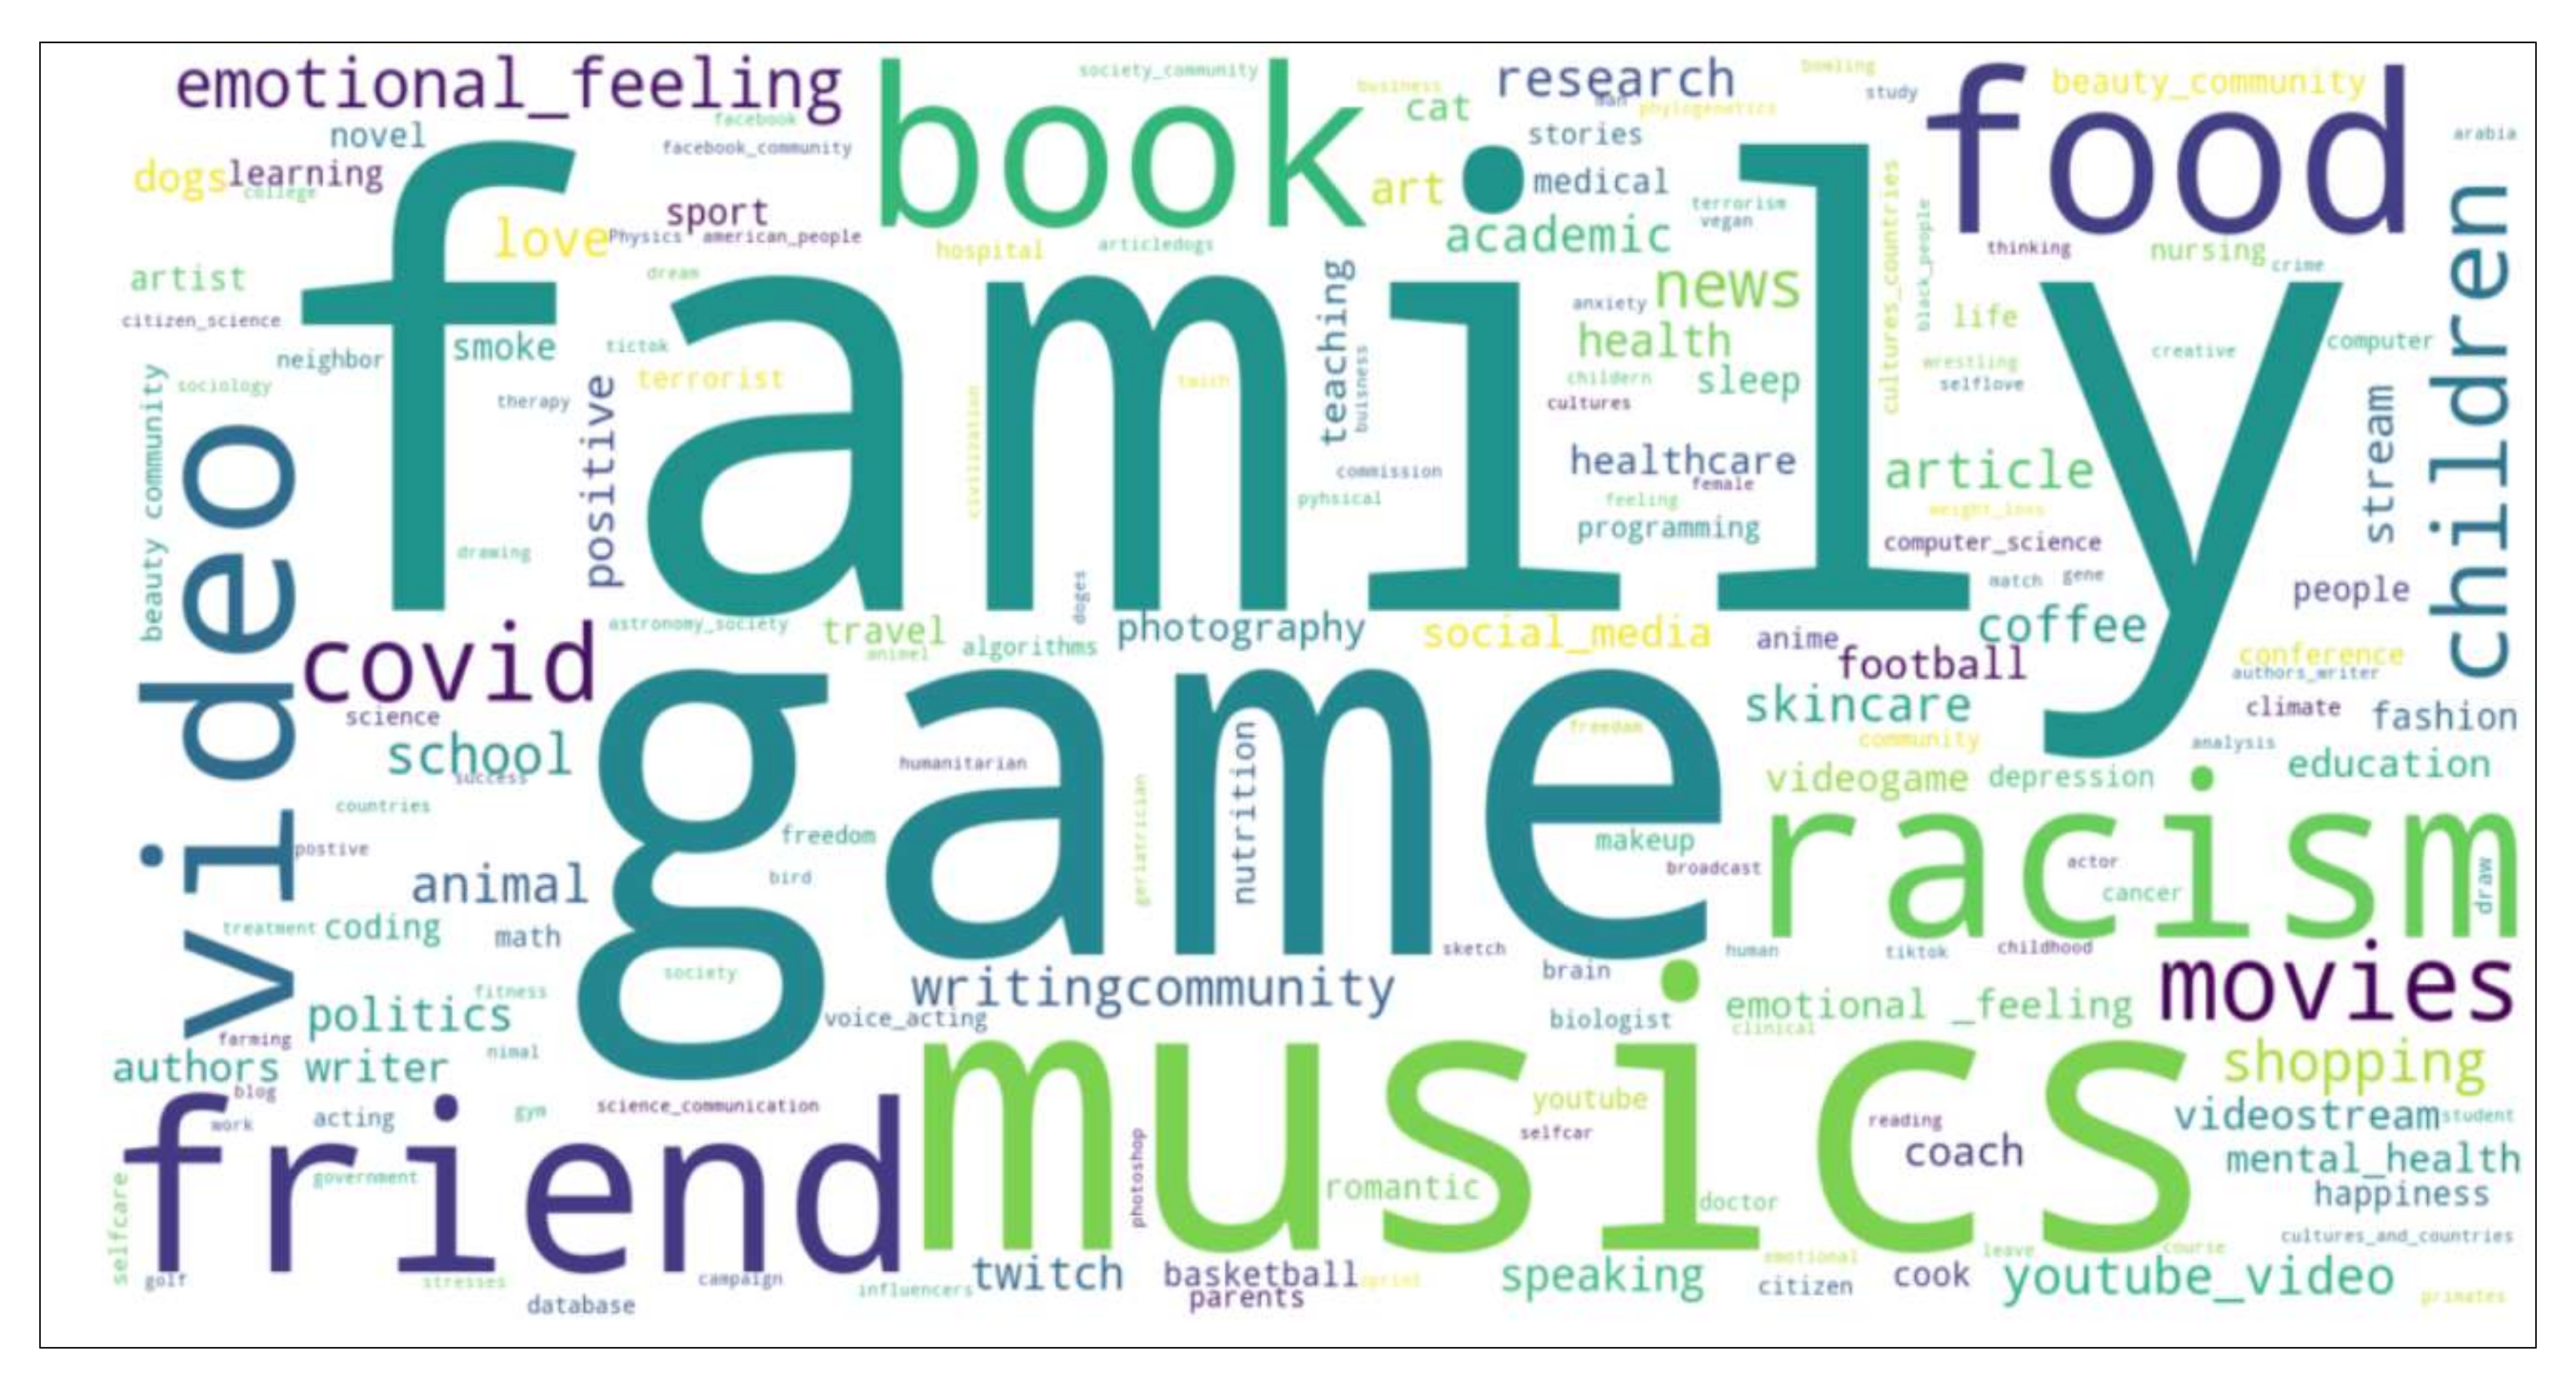
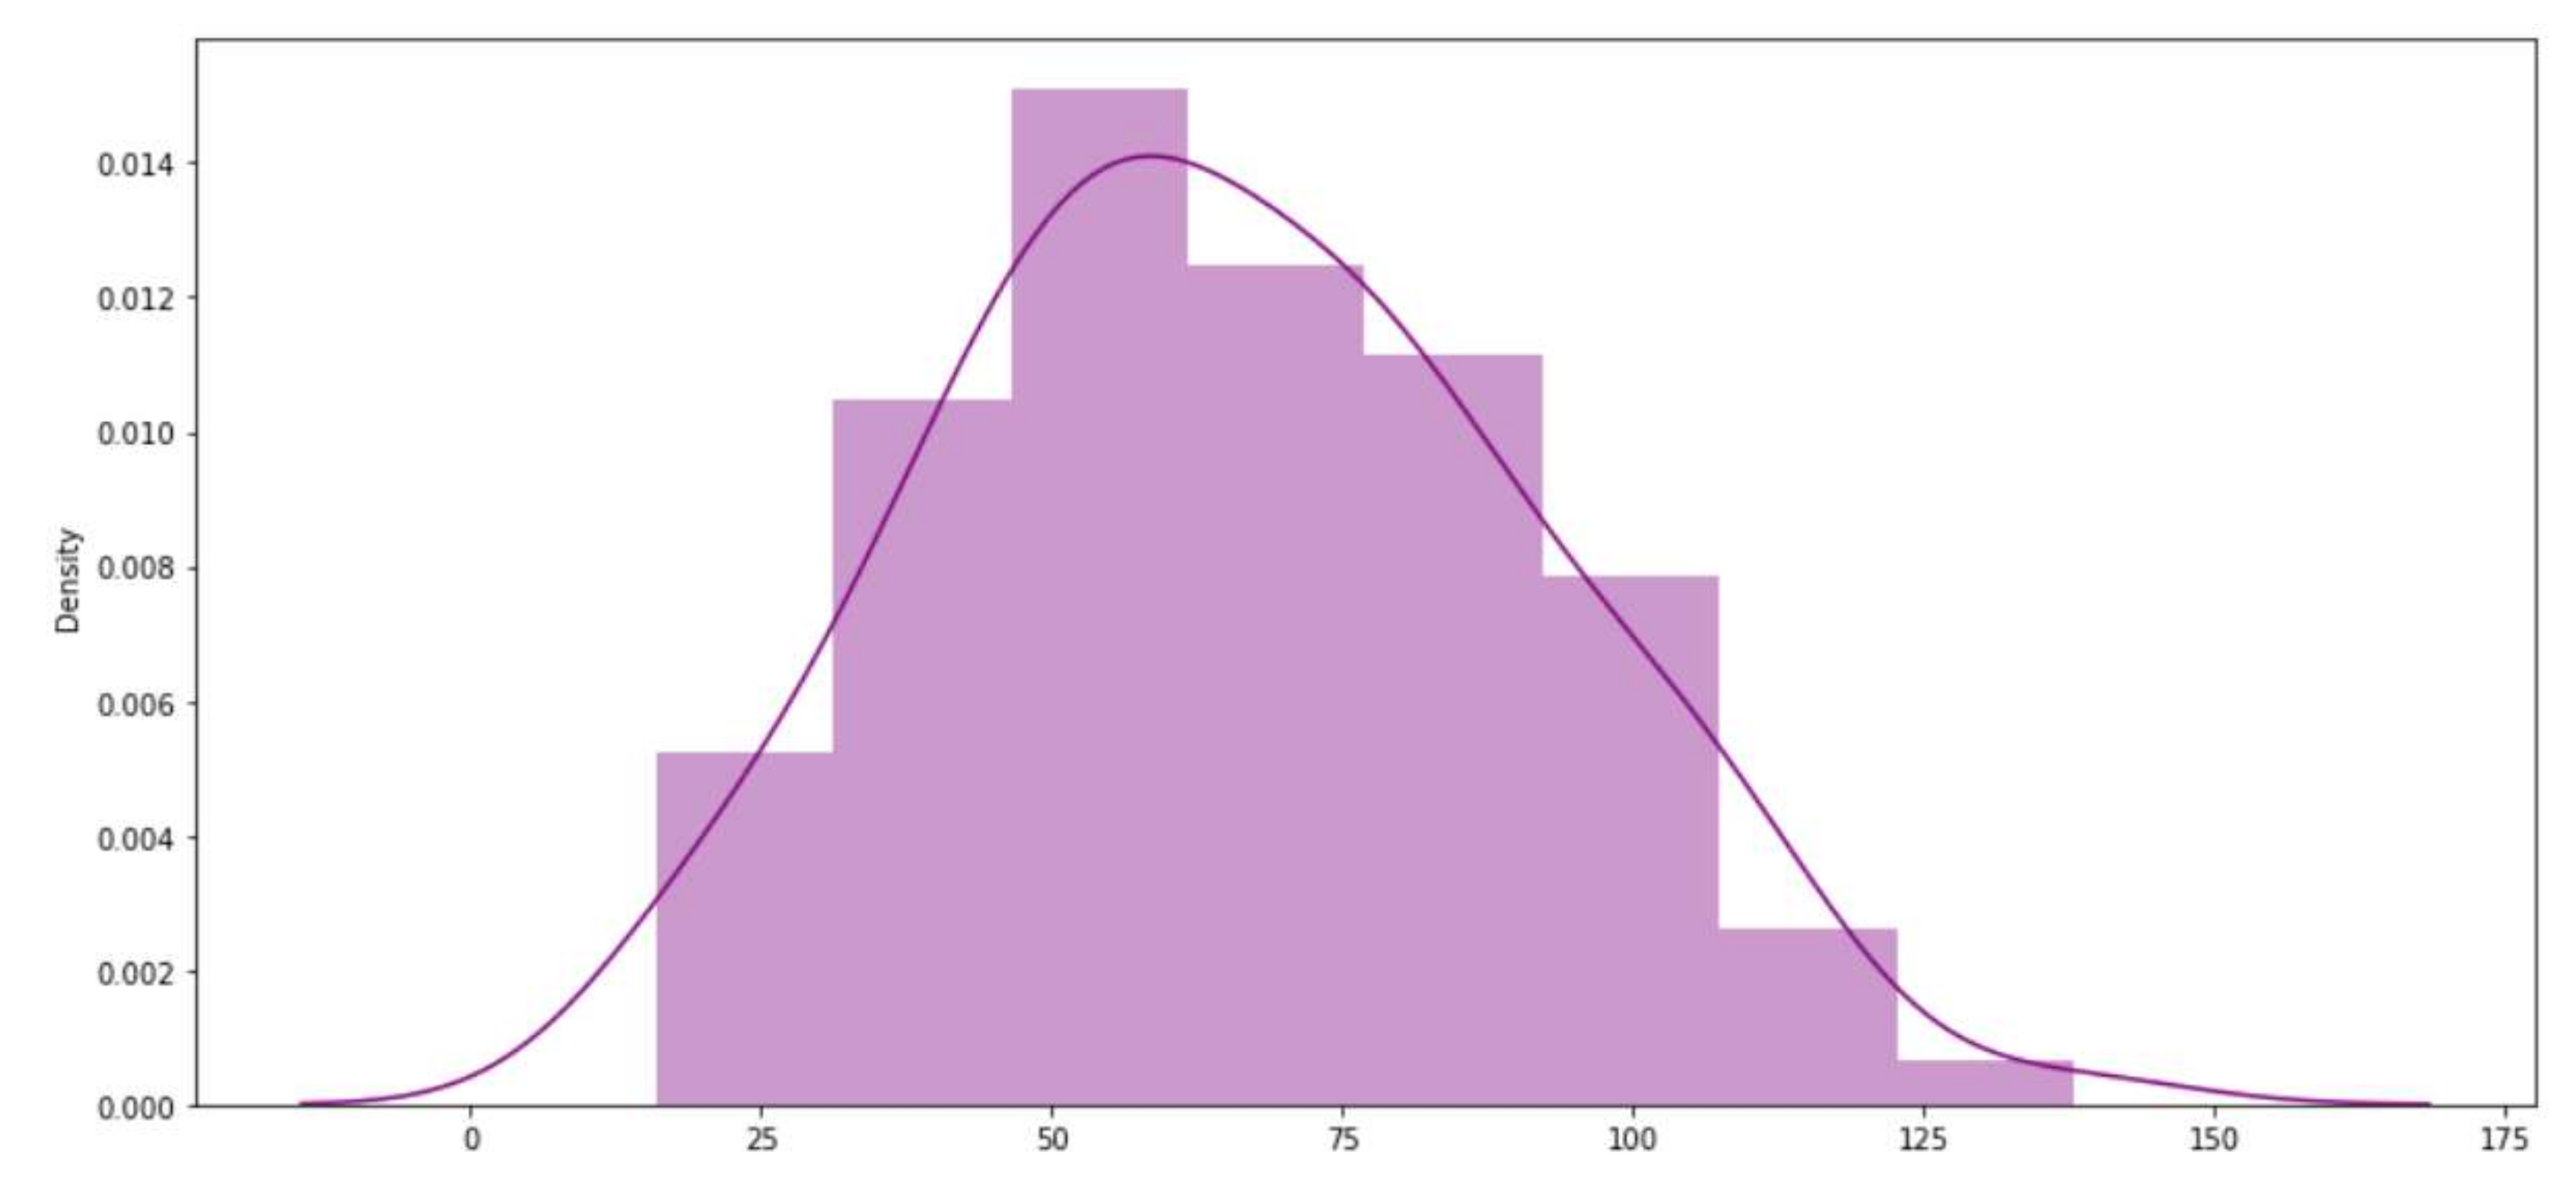
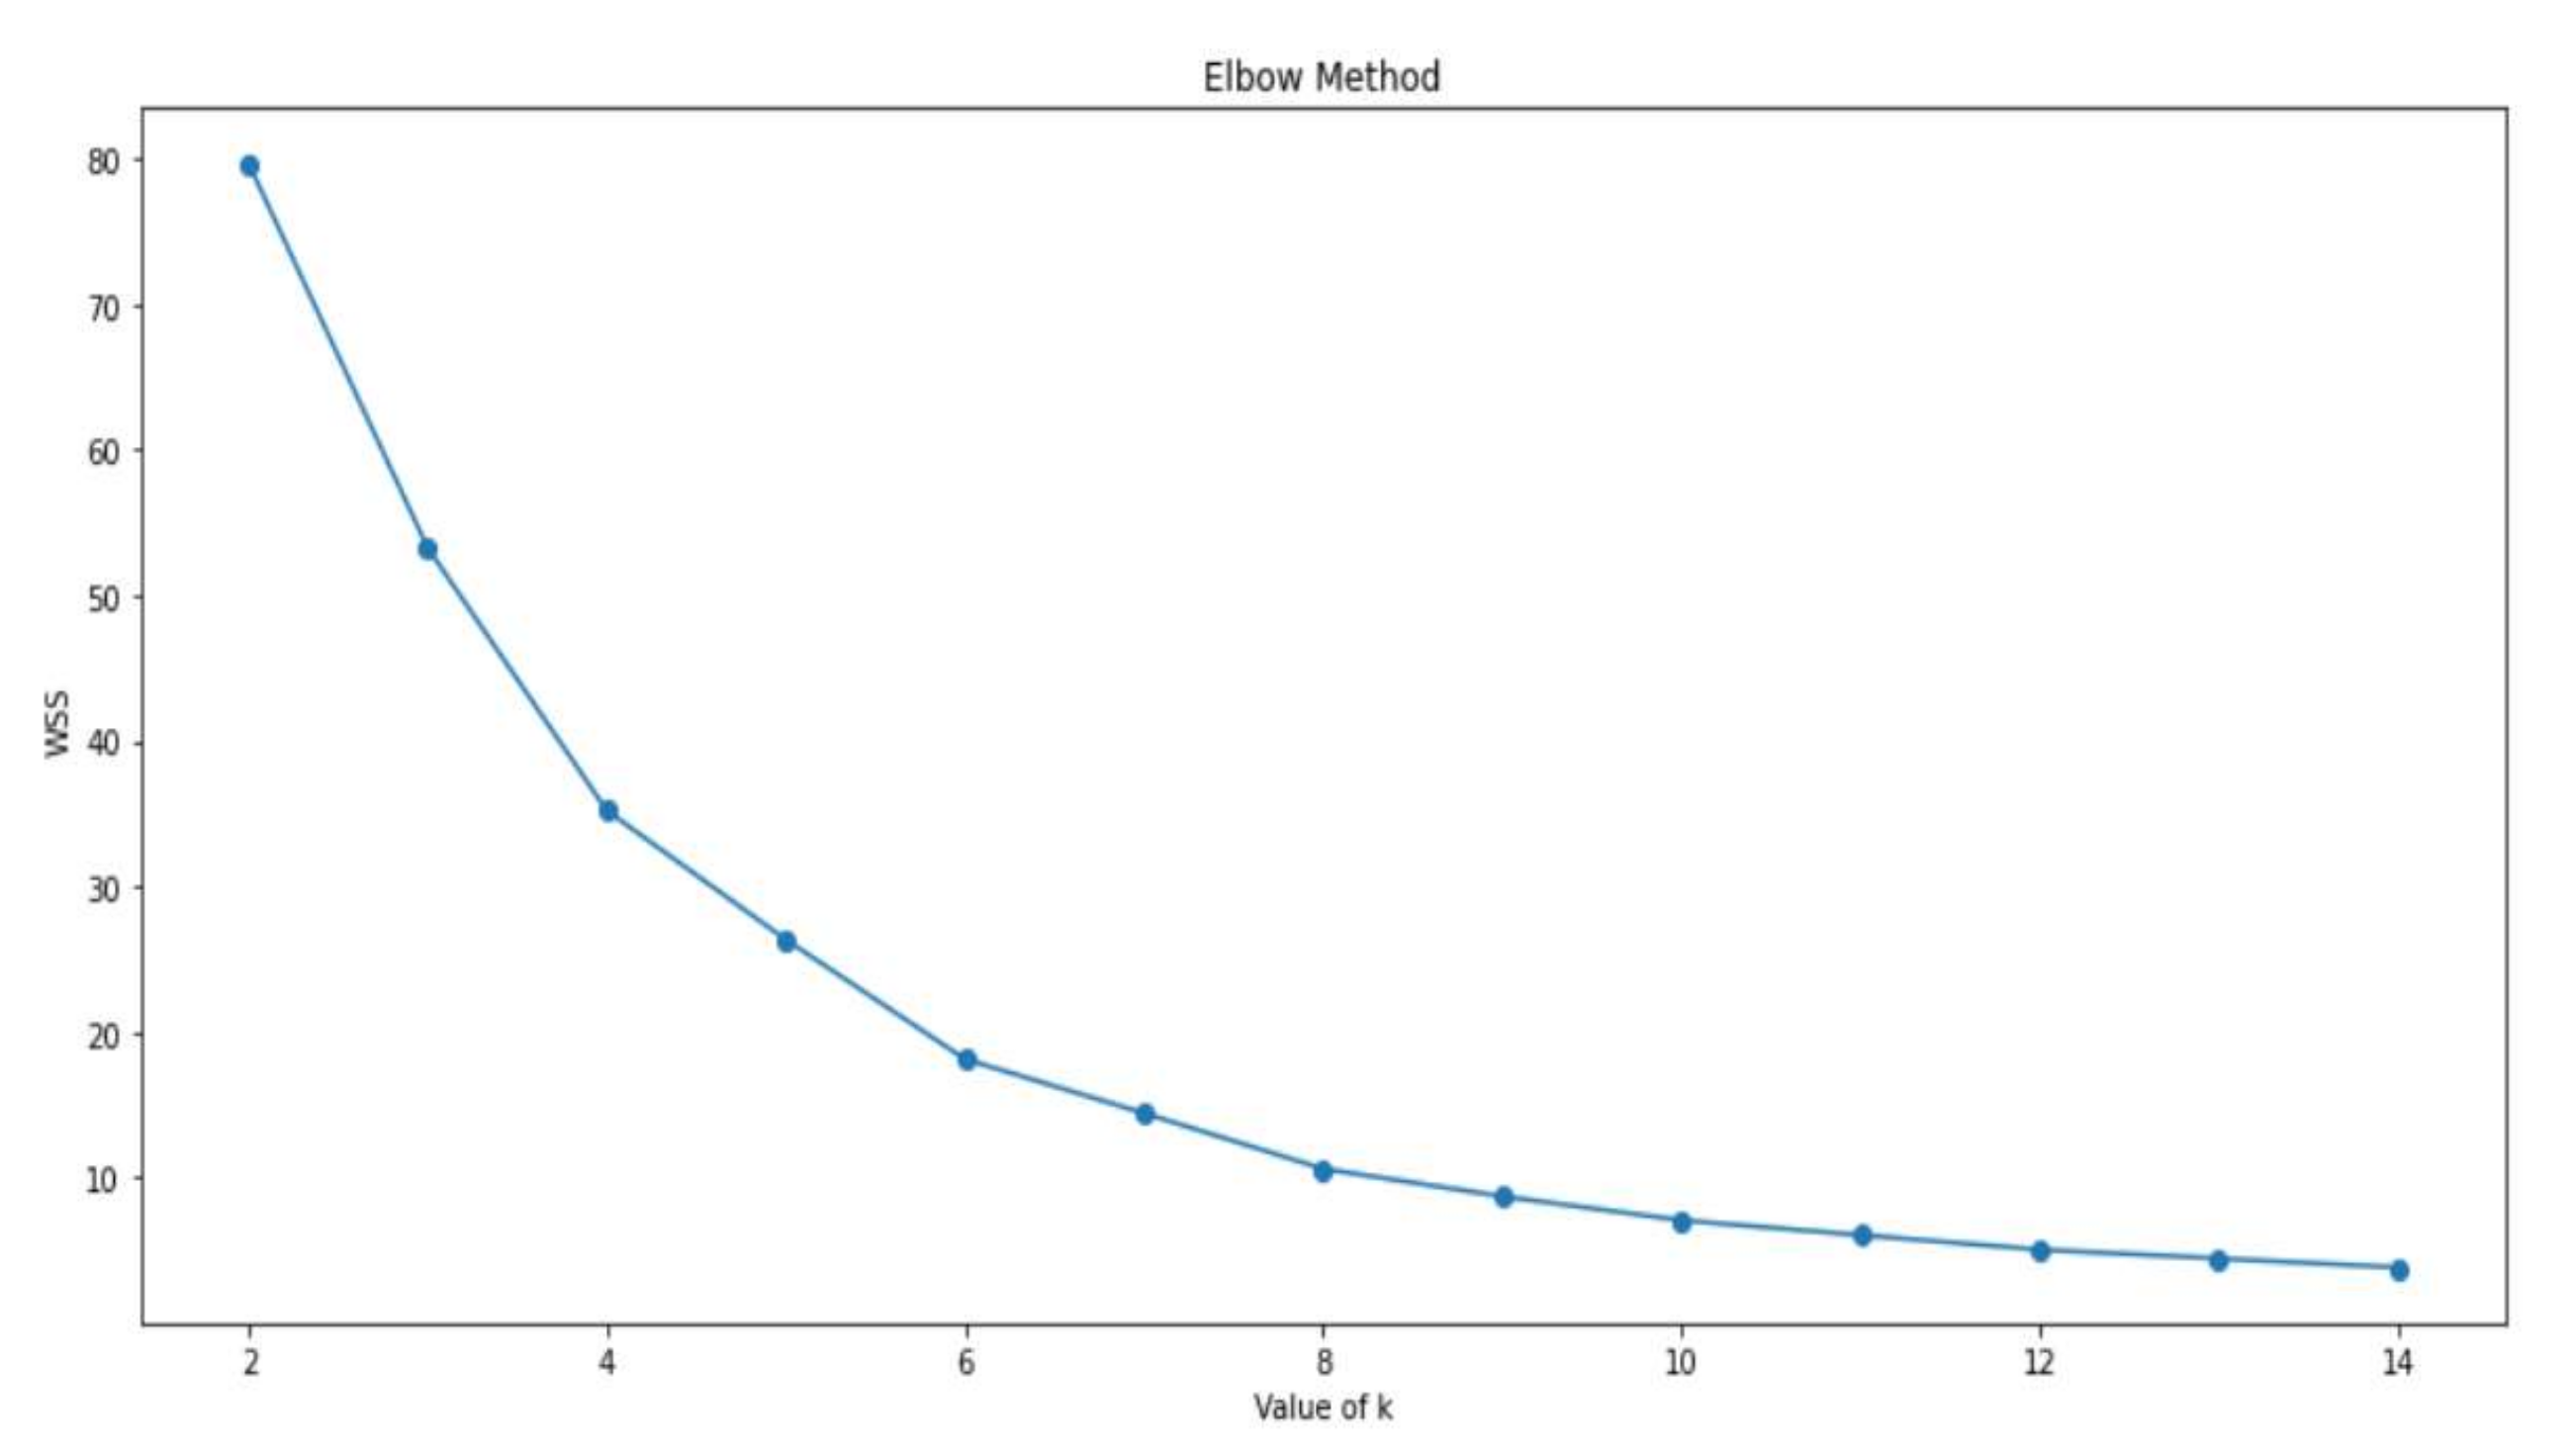
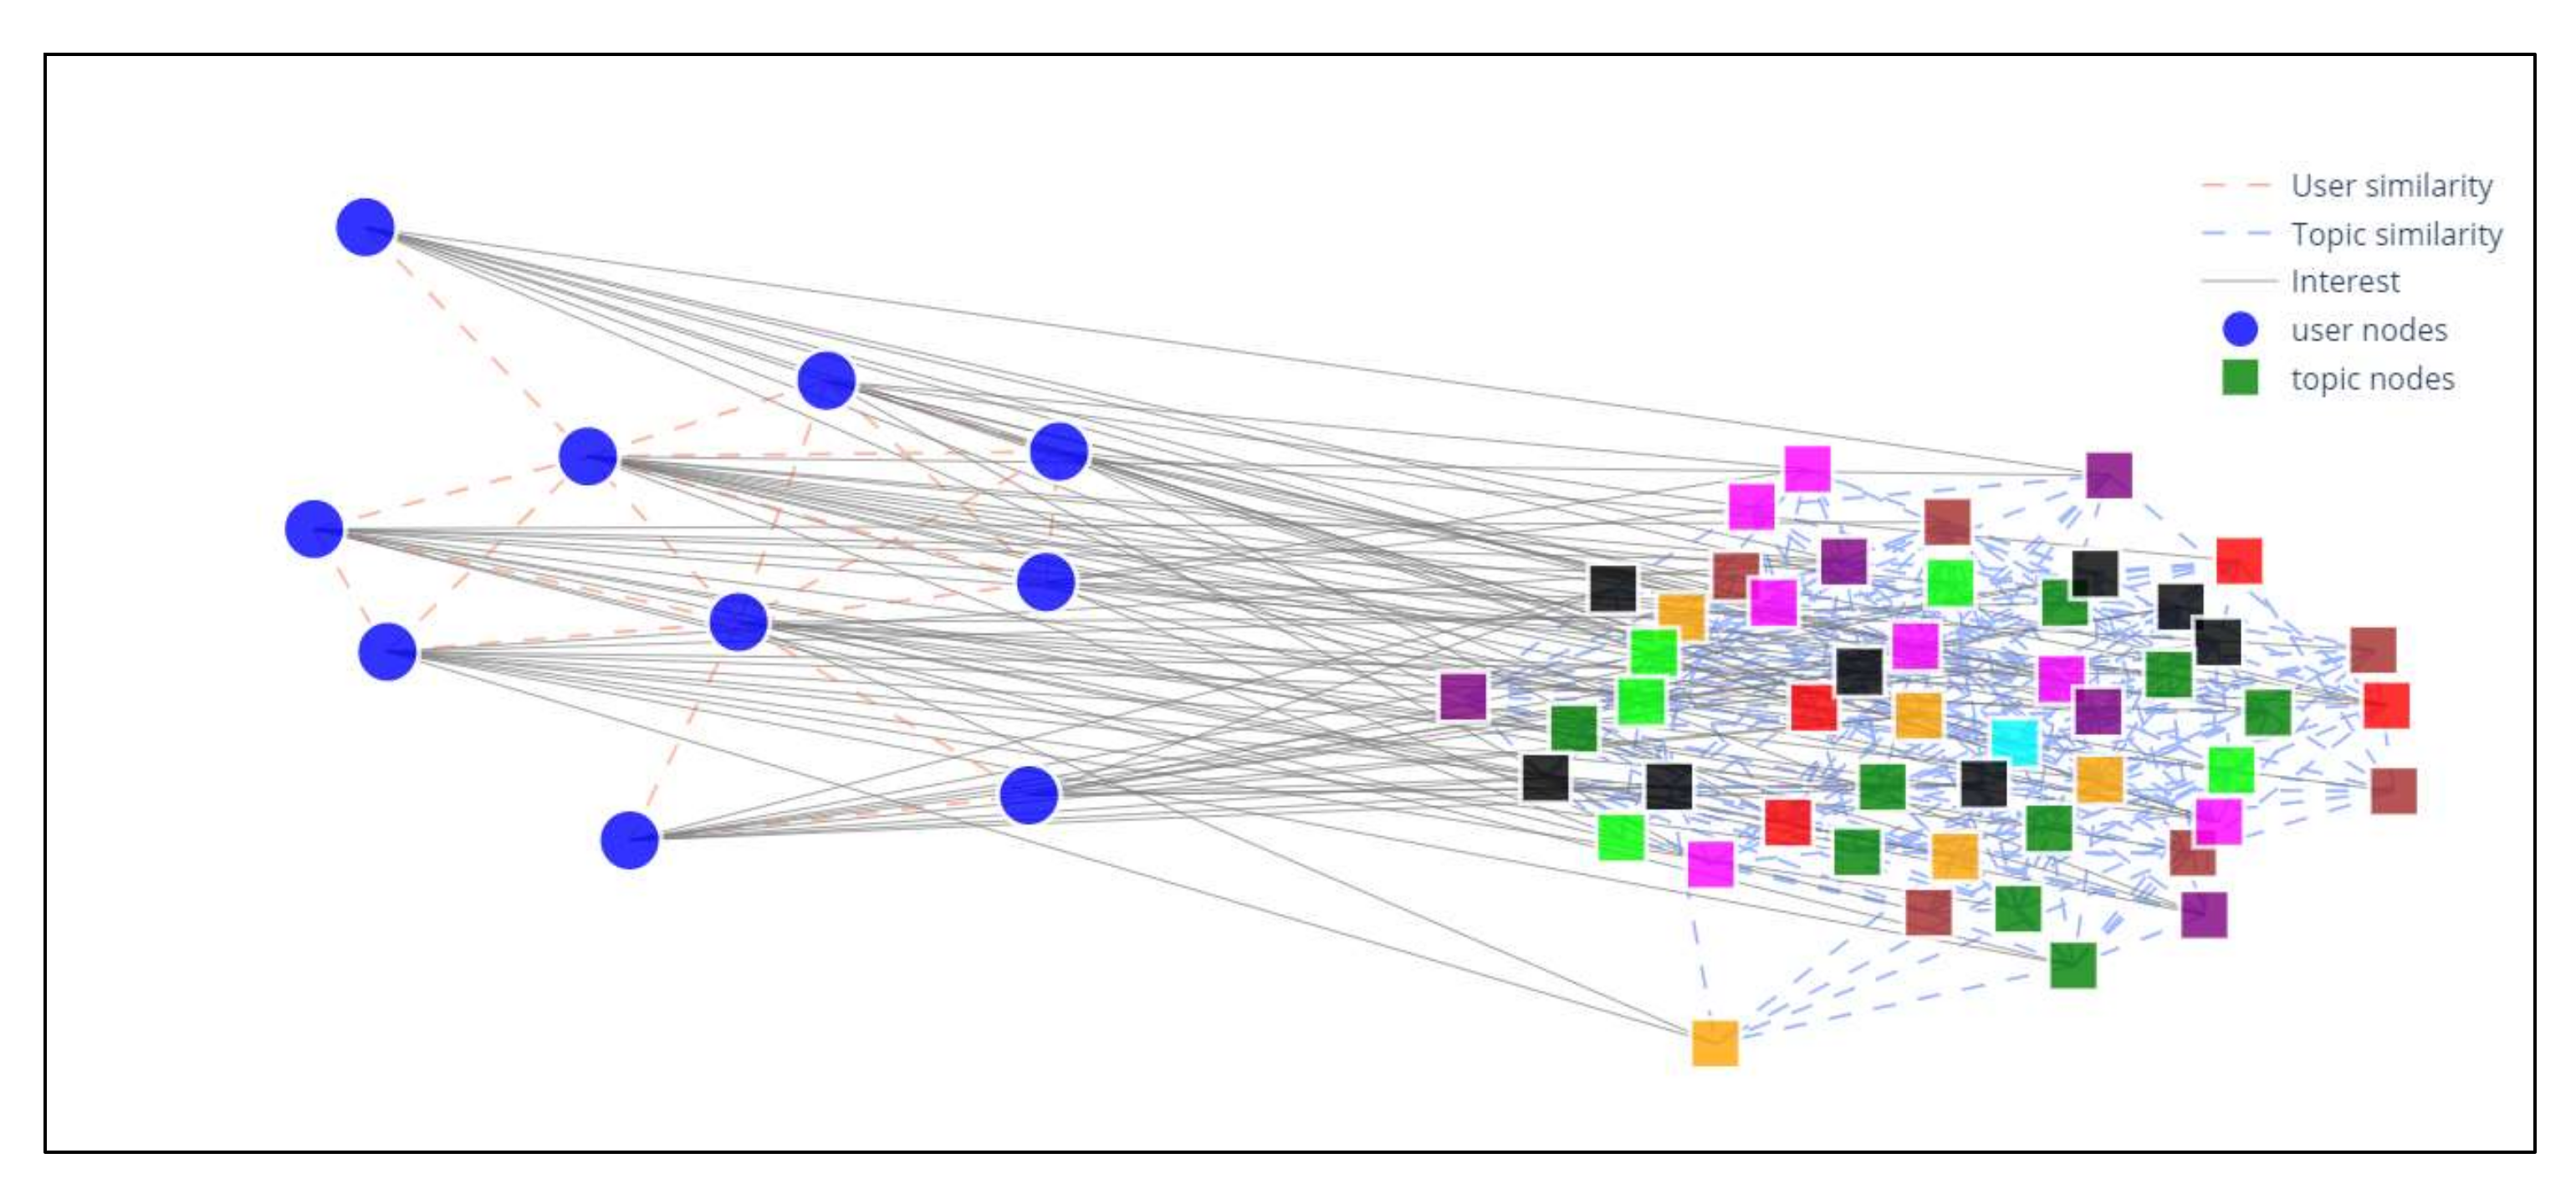
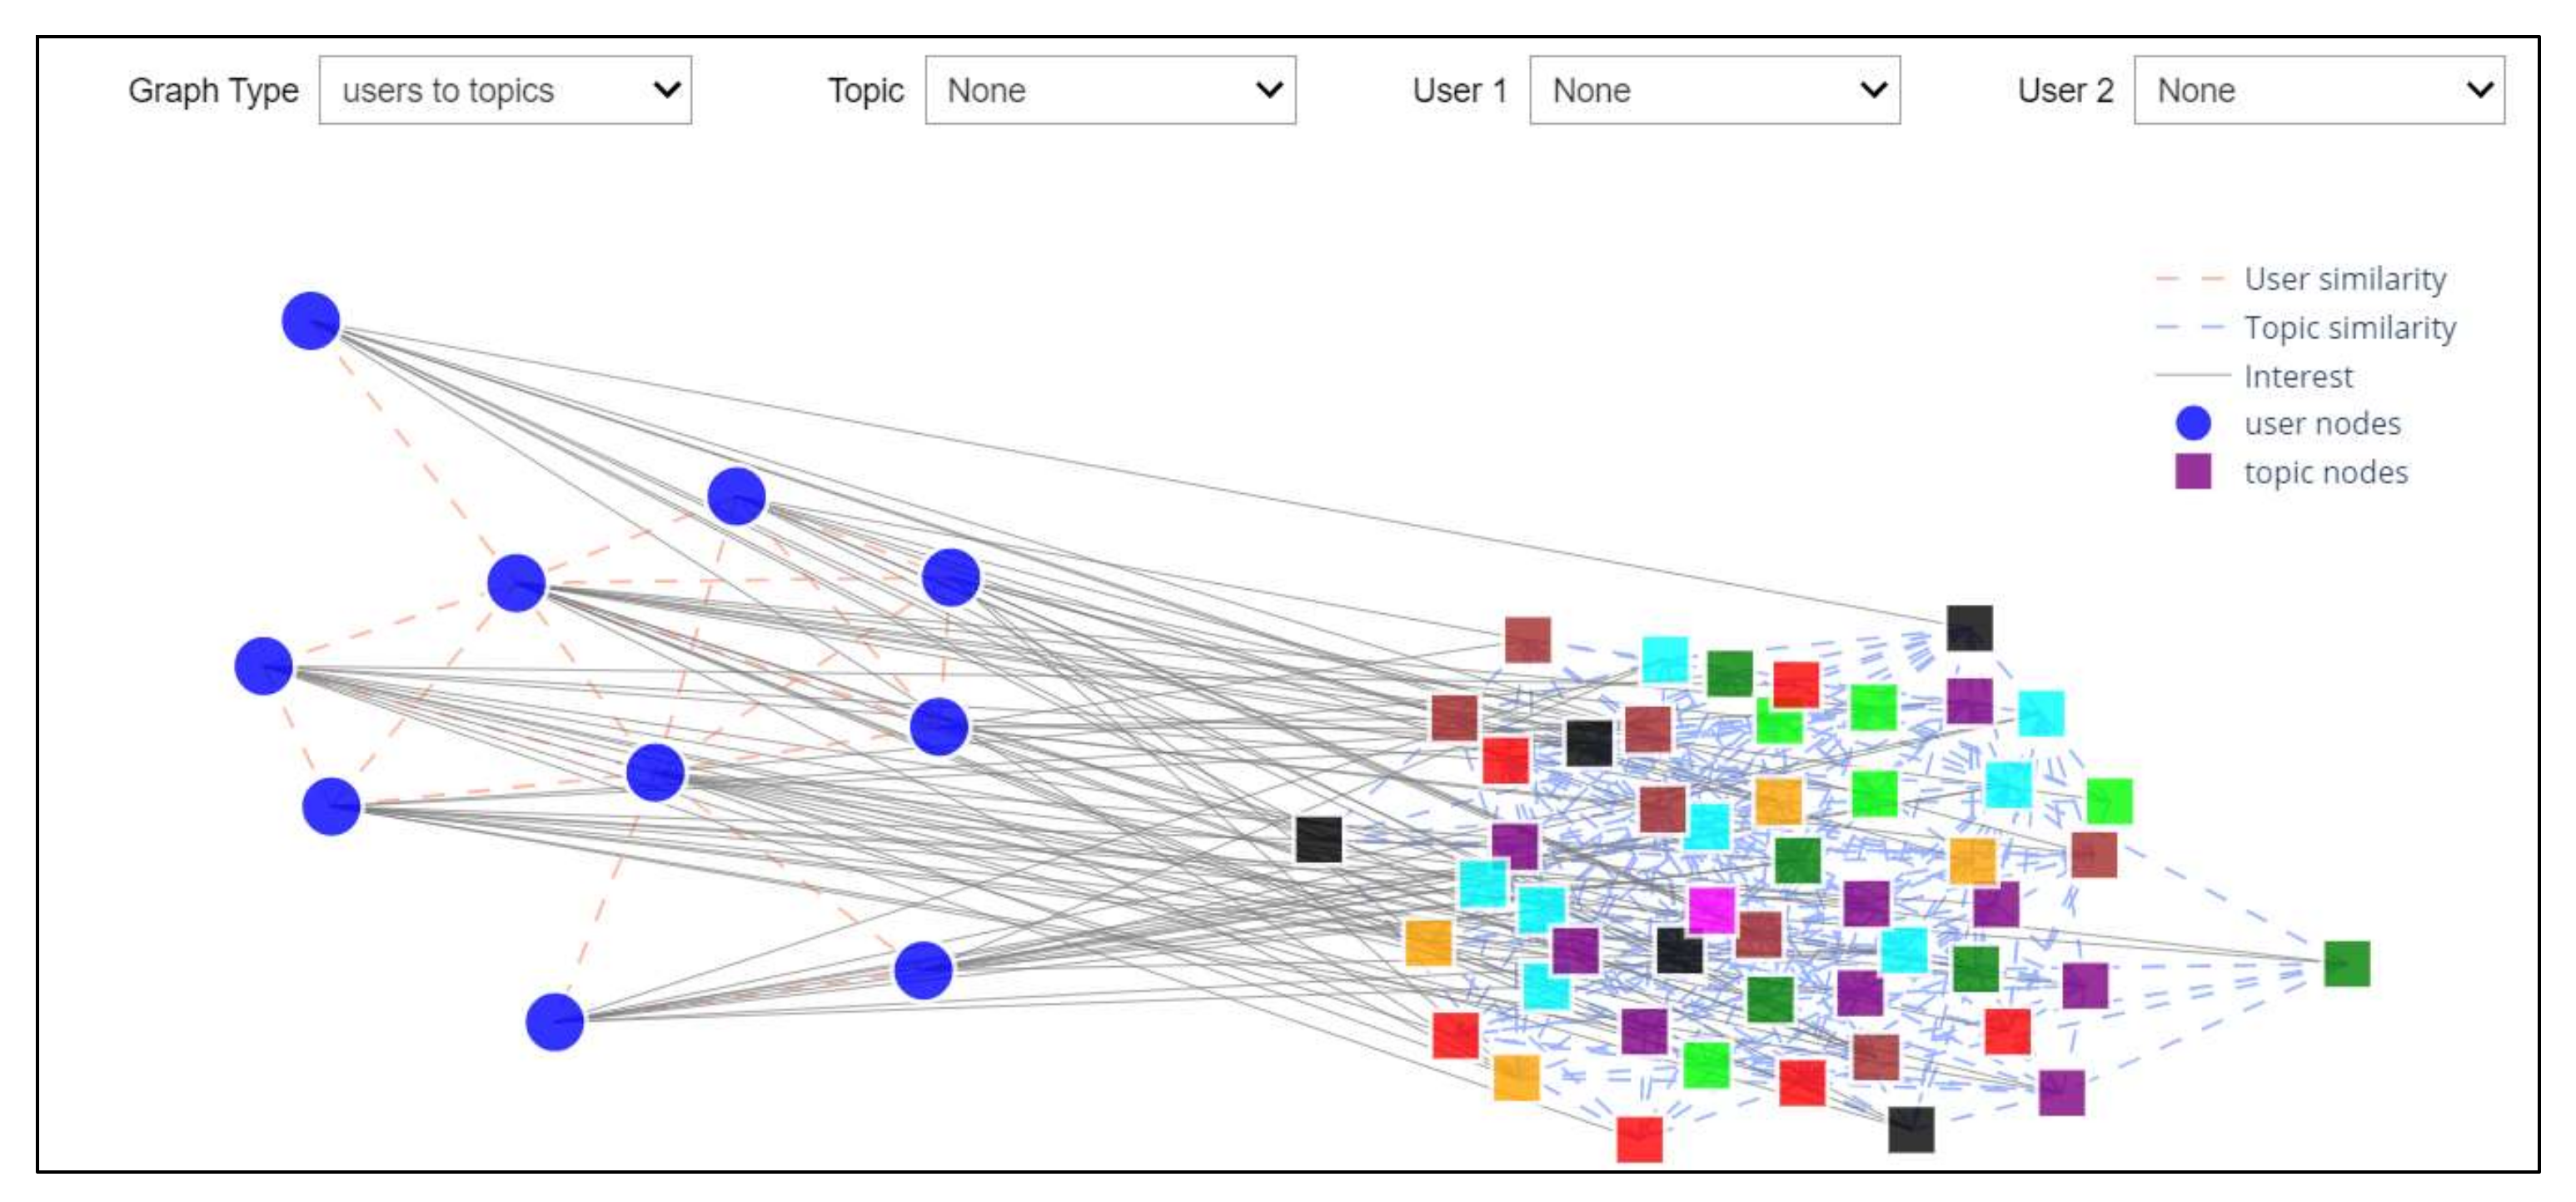
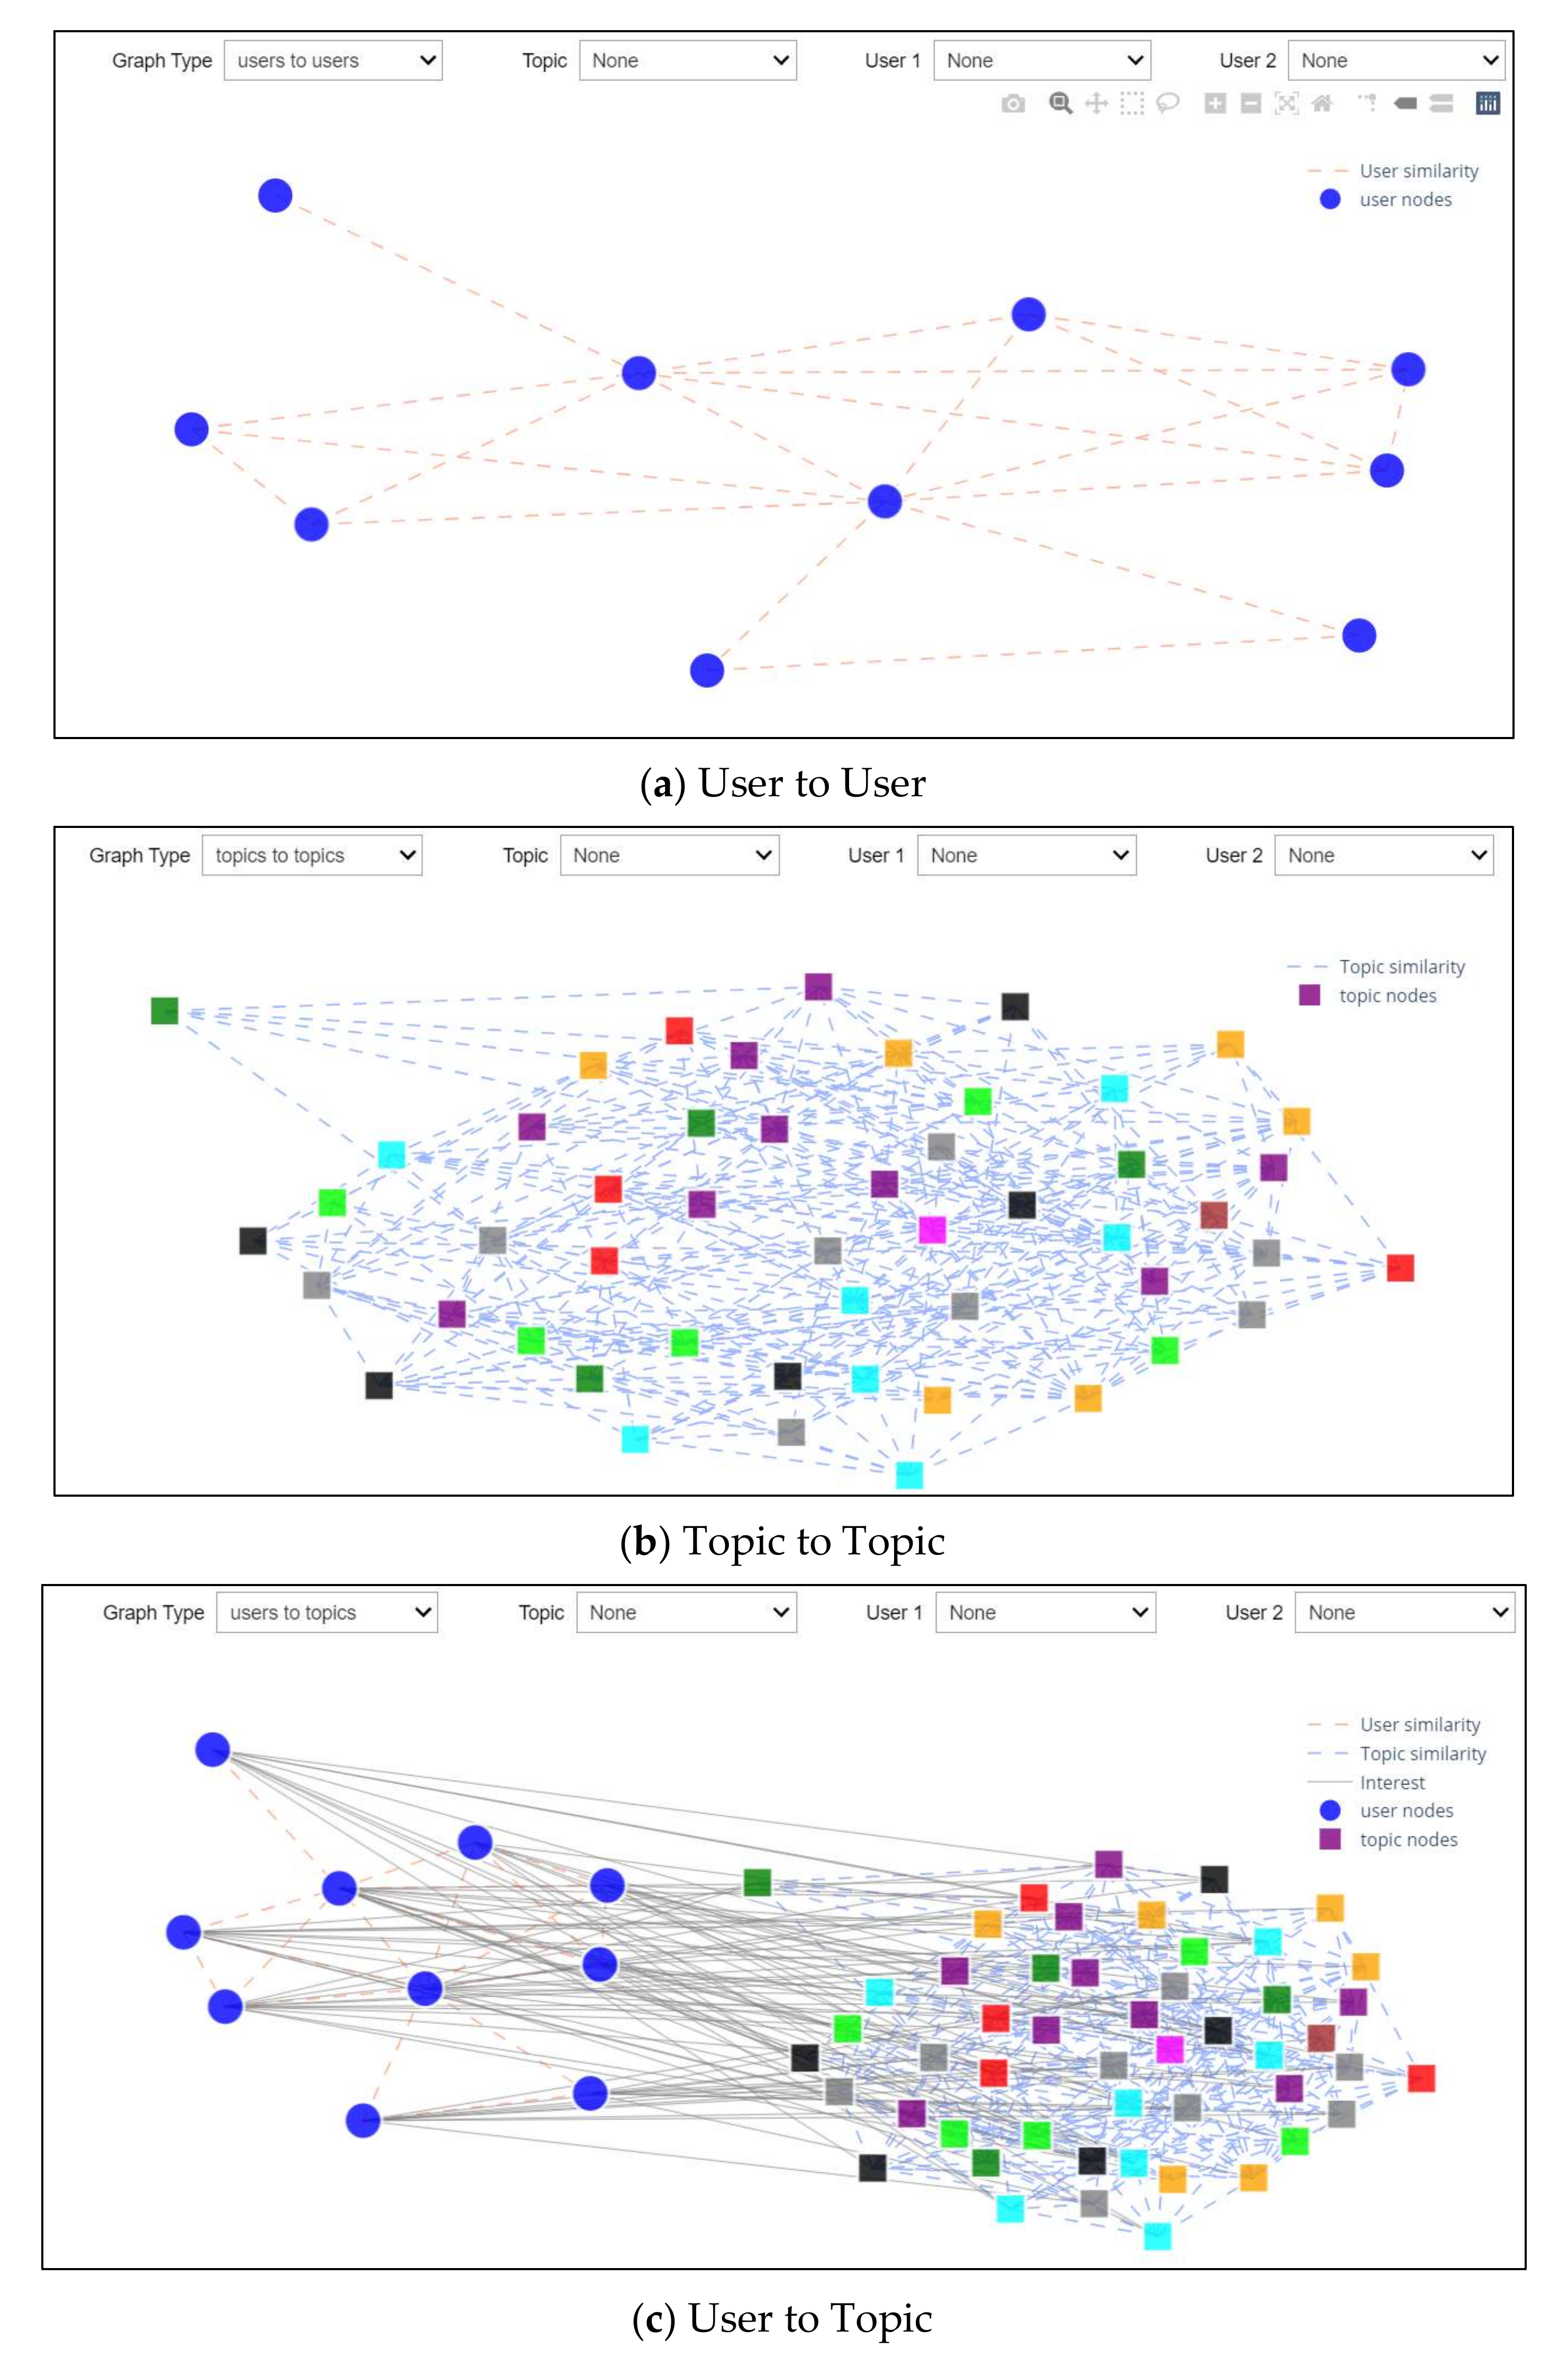

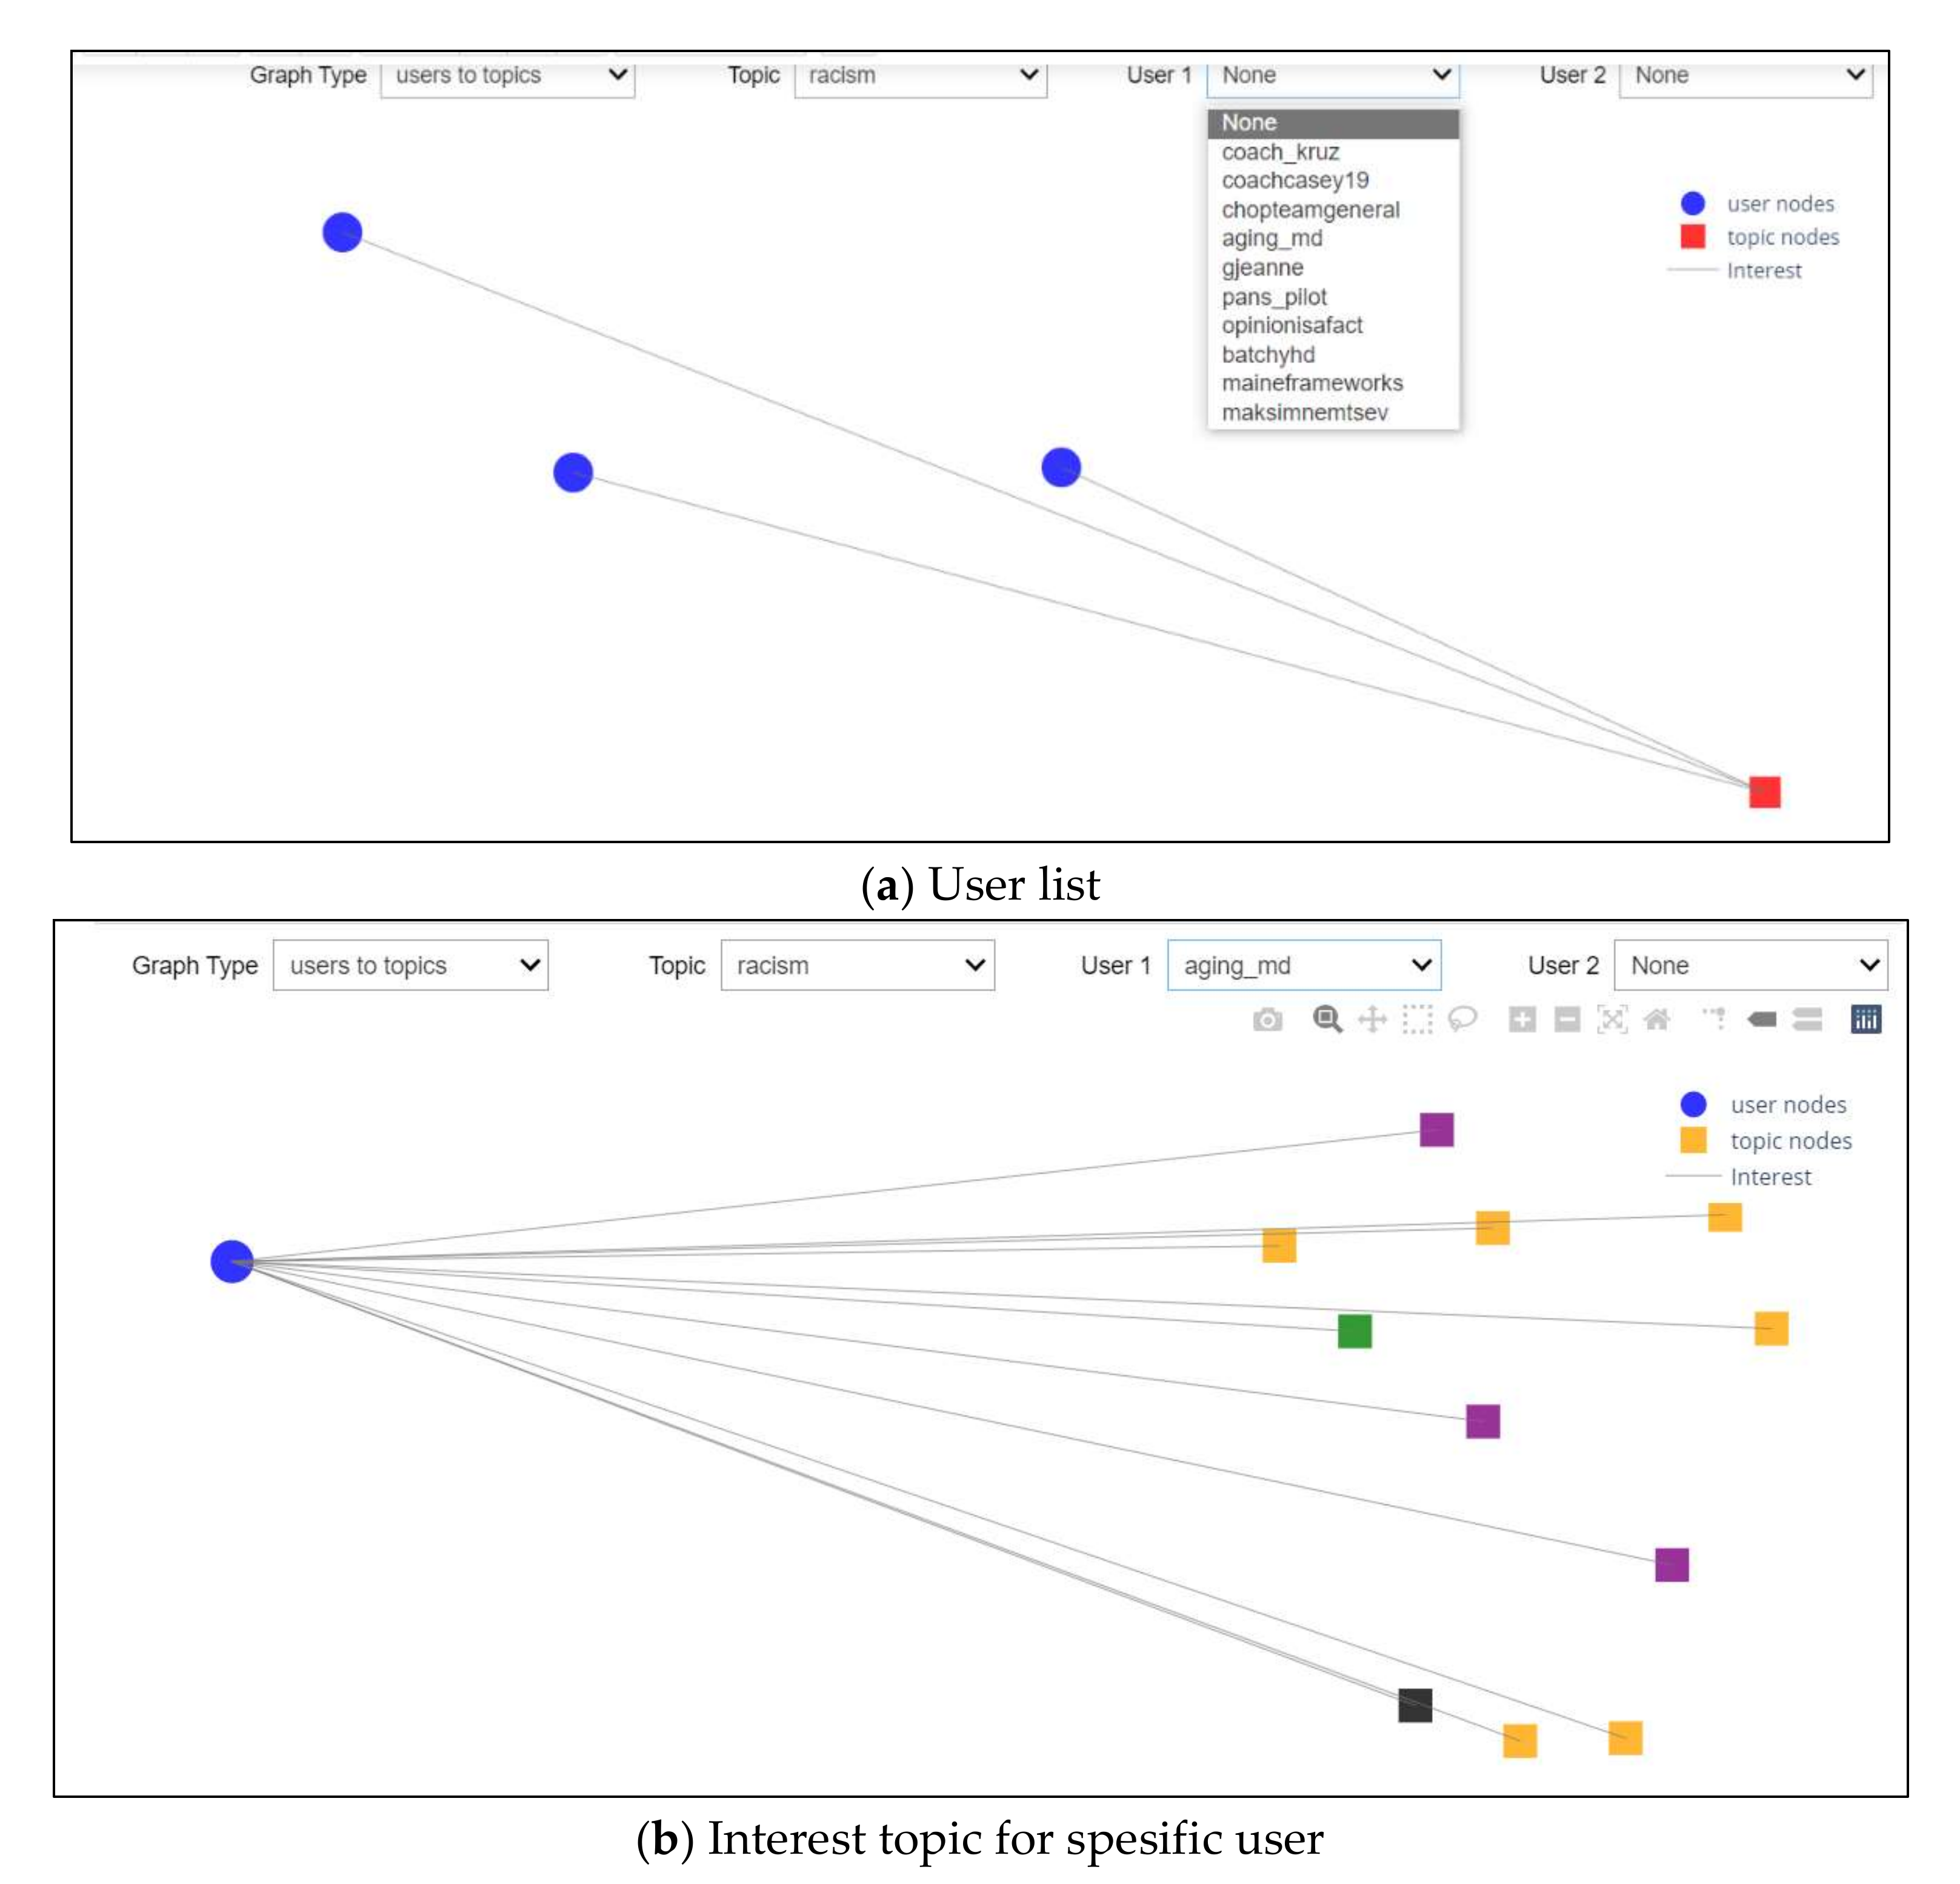
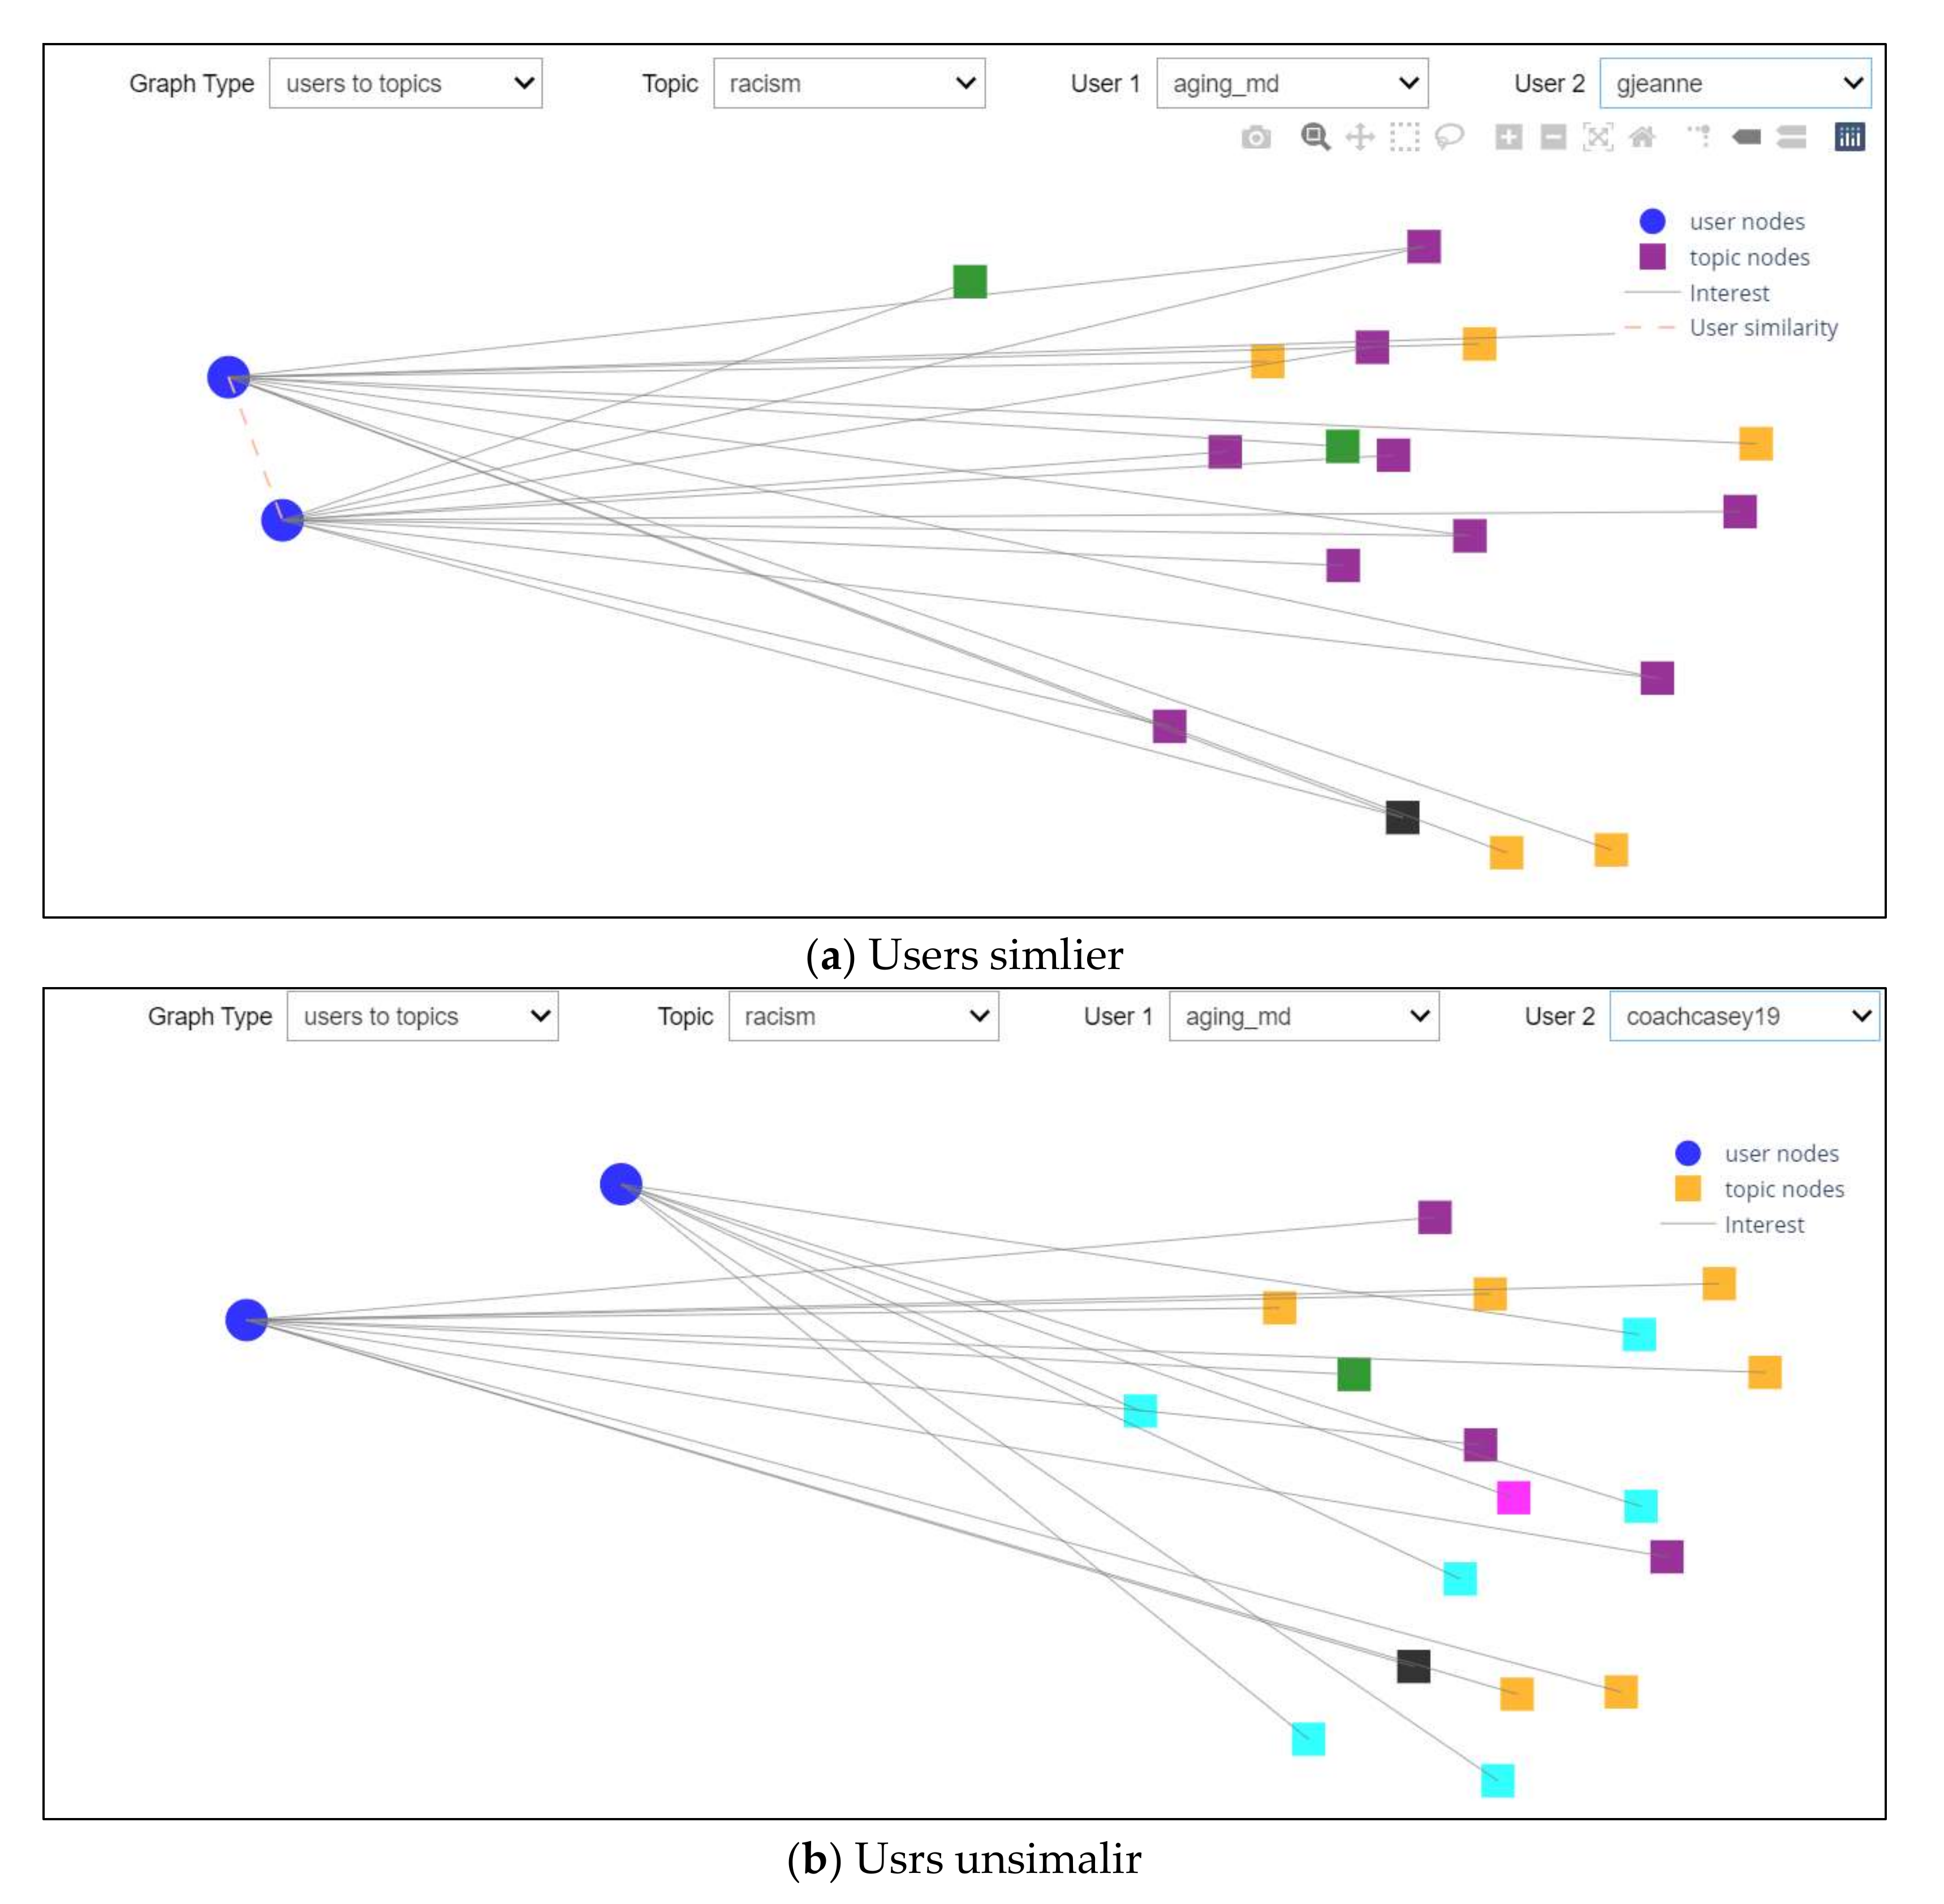
Publisher’s Note: MDPI stays neutral with regard to jurisdictional claims in published maps and institutional affiliations. |
© 2022 by the authors. Licensee MDPI, Basel, Switzerland. This article is an open access article distributed under the terms and conditions of the Creative Commons Attribution (CC BY) license (https://creativecommons.org/licenses/by/4.0/).