Review

Energy Use in the EU Livestock Sector: A Review Recommending Energy Efficiency Measures and Renewable Energy Sources Adoption

by
Bas Paris
1,*,
Foteini Vandorou
2,
Dimitrios Tyris
1,
Athanasios T. Balafoutis
2,
Konstantinos Vaiopoulos
2,
George Kyriakarakos
2,
Dimitris Manolakos
1 and
George Papadakis
1
1
Department of Natural Resources and Agricultural Engineering, Agricultural University of Athens, 75 Iera Odos str., 11855 Athens, Greece
2
Institute of Bio-Economy & Agro-Technology, Centre of Research & Technology Hellas, Dimarchou Georgiadou 118, 38333 Volos, Greece
*
Author to whom correspondence should be addressed.
Appl. Sci. 2022, 12(4), 2142; https://doi.org/10.3390/app12042142
Submission received: 17 December 2021 / Revised: 13 February 2022 / Accepted: 15 February 2022 / Published: 18 February 2022

Abstract

:
This study conducts a review bringing together data from a large number of studies investigating energy use in EU livestock systems. Such a study has not been conducted previously, and improvements in our understanding of energy use concentrations in livestock systems will aid in developing interventions to achieve the EU’s 2030 and 2050 sustainability targets. The results from the Life Cycle Assessments included in this review indicate that energy use is concentrated in feed, housing, and manure management. In most systems, animal feed is the dominant energy use category. Regarding specific livestock categories, the studies covered indicate that energy use requirements range from 2.1 to 5.3 MJ/kg per ECM for cow milk, 59.2 MJ/kg for a suckler cow–calf, and 43.73 MJ/kg for a dairy bull, 15.9 MJ/kg to 22.7 MJ/kg for pork production, 9.6 MJ/kg to 19.1 MJ/kg for broiler production, 20.5–23.5 MJ/kg for chicken egg production. Our review indicates dominance of and dependence on fossil fuel and discusses the situation and research around transitioning towards renewable energy sources and improving energy efficiency. Our analysis indicates that existing energy use data in livestock systems are fragmented and characterized by multiple methodologies and considerable data gaps. In our view, there is a need for the development of a standardized methodology for measuring energy use in livestock systems, which we consider a necessary step to develop interventions that reduce fossil energy use in livestock systems and its contribution to climatic change.

1. Introduction

The EU livestock sector is a significant contributor to climatic change, a driver of land-use change, dependent on fossil energy sources, and a significant emitter of greenhouse gas (GHG) emissions [1]. EU member states have significant livestock populations, with more than half of all agricultural holdings (5.7 million) keeping livestock, while the annual value of livestock products is €170 billion. Based on data from 2018, the main livestock populations in the EU consisted of 148 million pigs, 87 million bovine animals, and 98 million sheep and goats [1,2], while the main outputs of the livestock sector are meat and milk products.
Significant data are available on a European level on the production levels, production patterns [2,3], and financial accounts of livestock [4] held in the EU. However, relatively little information is available on the energy use associated with livestock production in the EU as a whole and for specific livestock categories. In recent years, national and EU policy is increasingly focused on improving environmental sustainability and animal welfare of livestock production, and in order to achieve the goals set out in the Green Deal and the Farm to Fork strategy, livestock rearing, and production will need to transform in the coming decades [5]. For the development and implementation of these goals, a clear understanding of energy use concentrations in the livestock sector in production systems and across production stages is a prerequisite.
Eurostat, Faostat, and individual member states provide data on energy use in agriculture, collected through surveys, but not specific livestock sectors [3,6]. Certain studies look at particular aspects related to energy use and livestock production, including Costatino et al. (2016) [7], who investigate the energy use for climate control in livestock housing in Europe, Weiss and Leip (2012), who investigated greenhouse gas emissions from the EU livestock sector [8], Ramirez and Blok (2006), who investigated the energy requirements associated with creating one pound of meat in four European countries [9], Veermäe et al. (2012) provide an overview of energy consumption in animal production [10], and De Vries and De Boer (2010) compared the environmental impacts through a number of life-cycle assessments (LCAs) in the livestock sector [11].
In addition, a range of individual studies has been published in recent years, mainly as LCAs, investigating energy use on individual farms in specific agroecological contexts and providing data on the energy embedded in animal feed as well as direct on-farm energy use [12,13,14,15,16,17,18,19,20,21,22,23,24,25]. These include studies that investigated the environmental impacts of beef production systems [12,20,23], pig production systems [13,14,18,22], poultry meat and egg production systems [15,19], and milk production systems [23,24,25], as well as smaller livestock production systems, such as sheep and goat [16,17]. Similarly, there are a number of publications that focus on the production and use of animal feed, which highlights that 60-70% of European farmland is used to produce feed for livestock [10,26,27,28].
Simultaneously, there have been a number of important trends in EU livestock farming in recent decades that affect energy use. These include intensification, whereby livestock farming is increasingly characterized by larger farms and higher livestock densities [29], increased use of breeding techniques (breed substitution, cross-breeding, and within breed selection) [30], increased dependence on imported animal feed, and in recent years, there is a notable shift, driven by both supply and demand factors, towards alternative and more sustainable production techniques based on organic principles and the adoption of fossil-energy-free strategies and technologies (FEFTS) [30,31,32,33,34,35].
A review bringing together insights and data from these studies in an accessible manner is necessary. In this context, the goal of this paper is to provide a review of energy use in the EU livestock sector by bringing together data from a range of studies. The rest of this section provides a brief description of a conventional livestock system in the EU (specific systems for specific livestock categories are discussed in more detail in the Results section), Section 2 presents the methodology for this review, Section 3 presents the main results from our review, and Section 4 provides a wider discussion.
Livestock systems and their energy use in the EU show significant variation and are affected by a variety of factors, including geography, production systems, and agroecological zones [7,9]. There are, however, a number of important generalizations regarding energy use concentrations, which are described in more detail per livestock category in the Results section.
In most production systems and livestock categories, animal feed is the main energy-consuming input [36,37]. Within the EU, about a third of total manufactured animal feed is compound feed; other ingredients are artificial forages (approximately 50%) and direct-fed raw materials (approximately 20%). In addition, a significant share of feed comes from pasture, estimated to be around 940 million tonnes [38]. According to the EU, 77% of total feed consumption is produced domestically; feed production accounts for around 60% of total wheat, maize, and barley consumption. Despite this, the EU livestock sector is dependent on imported protein sources for livestock feed. It is estimated that the EU has a deficit of about 70% of high-protein materials, of which 87% is met by imported soybean and soymeal [39]. The EU imports 18.5 million tonnes of soybean meal every year, of which 95% goes towards feeding animals [40].
Energy inputs in the production of animal feed are dominated by the production of fodder crops and the associated indirect energy inputs, including fertilizers, pesticides, seeds, and feed supplements [8]. Many existing studies provide figures on the energy use associated with the production of animal feed; these, however, show significant variation depending on origin, raw material use, and livestock system [27]. The production, processing, and transportation of these feeds require a significant amount of energy inputs, which are mostly dependent on fossil sources, and represent a large proportion of the total energy consumed in livestock production. From the data covered in this article, the proportion of feed (concentrates, conserved forage, or grazing) makes up more than 50%, and in many cases 75% or more, of the total energy consumption within livestock sectors.
In most systems, livestock is kept in animal housing, but significant variation is reported in terms of energy use depending on the structures used, the agroclimatic conditions, and the types of livestock used [7]. Generally, these systems offer some sort of climatic control of the indoor spaces, and the main energy-consuming categories are heating, cooling, ventilation, lighting, and a range of other devices [7]. In dairy systems, specifically, significant energy consumption is allocated to milking processes [24,41].
Manure management occurs in a variety of forms depending on the structure of the farm. Manure is generally collected and stored for a period of time in specific storage tanks that can be located underneath or close to the housing system. Various methods exist for moving the manure, such as via conveyor belts, through slated floors, or tractors. During the storage stage, or later, the manure is treated and most usually applied to land at a later stage [41,42].

2. Materials and Methods

2.1. Selection Criteria, Search Strategy, and Data Collection

This study conducts a meta-analysis based on the Preferred Reporting Items for Systematic Reviews and Meta-Analysis (PRISMA) in order to conduct a critical review of the energy use in the livestock sector. In order to be included in this paper, studies needed to meet a number of criteria set out by PRISMA. All studies needed to be peer-reviewed, published, and, when relevant, based on detailed LCA methodologies using one of the main LCA software and up-to-date database values. In a few cases, reports were also considered if they were widely cited, publicly available, and published by well-reputed organizations. Our search strategy followed a number of pre-set steps; the relevant studies were identified through keyword searches through SCOPUS and google scholar, while partners in the AgroFossilFree consortium were also requested to provide relevant studies. Studies were then screened for relevance, and data were only extracted/used if the methodology and results were comparable to other LCA studies. Due to this, over half of the identified studies were discarded due to a lack of a detailed breakdown of energy inputs. Instead, they provided only aggregate energy use figures with little or no methodological justification. In total, 22 papers were included in this review. This process also highlighted that different methodologies assess energy use using different parameters and categorizations, which are often not comparable to one another.
Energy use data were retrieved from each study and compiled. These data were then compared to other existing studies for verification. This process was chosen to account for the scarcity of accurate energy use data. Comparing the main findings of screened LCA studies with other studies placed results in a wider context, allowing for the identification of patterns and the comparison between different approaches and systems. In addition, this process facilitates the identification of future areas of research.
An operational definition of energy use in the livestock sector was adopted for this study, including energy from both direct and indirect sources. The boundary of this study was all energy used until the farm-gate. Direct energy use refers to all energy that is consumed in the production of livestock that happens on the farm. The direct energy sources included in this study were energy for all on-farm operations and machinery use, crop processing and feeding, milking processes (milking and milk cooling), manure handling, and animal housing (lighting, heating, cooling, dehumidifying, and ventilation). Indirect energy sources refer to energy that is associated with the production of livestock but is consumed prior to the farm. The indirect energy sources included in this study were the production of fertilizers, pesticides, and energy used in animal feed (includes all the energy used to produce animal feed, including for its raw materials). In practice, almost all studies provide data on animal feed as indirect energy sources. Energy use associated with the production of agricultural buildings, equipment, and machinery was not included; this approach was chosen as many studies do not include these data in their energy use data. In addition, there are considerable issues with measuring this agricultural infrastructure accurately as it is often assigned to other sectors, such as industry, and due to the long-time frame associated with the use of this agricultural infrastructure. Our results section presents these results; for a more detailed data breakdown per livestock category and sources, please see the Appendices A and B.
Conceptually, this study investigated energy use in the largest livestock sectors in the EU, including bovine (beef and milk), swine/pig meat, and poultry (meat and eggs). Other livestock sectors, including sheep and goat, are mentioned briefly but not discussed in detail due to a lack of sufficient reliable data; these are identified as areas for future research.

2.2. Bias Risk and Limitations

There are a number of bias risks within and across studies. By focusing mainly on LCAs, emphasis was placed on specific studies that investigated energy use in livestock systems within an individual or a small collection of farms in particular production systems and agroclimatic conditions. However, a variety of other factors, including policy, social factors, knowledge, input and output prices, all influence on-farm energy use. There are a number of additional important limitations associated with this study. Data are presented without degrees of uncertainty as LCAs generally do not provide data with uncertainty attached. The main drawback is that due to the nature of LCAs and the lack of uncertainty, it was difficult to transfer these results and use them for estimates for other farms.
A major drawback of investigating energy use in agricultural systems in general, including livestock, is that there is no standardized methodology for measuring energy use on-farm and within the food system. As such, different studies allocated energy use according to different categories, which made comparisons difficult. For instance, some studies provided aggregate figures for housing as a whole, while others provided breakdowns for different housing aspects. These limitations were largely addressed through the screening process. In addition, by focusing on LCAs, other methodologies for measuring energy use were not included. Additionally, data from minor and alternative livestock production systems were not included by focusing on conventional livestock production systems. Focusing on these sectors is an area for future research.

3. Results

3.1. Overview

Despite significant variations between geographical areas and production systems in the studies covered in this review, in all main production systems in the EU-27, except for beef, animal feed, which was an indirect energy input, was the main energy input in livestock systems; in most studies, animal feed accounted for around three-quarters of all energy requirements (Table 1). In meat production systems, the main direct energy requirements were for housing and feeding (mainly in the form of electricity) and manure management (mainly through diesel use). In milking systems, the main direct energy-consuming activities were related to milking, milk cooling, and water heating. For this, in certain countries, the main energy source was related to electricity and, in others, to direct fossil fuels. Other electricity-consuming activities, such as water pumping and lighting, were found to be relatively minor. The studies covered suggested that beef was the most energy-intensive production system per kilogram of meat, followed by pork and poultry.
Regarding specific ranges, the studies covered indicated that energy use requirements range from 2.1 to 5.3 MJ/kg per ECM for cow milk, 59.2 MJ/kg for a suckler cow–calf, and 43.73 MJ/kg for a dairy bull, 15.9 MJ/kg to 22.7 MJ/kg for pork production, 9.6 MJ/kg to 19.1 MJ/kg for broiler production, 20.5 to 3.5 MJ/kg for chicken egg production (Figure 1). The variation between species is likely a combination of different production systems and biological factors in which different species have different growth rates and reproduction rates requiring different amounts of feed per output.

3.2. Cow Dairy Production

The EU produces around 158 million tonnes of cow milk annually [43]. The main milk-producing countries were Germany (20.8%), France (15.8%), the Netherlands (8.9%), and Poland (7.7%). Milk production systems vary significantly, ranging between low and highland, and intensive to extensive [25]. The majority of milk production occurs in intensive systems where dairy cows are generally kept inside, feed is imported from off-farm, and during lactation, cows are generally milked two or more times a day [44]. In addition to the energy use associated with feed and housing, various processes related to milking consume a considerable amount of energy, including milk cooling, milk harvesting, water heating, and water pumping.
The following studies were located and included in this paper: Guerci (2013), who conducted 12 LCAs on milk production, including energy use parameters, across three European countries [25]; de Visser (2012), who calculated energy use averages in milk production for six countries through conducting 18 LCAs; Upton (2013), who calculated the energy use across 22 commercial dairy farms in Ireland [45]; Cederberg and Flysjö (2004), who provided energy use parameters through LCAs for 23 dairy farms in Sweden [22], and Thomassen et al. (2007), who provided energy use parameters through an LCA of organic and conventional systems in the Netherlands [46]. These studies had significant variations, while the total energy inputs per energy-corrected milk (ECM) varied from 2.1 to 5.3 MJ (Figure 2 and Table A1). Organic systems appeared to require less energy input generally, but this was inconclusive, though due to production methods, these energy inputs are more likely to come from renewable sources [22,25]. The energy embedded in the feed was by far the highest energy input in all but one of the studies.
A number of studies provided data on direct electrical energy use on dairy farms (Table 2). These studies generally illustrated that milk cooling and milk harvesting were the largest electrical energy consumers, followed by water heating and water pumping [24]. From the studies that included liquid fuel energy use, there was relatively little information available on its specific uses. However, it is generally assumed that this was allocated to tractor use associated with pasture management [24]. It is important to note that individual studies provided different sets of data depending on a range of factors, including the production system and the type of milking system [24].

3.3. Beef Production

According to Eurostat, in 2018, the EU production of beef reached 7.9 million tonnes. The main beef producing countries were France and Germany [2]. Significant heterogeneity between production systems across the EU was observed [47] to a greater extent than in other livestock systems. Greenwood (2021) documented 25 different production systems [47], ranging from differences in feed (pasture to grass-fed), housing systems, economic production systems, and breeds.
According to Nguyen et al. (2010), it has been estimated that around half of all EU beef production comes from culled dairy cows and that the other half comes from systems specialized in beef production [12]. Multiple studies highlight that, compared to the main livestock systems, the production of beef carries the highest environmental load per kilogram of meat produced [12,48]. Data presented below are from Nguyen et al. (2010), who conducted an LCA on four types of beef production systems in the EU [12] and is further complemented by a beef production study by Veysset et al. (2014) [20]. Nguyen et al. (2010) showed that on average in the EU, 59.2 MJ/kg of beef was required for a suckler cow–calf and 43.73 MJ/kg for a dairy bull (Figure 3 and Table A2).
Considering that around 60% of beef production in the EU comes from dairy bulls and 40% from suckler cows–calves, a rough estimate would suggest that 30-40% of all energy used in livestock production is associated with feed and fertilizers. European cows are generally grown on a combination of home-grown grass and cereals as well as imported soy meal and minerals [12]. However, it is important to note that the energy input in feed can vary significantly depending on whether a cow is fed on grass-pasture or concentrate-confinement, as pasture requires much less energy input for its cultivation and fertilization operations [36].
On the other hand, this rough estimate would suggest that 60–70% of energy consumption in beef production systems is associated with on-farm activities. Nguyen et al. (2010) provided a breakdown of direct energy use. His study highlighted that on-farm diesel use accounts for 71% of direct energy use, which can mainly be attributed to manure management and field operations, while on-farm electricity used in stables and housing accounts for 17% and crop processing for 11% of total energy requirements (Figure 4).
It is important to note that different production systems have different requirements and that there is a scarcity of data across a variety of methodologies for calculating energy use in beef production systems. Especially in beef production systems, significant trade-offs appear to exist between feed, land use, and energy requirements [49]. For instance, some studies suggested that grass-fed beef is more environmentally friendly than non-grass-fed beef but is likely to have a higher land-use footprint [49]. According to the Agricultural and Food Research Council, methods for predicting energy use in beef production systems are outdated [50].

3.4. Pork Production

The production of pork accounts for around half of the EU’s meat total production, an estimated 23.8 million tonnes, and more than three-quarters of pork production occurs in just six Member States: Germany (22.4%), Spain (19%), France (9.1%), Poland (8.7%), Denmark (6.6%), the Netherlands (6.4%), and Italy (6.2%) [3].
Pig production systems in the EU are generally characterized as intensive [13], closed systems where pigs are kept inside animal housing and feed is imported. However, there seem to exist large variations in the size and production focus among the different farms. Nguyen et al. (2012) documented typical intensive pig production systems in the EU, which represent around 70% of the total production in the EU [18], while Visser et al. (2012) conducted LCAs on the energy requirements of pork production in six different EU countries [21]. The figures presented in these studies ranged from 15.9 MJ/kg to 22.7 MJ/kg, and, in most cases, up to 75% was associated with feed (Figure 5 and Table A3).
There was also variation in the breakdown of the direct energy inputs in pig farming systems, but in all cases, most direct energy use was associated with manure management, housing, and feeding systems in the form of electricity and fuels. Nguyen et al. (2012) provided an overview of on-farm energy use for Northern Europe; these conventional production systems cover 70% of pig farming in the EU. On average, this study found that 3.84 MJ of direct energy was required per kg of slaughter weight of pig meat [18], 22% of this was associated with diesel use for manure handling, while 50% was associated with electricity for housing, 10% with electricity for manure pumping and stirring, and 17% with oil in the form of heating (Table 3). The study also found that the use of manure for energy production, fertilization, and feed use were the most significant areas in reducing the use of fossil energy use in pig systems [18].
Markou et al. (2017) conducted energy audits on two pig farms in Cyprus. Regarding direct energy inputs, their study found that 44% of energy consumption was associated with transportation, 31% with feeding, 12% with ventilation, 3% with watering, 3% with waste removal, 2% with lighting, and 5% with other uses. Regarding specific energy carriers in direct energy consumption, the study found that 29% was electricity associated with lighting, ventilation, feeding, watering, and other uses, 23% was LPG mainly associated with heating, and 48% was diesel associated with vehicle use and heating [51]. Similarly, Winkler et al. (2016) stated that in Austria and Germany, 1.26 MJ of electrical energy and 0.684 MJ of thermal energy was needed for heating, ventilation, light, and manure management, and 4.356 MJ of mechanical energy was used for field manipulation and on-farm transportation per kg of pork produced [52].

3.5. Poultry Meat

In 2018, poultry production reached approximately 15.2 million tonnes. Broiler, chickens produced for meat, production was by far the largest producer of poultry meat in the EU, accounting for over 80% of total poultry production and intensive broiler systems account for over 90% of broiler production in the EU [53]. Around 14% of poultry production was Turkey production; energy use data on these systems were not located during this review [54]. The intensive broiler systems are generally characterized by large holdings, high stocking densities, closed indoor rearing, rapid growth rates, and imported feed [53]. Non-intensive farming systems are expanding but still make up only a small number of the total; 5% are less intensive systems, 5% are free-range systems, and 1% are organic systems. A number of studies investigated the energy use in these broilers, with total energy use figures ranging from 9.6 MJ/kg to 19.1 MJ/kg, while around 75% of this total was associated with feed (Figure 6 and Table A4).
Regarding direct energy consumption, by combining and presenting data from a range of sources, Costantino et al. (2016) concluded that heating was by far the largest on-farm energy-consuming activity, accounting for around 90% of the total energy consumption, followed by ventilation and lighting (Table 4 and Table 5) [7].
The above Table 4 and Table 5, however, do not include energy inputs related to feeding and manure management, while it is also important to note that there may be significant geographical variations, especially in warmer climates. For instance, in Cyprus, Markou et al. (2017) found that 40% of the energy use was associated with heating, 28% with ventilation, 24% with transportation, 5% with lights, 2% with feeding, and 1% with watering, which contrasts with the above, Northern EU findings. This study also found that closed chicken houses had 30–40% less energy consumption as compared to open houses. Closed broiler houses received 35% of their energy from electricity, and 65% from fuels, while, for open broiler houses, it was 20% and 80%, respectively. The specific energy carriers found were 20% electricity, 44% LPG, 11% biomass, and 25% diesel for the closed type, while for open broilers, it was 35% electricity, 17% LPG, 29% biomass, and 19% diesel [51].

3.6. Poultry Egg Production

Around 400 million laying hens are kept in the EU, of which, according to Eurostat, 53% are housed in enriched cages, 27% in barns, 15% are free-range, and 5% organic [3]. These generally range from more intensive to less intensive, respectively, whereby enriched cages are characterized by high stocking densities and closed cages, while in the other systems, hens have lower stocking densities and generally have access to an outdoor space [53]. There is relatively little information available on chicken egg production in the EU, which makes it difficult to draw conclusions. Dekker et al.’s (2011) study looked at four egg production systems in the Netherlands, which, although geographically limited, covered the main production systems in the EU [19]. This study found that to produce 1 kg of eggs, 20.5–23.5 MJ of energy inputs were needed and that in all cases, at least 50% of all energy inputs were associated with feed (Figure 7 and Table A5).
Comparing the above results, Dekker et al. (2011) showed higher energy use. They claimed that this was caused by the inclusion of more processes and more process details for subsystems concentrate and litter production and laying hen husbandry.
Williams et al. (2006) and Leinonen et al.’s (2012) study conducted an LCA on the environmental impacts of chicken egg systems in the UK. Williams et al. (2006) found that for non-organic, caged, and free-range egg production systems, around 14.1, 13.6, and 15.4 MJ/kg of energy inputs were required, respectively [57]. Leinonen et al.’s (2012) study found that feed represented between 54 and 75% of the total energy use. This was followed by on-farm electricity use (mainly for ventilation, automatic feeding, and lighting), consuming between 16-38% of the total energy use and gas and oil (used mainly for heating and incineration of dead layer birds) which accounted for 7–14% of the total energy [58]. Similarly, Markou et al. (2017) found that feed represented around 83% of the total energy consumption. Regarding direct energy consumption, this study found that ventilation accounted for 33% of energy use, lighting for 15%, transportation for 17%, thermal energy for 3%, waste removal for 2%, packaging for 14%, watering for 1%, and feeding for 15%. The specific energy carriers were found to be 55% electricity, 12% LPG, and 33% diesel [51].

3.7. Sheep and Goat

A small number of studies have been conducted on sheep and goat production in the EU but not enough to provide us with reliable figures for the EU as a whole. However, these few studies which have been completed can provide us with an indication of the energy use status for these systems [2].
Benoit and Laignel (2010) investigated the non-renewable energy consumption in four sheep farming systems in Southwest France and found that 59.8–88.7 MJ of energy inputs were required per kg of carcass weight. This study found that in almost all cases, fertilizers and feed were the main energy inputs accounting for around three-quarters of the total energy consumption, followed by direct on-farm diesel use. The study also found that sheep reared in a grazing system consumed on average 42% less energy overall as compared to other systems [16].
Wallman et al. (2011) conducted a study on lamb farming in Sweden and found that around 33 MJ of total energy inputs were required per lamb carcass. Of these, 17 MJ was attributed to feed and 16 MJ to on-farm diesel (67%) and electricity use (33%). The study also found that within organic systems, average energy inputs were around half due to decreased use of manufactured feed and fertilizers [17].
Regarding sheep and goat milk, the two studies that were located suggested that both sheep and goat milk had a higher energy requirement than cow milk. Kanyarushok et al. (2008) conducted a study on goat milk in France, finding that per FPCM, a total of 5.06 MJ was required, of which 3.87 was allocated to feed and 1.19 to on-farm production [59], while Idele (2011) found that 4.9 MJ was required per FPCM of sheep milk (no breakdown provided). This is supported by Cossu et al.’s (2020) study on milk cooling, which found that the energy input for sheep milk cooling was significantly higher than cow’s milk [60].

4. Discussion

4.1. Energy Use

Our review confirmed and illustrated some important trends in energy use in livestock systems. Our results, in line with other studies, clearly indicated that animal feed is the largest energy-consuming activity in livestock systems [21]. While the energy needs of the livestock sector are diversified, on-farm energy use is concentrated in housing and manure management. Electricity is generally used for lighting, feeding, and milking systems, while fossil fuels associated with direct energy inputs are often used for manure management and heating. Switching to more renewable electricity and thermal sources could invariably help reduce the amount of fossil energy used for on-farm activities.
There are a number of reasons why feed is generally the largest energy-consuming activity. From an energy perspective, the production of animal products is inherently inefficient (depending on feed to product conversion ratio) due to metabolic and heat processes. In practice, this means that the majority of energy consumed by animals is expended at maintaining and renewing its cell structure rather than the production of animal ‘products’ [21]. In addition, the production, transport, storage, and processing of animal feed is, to a large extent, dependent on cereals and other open-field crops, which are produced using an intensive process that consumes large amounts of energy associated with diesel, fertilizers, and pesticides [61].
It is clear that beef production in the EU consumes by far the most energy per kilogram, followed by pork and broiler production. Geographically, various studies suggested that energy use in livestock housing is likely to be considerably higher in northern Europe as compared to southern Europe due to additional heating required due to climatic conditions [7,62]. Studies also suggested that livestock grown on locally produced feed requires considerably less energy input than livestock dependent on non-locally produced feed [63,64]. This suggests that there are likely to be strong links between production systems, feed use, and geographic location; the investigation of these links is an important area for future research. According to the data discussed previously, electricity and fossil fuels constituted the main energy sources for the necessary operation of livestock farms and maintaining the proper conditions within their facilities. However, there is no clear overview of the specific proportion of energy sources in livestock; it is generally accepted that diesel use is the largest energy source. This is similar to other areas in the world, for instance, in the US, according to the US Energy Information Administration, the main source of direct energy consumption occurs in the form of distillate fuel accounting for over 50% of total energy inputs, followed by propane, electricity, and natural gas [65].
Considering the increasing research interest, obtaining a clearer view of the specific proportions of energy sources in the livestock sector may prove invaluable. The tendency of future works towards the energy analysis based on the primary energy approach, in order to assess the share of primary energy from renewable and non-renewable sources, will be essential to evaluate how the transition toward cleaner energy mixes will affect the sustainability of livestock production [66]. That distinction would considerably improve the assessment of the environmental sustainability of livestock production, but for that to be possible, we believe that a more detailed recording of energy use per activity in the livestock farm facilities should be considered a prerequisite.

4.2. Energy Efficiency Measures, Renewable Energy Sources Adoption, and Demand-Side Policies

Considering the effect that the livestock sector-in general-has on numerous natural resources, and given the increasing scarcity of land, soil, water, and biodiversity, it is evident that the increasing usage of renewable energy sources (RES), Energy Efficiency Measures (EEM), and technologies throughout the world, provide a unique opportunity to farmers to reduce their farms’ external inputs by producing their own energy and becoming more self-sufficient. With an initial investment, energy can be harvested from variable renewable energy sources, such as the sun, wind, and water. These sources, in addition to biomass, heat pumps, and geothermal energy, can produce electricity and fuel to adequately cover partly, or exclusively, depending on the size, the on-farm energy demand. In recent years, increasing research has been undertaken to improve the energy efficiency and sustainability of livestock housing. This includes developments that improve structures [62], insulation [66,67], and climatic systems [68,69].
RES are increasingly gaining attention as a sustainable energy source in the livestock farm sector [70], under specific circumstances and energy needs. At first glance, one might think that all renewable energy sources can be used efficiently in all types of farms. Nevertheless, their effectiveness is associated with a combination of factors that can be assessed with confidence to conclude whether a RES technology or even an optimal combination of them is/are capable of meeting the needs of the respective livestock farm. The following factors are indicative:
  • Position of the livestock building (e.g., location and orientation);
  • Local environment (e.g., climate, elevation and slope, soil water, ground temperature, etc.);
  • Characteristics of the buildings that constitute the farm unit (building insulation, existing of ventilation fans, etc.);
  • Domestic needs of the farm (e.g., high energy loads for milk cooling, air ventilation, management of the animals’ by-products, etc.); and consumption profile (daily, seasonal);
  • Planning policies for RES technologies in rural areas [71].
According to different studies, the location and the orientation of the livestock building are both important in most cases since they can determine which RES technology and in which place of the farm could potentially be applied, thus increasing the efficiency and livestock productivity. In the same line, the local climate, as well as the construction method of the livestock farm, can play a vital role that could potentially lead to a reduction in the final energy consumption of the livestock building.
Our results suggested that reducing the reliance on and energy intensity of animal feed, especially imported animal feed, could reduce overall energy use considerably. On the one hand, the EU market for feed is moving towards more locally produced, although a significant deficit in high-protein feed remains, despite a large increase in EU-grown soy and other protein sources. In addition, multiple studies have shown that grass-fed cattle consume less energy than those fed on other types of feed. However, switching to grass-feeding would require significant amounts of arable land and agricultural inputs [49], highlighting the importance of a carefully balanced transition.
Since a significant amount of the energy associated with feed is for the production of cereals and oilseeds, finding other feedstocks could reduce the energy intensity of feed. For instance, EIP-AGRI (2020) identified five new feed options for pig and poultry farming that would reduce the environmental footprint of animal feed: bakery products, green biomass (grass/clover), insects, micro-algae, and single-cell protein [72].
It is important to highlight the importance and the potential of livestock manure as a source of organic fertilizer and renewable energy production in the EU. Overall, it is estimated that just under 10 million tonnes of nitrogen and around 1.5 million tonnes of phosphorus are applied to fields in the EU through manure application [73]. Similarly, over the past two decades, there has been a significant rise in biogas production using manure as a feedstock, led by Germany. In Germany alone, there are at least 560 small-scale manure-based biogas plants, and between 3000 to 3500 plants in which manure accounts for between 30–50% of total feedstock use, only a small fraction of these produce biomethane [74]. Scarlat et al. (2018) estimated that the amount of biogas produced from manure could be realistically increased by 18 billion m3 of biomethane across the EU in areas with high livestock densities [75]. It is important to note here that the same potential exists for developing other renewable energy plants that run on other agricultural wastes/feedstocks. Recent studies in Greece and Denmark have indicated that biomethane is especially considerably more expensive than natural gas, though, with certain policy interventions, it can become cost-competitive [76,77]. Unfortunately, despite the identification of the aforementioned RES, EEM, and technologies as significant sources of energy for the whole livestock sector, in the past two decades, the number of applications dedicated to livestock productivity remains insignificant compared to that allocated to the conventional energy sector. RES technologies appear to have significant unexploited potential to enable farms to meet effectively, and to a large extent, their growing energy requirements. To what extent this potential exists and can be practically implemented is an important area for future research.
Various recent studies suggest that for the EU to meet its climate targets, deep cuts, and/or changes in the consumption and demand of livestock products are likely necessary. This is because livestock products, especially the production of beef, generally have considerably higher negative environmental impacts compared to other types of agricultural products [78,79,80]. These studies generally suggest that a variety of policies that address the demand side, especially through targeting the price of livestock products, are likely to help reduce the environmental burden associated with the production of livestock products. However, relatively little is known about the effectiveness of policy interventions guiding dietary changes [80]; this is an important area for future research.

4.3. Barriers and Limitations

There are some significant barriers and limitations to this review. These arise largely from large data gaps for certain livestock categories, a variety of non-standardized methodologies for accounting for energy use in livestock and agricultural systems, including the selection of functional units and system boundaries, and is compounded by the diversity and heterogeneity of livestock production systems. In this regard, for a more comprehensive and accurate understanding of energy use in livestock systems, there is a necessity to develop a standardized methodology and terminology for measuring, evaluating, and comparing with other studies on energy use on livestock farms. In our view, this is a prerequisite for further research on energy use research in livestock systems.
Livestock, along with other sectors, will eventually move towards RES and high-efficiency technologies. While engineering this unavoidable transition, we also have to consider the way that the energy use is measured, calculated, and/or approximated and to whom the results are addressed. While LCA studies should be considered an indispensable tool in order to draw European and national policies in the livestock sector as whole, on-farm surveys, energy audits, and measurements should acquire a central role in EU countries. This will offer researchers, engineers, and farmers more tangible insight into on-farm energy use, enabling us to achieve the much-needed targeted interventions.
In the context of a changing livestock system, the energy use profiles of livestock systems are expected to change considerably in the coming decades. From an animal welfare perspective, the BLE report on drivers of change and development in the EU livestock sector highlights that high intensity and stocking densities are neither sustainable nor desirable [35]. On a policy level, increasingly stringent emission and sustainability targets, along with the recent decisions at COP26 to decrease livestock-related emissions, support movements to more sustainable agricultural practices that reduce our reliance on fossil energy sources. Considering this, and in the context of the Green Deal, the Farm to Fork strategy [5], and the new common agricultural policy [81], considerable funds and support are expected to be made available to livestock farmers to transition away from fossil dependencies in the coming years [35].

5. Conclusions

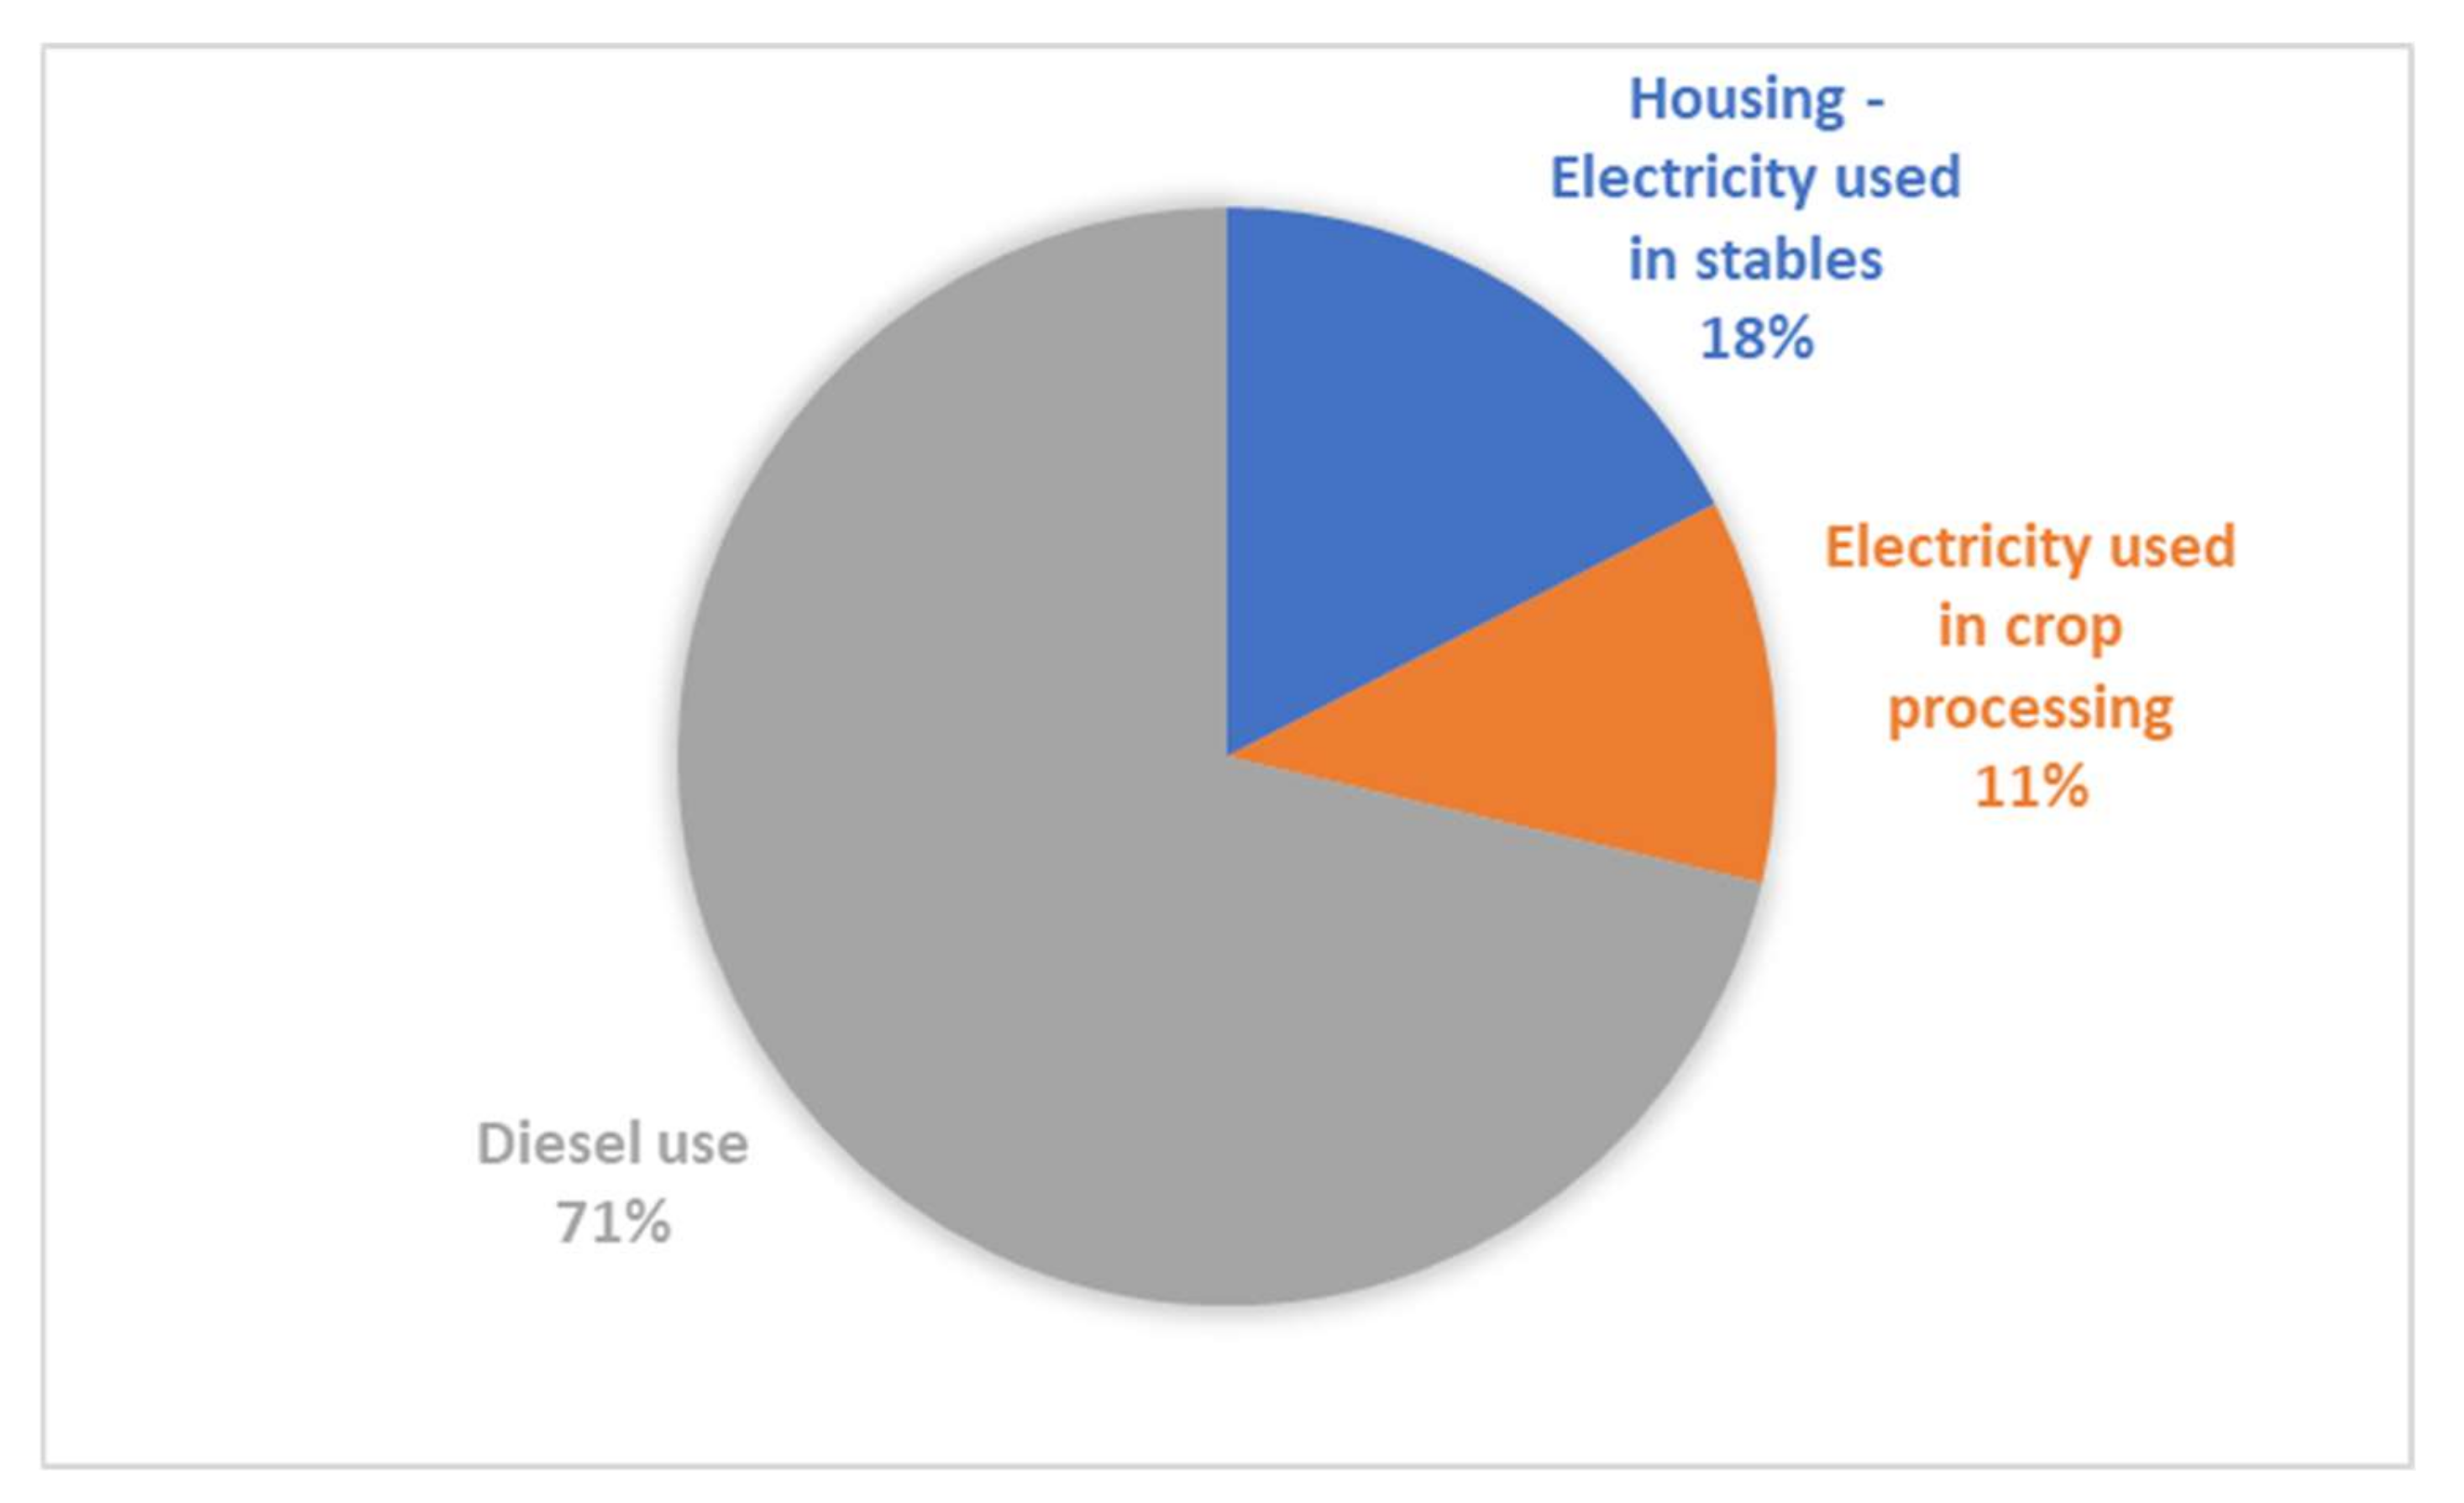
In conclusion, the results from the studies included in this review indicated that energy use was concentrated in feed, housing, and manure management. In most systems, animal feed was the dominant energy use category. This suggests that energy use in livestock systems is underreported as the majority of energy use associated with feed happens off the farm and is not attributed to the livestock sector in official agricultural statistics.
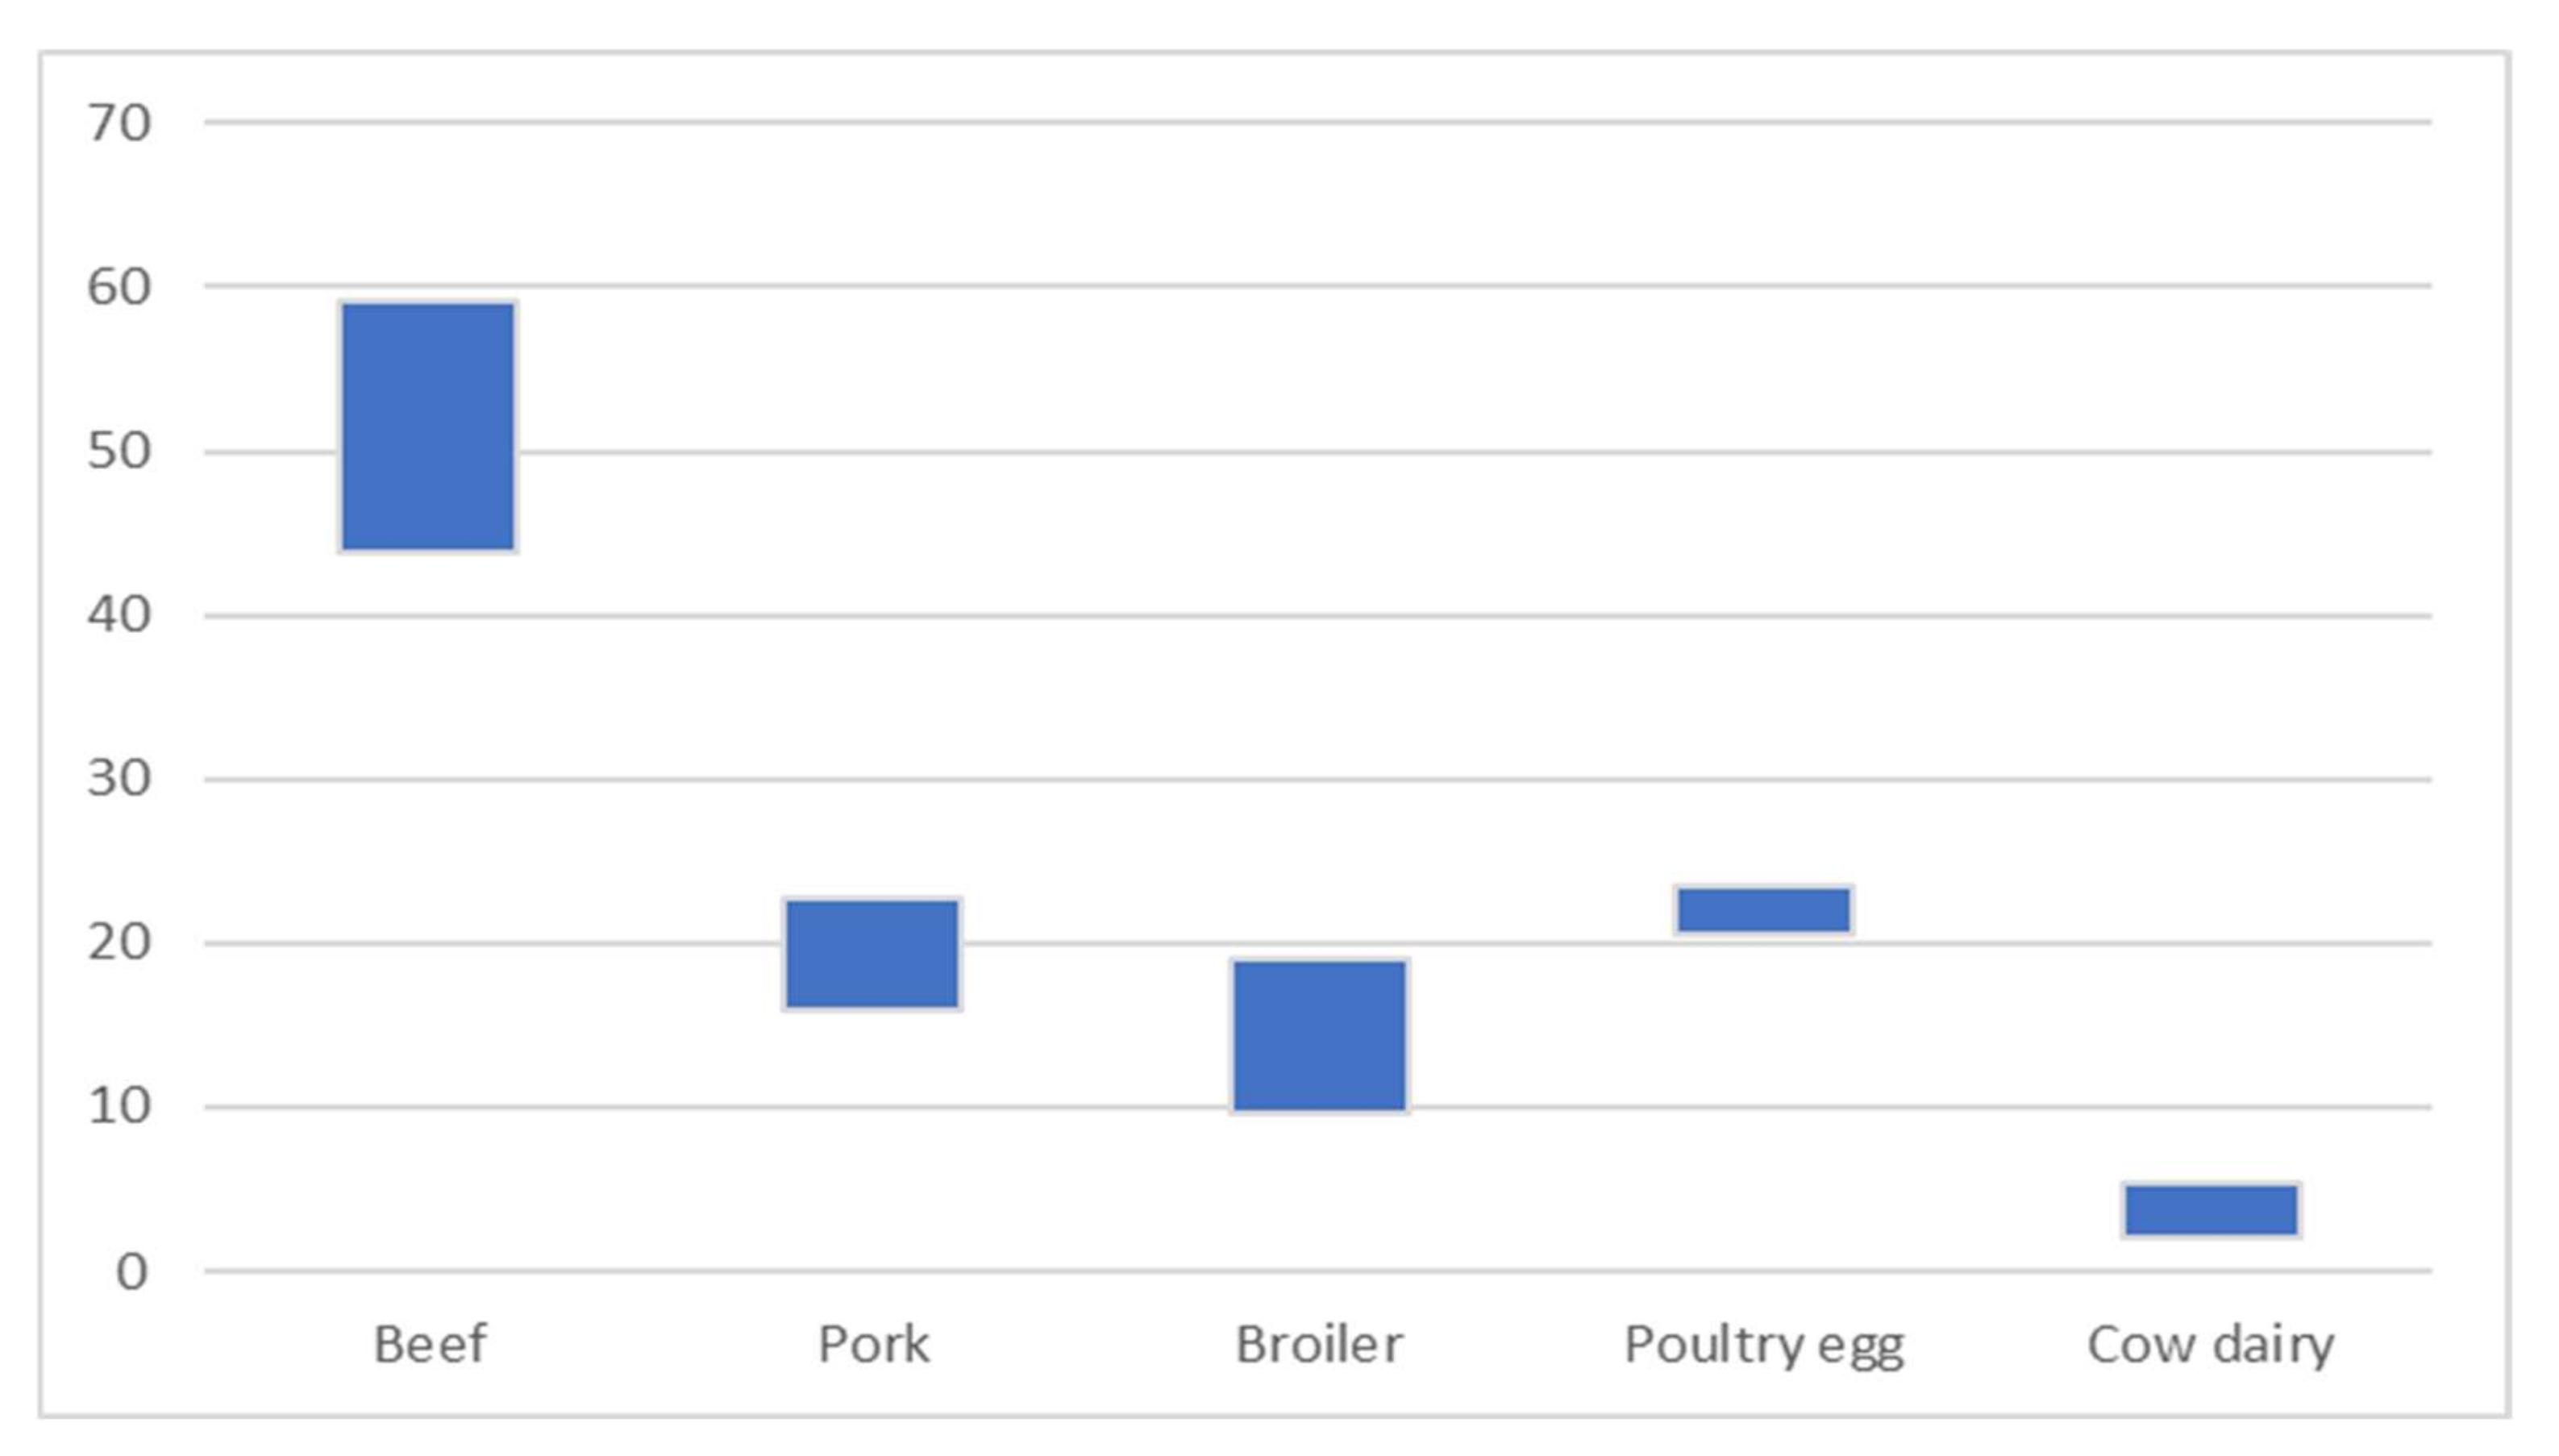
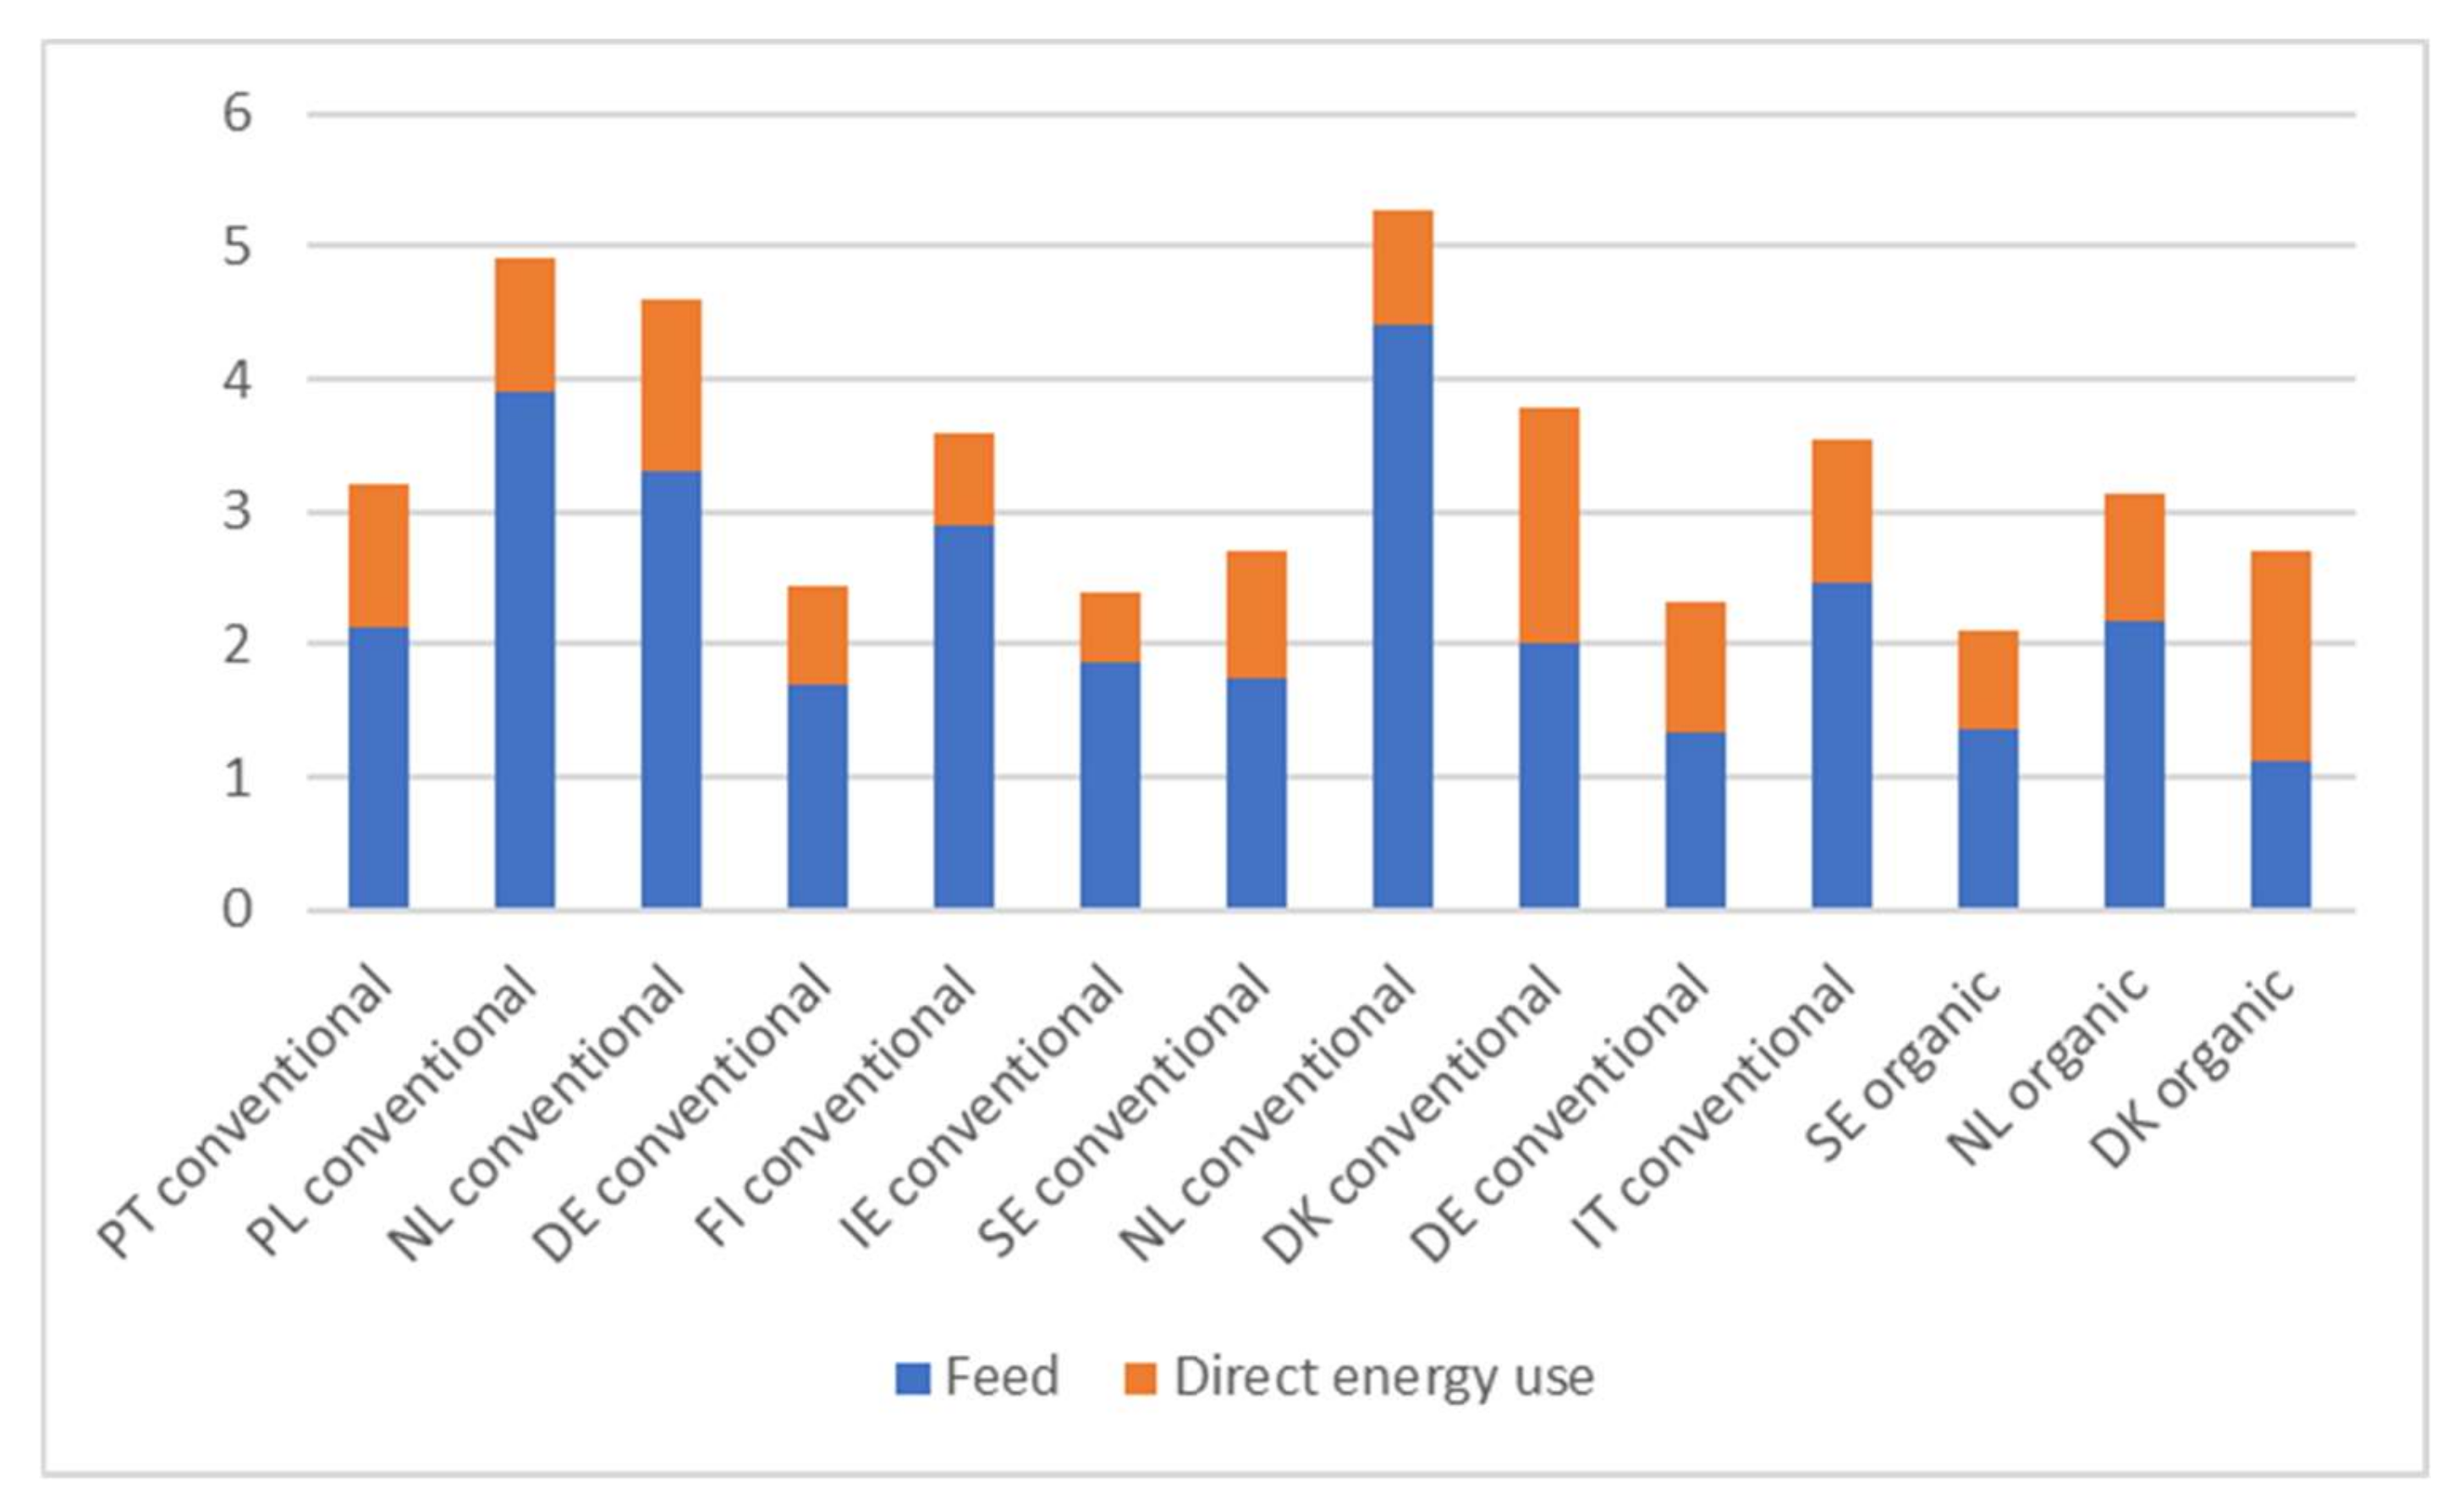
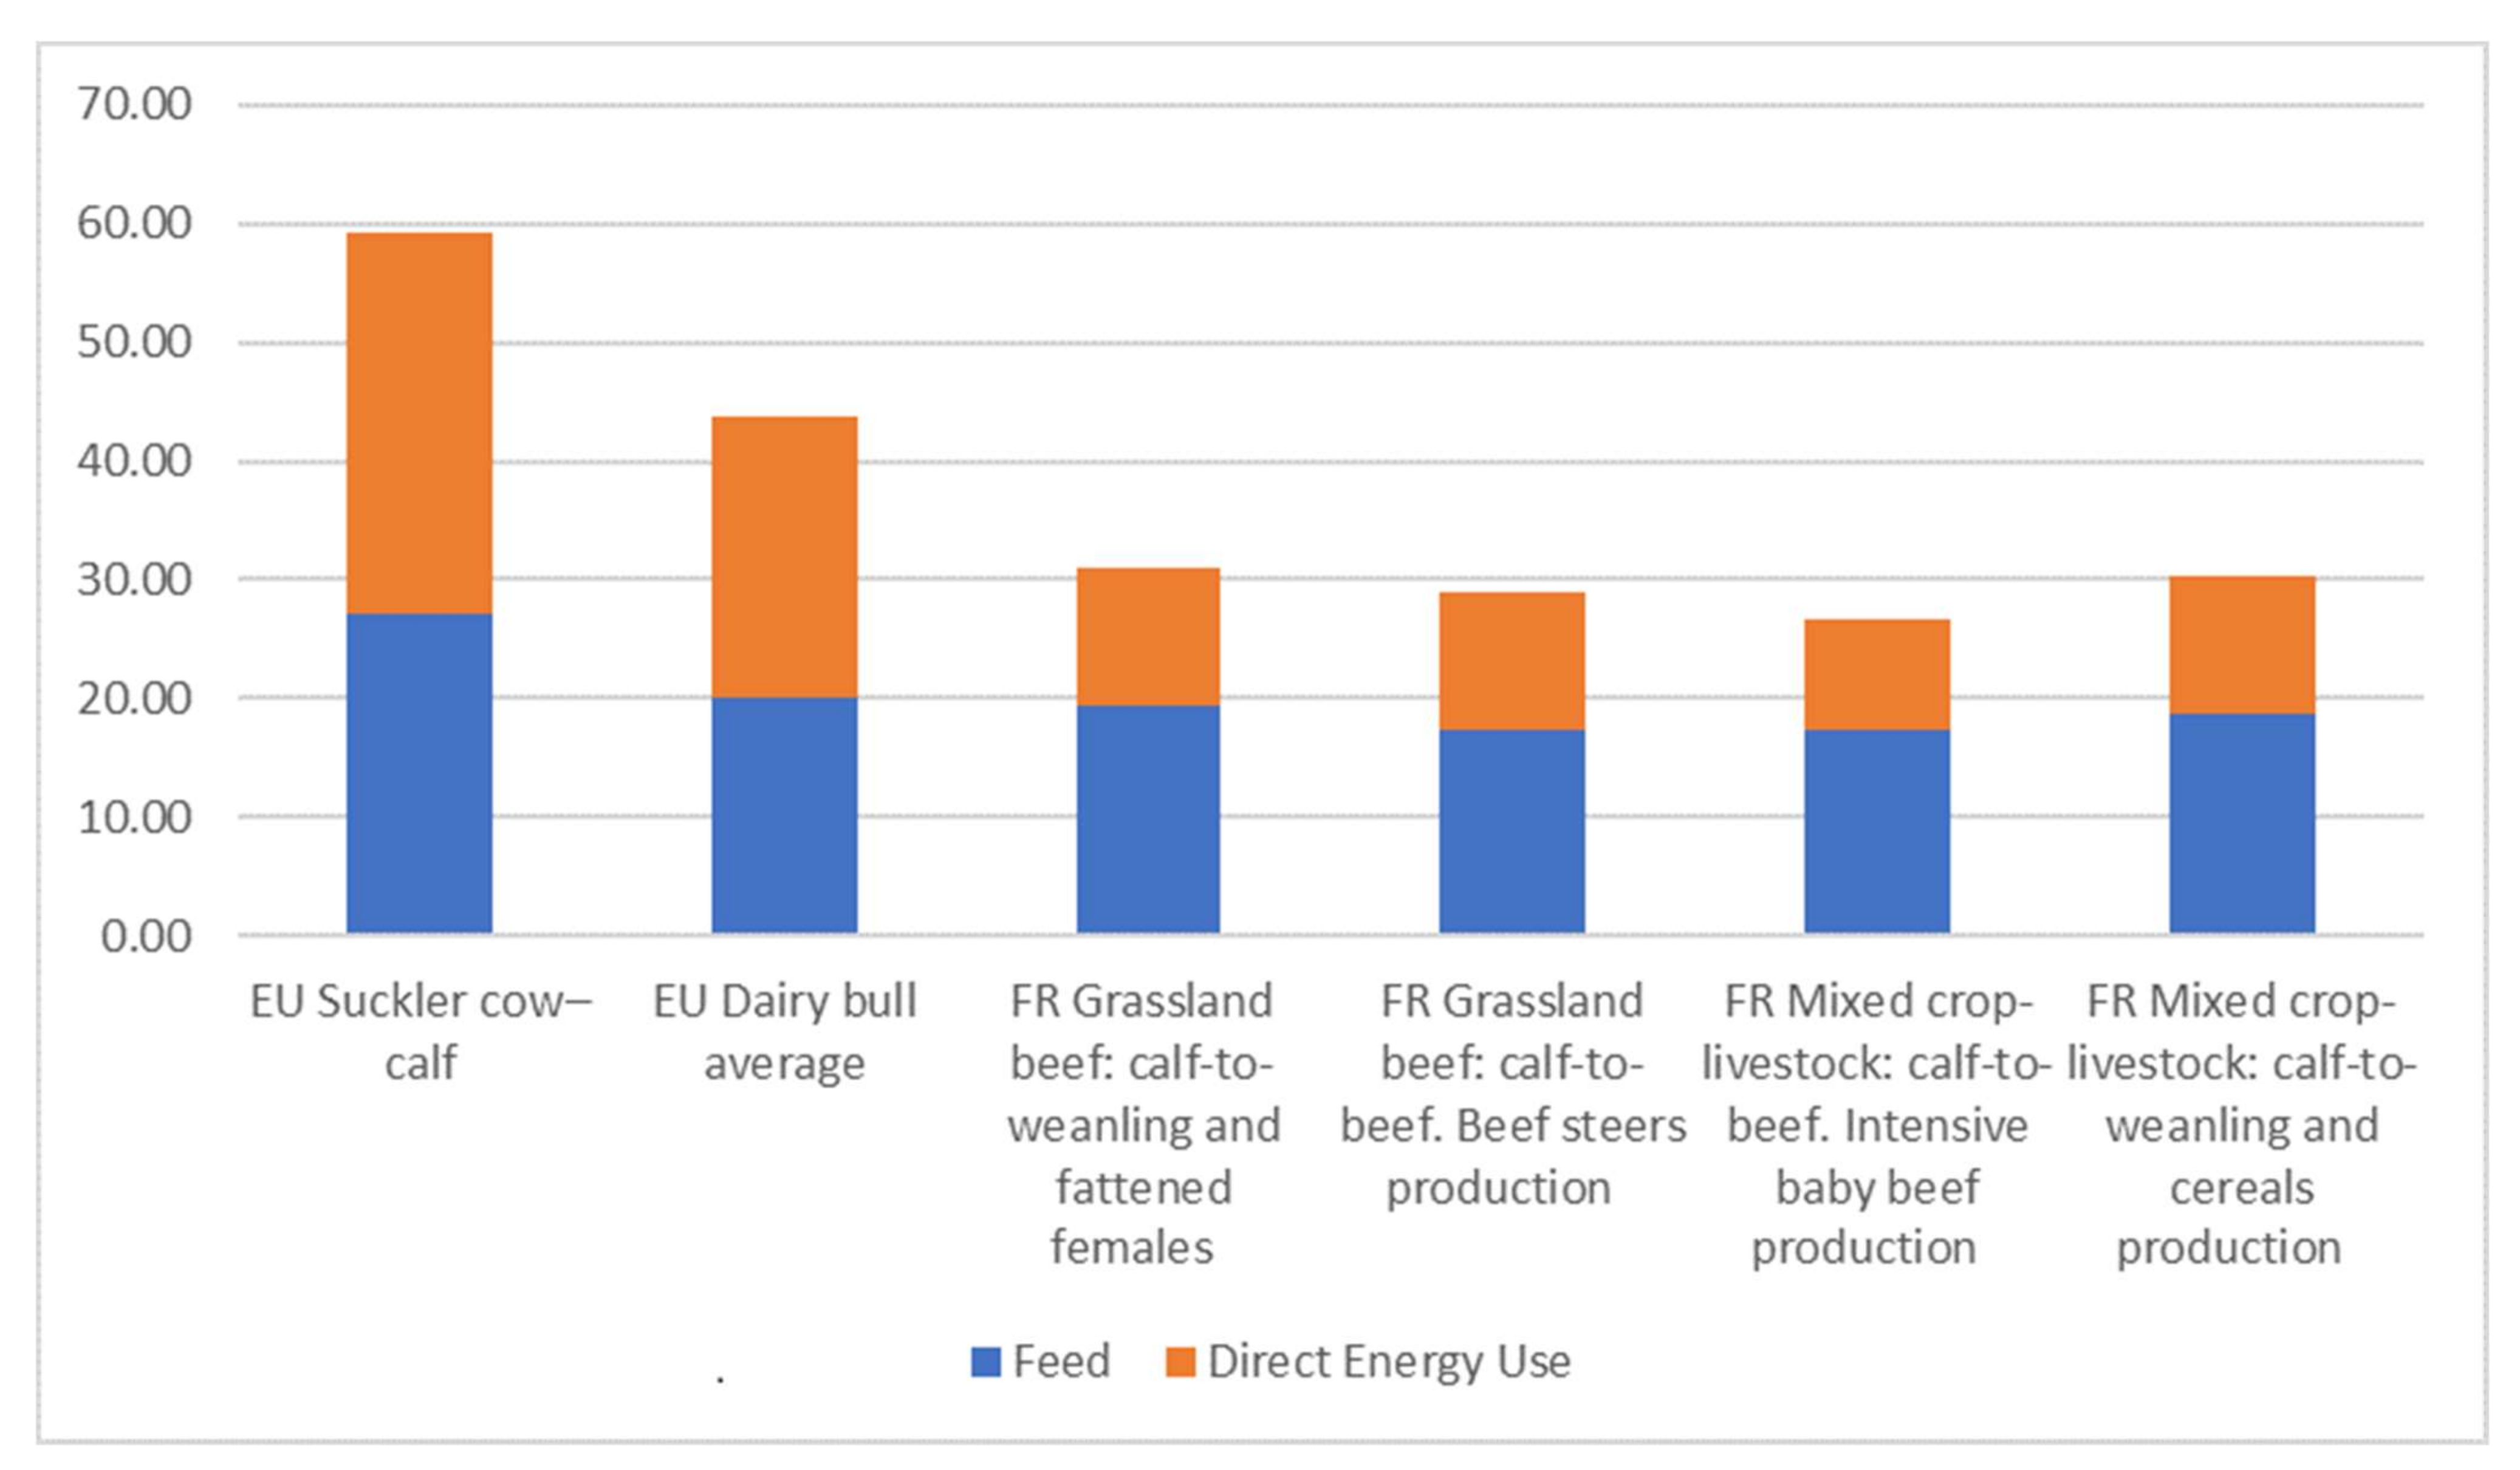
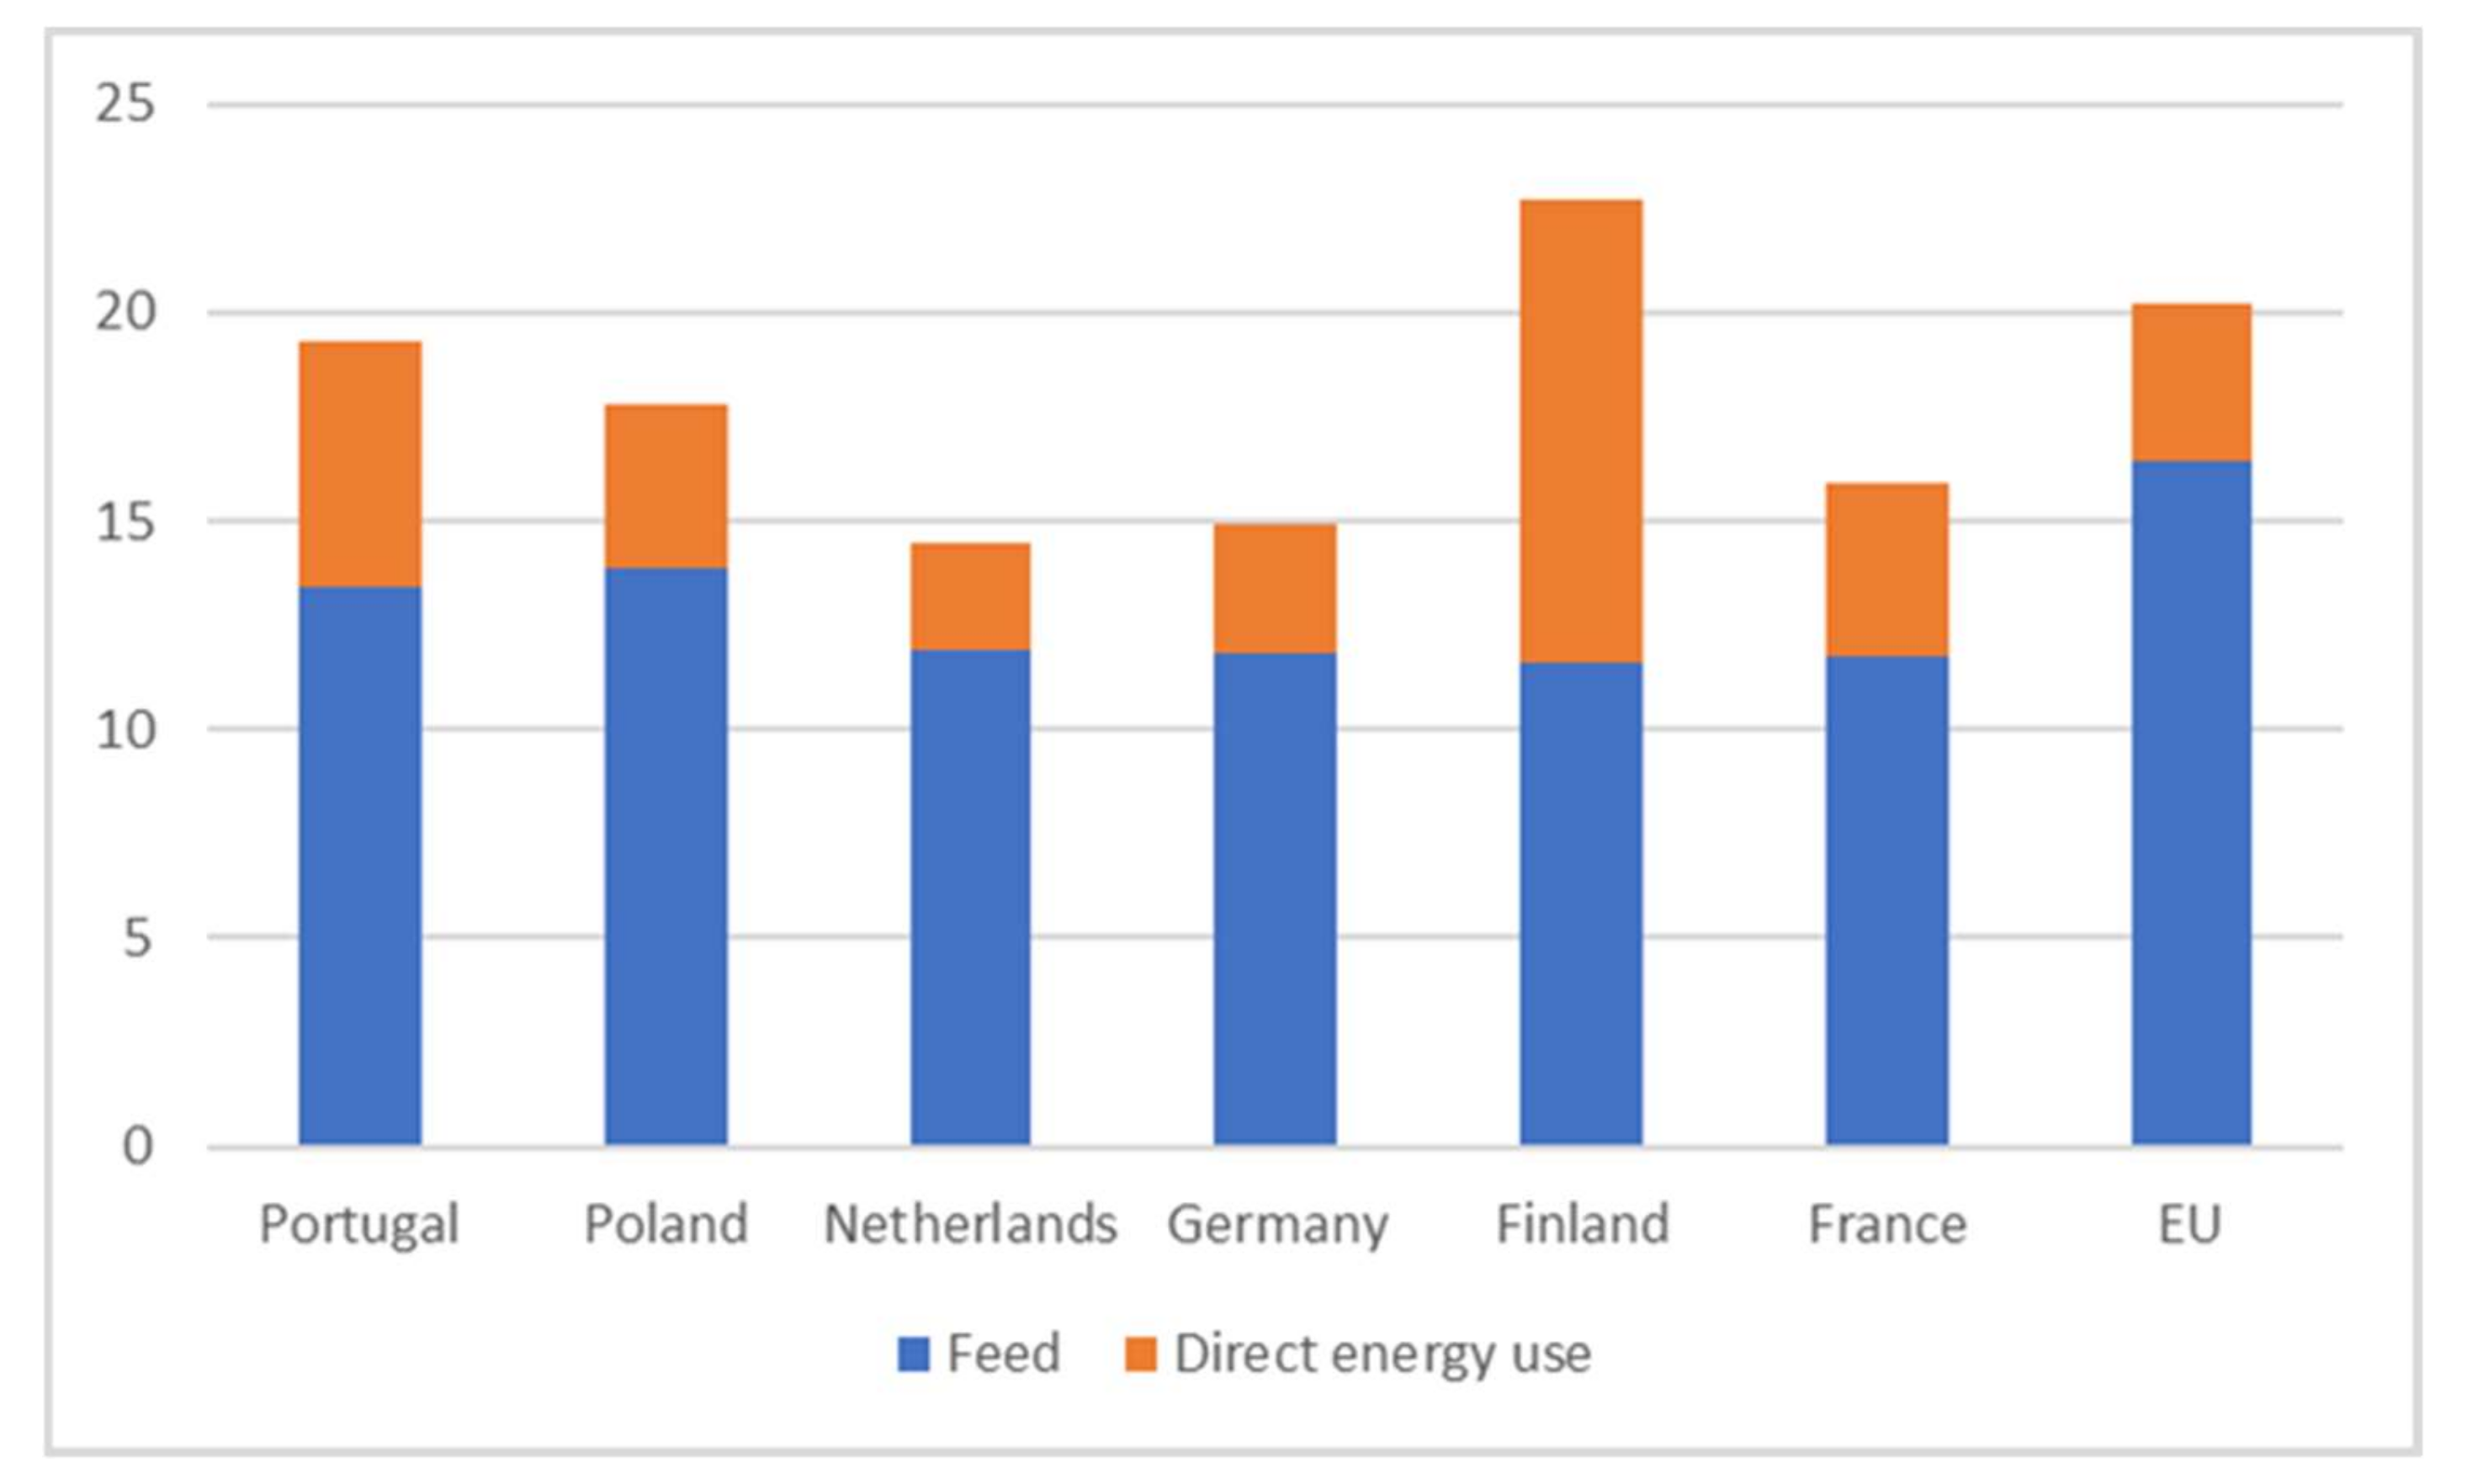
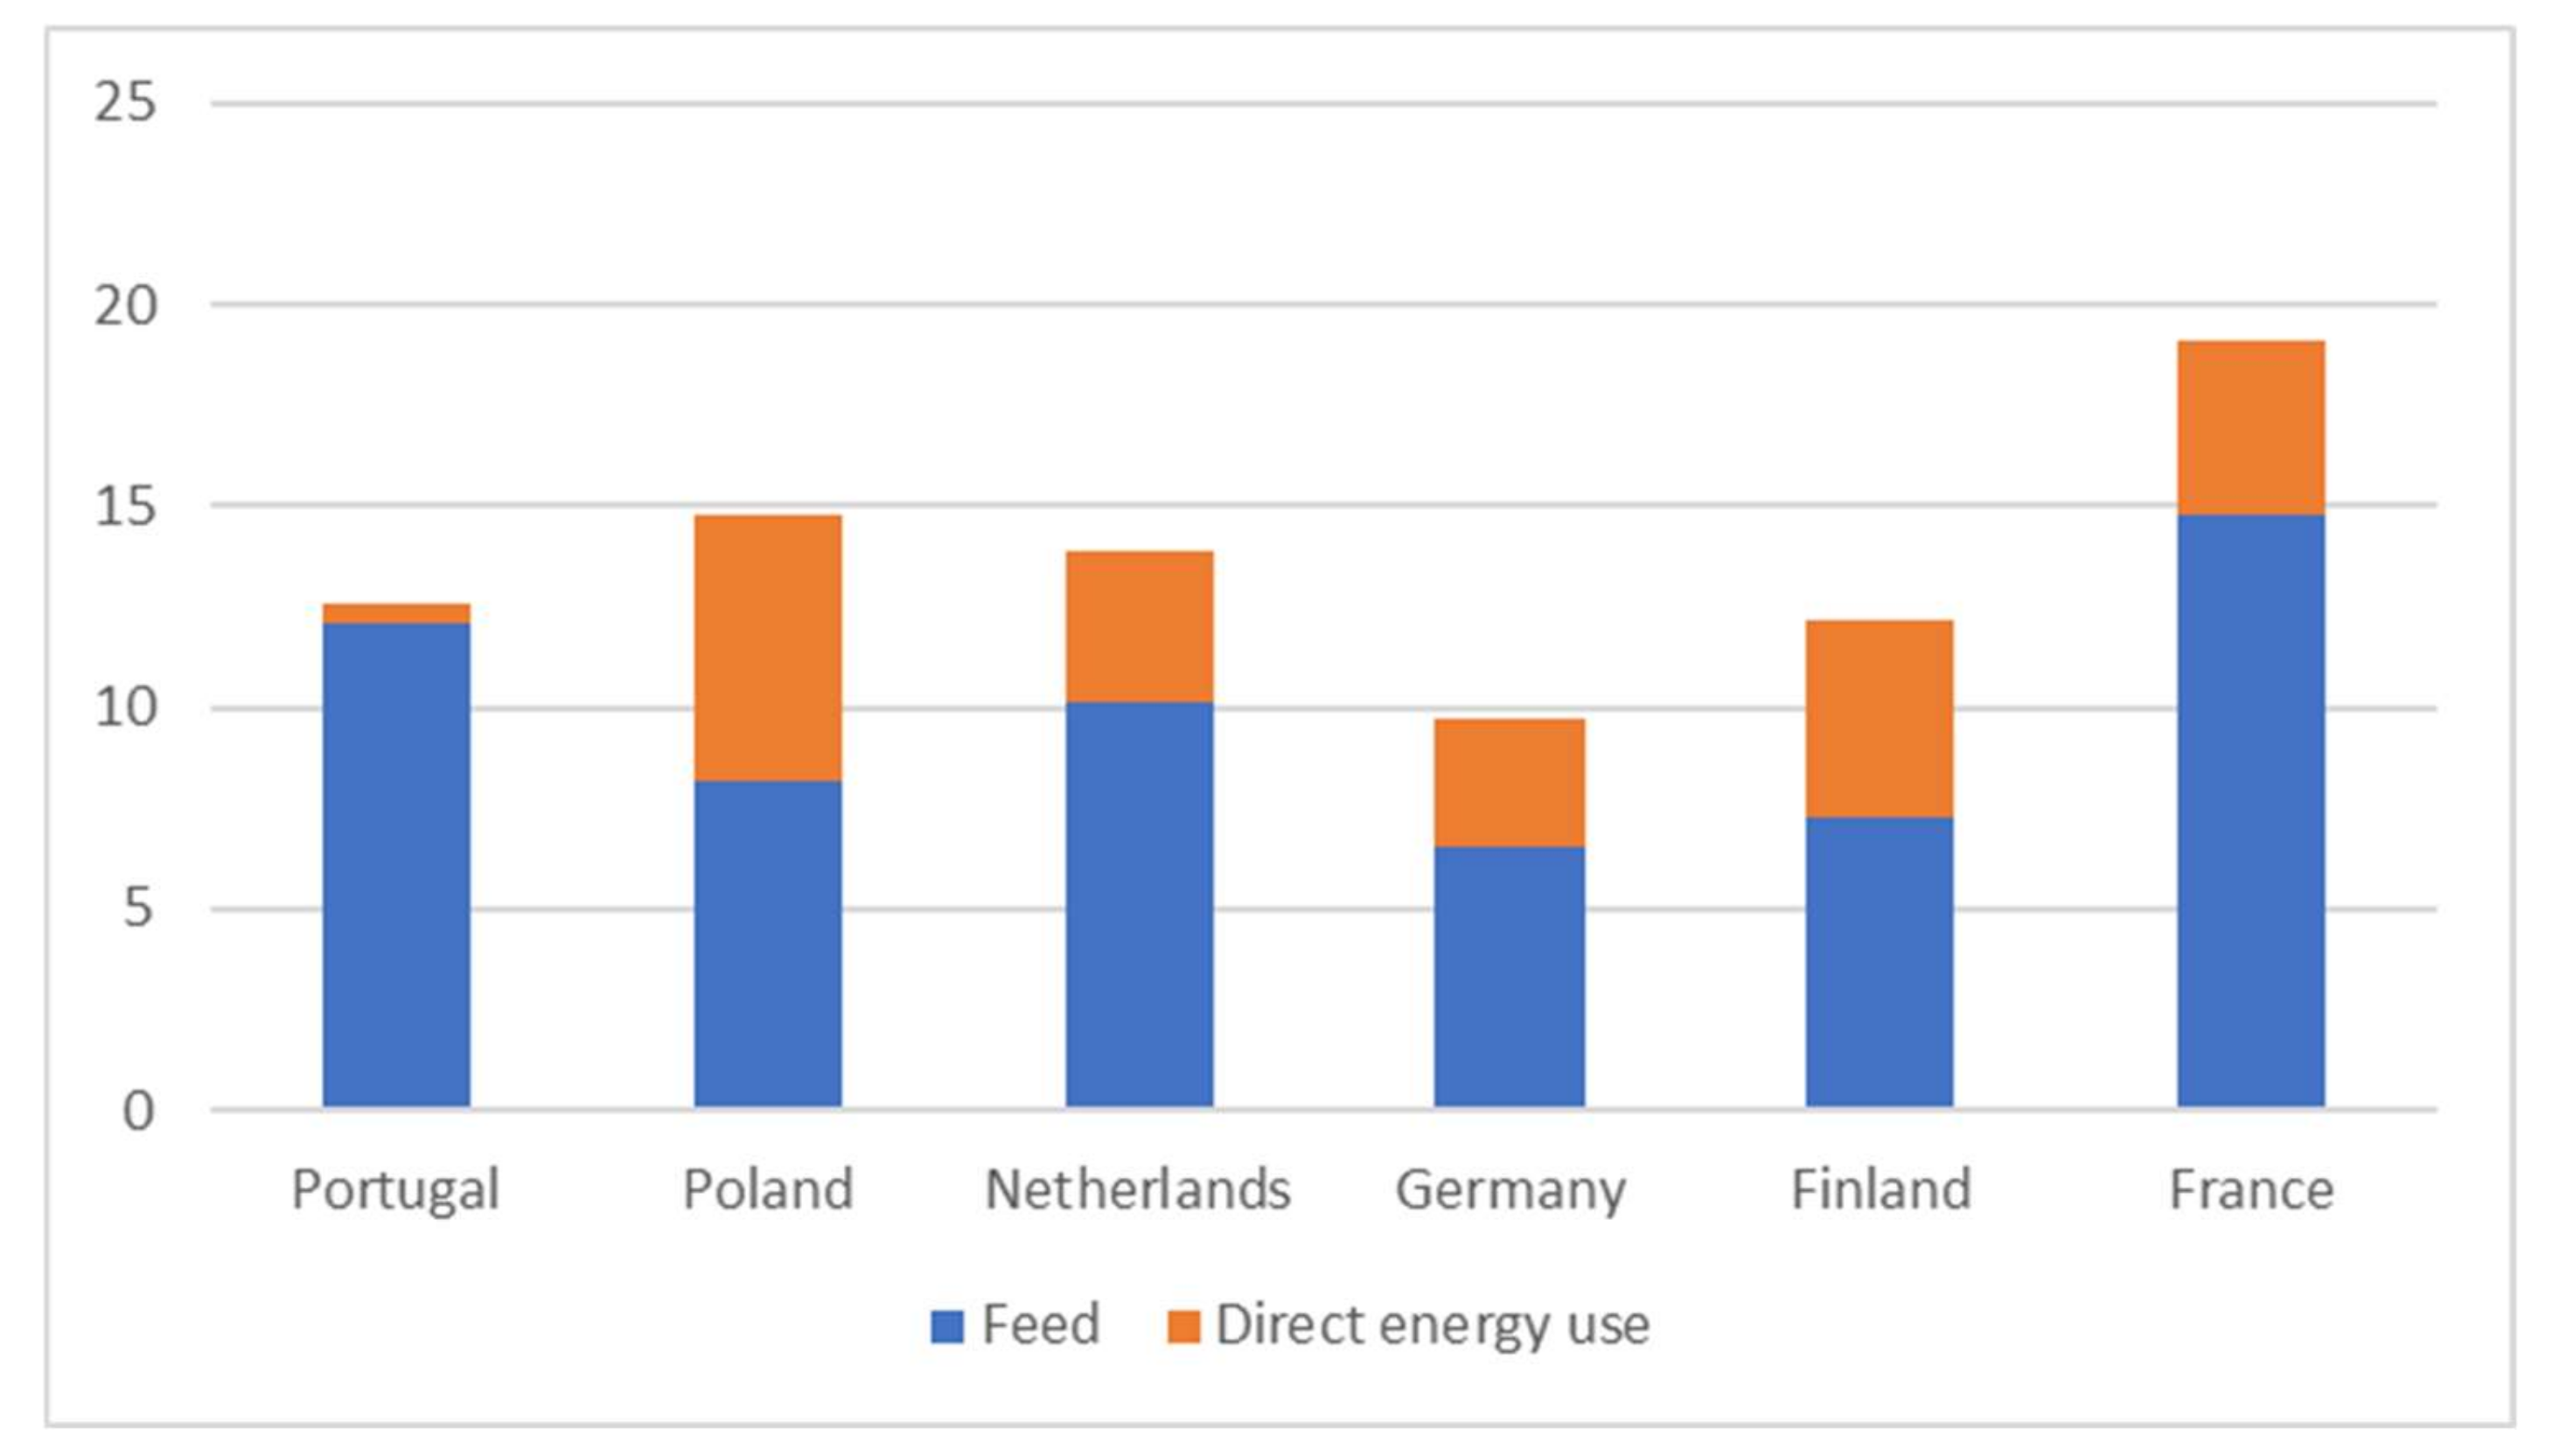
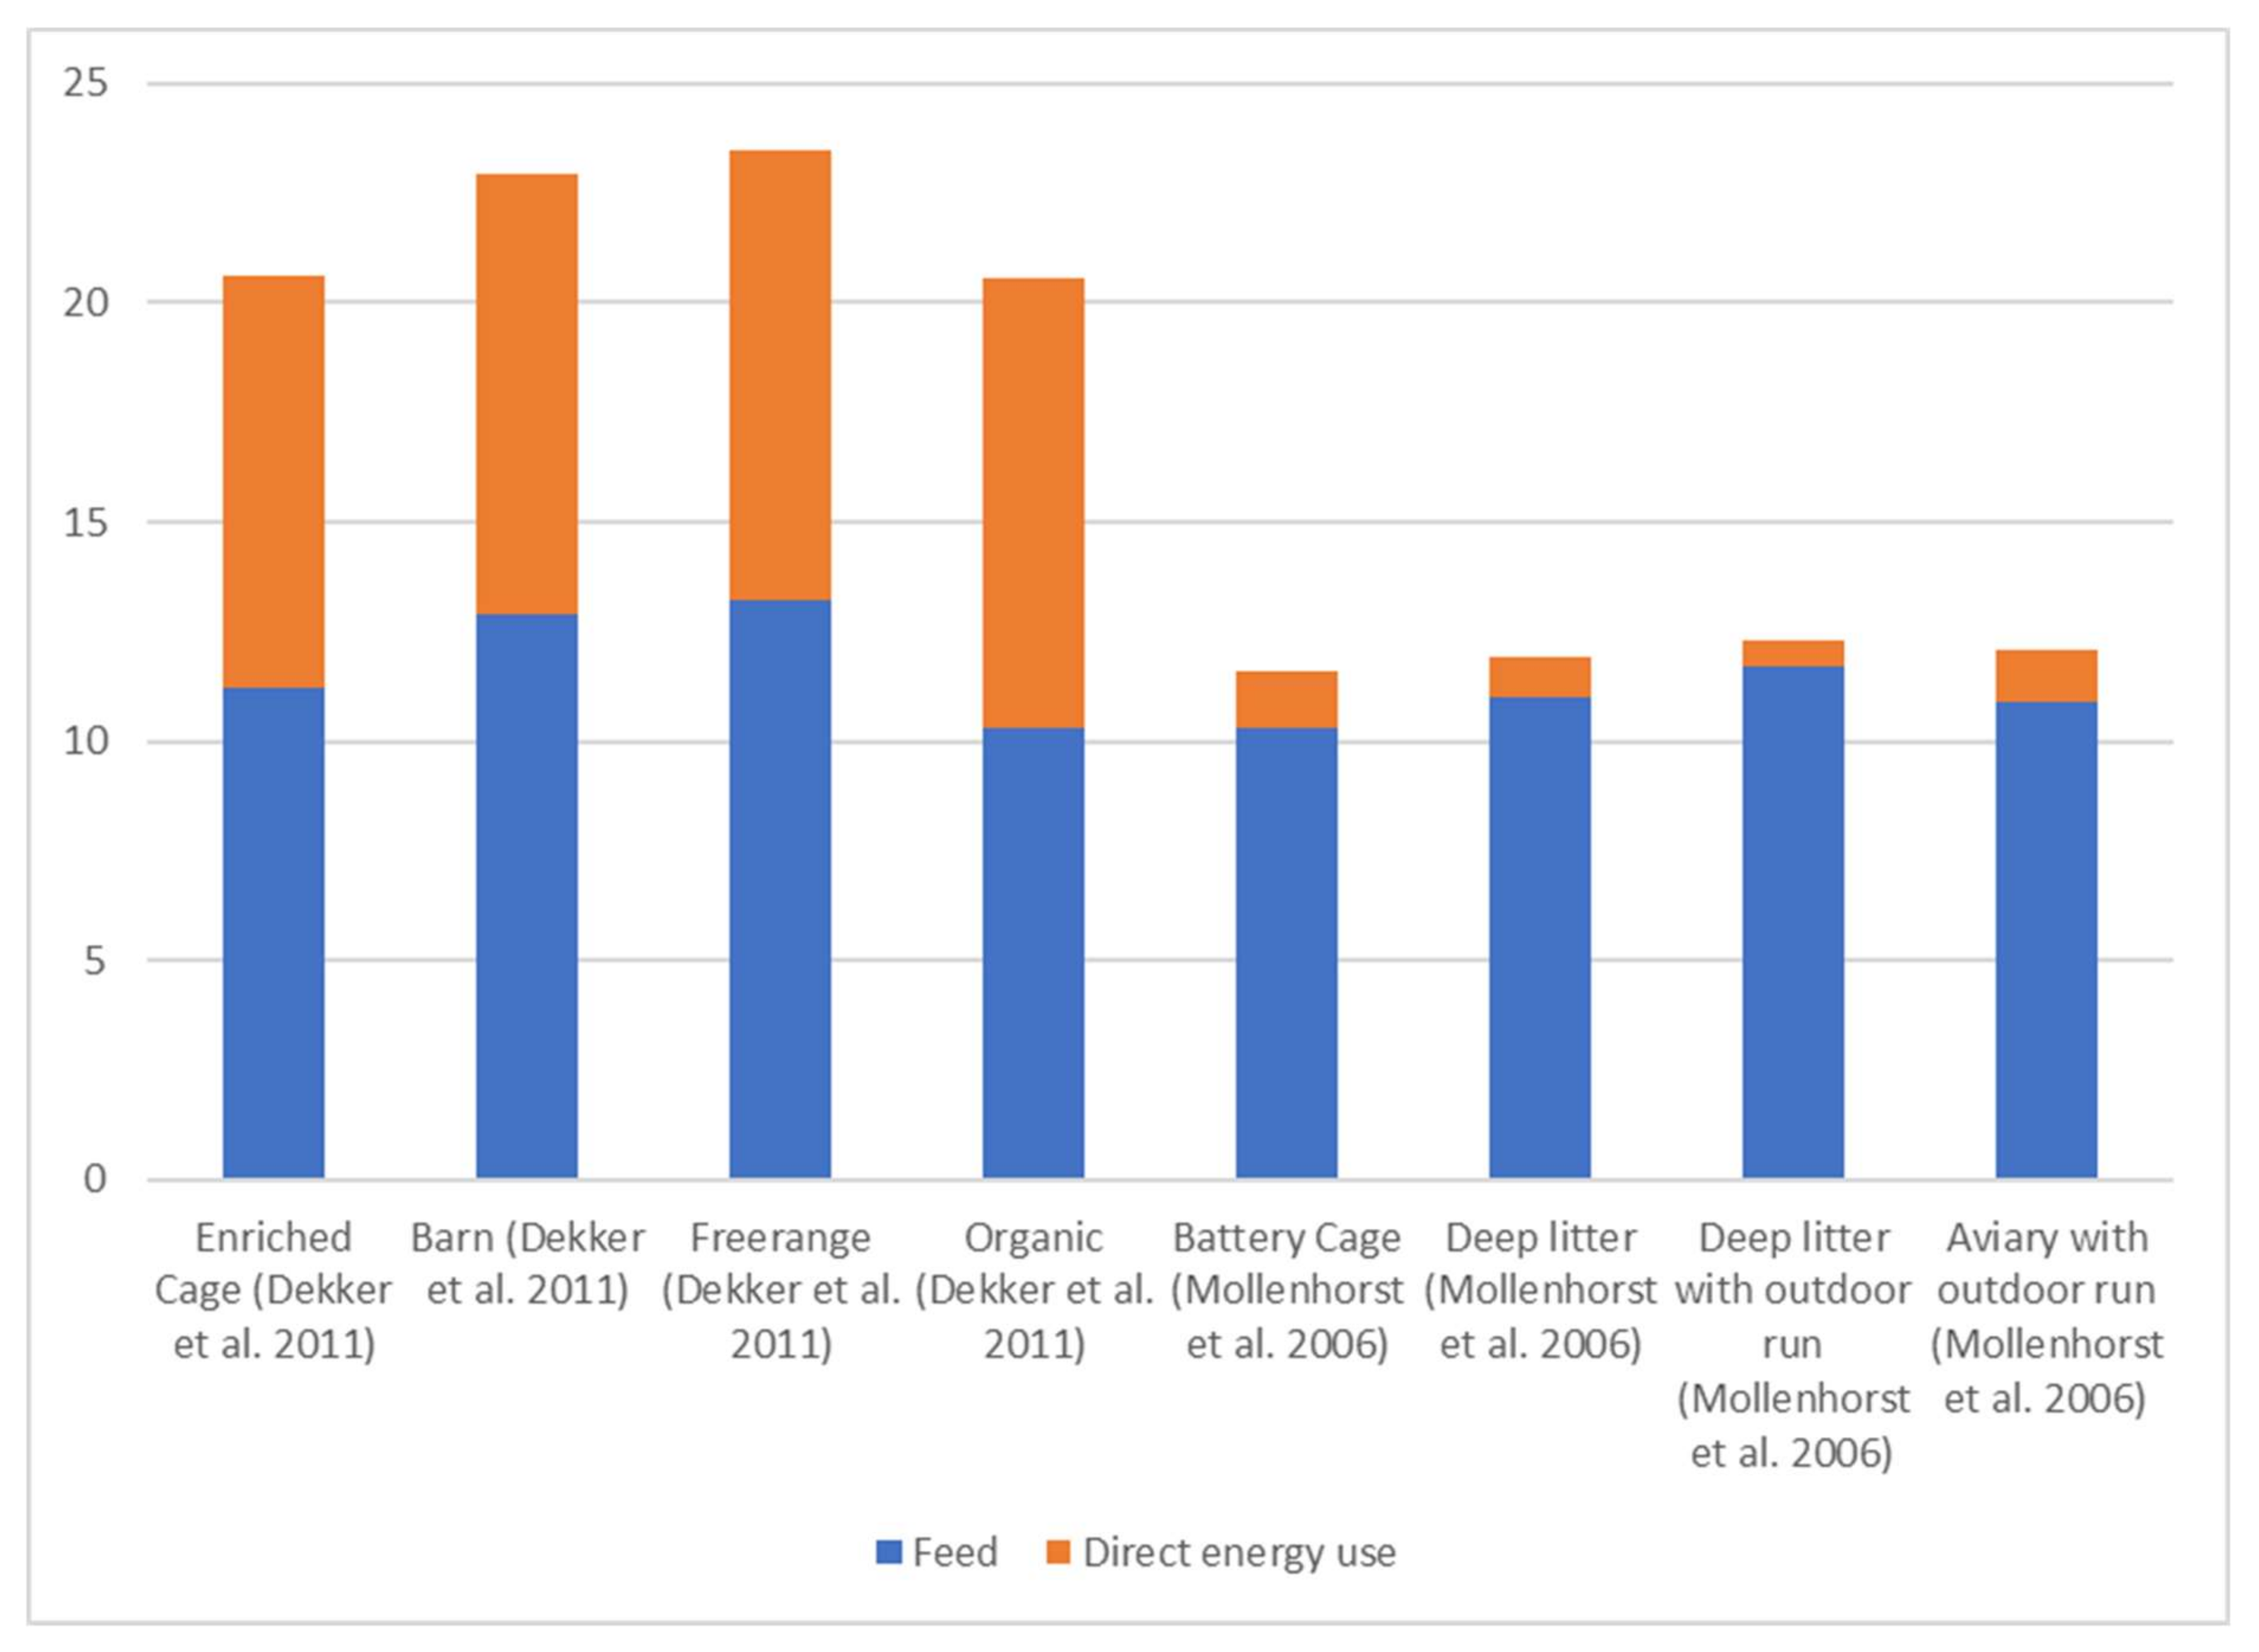
Regarding specific livestock categories, the studies covered indicated that the energy use requirements range from 2.1 to 5.3 MJ/kg per ECM for cow milk, 59.2 MJ/kg for a suckler cow–calf, and 43.73 MJ/kg for a dairy bull, 15.9 MJ/kg to 22.7 MJ/kg for pork production, 9.6 MJ/kg to 19.1 MJ/kg for broiler production, and 20.5–23.5 MJ/kg for chicken egg production. Our review indicated a reliance on fossil energy sources and discussed the transition toward more energy-efficient livestock systems and a higher dependence on renewable energy sources.
Our analysis indicated the need for a standardized methodology in measuring energy use in livestock systems. We see this as a necessary step to develop interventions that reduce fossil energy use and livestock contribution to climatic change. In addition, various other areas have been identified for future research, including other livestock categories and an investigation into the relationship between energy use and agroclimatic conditions as well as farm size.

Author Contributions

Conceptualization, A.T.B., D.M. and G.P.; methodology, B.P., F.V. and A.T.B.; validation, B.P., F.V., formal analysis, B.P., F.V.; investigation, B.P., F.V.; data curation, B.P., F.V.; writing—original draft preparation, B.P., F.V.; writing—review and editing, B.P., F.V., D.T., A.T.B., K.V., G.K., D.M. and G.P.; visualization, B.P.; supervision, A.T.B., D.M. and G.P.; project administration, A.T.B., K.V.; funding acquisition, A.T.B., D.M. and G.P. All authors have read and agreed to the published version of the manuscript.

Funding

This study received funding from the European Union’s Horizon 2020 research and innovation programme under grant agreement IDs 101000496 and 101000785.

Institutional Review Board Statement

Not applicable.

Informed Consent Statement

Not applicable.

Data Availability Statement

No new data were created or analyzed in this study. Data sharing is not applicable to this article.

Acknowledgments

This study was developed as part of the Horizon 2020 Agrofossilfree (www.agrofossilfree.eu accessed on 9 October 2021) and RES4LIVE projects (www.res4live.eu accessed on 9 October 2021). We would like to thank the following people and partners for contributions and insight into developing this article: Agricultural & Environmental Solutions (AGENSO), Erik Fløjgaard Kristensen at Aarhus Universitet (AU), Vanja Bisevac and Ivo Hostens at the Comite Europeen Des Groupements De Constructeurs Du Machinisme Agricole (CEMA), Michael Moraitis, Vassiliki Gavidou, and Dimitrios Fakis at the Center for Research & Technology Hellas (CERTH), Daniele Rossi and Elisa Tomassi at the Confederazione Generale Dell Agricoltura Italiana (CONFAGRICOLTURA), Lucas Mencke at DELPHY, Chris Cavalaris at the European Conservation Agriculture Federation (ECAF), Maite Zarranz and Camino Fabregas at Iniciativas Innovadoras Sal (INI), Magdalena Borzęcka at the Instytut Uprawy Nawozenia I Gleboznawstwa, Panstwowy Instytut Badawczy (IUNG-PIB), Landbrug & Fodevarer F.M.B.A. (L&F), Martyna Próchniak at Lubelski Osrodek Doradztwa Rolniczego W Konskowoli (LODR), Daan Creupelandt at RESCOOP EU ASBL, Barry Caslin at the Agriculture and Food Development Authority (TEAGASC), Marilena Lazopoulou at Trama Tecnoambiental S.L. (TTA), and Felix Colmorgen and Dominik Rutz at Wirtschaft Und Infrastruktur Gmbh & Co Planungs Kg (WIP).

Conflicts of Interest

The authors declare no conflict of interest. The funders had no role in the design of the study; in the collection, analyses, or interpretation of data; in the writing of the manuscript, or in the decision to publish the results.

Appendix A

Table A1. Energy inputs cow milk MJ/ECM (kg) (based on [21,23,25,45]).
SourceType of SystemFeedDirect Energy UseTotal
De Visser et al., 2012PT conventional2.121.103.22
de Visser et al., 2012PL conventional3.901.025.05
de Visser et al., 2012NL conventional3.301.304.60
de Visser et al., 2012DE conventional1.700.752.71
de Visser et al., 2012FI conventional2.900.703.86
Upton, 2014IE conventional1.860.542.40
Cederberg and Flysjö, 2004SE conventional1.760.952.70
Thomassen et al., 2009NL conventional4.400.875.3 FPCM
Guerci et al., 2013DK conventional2.021.763.78
Guerci et al., 2013DE conventional1.340.972.32
Guerci et al., 2013IT conventional2.471.083.54
Cederberg and Flysjö, 2004SE organic1.370.742.10
Thomassen et al., 2009NL organic2.170.963.10
Guerci et al., 2013DK organic1.111.602.71
Table A2. Energy Inputs for beef production slaughter weight MJ/kg (based on [12,20]).
SourceProduction SystemFeedDirect Energy UseTotal
Nguyen et al., 2010EU Suckler cow–calf27.2331.9759.20
Nguyen et al., 2010EU Dairy bull average20.1223.6243.73
Veysset et al., 2014FR Grassland beef: calf-to-weanling and fattened females 19.4011.5330.93
Veysset et al., 2014FR Grassland beef: calf-to-beef. Beef steers production17.4211.5428.96
Veysset et al., 2014FR Mixed crop-livestock: calf-to-beef. Intensive baby beef production17.349.3626.70
Veysset et al., 2014FR Mixed crop-livestock: calf-to-weanling and cereals production18.7911.5830.37
Table A3. Energy inputs for pig production slaughter weight MJ/kg (based on [13,14,21]).
SourceCountryFeedDirect Energy UseTotal
de Visser et al., 2012Portugal13.45.919.3
de Visser et al., 2012Poland13.93.917.8
de Visser et al., 2012Netherlands11.902.614.50
de Visser et al., 2012Germany11.803.114.90
de Visser et al., 2012Finland11.6011.122.70
Basset-Mens & van der Werf, 2005France11.774.13415.90
Nguyen et al., 2010EU16.413.8420.25
Table A4. Energy inputs for broiler production MJ/kg (based on [15,21]).
SourceCountryFeedDirect Energy UseTotal
de Visser et al., 2012Portugal12.100.5012.60
de Visser et al., 2012Poland8.206.6014.80
de Visser et al., 2012Netherlands10.103.8013.90
de Visser et al., 2012Germany6.503.209.70
de Visser et al., 2012Finland7.304.9012.20
Silva et al., 2014France14.824.2819.10
Table A5. Energy inputs for egg-producing systems MJ/kg (based on [19,82]).
SourceProduction SystemFeedDirect Energy UseTotal
Dekker et al., 2011NL Enriched Cage11.29.420.6
Dekker et al., 2011NL Barn12.9010.0522.95
Dekker et al., 2011NL Freerange13.2010.3023.5
Dekker et al., 2011NL Organic10.3010.2520.55
Mollenhorst et al., (2006)NL Battery Cage10.31.311.6
Mollenhorst et al., (2006)NL Deep litter110.911.9
Mollenhorst et al., (2006)NL Deep litter with outdoor run11.70.612.3
Mollenhorst et al., (2006)NL Aviary with outdoor run10.91.212.1
Williams et al., 2006UK Non-organic 14.10
Williams et al., 2007UK Cage 13.60
Williams et al., 2008UK Free range 15.40

Appendix B

Table A6. Studies included in the review.
SourceTitleProduction System(s)Country
[21]State-of-the-Art on Energy Efficiency in Agriculture, Country data on energy consumption in different agroproduction sectors in the European countriesDairy, Pork, broiler, eggEU-wide
[24]Energy Consumption on Dairy Farms: A Review of Monitoring, Prediction Modelling, and AnalysesDairyIreland
[23]System Expansion and Allocation in Life Cycle Assessment of Milk and Beef ProductionDairy, beefSweden
[25]Parameters affecting the environmental impact of a range of dairy farming systems in Denmark, Germany, and ItalyDairy Denmark, Germany, and Italy
[45]Strategies to reduce electricity consumption on dairy farms—An economic and environmental assessmentDairy Ireland
[59]Environmental evaluation of cow and goat milk chains in FranceDairyFrance
[46]Life cycle assessment of conventional and organic milk production in the NetherlandsDairyNetherlands
[12]Environmental consequences of different beef production systems in the EUBeefEU
[20]Energy consumption, greenhouse gas emissions, and economic performance assessments in French Charolais suckler cattle farms: Model-based analysis and forecastsBeefFrance
[13]Fossil energy and GHG saving potentials of pig farming in the EUPorkEU
[18]Environmental costs of meat production: The case of typical EU pork productionPorkEU
[7]Energy Use for Climate Control of Animal Houses: The State of the Art in EuropePork, broiler, eggEU
[14]Scenario-based environmental assessment of farming systems: The case of pig production in FrancePorkFrance
[22]Environmental Assessment of Future Pig Farming Systems—Quantifications of Three Scenarios from the FOOD 21PorkSweden
[52]From farm to fork—A life cycle assessment of fresh Austrian porkPorkAustria
[19]Ecological and economic evaluation of Dutch egg production systemsEggNetherlands
[51]The Cyprus energy profile for the animal sector: current situation and energy-saving measures in combination with RES Cyprus
[15]Environmental impacts of French and Brazilian broiler chicken production scenarios: An LCA approachBroilerFrance
[55]Broilerin fileesuikaleiden tuotannon ympäristövaikutukset ja kehittämismahdollisuudetBroilerFinland
[56]Energy Consumption and Energy Saving Measures in PoultryBroilerGreece
[60]Evaluation of the Energy Utilization Index in Sheep Milk Cooling SystemsSheepItaly
[17]Life Cycle Assessment of Swedish Lamb ProductionLambSweden

References

  1. Peyraud, J.; Macleod, M. Study on Future of EU Livestock: How to Contribute to a Sustainable Agricultural Sector? European Comision: Brussels, Belgium, 2020. [Google Scholar]
  2. Eurostat. Agri-Environmental Indicator–Livestock Patterns Statistics Explained; Eurostat: Luxembourg, 2019. [Google Scholar]
  3. Eurostat. Agricultural Production—Livestock and Meat. Available online: https://ec.europa.eu/eurostat/statistics-explained/index.php?title=Agricultural_production_-_livestock_and_meat&oldid=470510#Livestock_population (accessed on 14 January 2021).
  4. FADN. Farm Economy Focus by Sector—Crops. Available online: https://agridata.ec.europa.eu/extensions/DashboardFarmEconomyFocusCrops/DashboardFarmEconomyFocusCrops.html (accessed on 17 October 2021).
  5. European Commission. Farm to Fork Strategy; European Comission: Brussels, Belgium, 2020. [Google Scholar]
  6. FAO. FAOSTAT—Energy Use. Available online: https://www.fao.org/faostat/en/#data/GN (accessed on 17 October 2021).
  7. Costantino, A.; Fabrizio, E.; Biglia, A.; Cornale, P.; Battaglini, L. Energy Use for Climate Control of Animal Houses: The State of the Art in Europe. Energy Procedia 2016, 101, 184–191. [Google Scholar] [CrossRef] [Green Version]
  8. Weiss, F.; Leip, A. Greenhouse gas emissions from the EU livestock sector: A life cycle assessment carried out with the CAPRI model. Agric. Ecosyst. Environ. 2012, 149, 124–134. [Google Scholar] [CrossRef]
  9. Ramírez, C.A.; Patel, M.; Blok, K. How much energy to process one pound of meat? A comparison of energy use and specific energy consumption in the meat industry of four European countries. Energy 2006, 31, 2047–2063. [Google Scholar] [CrossRef] [Green Version]
  10. Veermäe, I.; Frorip, J.; Kokin, E.; Praks, J.; Poikalainen, V.; Ruus, A.; Lepasalu, L. Energy Consumption in Animal Production; Estonian University of Life Sciences: Tartu, Estonia, 2012. [Google Scholar]
  11. De Vries, M.; de Boer, I.J.M. Comparing environmental impacts for livestock products: A review of life cycle assessments. Livest. Sci. 2010, 128, 1–11. [Google Scholar] [CrossRef]
  12. Nguyen, T.L.T.; Hermansen, J.E.; Mogensen, L. Environmental consequences of different beef production systems in the EU. J. Clean. Prod. 2010, 18, 756–766. [Google Scholar] [CrossRef]
  13. Nguyen, T.L.T.; Hermansen, J.E.; Mogensen, L. Fossil energy and GHG saving potentials of pig farming in the EU. Energy Policy 2010, 38, 2561–2571. [Google Scholar] [CrossRef]
  14. Basset-Mens, C.; Van Der Werf, H.M.G. Scenario-based environmental assessment of farming systems: The case of pig production in France. Agric. Ecosyst. Environ. 2005, 105, 127–144. [Google Scholar] [CrossRef]
  15. Prudêncio da Silva, V.; van der Werf, H.M.G.; Soares, S.R.; Corson, M.S. Environmental impacts of French and Brazilian broiler chicken production scenarios: An LCA approach. J. Environ. Manag. 2014, 133, 222–231. [Google Scholar] [CrossRef]
  16. Benoit, M.; Laignel, G. Energy consumption in mixed crop-sheep farming systems: What factors of variation and how to decrease? Animal 2010, 4, 1597–1605. [Google Scholar] [CrossRef] [Green Version]
  17. Wallman, M.; Cederberg, C.; Sonesson, U. Life Cycle Assessment of Swedish Lamb Production Version 2; SIK: Goteborg, Sweden, 2011; ISBN 9789172903074. [Google Scholar]
  18. Nguyen, T.L.T.; Hermansen, J.E.; Mogensen, L. Environmental costs of meat production: The case of typical EU pork production. J. Clean. Prod. 2012, 28, 168–176. [Google Scholar] [CrossRef]
  19. Dekker, S.E.M.; de Boer, I.J.M.; Vermeij, I.; Aarnink, A.J.A.; Koerkamp, P.W.G.G. Ecological and economic evaluation of Dutch egg production systems. Livest. Sci. 2011, 139, 109–121. [Google Scholar] [CrossRef]
  20. Veysset, P.; Lherm, M.; Bébin, D. Energy consumption, greenhouse gas emissions and economic performance assessments in French Charolais suckler cattle farms: Model-based analysis and forecasts. Agric. Syst. 2010, 103, 41–50. [Google Scholar] [CrossRef]
  21. De Visser, C.; de Buisonje, F.; Ellen, H.; Stanghellini, C.; van der Voort, M. State of the Art on Energy Efficiency in Agriculture, Country Data on Energy Consumption in Different Agroproduction Sectors in the European Countries; agrEE: Wageningen, The Netherlands, 2012. [Google Scholar]
  22. Cederberg, C.; Flysjö, A. SIK-Rapport Nr Environmental Assessment of Future Pig Farming Systems-Quantifications of Three Scenarios from the FOOD 21 Synthesis Work; SIK: Goteborg, Sweden, 2004. [Google Scholar]
  23. Cederberg, C.; Stadig, M. System Expansion and Allocation in Life Cycle Assessment of Milk and Beef Production. Int. J. Life Cycle Assess. 2003, 8, 350–356. [Google Scholar] [CrossRef]
  24. Shine, P.; Upton, J.; Sefeedpari, P.; Murphy, M.D. Energy Consumption on Dairy Farms: A Review of Monitoring, Prediction Modelling, and Analyses. Energies 2020, 13, 1288. [Google Scholar] [CrossRef] [Green Version]
  25. Guerci, M.; Knudsen, M.T.; Bava, L.; Zucali, M.; Schönbach, P.; Kristensen, T. Parameters affecting the environmental impact of a range of dairy farming systems in Denmark, Germany and Italy. J. Clean. Prod. 2013, 54, 133–141. [Google Scholar] [CrossRef]
  26. Pimentel, D. Handbook of Energy Utilization in Agriculture; CRC Press: Boca Raton, FL, USA, 1980; ISBN 0-8493-2661-3. [Google Scholar]
  27. Woods, J.; Williams, A.; Hughes, J.K.; Black, M.; Murphy, R. Energy and the food system. Philos. Trans. R. Soc. B Biol. Sci. 2010, 365, 2991–3006. [Google Scholar] [CrossRef] [PubMed]
  28. Hou, Y.; Bai, Z.; Lesschen, J.P.; Staritsky, I.G.; Sikirica, N.; Ma, L.; Velthof, G.L.; Oenema, O. Feed use and nitrogen excretion of livestock in EU-27. Agric. Ecosyst. Environ. 2016, 218, 232–244. [Google Scholar] [CrossRef]
  29. Greenpeace. Feeding the Problem; Greenpeace European Unit: Brussels, Belgium, 2019. [Google Scholar]
  30. Thornton, P.K. Livestock production: Recent trends, future prospects. Philos. Trans. R. Soc. B Biol. Sci. 2010, 365, 2853–2867. [Google Scholar] [CrossRef] [Green Version]
  31. Van Zanten, H.H.E.; Herrero, M.; Van Hal, O.; Röös, E.; Muller, A.; Garnett, T.; Gerber, P.J.; Schader, C.; De Boer, I.J.M. Defining a land boundary for sustainable livestock consumption. Glob. Chang. Biol. 2018, 24, 4185–4194. [Google Scholar] [CrossRef]
  32. Pe’er, G.; Zinngrebe, Y.; Moreira, F.; Sirami, C.; Schindler, S.; Müller, R.; Bontzorlos, V.; Clough, D.; Bezák, P.; Bonn, A.; et al. A greener path for the EU Common Agricultural Policy. Science 2019, 365, 449–451. [Google Scholar] [CrossRef]
  33. Bais-Moleman, A.L.; Schulp, C.J.E.; Verburg, P.H. Assessing the environmental impacts of production- and consumption-side measures in sustainable agriculture intensification in the European Union. Geoderma 2019, 338, 555–567. [Google Scholar] [CrossRef]
  34. Ergon; Seddaiu, G.; Korhonen, P.; Virkajärvi, P.; Bellocchi, G.; Jørgensen, M.; Østrem, L.; Reheul, D.; Volaire, F. How can forage production in Nordic and Mediterranean Europe adapt to the challenges and opportunities arising from climate change? Eur. J. Agron. 2018, 92, 97–106. [Google Scholar] [CrossRef] [Green Version]
  35. Federal Office for Agriculture and Food (BLE). Drivers of Change and Development in the EU Livestock Sector; Federal Office for Agriculture and Food: Bonn, Germany, 2019. [Google Scholar]
  36. Frorip, J.; Kokin, E.; Praks, J.; Poikalainen, V.; Ruus, A.; Veermäe, I.; Lepasalu, L.; Schäfer, W.; Mikkola, H.; Ahokas, J. Energy consumption in animal production-case farm study. Agron. Res. Biosyst. Eng. 2012, 10, 39–48. [Google Scholar]
  37. Beckman, J.; Borchers, A.; Jones, C.A. Agriculture’s Supply and Demand for Energy and Energy Products; Elsevier: Amsterdam, The Netherlands, 2013. [Google Scholar]
  38. DG Agriculture and Rural Development, Analysis and Outlook Unit. EU Agricultural Outlook: For Markets, Income and Environment 2020–2030; European Commission: Brussels, Belgium, 2020. [Google Scholar]
  39. Watson, C.A.; Reckling, M.; Preissel, S.; Bachinger, J.; Bergkvist, G.; Kuhlman, T.; Lindström, K.; Nemecek, T.; Topp, C.F.E.; Vanhatalo, A.; et al. Grain Legume Production and Use in European Agricultural Systems. In Advances in Agronomy; Academic Press Inc.: Cambridge, MA, USA, 2017; Volume 144, pp. 235–303. [Google Scholar]
  40. European Commission. EU + UK Feed Protein Balance Sheet; European Commission: Brussels, Belgium, 2020. [Google Scholar]
  41. Loyon, L. Overview of Animal Manure Management for Beef, Pig, and Poultry Farms in France. Front. Sustain. Food Syst. 2018, 2, 36. [Google Scholar] [CrossRef]
  42. Chadwick, D.; Sommer, S.; Thorman, R.; Fangueiro, D.; Cardenas, L.; Amon, B.; Misselbrook, T. Manure management: Implications for greenhouse gas emissions. Anim. Feed Sci. Technol. 2011, 166–167, 514–531. [Google Scholar] [CrossRef]
  43. Eurostat. Milk and Milk Product Statistics. Available online: https://ec.europa.eu/eurostat/statistics-explained/index.php/Milk_and_milk_product_statistics#Milk_production (accessed on 26 April 2021).
  44. Kleter, G.; McFarland, S.; Bach, A.; Bernabucci, U.; Bikker, P.; Busani, L.; Kok, E.; Kostov, K.; Nadal, A.; Pla, M.; et al. Surveying selected European feed and livestock production chains for features enabling the case-specific post-market monitoring of livestock for intake and potential health impacts of animal feeds derived from genetically modified crops. Food Chem. Toxicol. 2018, 117, 66–78. [Google Scholar] [CrossRef] [PubMed]
  45. Upton, J. Strategies to Reduce Electricity Consumption on Dairy Farms—An Economic and Environmental Assessment; Wageningen Institute of Animal Sciences: Wageningen, The Netherlands, 2014. [Google Scholar]
  46. Thomassen, M.A.; Van Calker, K.J.; Smits, M.C.J.; Iepema, G.L.; De Boer, I.J.M. Life cycle assessment of conventional and organic milk production in the Netherlands. Agric. Syst. 2008, 96, 95–107. [Google Scholar] [CrossRef]
  47. Greenwood, P.L. Review: An Overview of Beef Production from Pasture and Feedlot Globally, as Demand for Beef and the Need for Sustainable Practices Increase; Elsevier: Amsterdam, The Netherlands, 2021. [Google Scholar]
  48. McAuliffe, G.A.; Takahashi, T.; Orr, R.J.; Harris, P.; Lee, M.R.F. Distributions of emissions intensity for individual beef cattle reared on pasture-based production systems. J. Clean. Prod. 2018, 171, 1672–1680. [Google Scholar] [CrossRef]
  49. Capper, J.L. Is the Grass Always Greener? Comparing the Environmental Impact of Conventional, Natural and Grass-Fed Beef Production Systems. Animals 2012, 2, 127–143. [Google Scholar] [CrossRef]
  50. Cabezas-Garcia, E.H.; Lowe, D.; Lively, F. Energy requirements of beef cattle: Current energy systems and factors influencing energy requirements for maintenance. Animals 2021, 11, 1642. [Google Scholar] [CrossRef]
  51. Markou, G.; Balafoutis, T.; Mohamed, E.; Papadakis, G.; Michael, P.; Janssen, R. The Cyprus Energy Profile for the Animal Sector: Current Situation and Energy Saving Measures in Combination with RES; European Commission: Brussels, Belgium, 2017. [Google Scholar]
  52. Winkler, T.; Schopf, K.; Aschemann, R.; Winiwarter, W. From farm to fork—A life cycle assessment of fresh Austrian pork. J. Clean. Prod. 2016, 116, 80–89. [Google Scholar] [CrossRef] [Green Version]
  53. EPRS. The EU Poultry Meat and Egg Sector; European Parliament: Strasbourg, France, 2019. [Google Scholar]
  54. DG AGRI DG AGRI Dashboard: Poultry Meat EU. Available online: https://ec.europa.eu/info/sites/default/files/food-farming-fisheries/farming/documents/poultry-meat-dashboard_en.pdf (accessed on 5 December 2021).
  55. Katajajuuri, J.-M.; Grönroos, J.; Usva, K.; Virtanen, Y.; Sipilä, I.; Venäläinen, E.; Kurppa, S.; Tanskanen, R.; Mattila, T.; Virtanen, H. Broilerin fileesuikaleiden tuotannon ympäristövaikutukset ja kehittämismahdollisuudet; MTT: Jokioinen, Finland, 2006. [Google Scholar]
  56. Baxevanou, C.; Fidaros, D.; Bartzanas, T.; Kittas, C. Energy Consumption and Energy Saving Measures in Poultry. Energy Environ. Eng. 2017, 5, 29–36. [Google Scholar] [CrossRef]
  57. Williams, A.G.; Audsley, E.; Sandars, D. Determining the Environmental Burdens and Resource Use in the Production of Agricultural Andhorticultural Commodities; Main Report Defra Research Project ISO205; DEFRA: Bedford, UK, 2006. [Google Scholar]
  58. Leinonen, I.; Williams, A.G.; Wiseman, J.; Guy, J.; Kyriazakis, I. Predicting the environmental impacts of chicken systems in the united kingdom through a life cycle assessment: Egg production systems. Poult. Sci. 2012, 91, 26–40. [Google Scholar] [CrossRef] [PubMed]
  59. Kanyarushoki, C.; Fuchs, F.; van der Werf, H. Environmental evaluation of cow and goat milk chains in France. In Proceedings of the 6th International Conference on LCA in the Agri-Food Sector—Towards a Sustainable Management of the Food Chain, Zurich, Switzerland, 12–14 November 2008; pp. 108–114. [Google Scholar]
  60. Cossu, M.; Ledda, L.; Solinas, S.; Cossu, A.; Pazzona, A. Evaluation of the Energy Utilization Index in Sheep Milk Cooling Systems. Energies 2020, 13, 2127. [Google Scholar] [CrossRef]
  61. Paris, B.; Vandorou, F.; Balafoutis, A.T.; Vaiopoulos, K.; Kyriakarakos, G.; Manolakos, D.; Papadakis, G. Energy use in open-field agriculture in the EU: A critical review recommending energy efficiency measures and renewable energy sources adoption. Renew. Sustain. Energy Rev. 2022, 158, 112098. [Google Scholar] [CrossRef]
  62. De Masi, R.F.; Ruggiero, S.; Tariello, F.; Vanoli, G.P. Passive envelope solutions to aid design of sustainable livestock buildings in Mediterranean climate. J. Clean. Prod. 2021, 311, 127444. [Google Scholar] [CrossRef]
  63. Cederberg, C.; Mattsson, B. Life cycle assessment of milk production—S comparison of conventional and organic farming. J. Clean. Prod. 2000, 8, 49–60. [Google Scholar] [CrossRef] [Green Version]
  64. Lehuger, S.; Gabrielle, B.; Gagnaire, N. Environmental impact of the substitution of imported soybean meal with locally-produced rapeseed meal in dairy cow feed. J. Clean. Prod. 2009, 17, 616–624. [Google Scholar] [CrossRef] [Green Version]
  65. U.S. Energy Information Administration Energy for Growing and Harvesting Crops is a Large Component of Farm Operating Costs—Today in Energy—U.S. Energy Information Administration (EIA). Available online: https://www.eia.gov/todayinenergy/detail.php?id=18431 (accessed on 30 November 2021).
  66. Costantino, A.; Calvet, S.; Fabrizio, E. Identification of energy-efficient solutions for broiler house envelopes through a primary energy approach. J. Clean. Prod. 2021, 312, 127639. [Google Scholar] [CrossRef]
  67. Menconi, M.E.; Grohmann, D. Model integrated of life-cycle costing and dynamic thermal simulation (MILD) to evaluate roof insulation materials for existing livestock buildings. Energy Build. 2014, 81, 48–58. [Google Scholar] [CrossRef]
  68. Firfiris, V.K.; Martzopoulou, A.G.; Kotsopoulos, T.A. Passive cooling systems in livestock buildings towards energy saving: A critical review. Energy Build. 2019, 202, 109368. [Google Scholar] [CrossRef]
  69. Manolakos, D.; Panagakis, P.; Bartzanas, T.; Bouzianas, K. Use of heat pumps in HVAC systems for precise environment control in broiler houses: System’s modeling and calculation of the basic design parameters. Comput. Electron. Agric. 2019, 163, 104876. [Google Scholar] [CrossRef]
  70. Chel, A.; Kaushik, G. Renewable energy for sustainable agriculture. Agron. Sustain. Dev. 2011, 31, 91–118. [Google Scholar] [CrossRef]
  71. Rota, A.; Sehgal, K.; Nwankwo, O.; Gelle, R. Livestock and Renewable Energy; IFAD: Rome, Italy, 2012. [Google Scholar]
  72. EIP-AGRI Focus Group. New Feed for Pigs and Poultry Final Report; European Commission: Brussels, Belgium, 2020. [Google Scholar]
  73. European Commission. Fertilisers in the EU Prices, Trade and Use Contents; European Commission: Brussels, Belgium, 2019. [Google Scholar]
  74. Daniel-Gromke, J.; Rensberg, N.; Denysenko, V.; Stinner, W.; Schmalfuß, T.; Scheftelowitz, M.; Nelles, M.; Liebetrau, J. Current Developments in Production and Utilization of Biogas and Biomethane in Germany. Chemie Ing. Tech. 2018, 90, 17–35. [Google Scholar] [CrossRef]
  75. Scarlat, N.; Fahl, F.; Dallemand, J.F.; Monforti, F.; Motola, V. A spatial analysis of biogas potential from manure in Europe. Renew. Sustain. Energy Rev. 2018, 94, 915–930. [Google Scholar] [CrossRef]
  76. Paris, B.; Papadakis, G.; Janssen, R.; Rutz, D. Economic analysis of advanced biofuels, renewable gases, electrofuels and recycled carbon fuels for the Greek transport sector until 2050. Renew. Sustain. Energy Rev. 2021, 144, 111038. [Google Scholar] [CrossRef]
  77. Lawson, N.; Alvarado-Morales, M.; Tsapekos, P.; Angelidaki, I. Techno-economic assessment of biological biogas upgrading based on danish biogas plants. Energies 2021, 14, 8252. [Google Scholar] [CrossRef]
  78. Moran, D.; Blair, K.J. Review: Sustainable livestock systems: Anticipating demand-side challenges. Animal 2021, 15, 100288. [Google Scholar] [CrossRef]
  79. Berners-Lee, M.; Hoolohan, C.; Cammack, H.; Hewitt, C.N. The relative greenhouse gas impacts of realistic dietary choices. Energy Policy 2012, 43, 184–190. [Google Scholar] [CrossRef]
  80. Bryngelsson, D.; Wirsenius, S.; Hedenus, F.; Sonesson, U. How can the EU climate targets be met? A combined analysis of technological and demand-side changes in food and agriculture. Food Policy 2016, 59, 152–164. [Google Scholar] [CrossRef] [Green Version]
  81. European Commission. The New Common Agricultural Policy: 2023–2027. Available online: https://ec.europa.eu/info/food-farming-fisheries/key-policies/common-agricultural-policy/new-cap-2023-27_en (accessed on 14 September 2021).
  82. Mollenhorst, H.; Berentsen, P.B.M.; De Boer, I.J.M. British Poultry Science On-farm quantification of sustainability indicators: An application to egg production systems On-farm quantification of sustainability indicators: An application to egg production systems. Br. Poult. Sci. 2006, 47, 405–417. [Google Scholar] [CrossRef] [PubMed]
Figure 1. Range of energy inputs of studies covered in this review according to species MJ/kg.
Applsci 12 02142 g001
Figure 2. Energy inputs cow milk MJ/ECM (kg) (based on [21,23,25,45]).
Applsci 12 02142 g002
Figure 3. Energy inputs for beef production slaughter weight MJ/kg (based on [12,20]).
Applsci 12 02142 g003
Figure 4. Direct energy inputs according to activity (based on [12]).
Applsci 12 02142 g004
Figure 5. Energy inputs for pig production slaughter weight MJ/kg (based on [13,14,21]).
Applsci 12 02142 g005
Figure 6. Energy inputs for broiler production MJ/kg (based on [15,21]).
Applsci 12 02142 g006
Figure 7. Energy inputs for egg-producing systems MJ/kg (based on [15,56]).
Applsci 12 02142 g007
Table 1. Low and high range of energy inputs according to feed and direct energy inputs per production systems MJ/kg.
Animal FeedDirect Energy Use
Production SystemLowHighLowHigh
Cow milk1.114.40.541.76
Beef17.3427.239.3631.97
Pork11.616.412.611.1
Broiler6.514.820.56.6
Egg10.313.20.610.3
Table 2. Electrical energy breakdown dairy farms EU (based on [24]).
SourceCountryMilk CoolingMilk HarvestingWater HeatingWater Pumping
Murgia et al., 2013Italy38%31%13%18%
Todde et al., 2018Italy29%35%23%14%
Rajaniemi et al., 2017Finland42%23%32%3%
Shine et al., 2018Ireland41%25%28%6%
Shortall et al., 2018Ireland29%53%11%7%
Upton et al., 2013Ireland39%25%29%6%
Table 3. Direct energy inputs in pig production systems according to activity (based on [18]).
ActivityEnergy Input (MJ)% Of Direct Energy Inputs
Diesel use0.8722%
Housing—Electricity1.9550%
Housing heat—oil0.6517%
Manure pumping and stirring—Electricity0.410%
Table 4. Heating, ventilation, and lighting energy consumption in broiler systems MJ/kgmeat (based on [7]).
SourceCountryHeatingVentilationLighting
Amand et al., 2009France1.370.110.07
ADEME, 2010France1.510.150.10
Arellano, 2011Spain5.450.170.03
Arellano, 2011Spain2.730.170.01
Arellano, 2011Spain1.640.170.01
Rossi et al., 2013Italy2.230.120.03
Hörndahl, 2008Sweden1.730.070.22
Table 5. Thermal and electrical energy consumption in broiler systems MJ/kgmeat (based on [7,55,56]).
SourceCountryThermalElectrical
Amand et al., 2009France1.370.18
ADEME, 2010France1.510.25
Arellano, 2011Spain5.450.19
Arellano, 2011Spain2.730.18
Arellano, 2011Spain1.640.17
Blázquez and Del Olmo, 2008Italy1.400.01
Rossi et al., 2013Italy2.150.23
Hörndahl, 2008Sweden1.730.30
Katajajuuri et al., 2006 *Finland4.070.68
Baxevanou et al., 2017 1Greece1.1160.36
* MJ/kg carcass weight. 1 MJ/kg live weight.
Publisher’s Note: MDPI stays neutral with regard to jurisdictional claims in published maps and institutional affiliations.

