1. Introduction
An abdominal aortic aneurysm (AAA) is one of the most life-threatening cardiovascular diseases worldwide [
1]. In the USA, AAA fatality ranks 14th among people aged over 60 years, with a higher prevalence (8.9%) in men than in women [
2,
3]. In other nations such as Sweden, the prevalence in men older than 65 years is 1.4%, and in women older than 70 years is 0.5% [
4]. Over the past two decades, the incidence of aortic aneurysms has increased, either due to improved diagnosis or an actual increase in aneurysm cases [
5,
6]. AAAs are generally asymptomatic and often detected through unrelated examinations or routine screening using computed tomography, echography, or other imaging methods [
3]. The maximum diameter of an aneurysm is employed as an indicator of aortic rupture and to determine whether surgical intervention is required [
7]. However, this indicator may be an inaccurate predictor of rupture [
1,
8], and new indicators such as hemodynamic parameters have been used for improved prediction of aneurysm rupture [
9].
Over the past few years, flexible stent-graft devices that can overcome anatomical challenges during and after endovascular aneurysm repair have been sought [
10,
11]. Although severe and short proximal infrarenal aortic neck angulation (>60°) is the main cause of repair failure and migration of stent grafts [
12,
13], it has been scarcely investigated. Therefore, according to the proximal angulation of AAAs, research on hemodynamics and its parameters should be conducted. Hemodynamics describes the kinetic energy created by blood flow inside veins and arteries. The pathogenesis of an AAA can be associated with various hemodynamic parameters such as velocity, strain rate, blood viscosity, hydrostatic pressure, wall shear stress (WSS), and relative wall strain [
1,
14,
15].
Computational fluid dynamics (CFD) has been increasingly adopted in cardiovascular research to investigate hemodynamics in factors including velocity, pressure, and WSS [
16,
17,
18]. Lin et al. compared fluid–structure interactions and CFD on an AAA model, finding similar WSS trends [
19]. However, some differences in vortex intensity, size, and pattern were observed during deceleration, leading to overestimated WSS in CFD by 30%. On the other hand, fluid–structure interaction is more complex and time–consuming than CFD.
CFD has supported applications of idealized and patient-specific models for predicting the rupture risk considering geometry [
20,
21,
22]. In addition, an idealized AAA model has been used to investigate hemodynamics according to the neck angulation via inlet velocity waveforms [
23,
24,
25]. Xenos et al. found that peak wall stress increased as the inlet neck angulation increased, whereas Drewe et al. found no relation between the peak wall stress and neck angulation [
23,
24]. Li et al. found that a large neck curvature causes vortices at the proximal neck that elevate the wall stress, possibly leading to AAA rupture there [
25]. While many clinical AAA cases exhibit severe angulated proximal necks, only the flow of mild-to-moderate neck angulation has been demonstrated. We focus on the hemodynamics of severe neck angulation with varying degrees using idealized AAA models. Specifically, we use CFD to perform transient simulations considering angulated neck in idealized AAA models to investigate the effect of neck angulation on hemodynamic changes throughout the cardiac cycle.
2. Materials and Methods
2.1. AAA Geometries
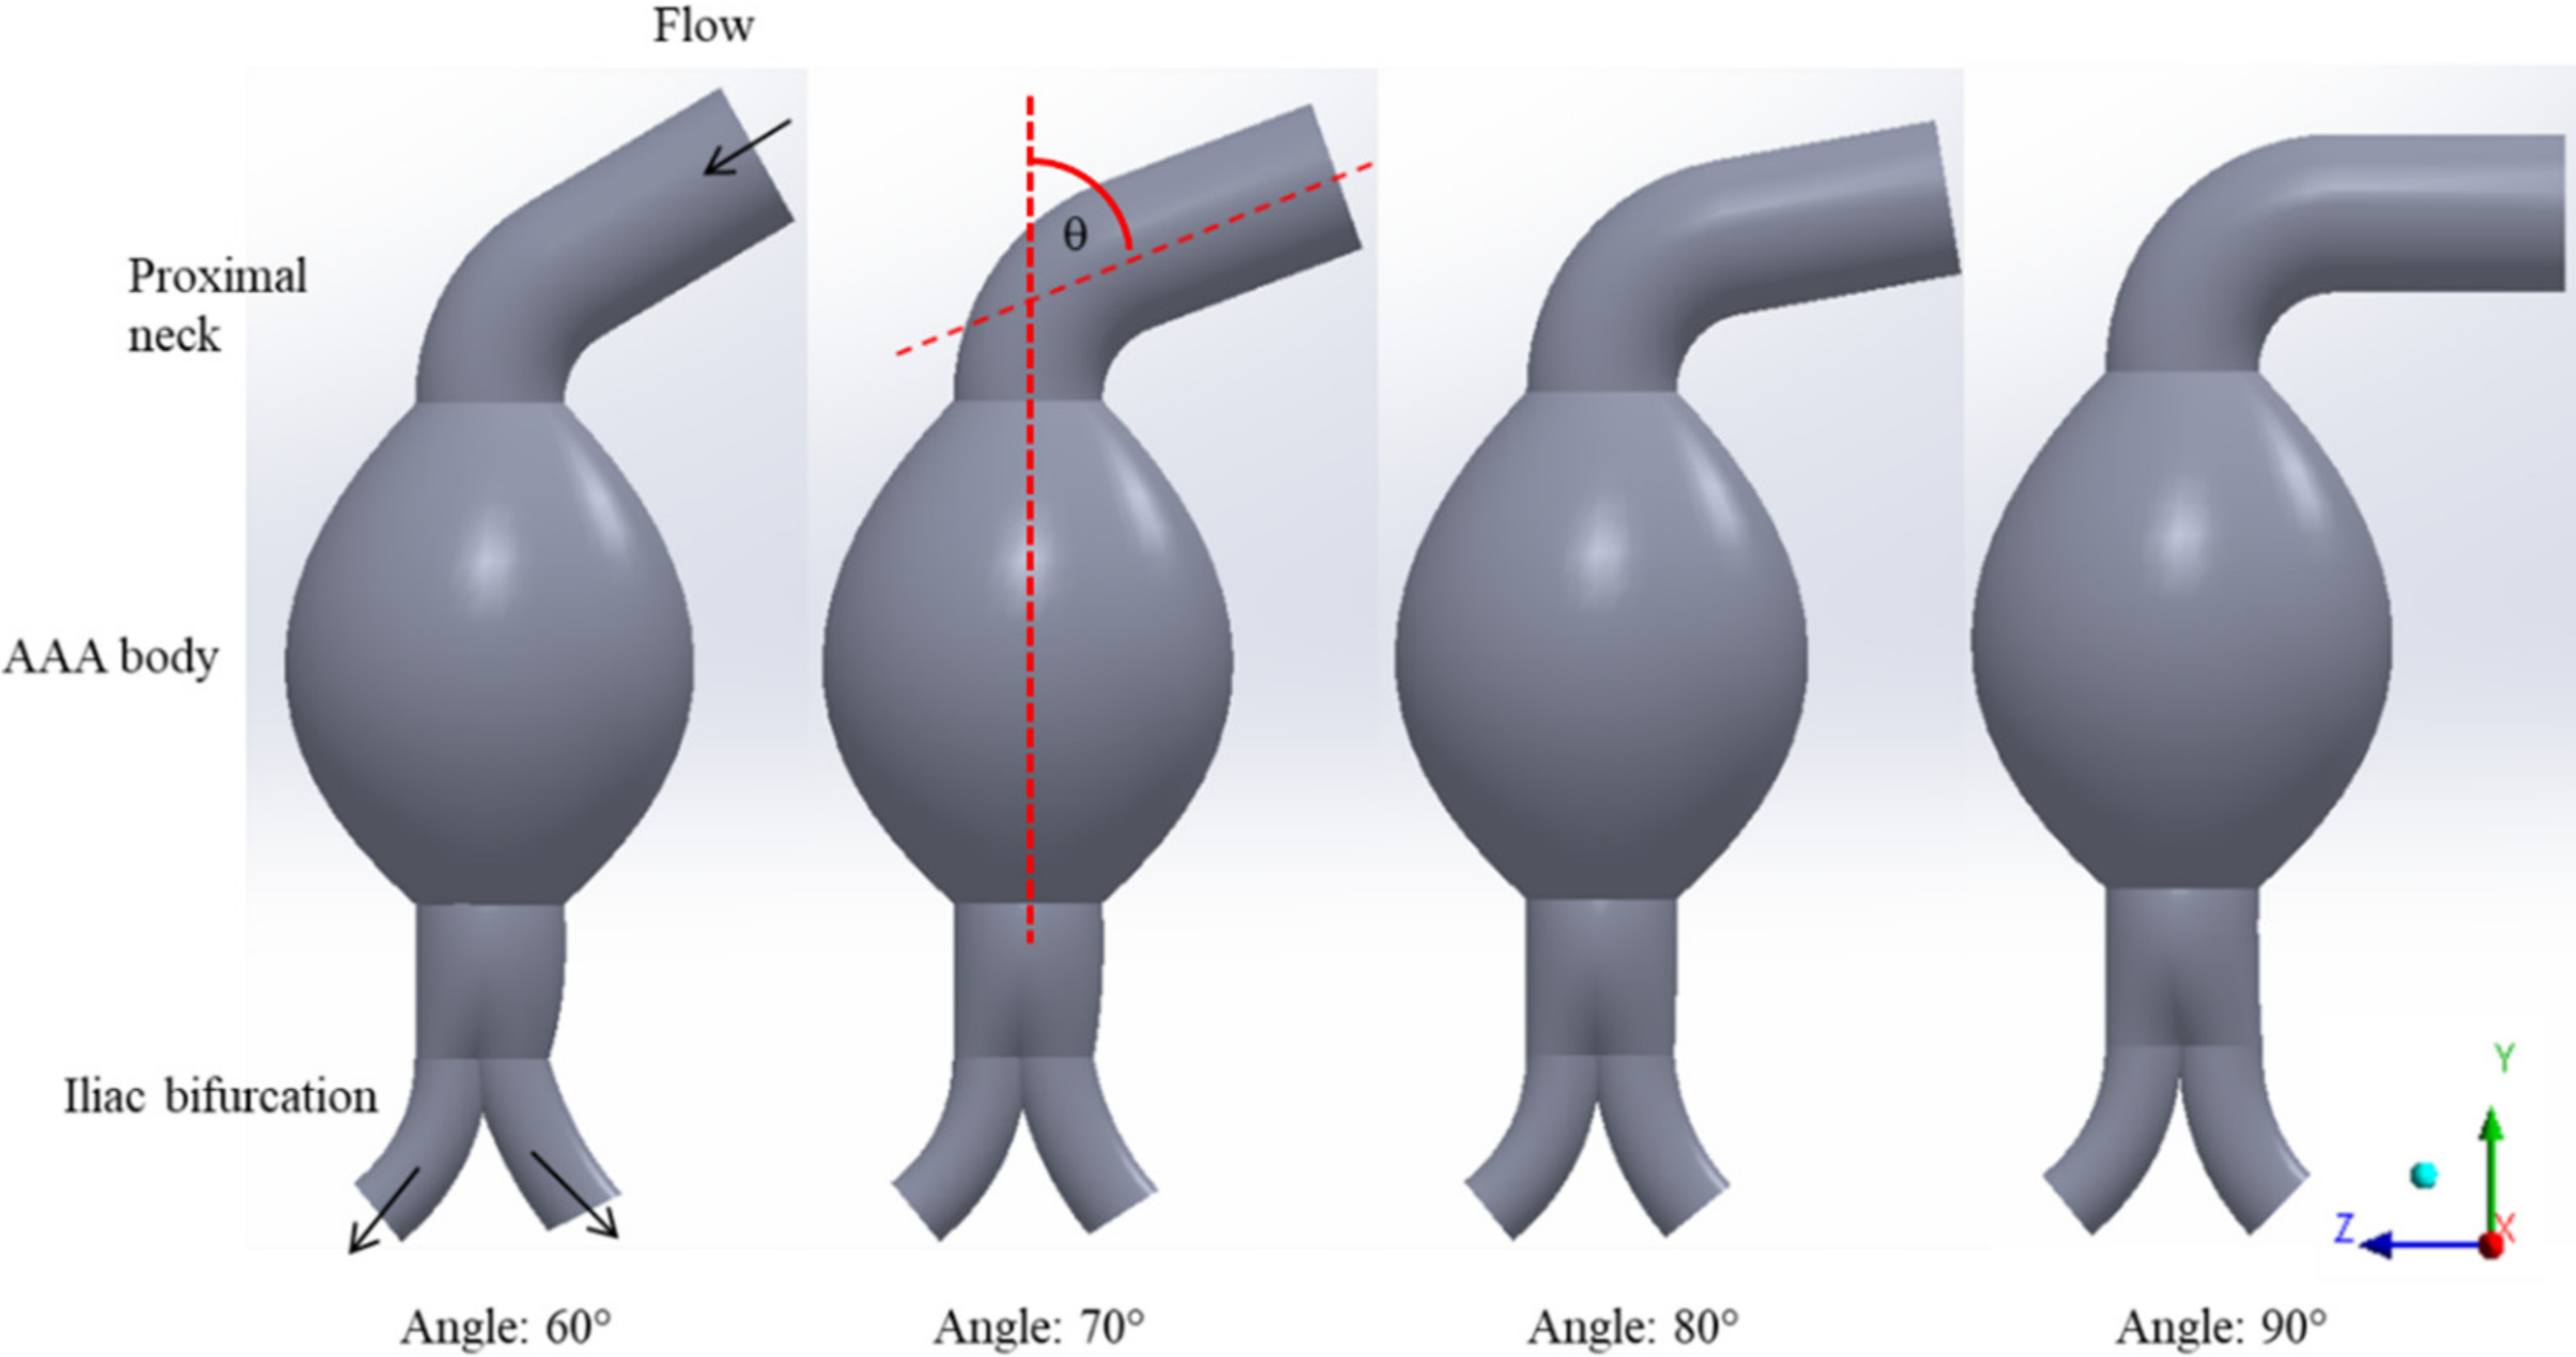
Four idealized three-dimensional models of AAAs with angulated necks were constructed from scratch in the ANSYS SpaceClaim software (ANSYS, Canonsburg, PA, USA). We adopted the design of AAA neck angulations proposed by Yeow and Leo [
26], with a 5.5 cm fusiform aneurysm and the average size of ruptured aneurysm provided in previous literature [
27,
28]. The diameters of the proximal neck were 2.0 cm, and those of iliac bifurcated arteries in the left and right sides were 1.1 and 1.0 cm for all cases, respectively. The proximal neck angulations of AAAs were varied with increments of 10° from 60° to 90° at a fixed iliac angle of 70°, as shown in
Figure 1.
2.2. Mesh Generation
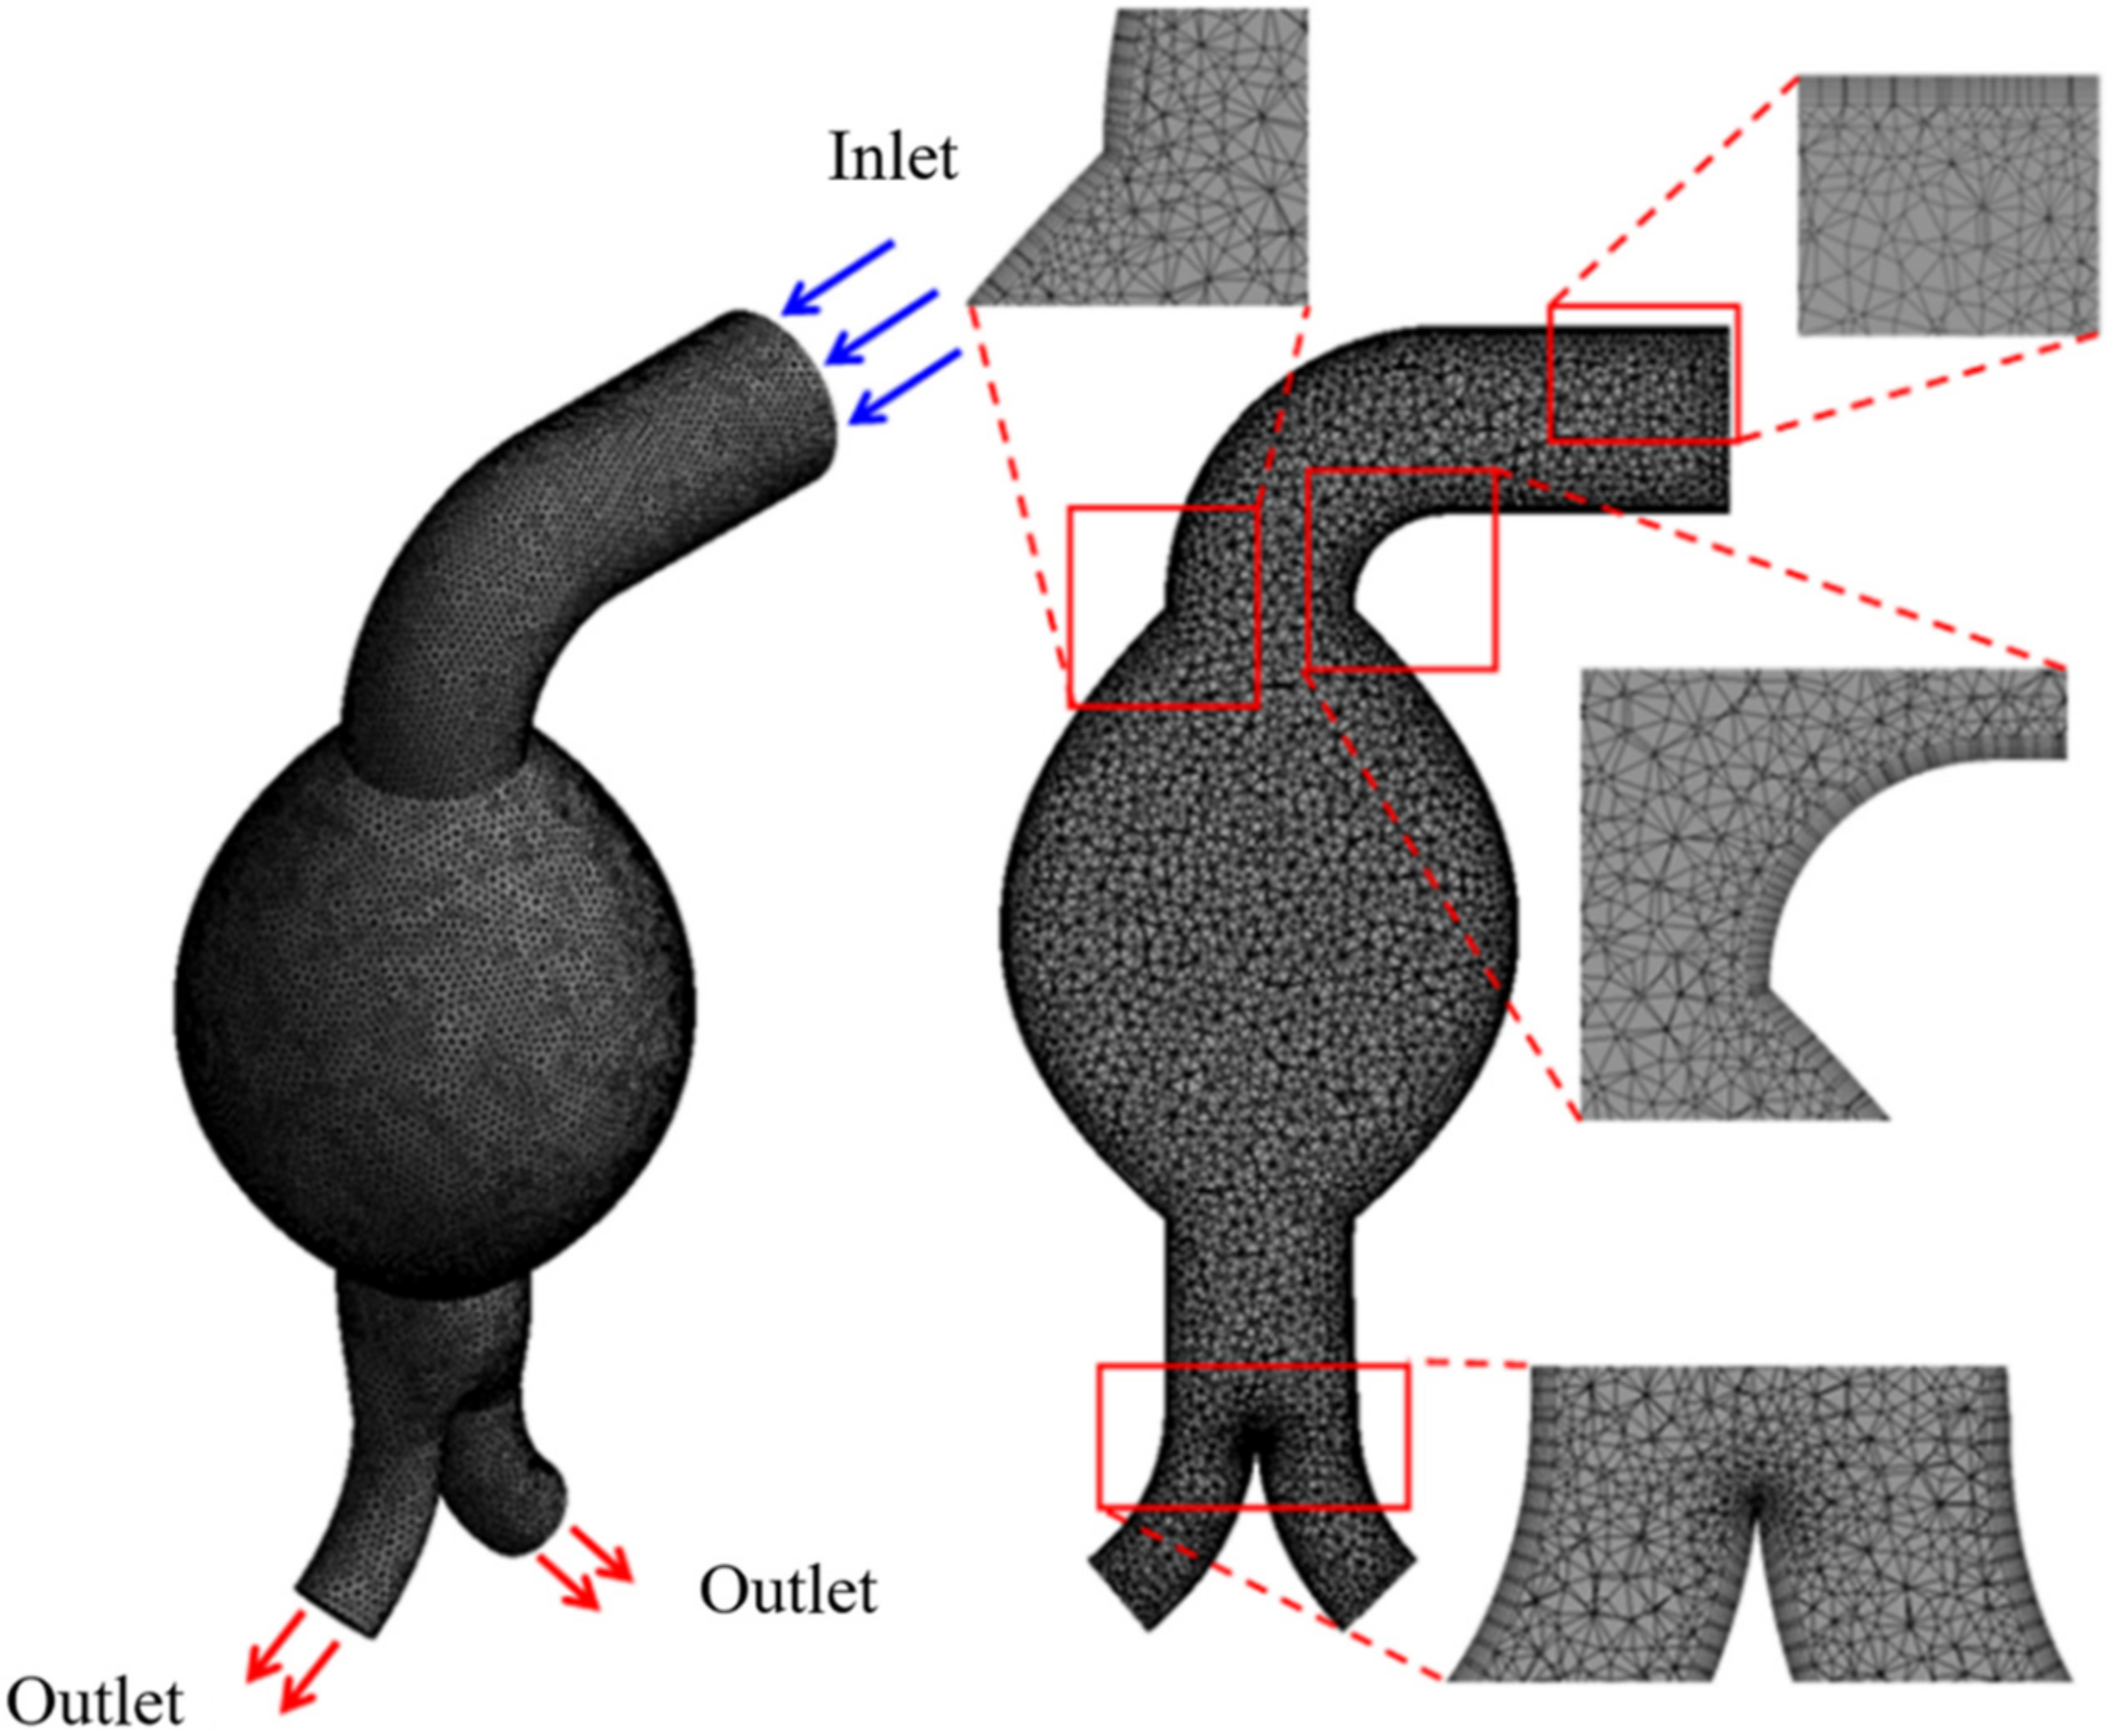
The meshes for the four angulated necks in the AAA models (
Figure 1) were generated using ANSYS Workbench v16.2 (ANSYS, Canonsburg, PA, USA). We adopted the earlier recommended [
29,
30] mesh convergence index to determine the computational simulation error. The grid convergence index reflects the computational error resulting from Richardson extrapolation. Three different mesh densities were evaluated to confirm mesh independence. The refinement of mesh elements is illustrated in
Figure 2; the tetrahedral four-node elements are finer near the aortic wall [
31].
2.3. Governing Equations
The Navier–Stoke and continuity equations that govern the fluid domain to solve the flow motion are expressed as follows:
where
p is the pressure;
ρ and
µ are the blood density and dynamic viscosity, respectively;
is the velocity vector; and
is the velocity vector expressed in local coordinates.
2.4. Model Properties and Boundary Conditions
The laminar flow simulations were conducted under transient conditions. Blood was assumed to be a Newtonian fluid with a constant dynamic viscosity of 0.0035 Pa·s and a density of 1060 kg/m
3 [
16,
32]. The Newtonian fluid assumption is reasonable in larger arteries because non-Newtonian effects mostly occur in small vessels [
23,
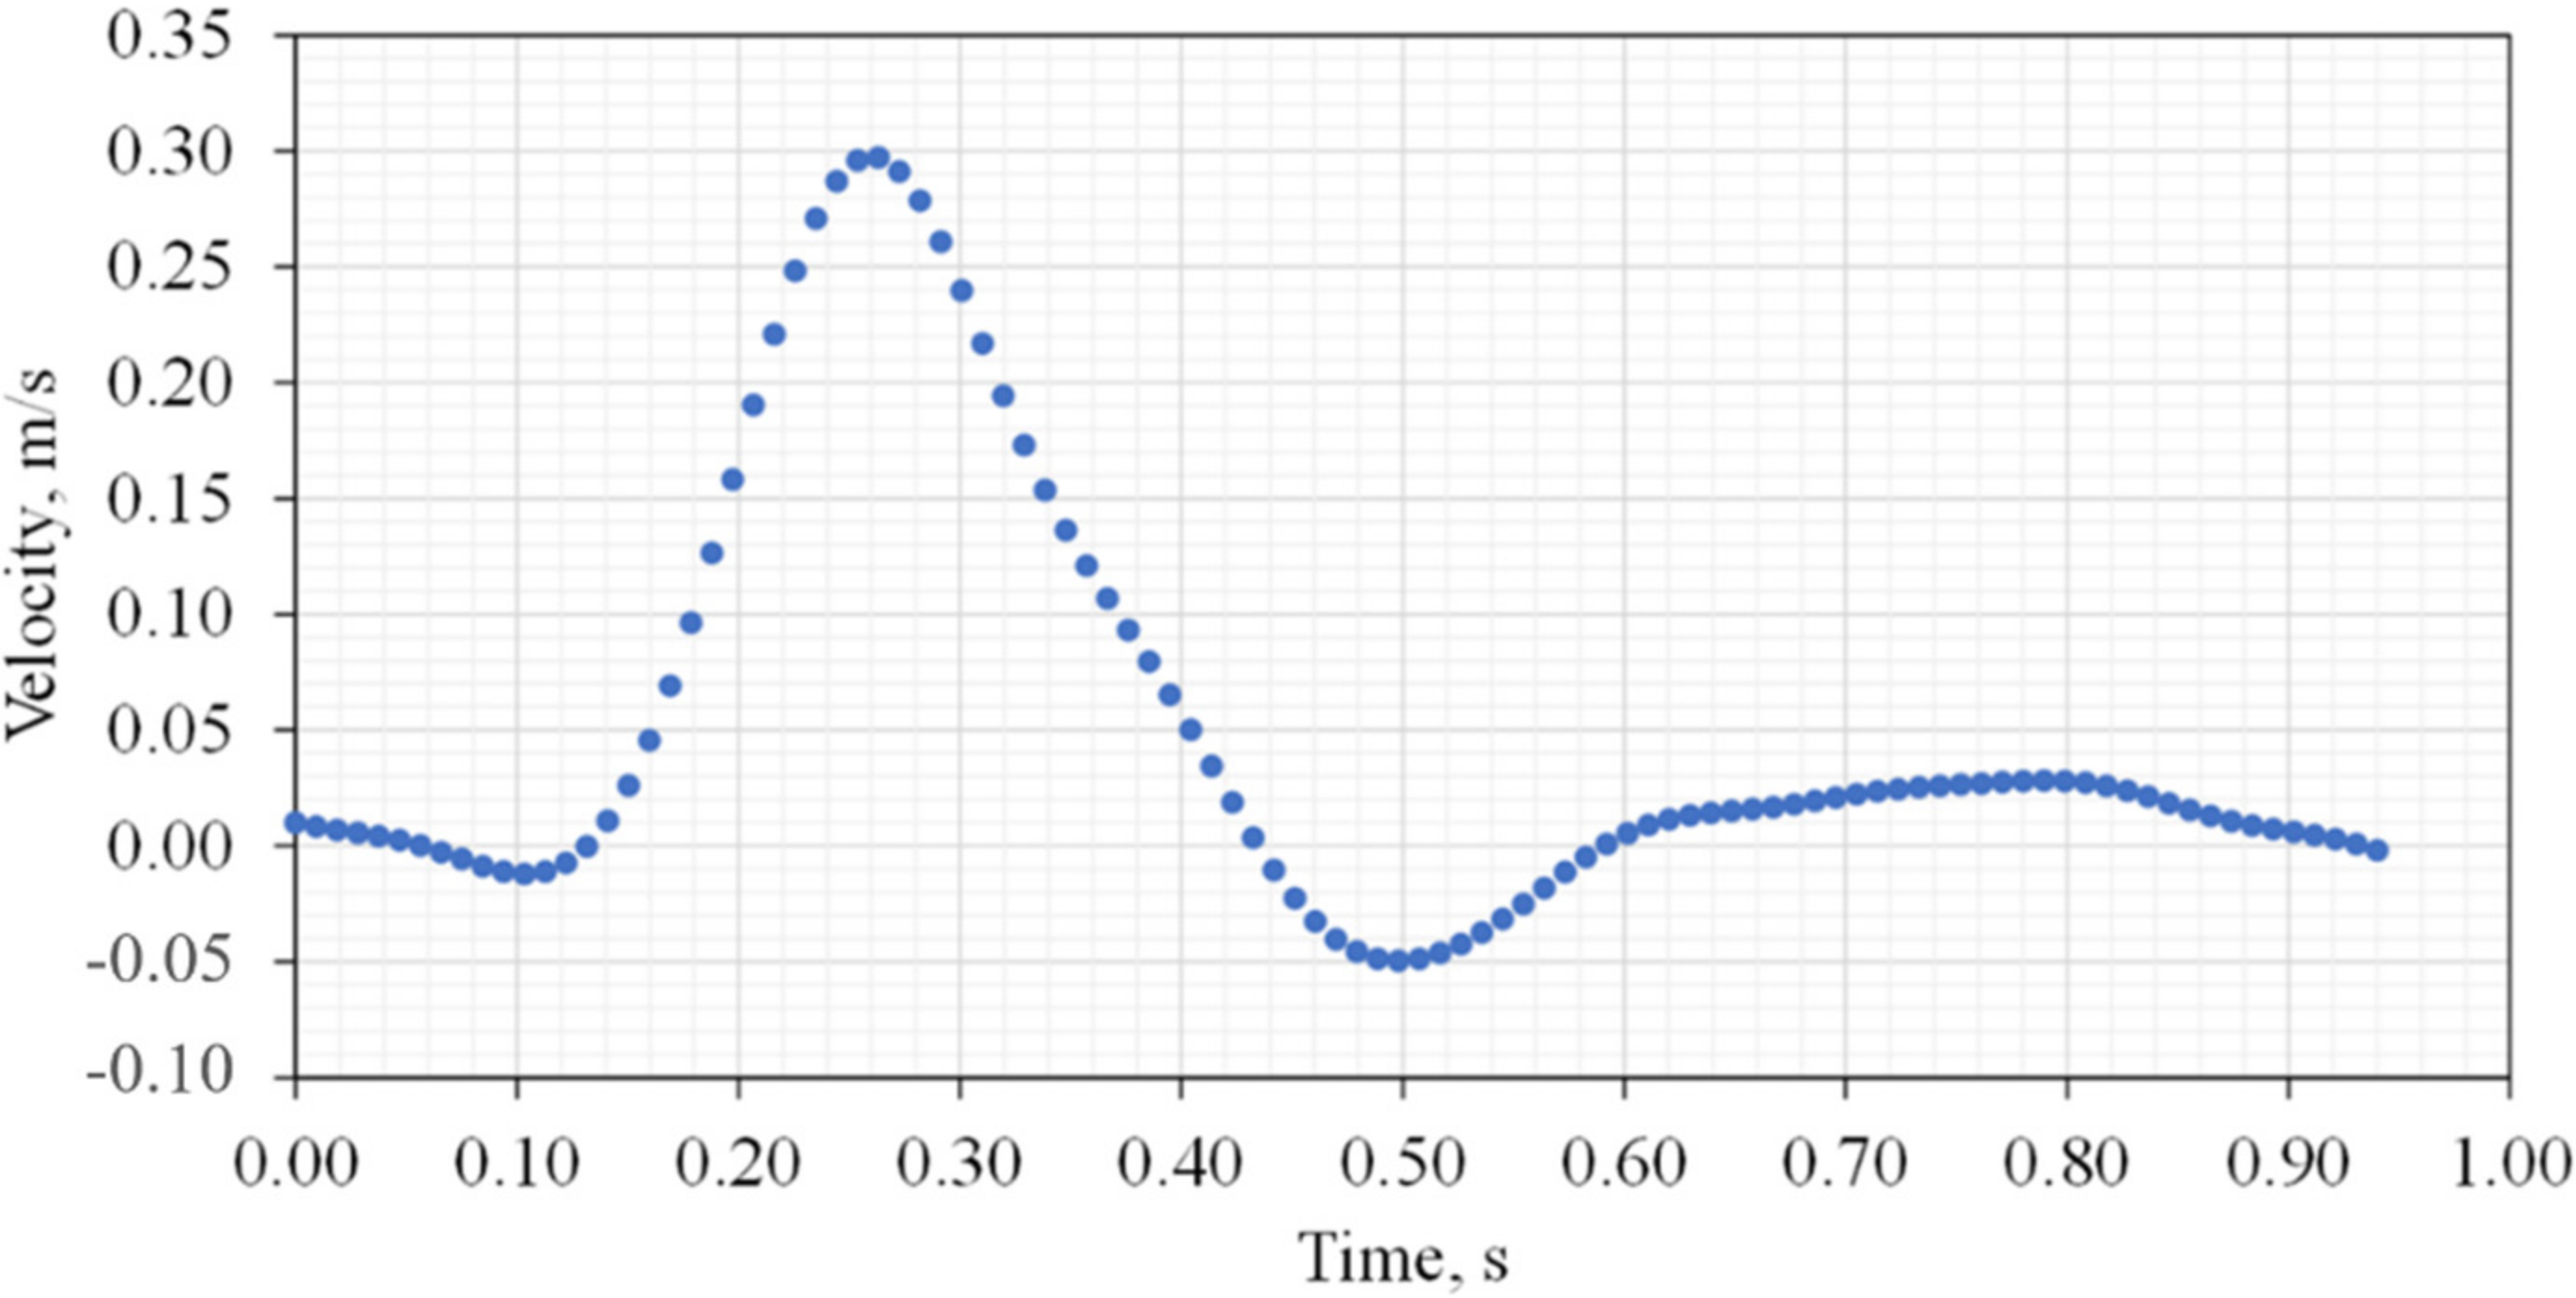
33]. Moreover, because the blood flow within blood vessels is pulsatile [
34], a user-defined function for a time-dependent velocity waveform was applied at the inlet throughout a cardiac cycle with a velocity ranging between −0.05 and 0.3 m/s, as shown in
Figure 3. The inlet velocity waveform was reproduced from previous work by Rissland et al. [
35]. The outlet boundary at zero-gauge pressure was used at the common iliac arteries [
26,
36]. The arterial wall was assumed to be non-slipping and rigid.
2.5. Simulations
We used a commercial CFD package to solve the governing equations, and ANSYS Fluent v19.2 (ANSYS, Canonsburg, PA, USA) was used for the computations. A laminar model using a second-order implicit method for transient formulations was evaluated. The pressure–velocity coupling was set as a SIMPLE (semi-implicit method for pressure-linked equation) to solve the continuity and momentum equations under a second-order upwind scheme for spatial discretization. The convergence value for the residual velocity and continuity was set to 1 × 10⁻⁵. The solutions were computed in 282-step cycles with a timestep of 0.01 s.
2.6. Data Analysis
The resulting systolic and diastolic aortic flows were analyzed to demonstrate the substantial changes in flow-mediated dilation by the variations in neck angulation. In addition, the blood flow velocity, velocity patterns, pressure pattern, WSS, time-averaged WSS (TAWSS), and oscillatory shear index (OSI) were determined in various AAA regions. For velocity and pressure, the value relative to the maximum was used as a ratio.
3. Results
Hemodynamic parameters including blood flow velocity, pressure, WSS, TAWSS, and OSI for pulsatile simulations were investigated at several instants of the cardiac cycle: early systole, peak systole, late systole, early diastole, mid-diastole, and late diastole.
3.1. Mesh Dependency
Mesh convergence was used to evaluate the invariance of numerical simulation results with respect to the mesh. The calculations were performed in parallel on a desktop computer equipped with a 3.40 GHz quad-core processor and 16.0 GB RAM.
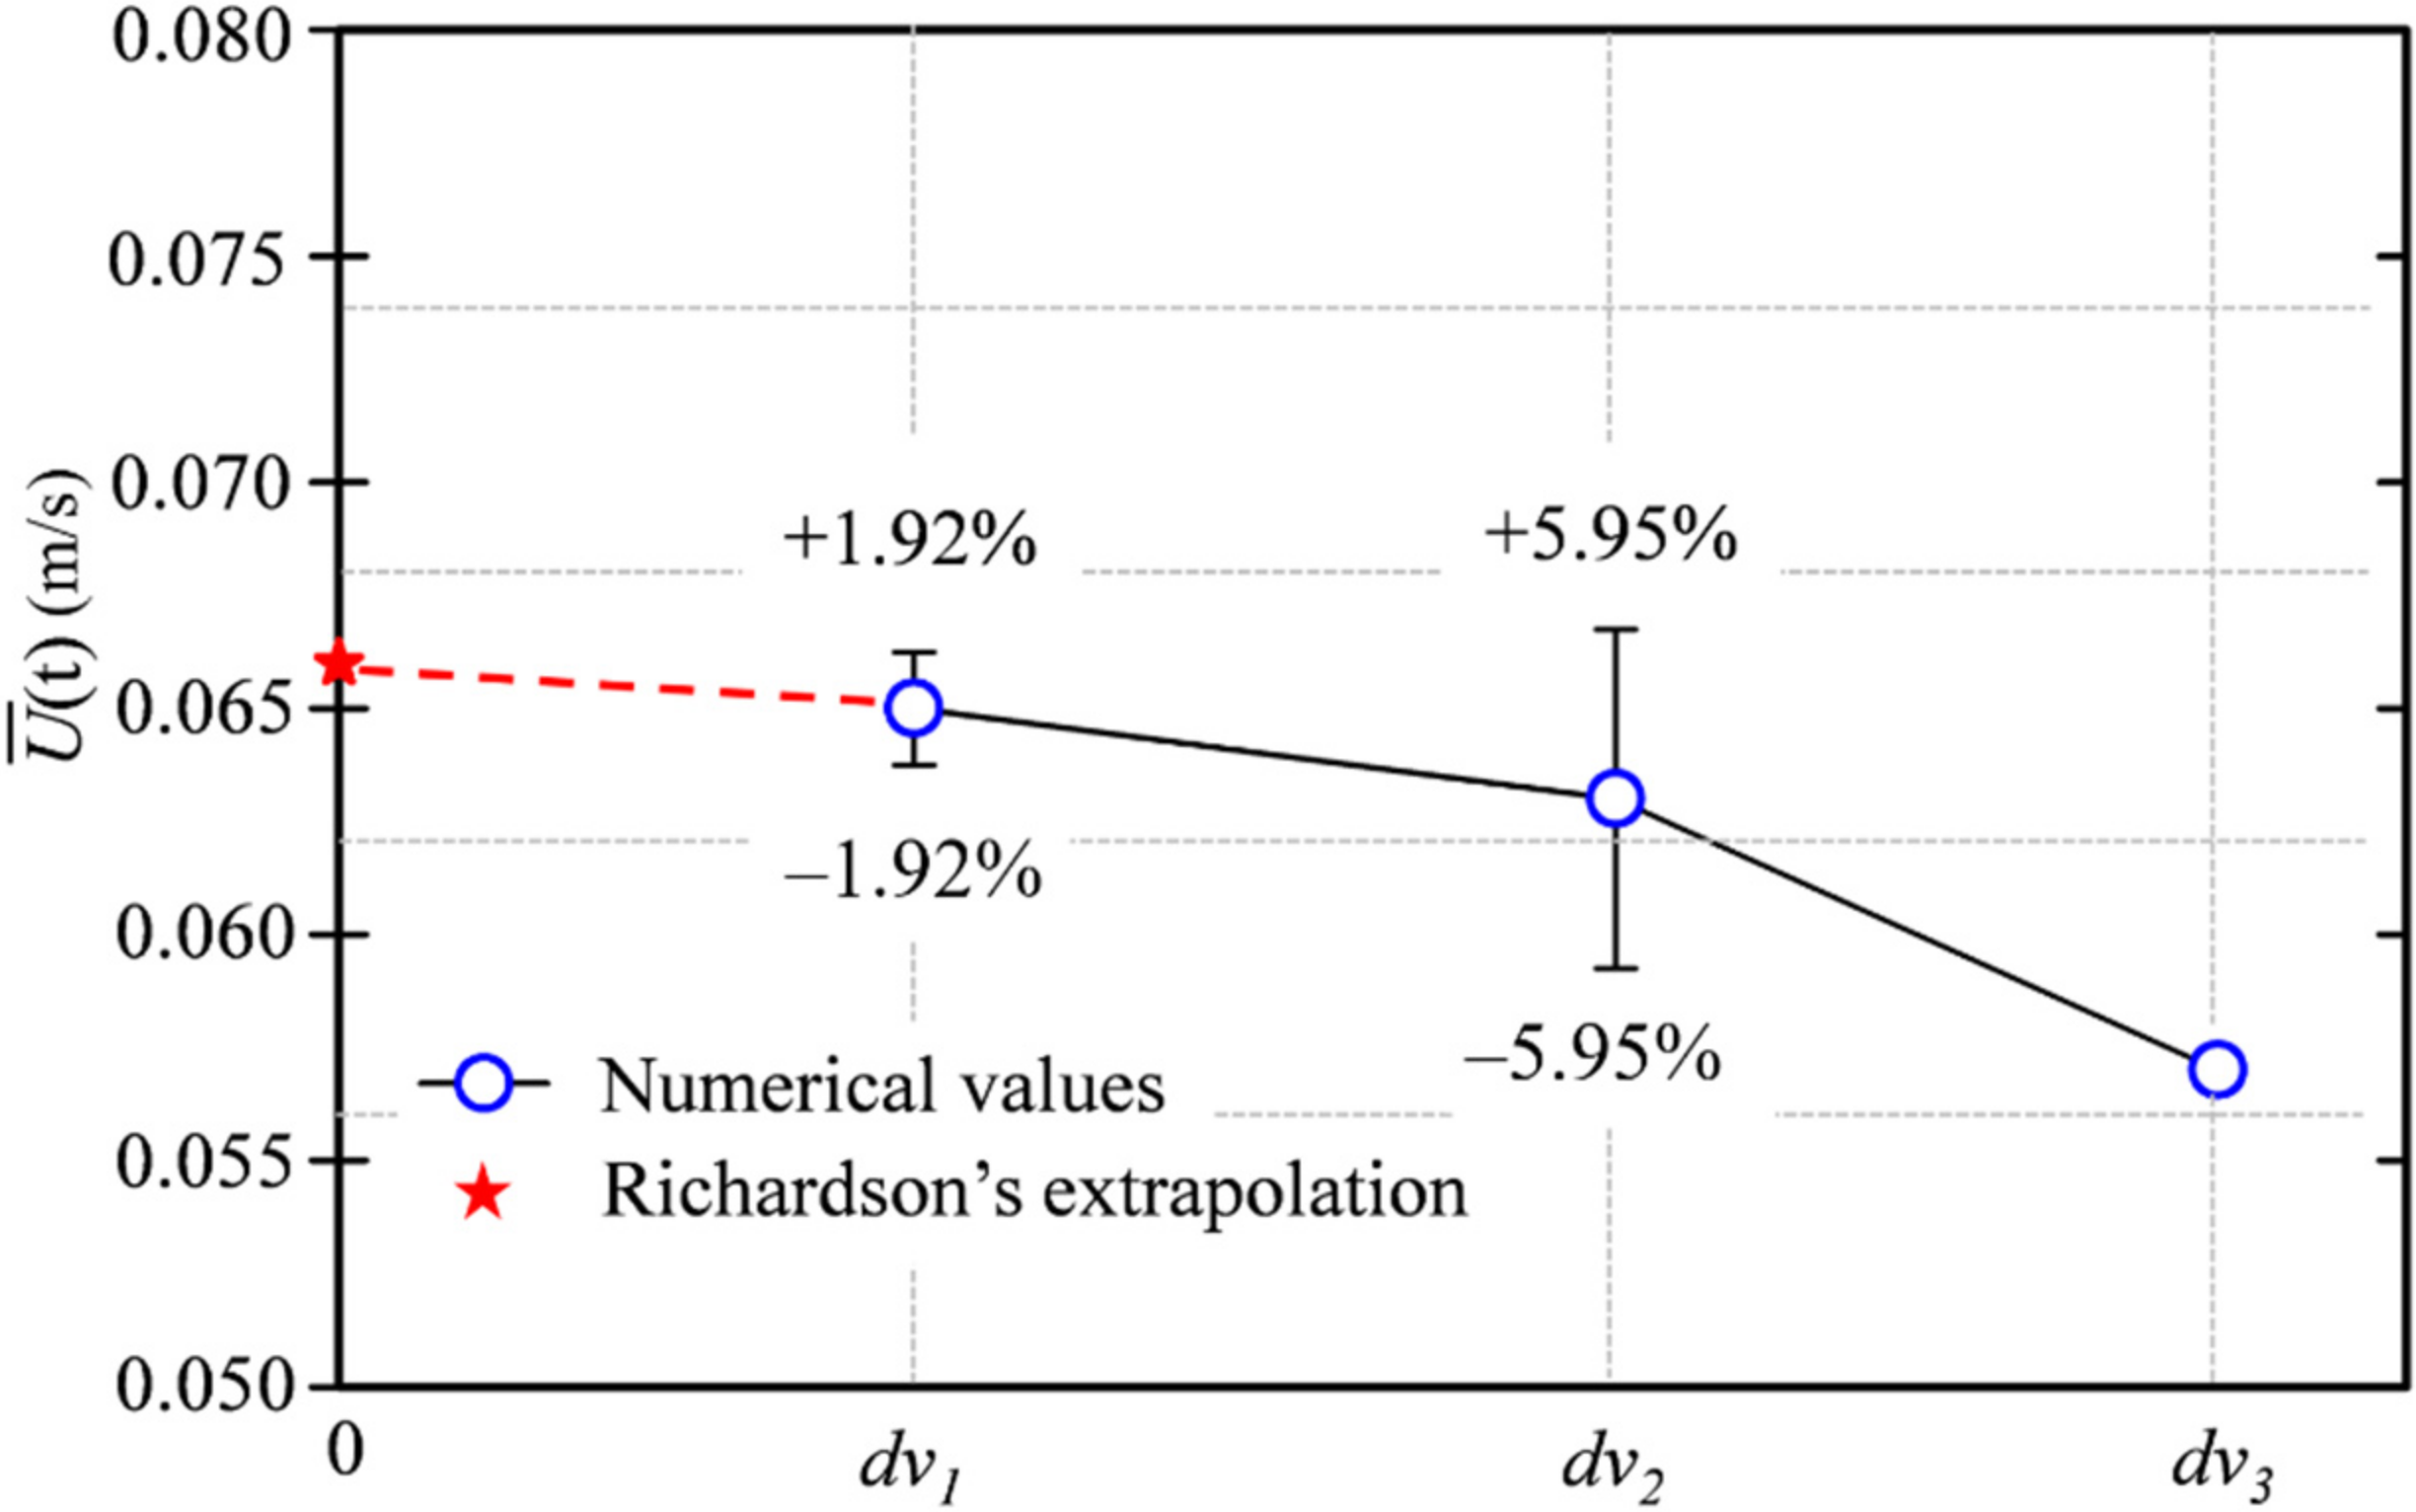
Figure 4 shows the variation in time-averaged magnitude velocity at different mesh refinement levels and that obtained from Richardson extrapolation (=0.066). The number of fine meshes for 670,000 cells was selected for evaluation. The uncertainty was ±1.92% for the whole domain, as shown in
Figure 4. The mesh convergence results are listed in
Table 1. The grid convergence index (GCI) was subject to a mesh refinement ratio r
i equal to
dvi/
dvi+1 because the volume across simulations was similar. If the index ratio GCI
3,2/(r
nGCI
2,1) converges close to one, the CFD results are within the asymptotic convergence range. We obtained an approximate ratio of 1.032, indicating mesh convergence; thus, a finer mesh was not required.
3.2. Proximal Neck Angulation and Blood Flow Velocity
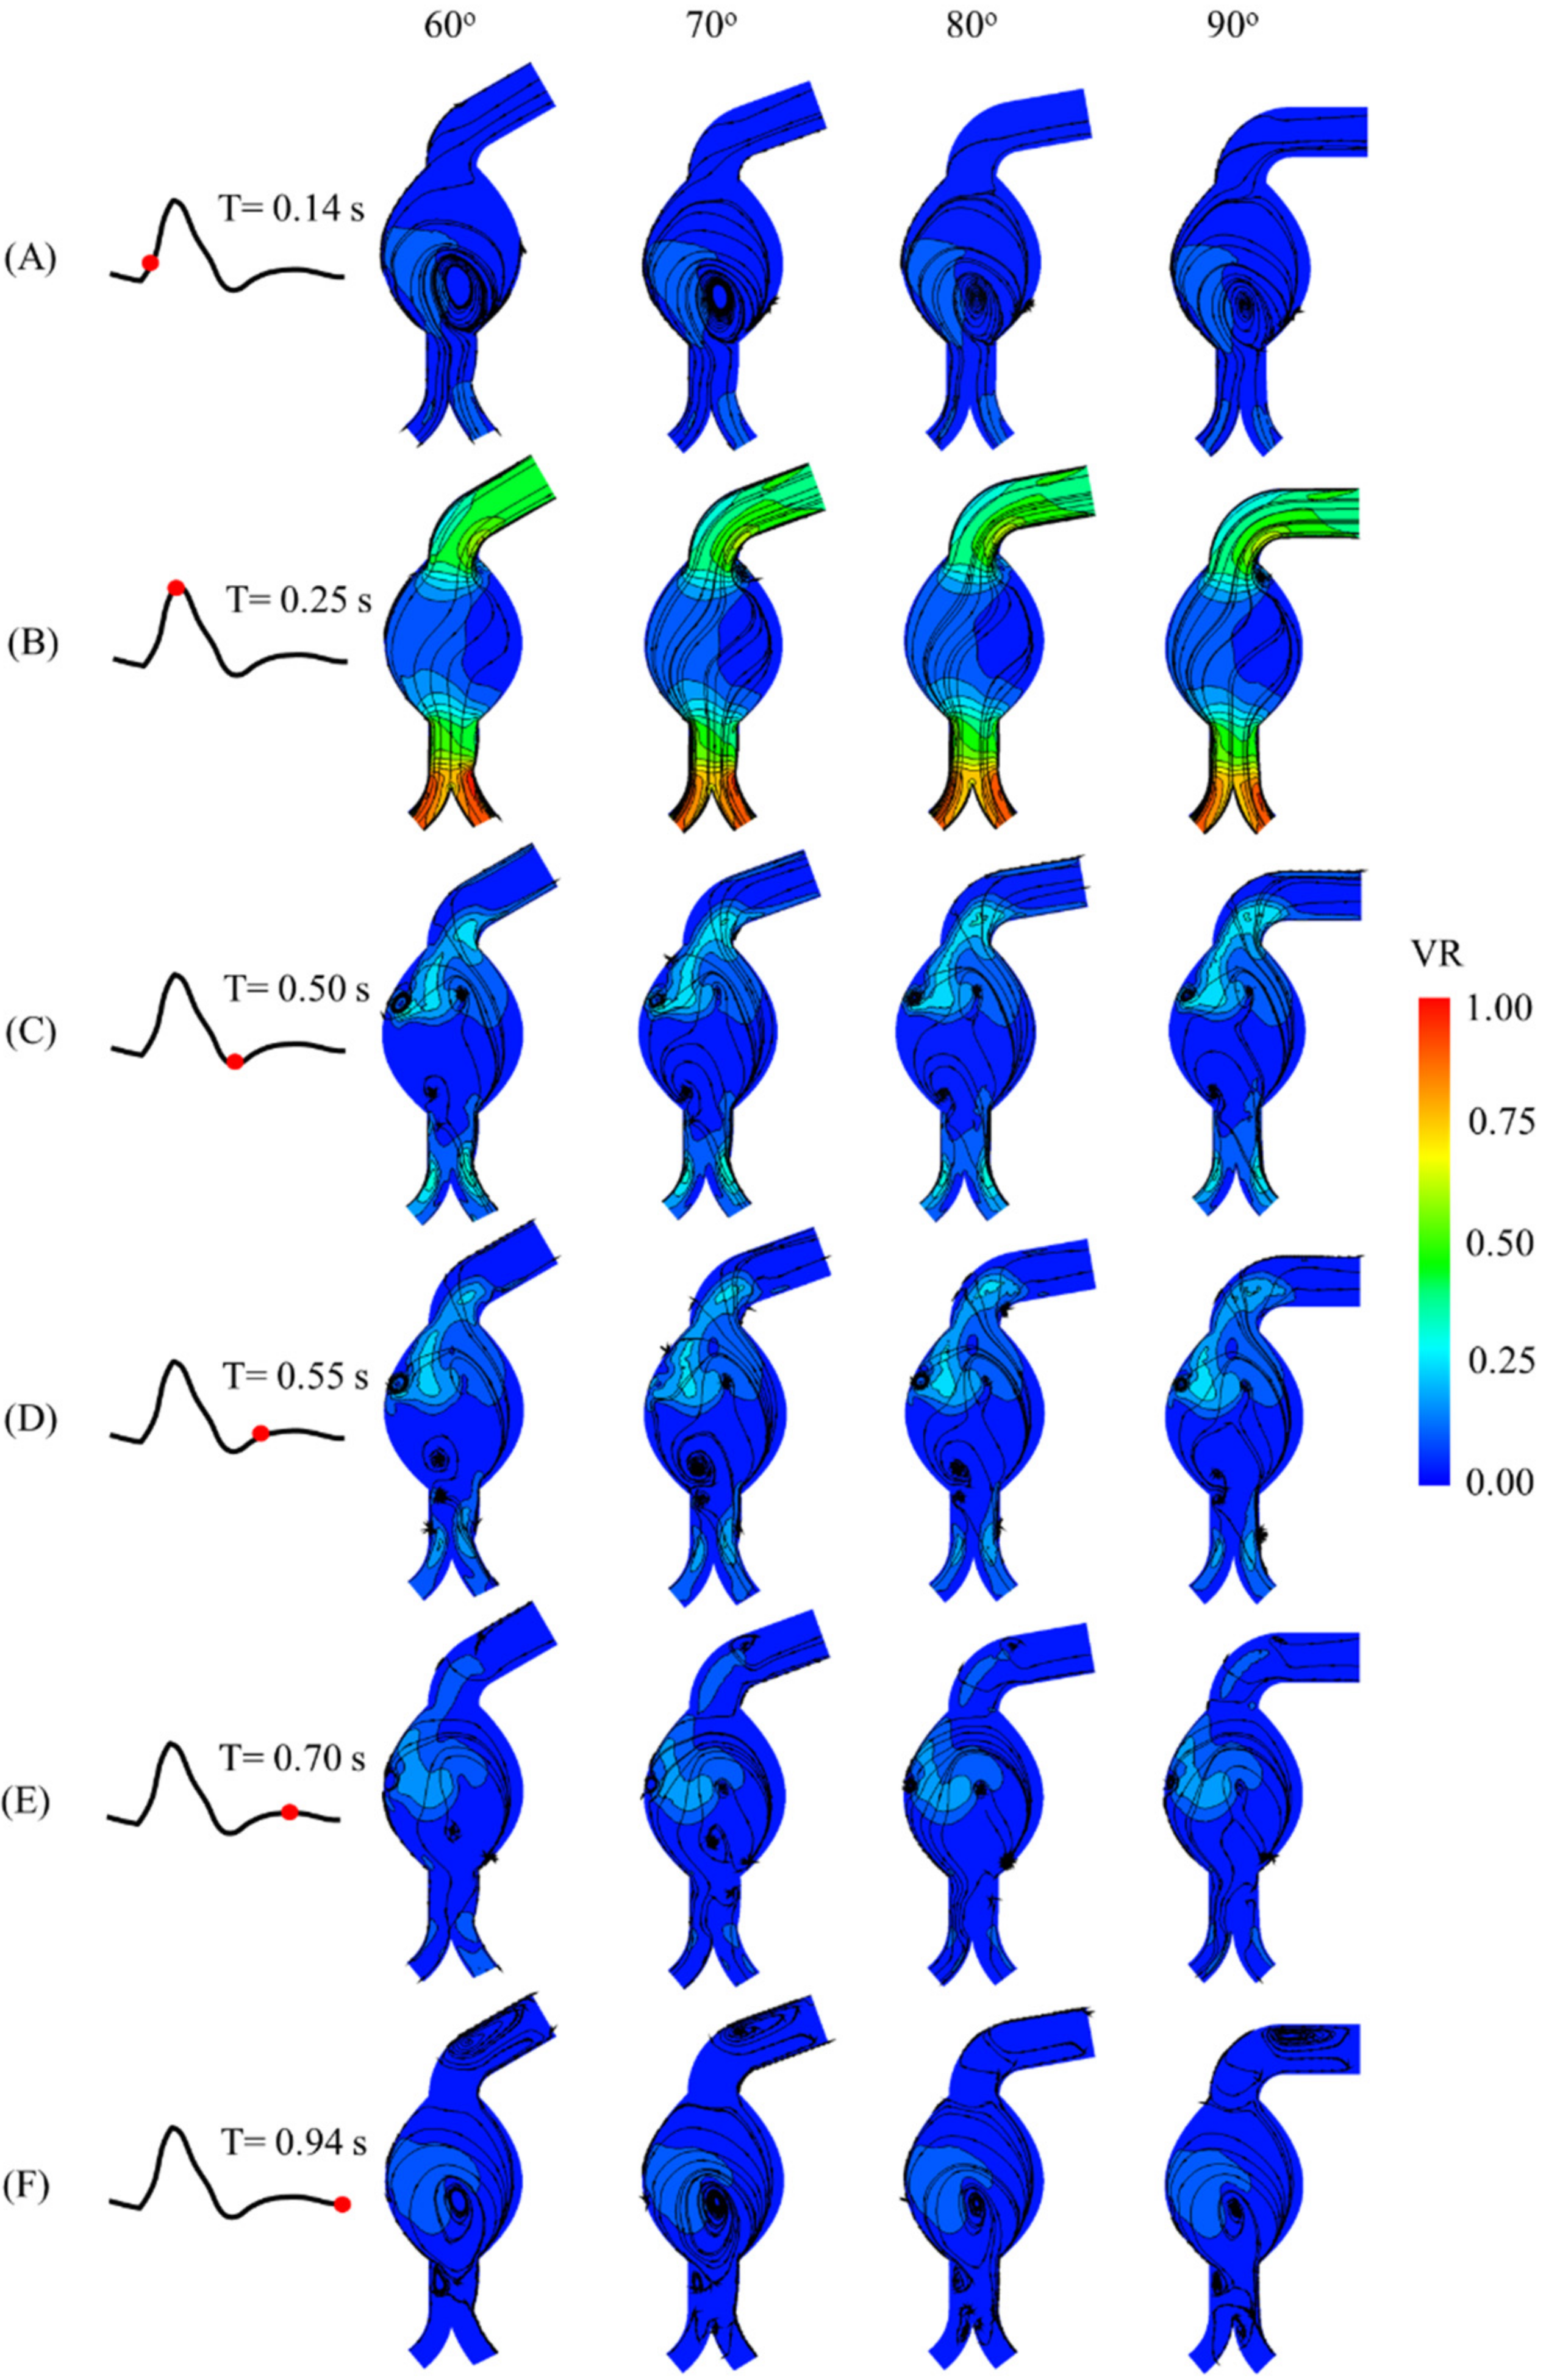
The velocity streamlines with contour plots at each instant, as well as neck angulation, are shown in
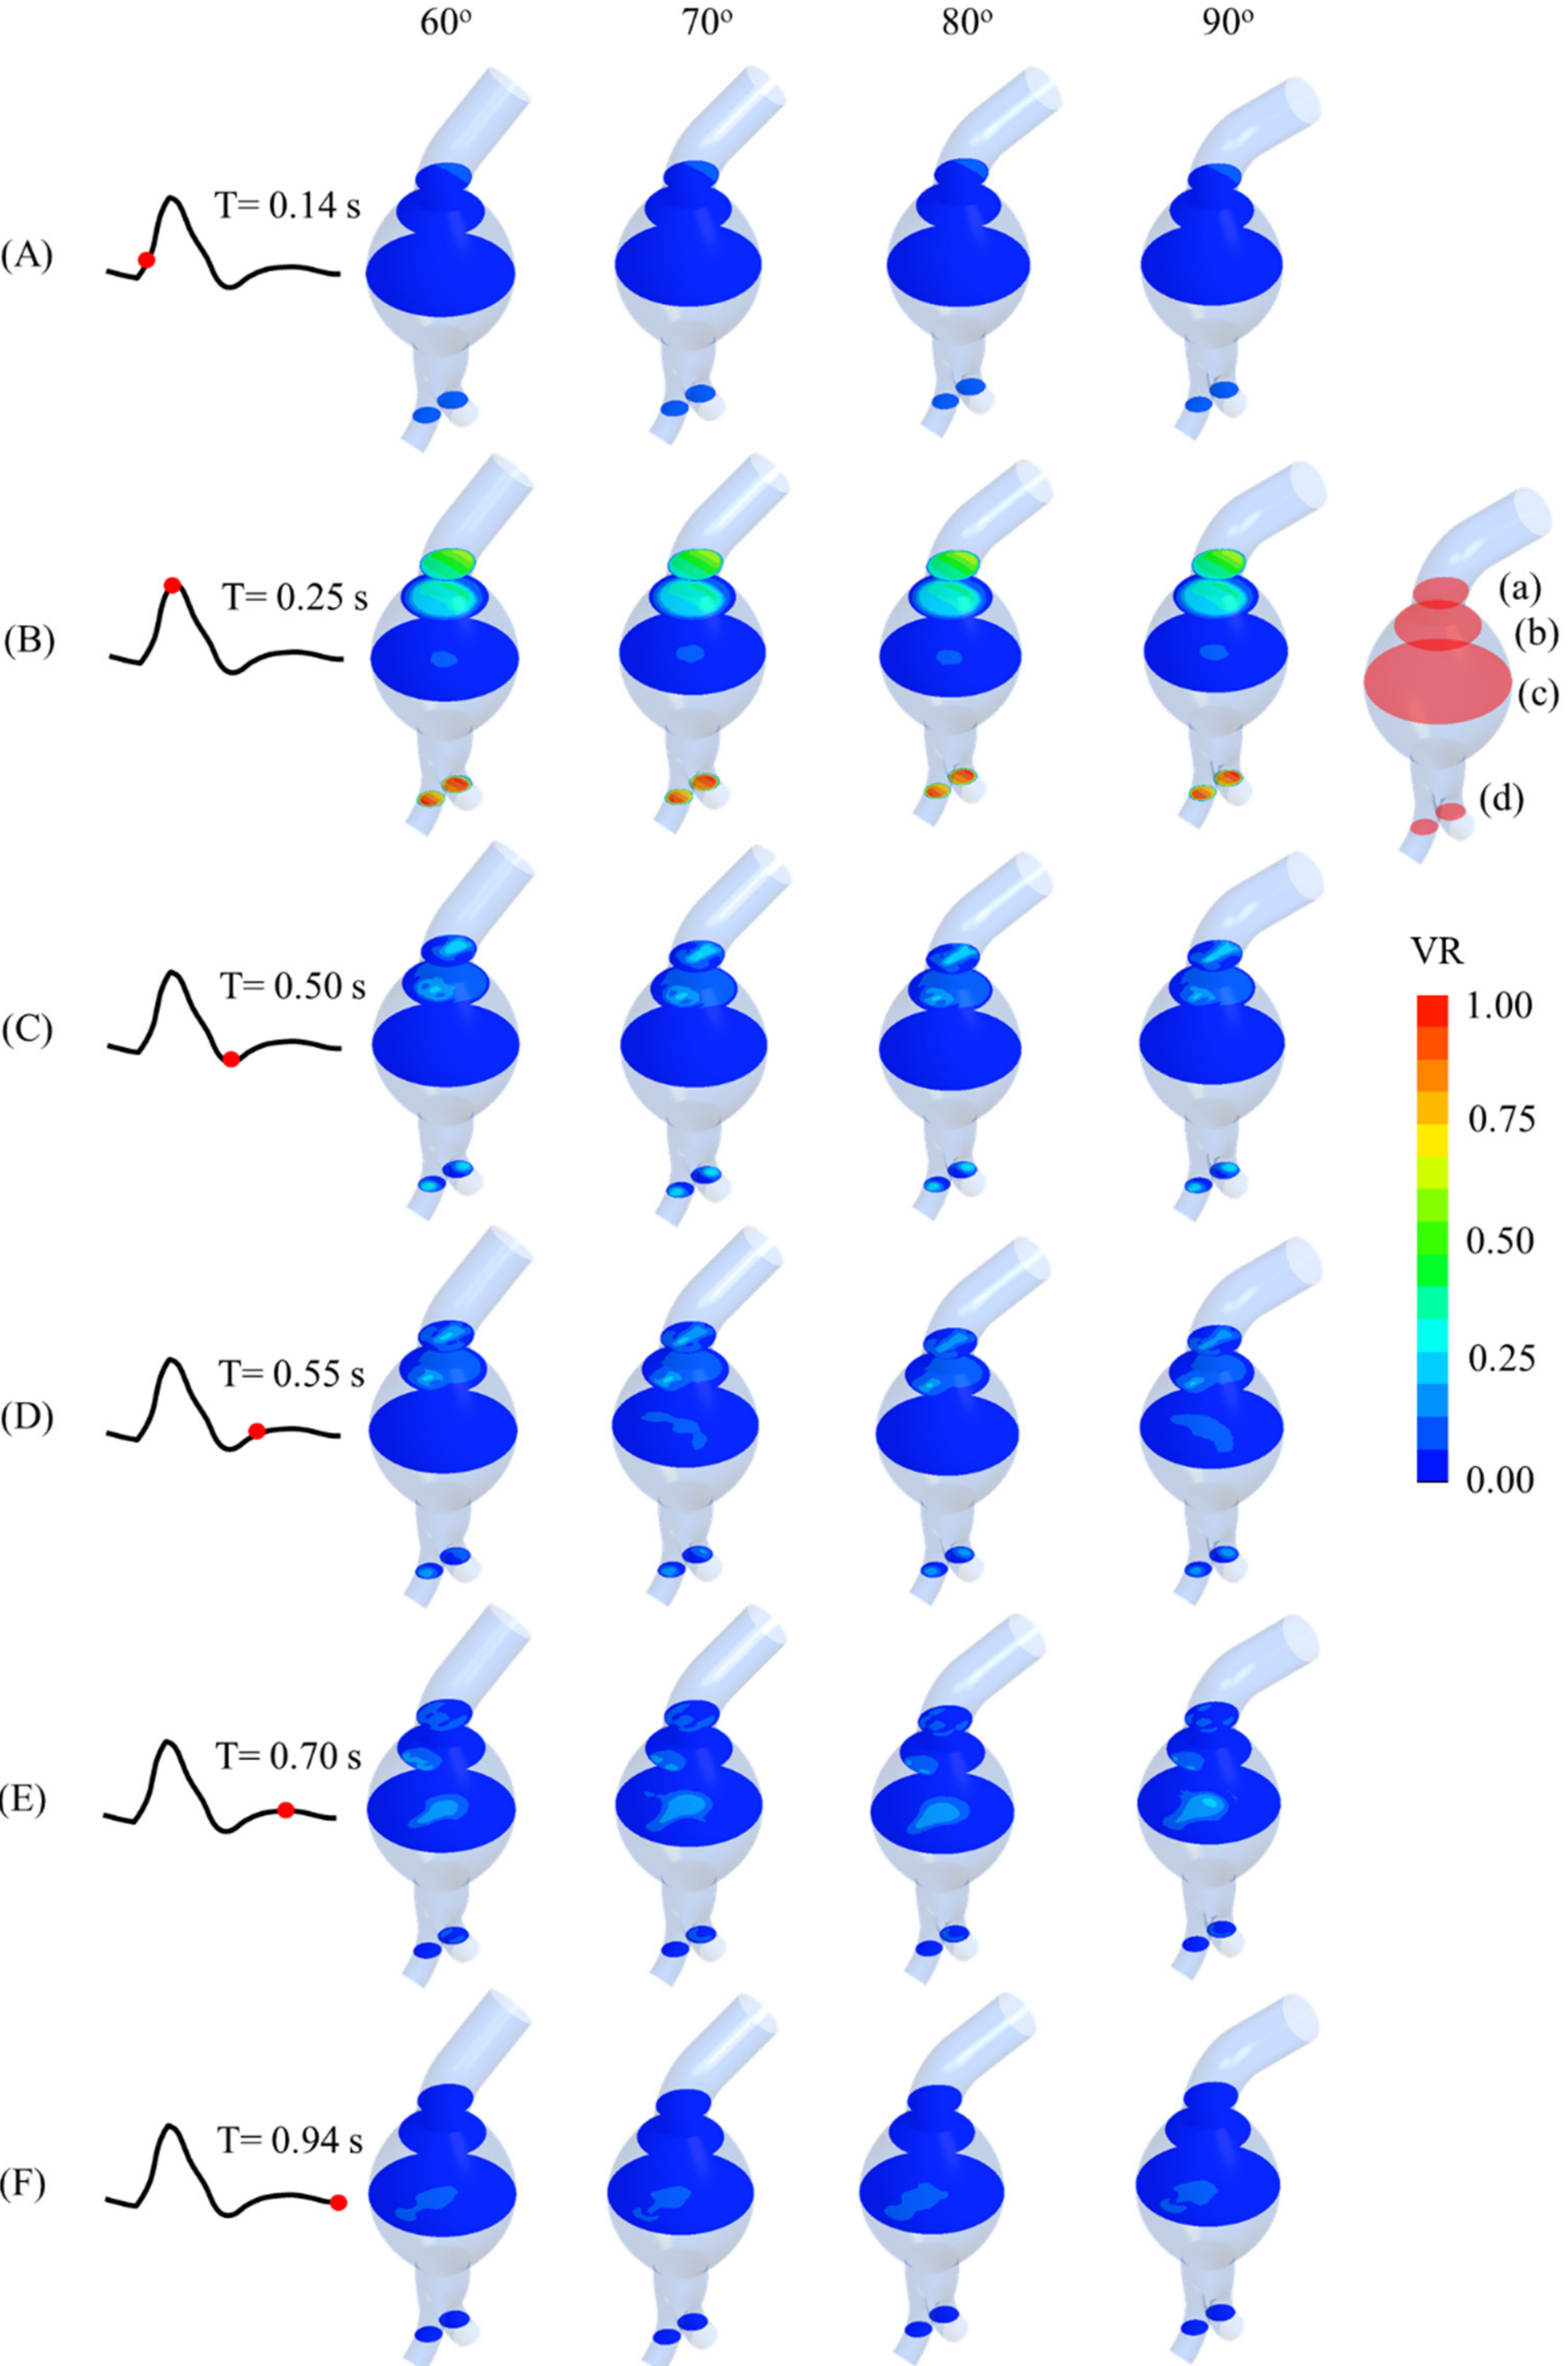
Figure 5. Recirculation occurred in the aneurysm sac, especially at the early systole and late diastole. Additionally, backflow to the angulated neck occurred during late systole and early diastole. The maximum velocity ratio was observed at the outlet of the iliac arteries at the peak systole. Four horizontal cross-sectional planes (a–d) are depicted in
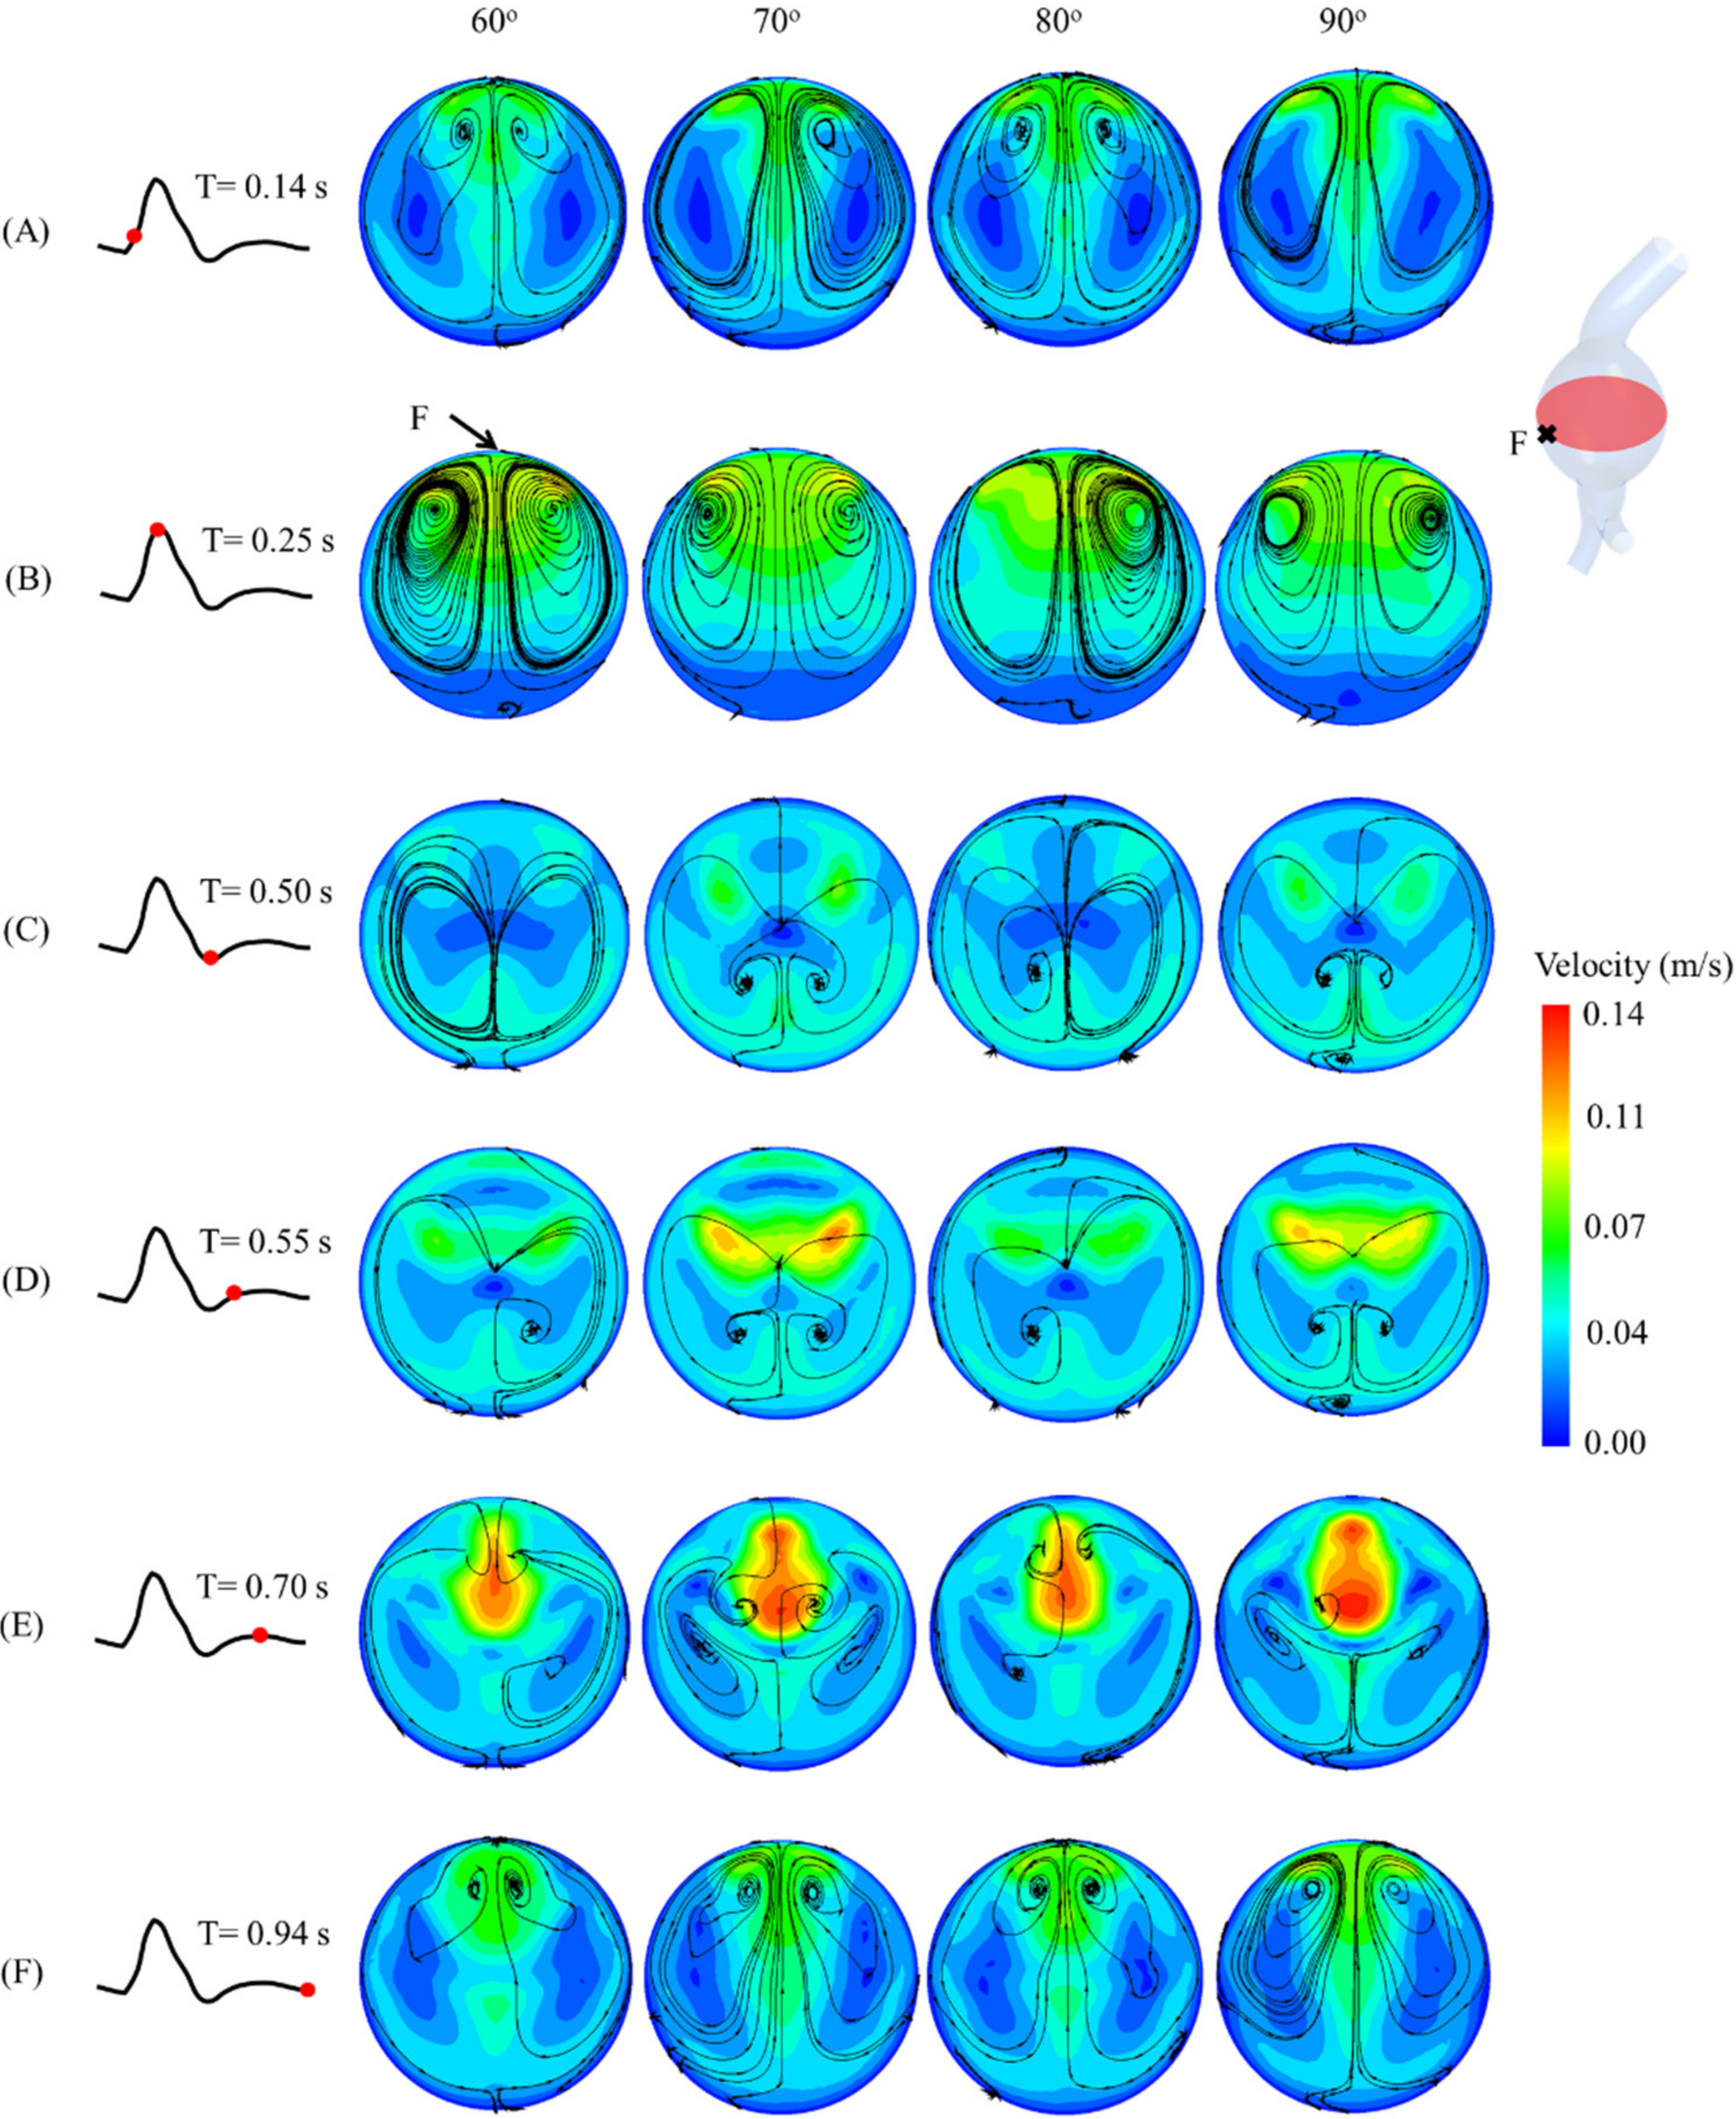
Figure 6, and the velocity substantially changed over time in those planes for all the angulated models. At T = 0.25 s, the flow velocity reached its maximum in plane d for all neck angulations. On the other hand, planes a, b, and c exhibited different velocity trends. The velocity fields in the cross-sectional plane of the mid-aneurysm sac for all the angulations are shown in
Figure 7. At T = 0.25 s, the maximum velocity and recirculation streamlines were evident next to point F for the four angulations.
3.3. Pressure Contour
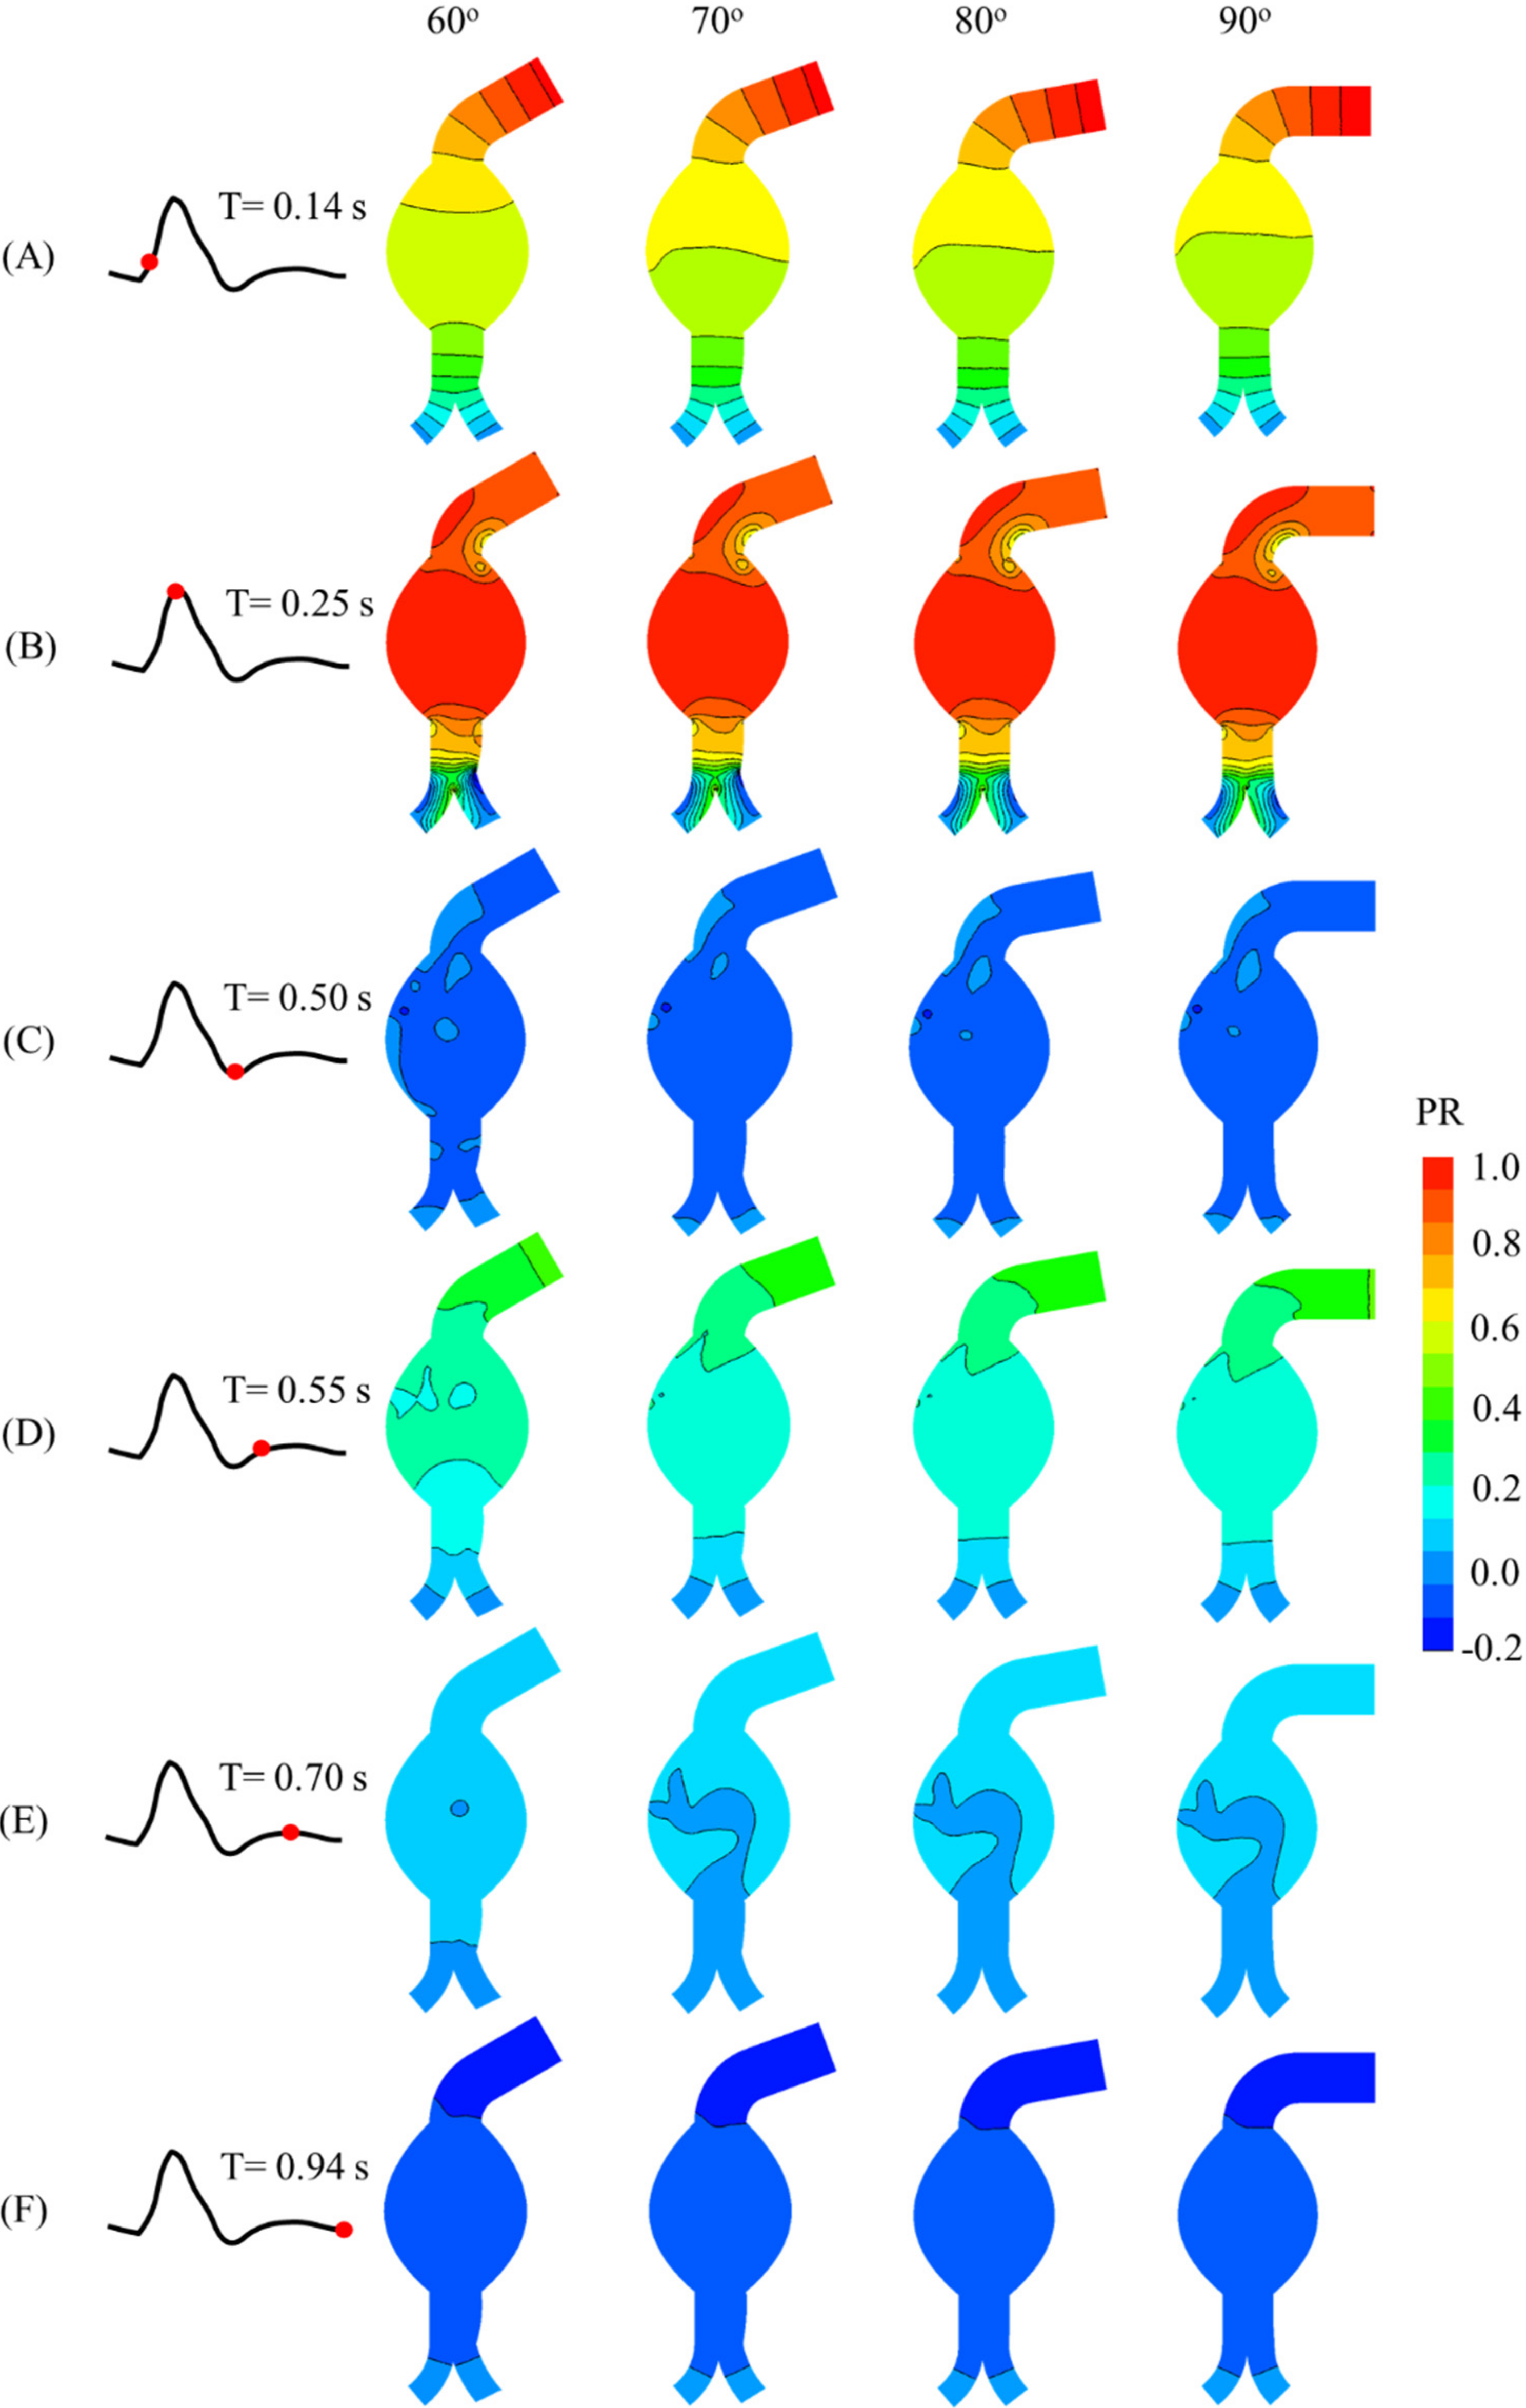
The pressure contours for each model are shown in
Figure 8. The highest pressure ratio was observed at the aneurysm sac and peak systole. The pressure then drastically reduced in the aneurysm sac at the late systole and late diastole. Notably, the angulation of the proximal neck did not significantly influence the pressure.
3.4. Wall Shear Stress (WSS)
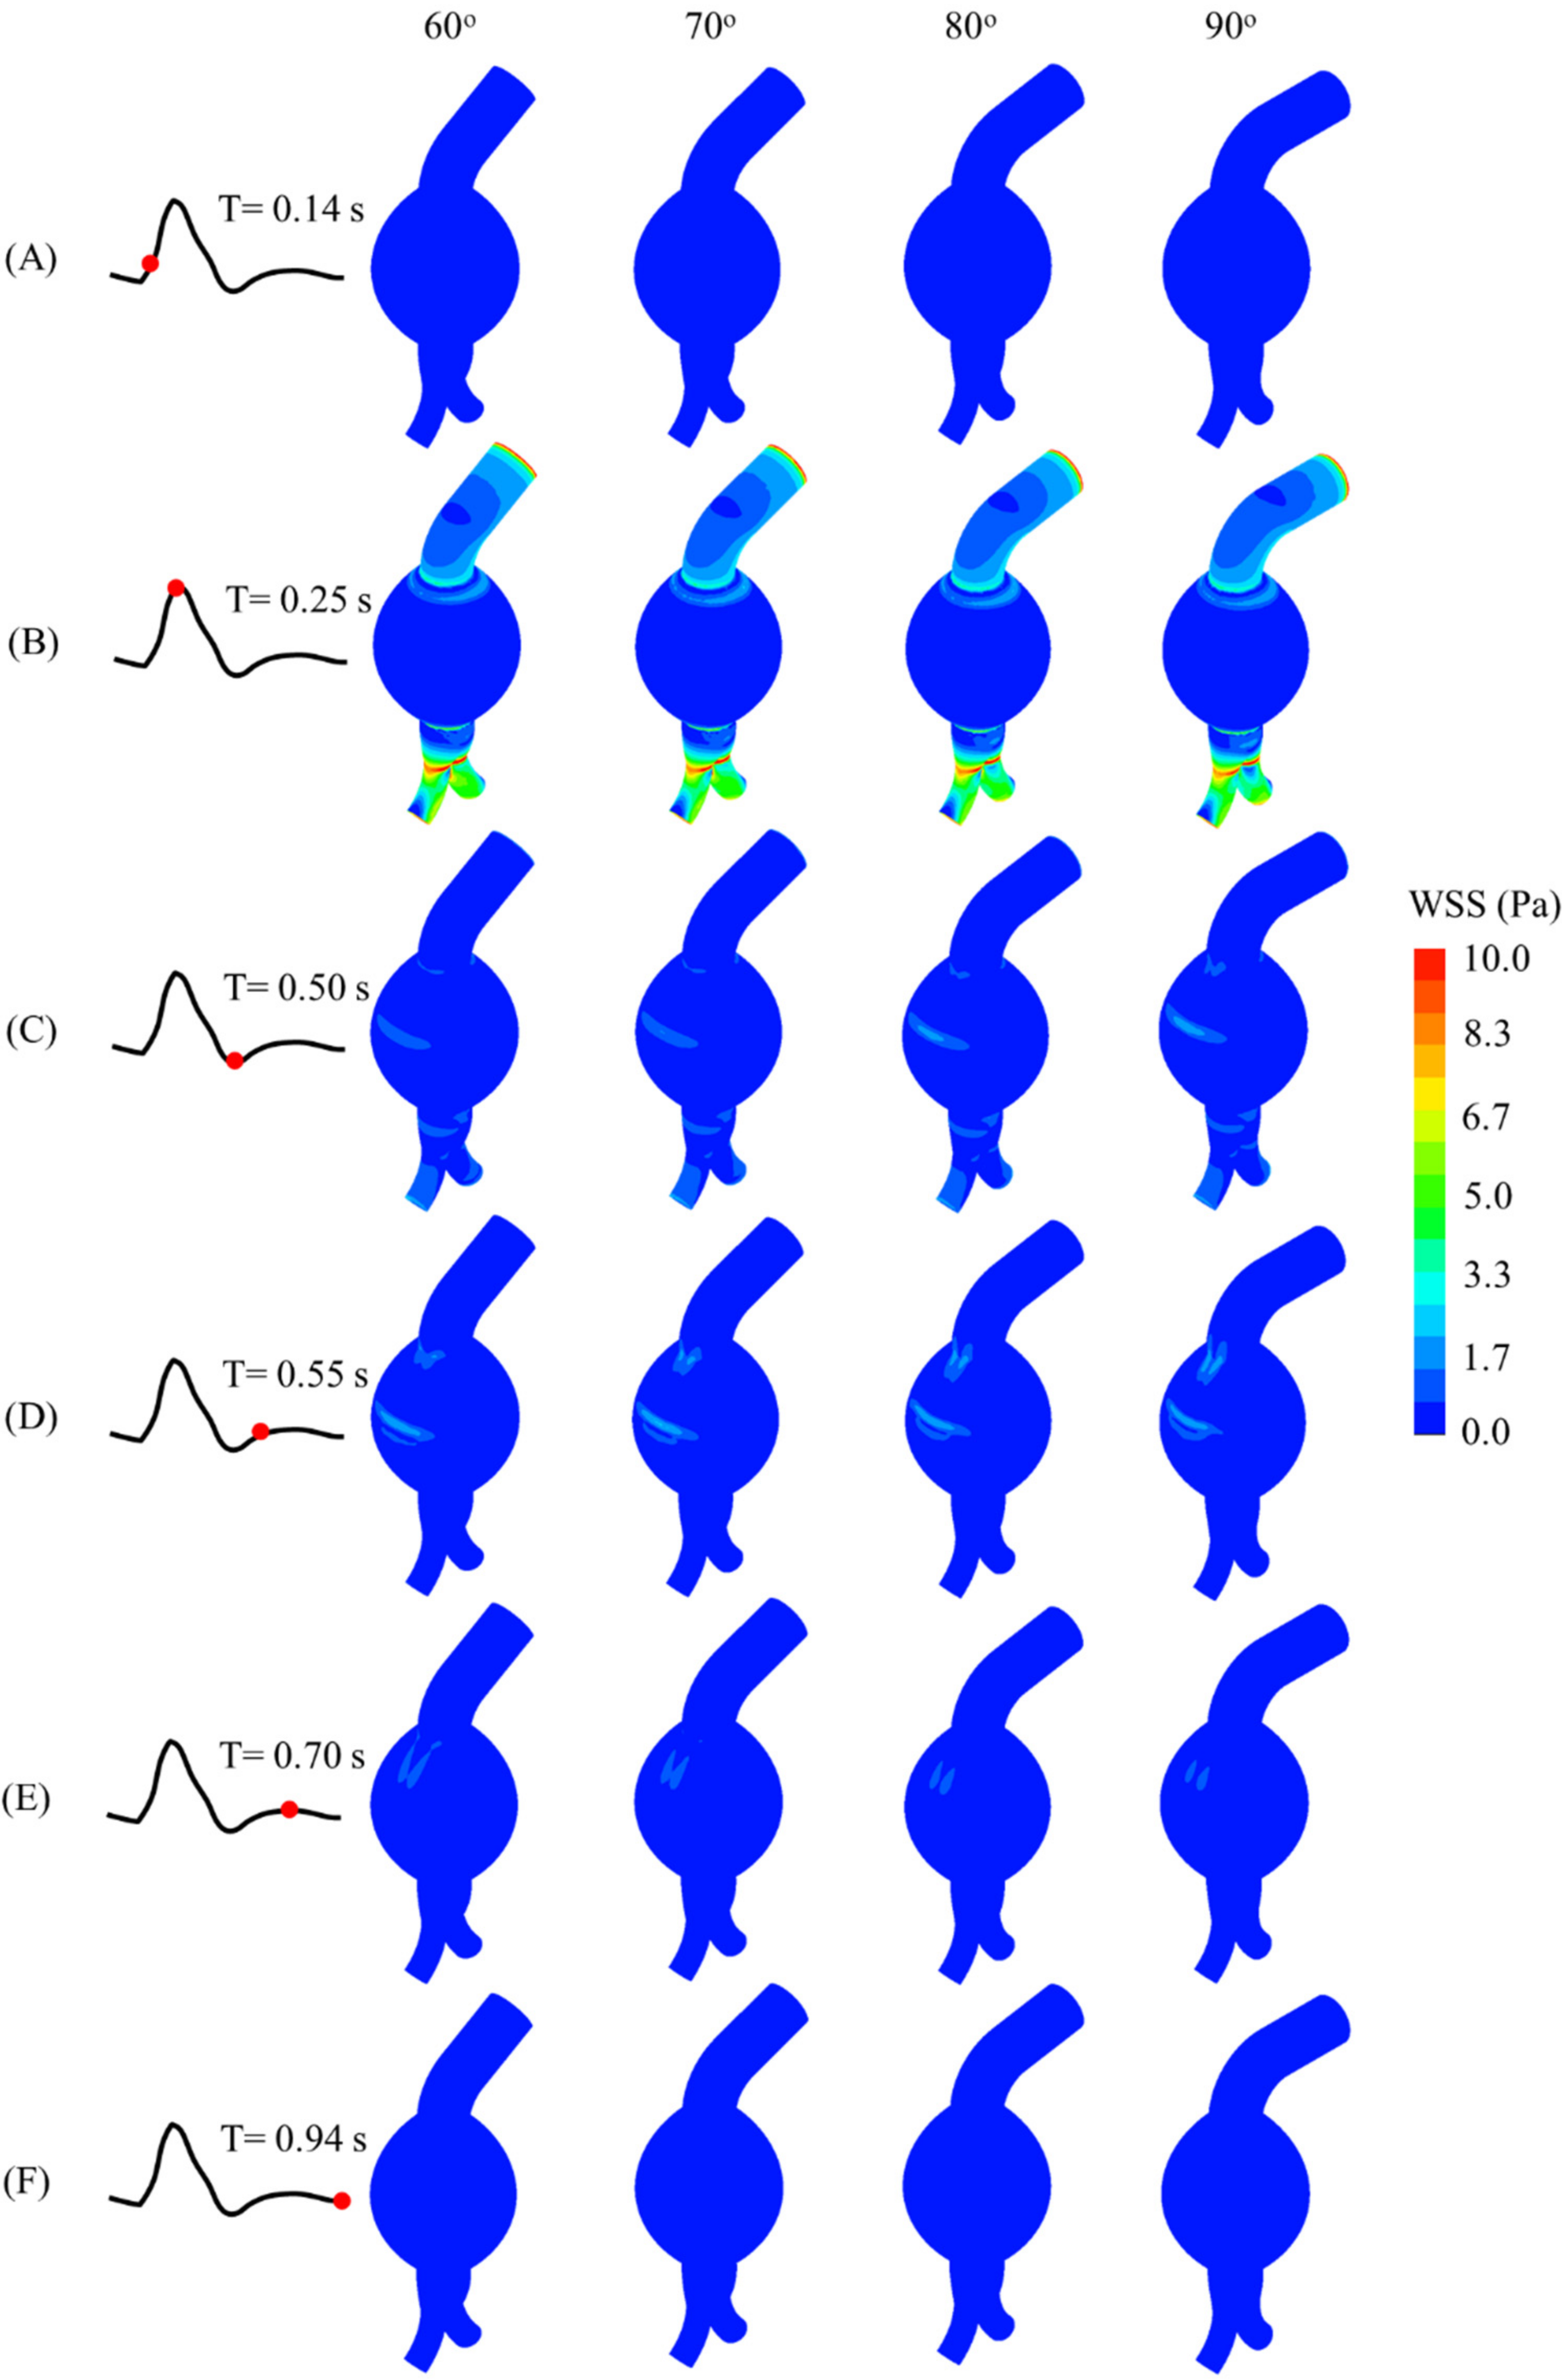
The WSS contours and values at different instants of the cardiac cycle for all models are shown in
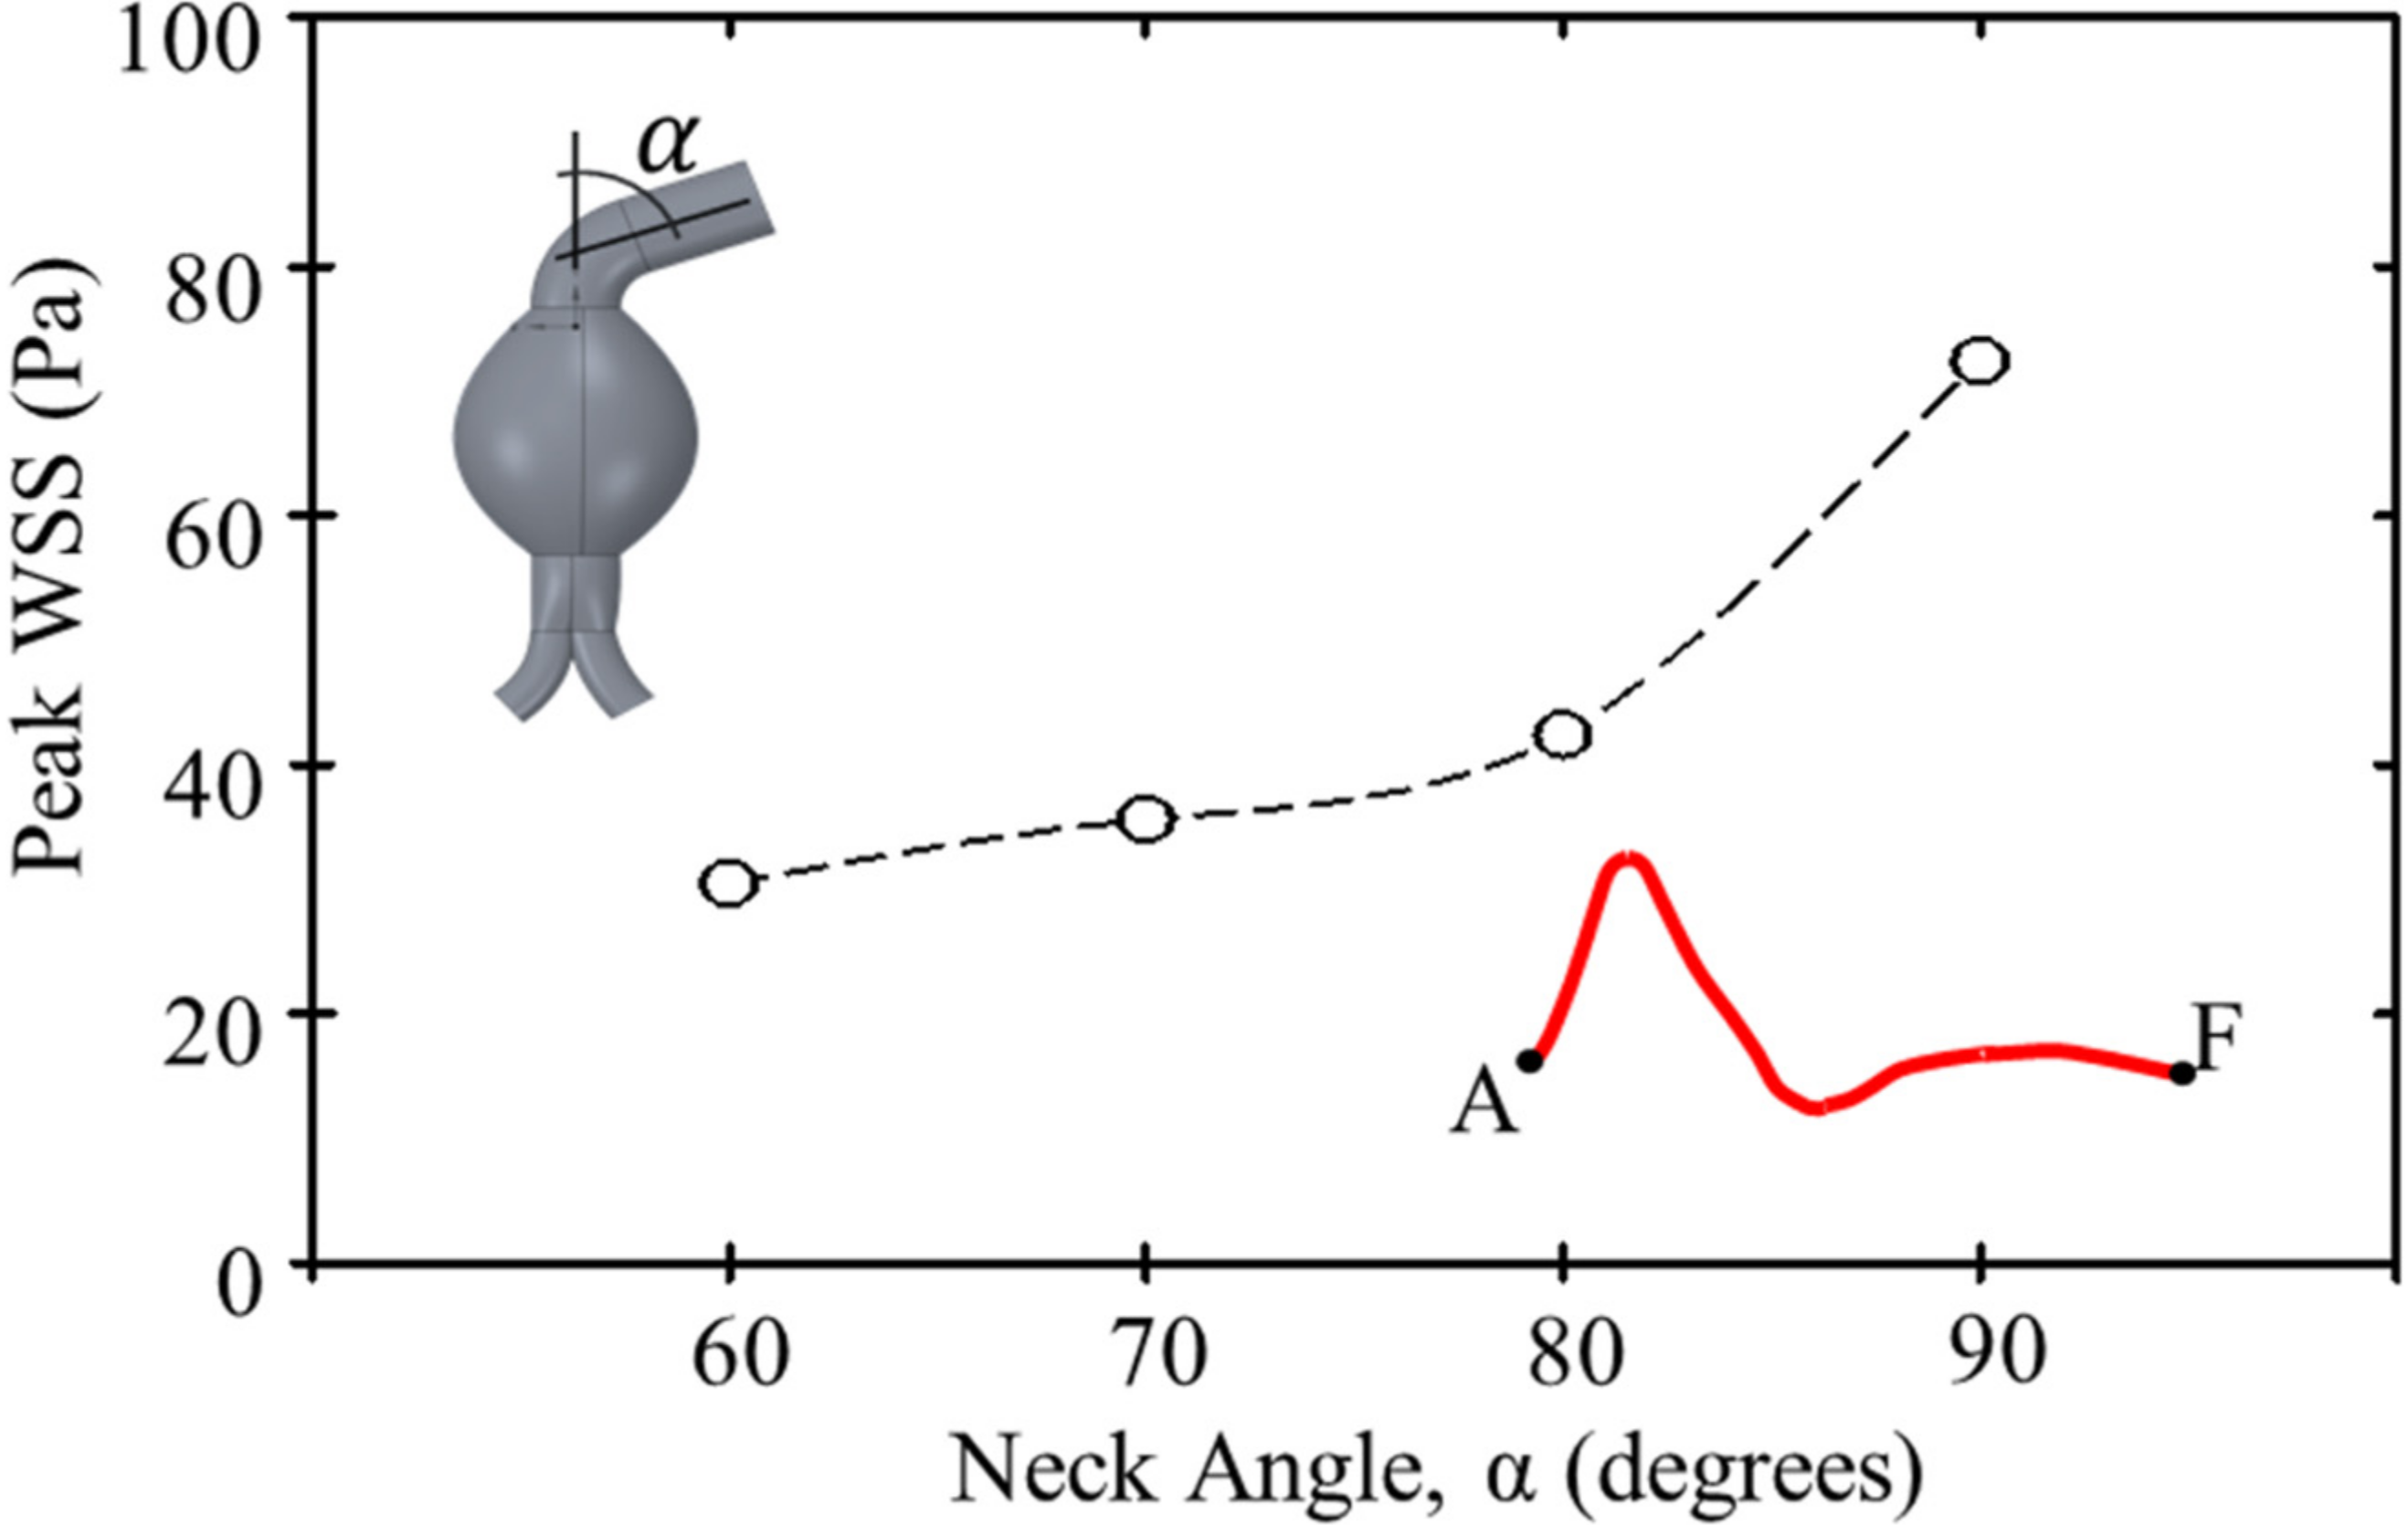
Figure 9. Due to the neck angulation, high WSS contours appeared at the neck and aneurysm sac joint at 0.25 s and the outer aneurysm wall of a curved artery at 0.55 s. The maximum WSS was high at the common iliac arteries. Moreover, the peak WSS increased with the proximal neck angulation (
Figure 10).
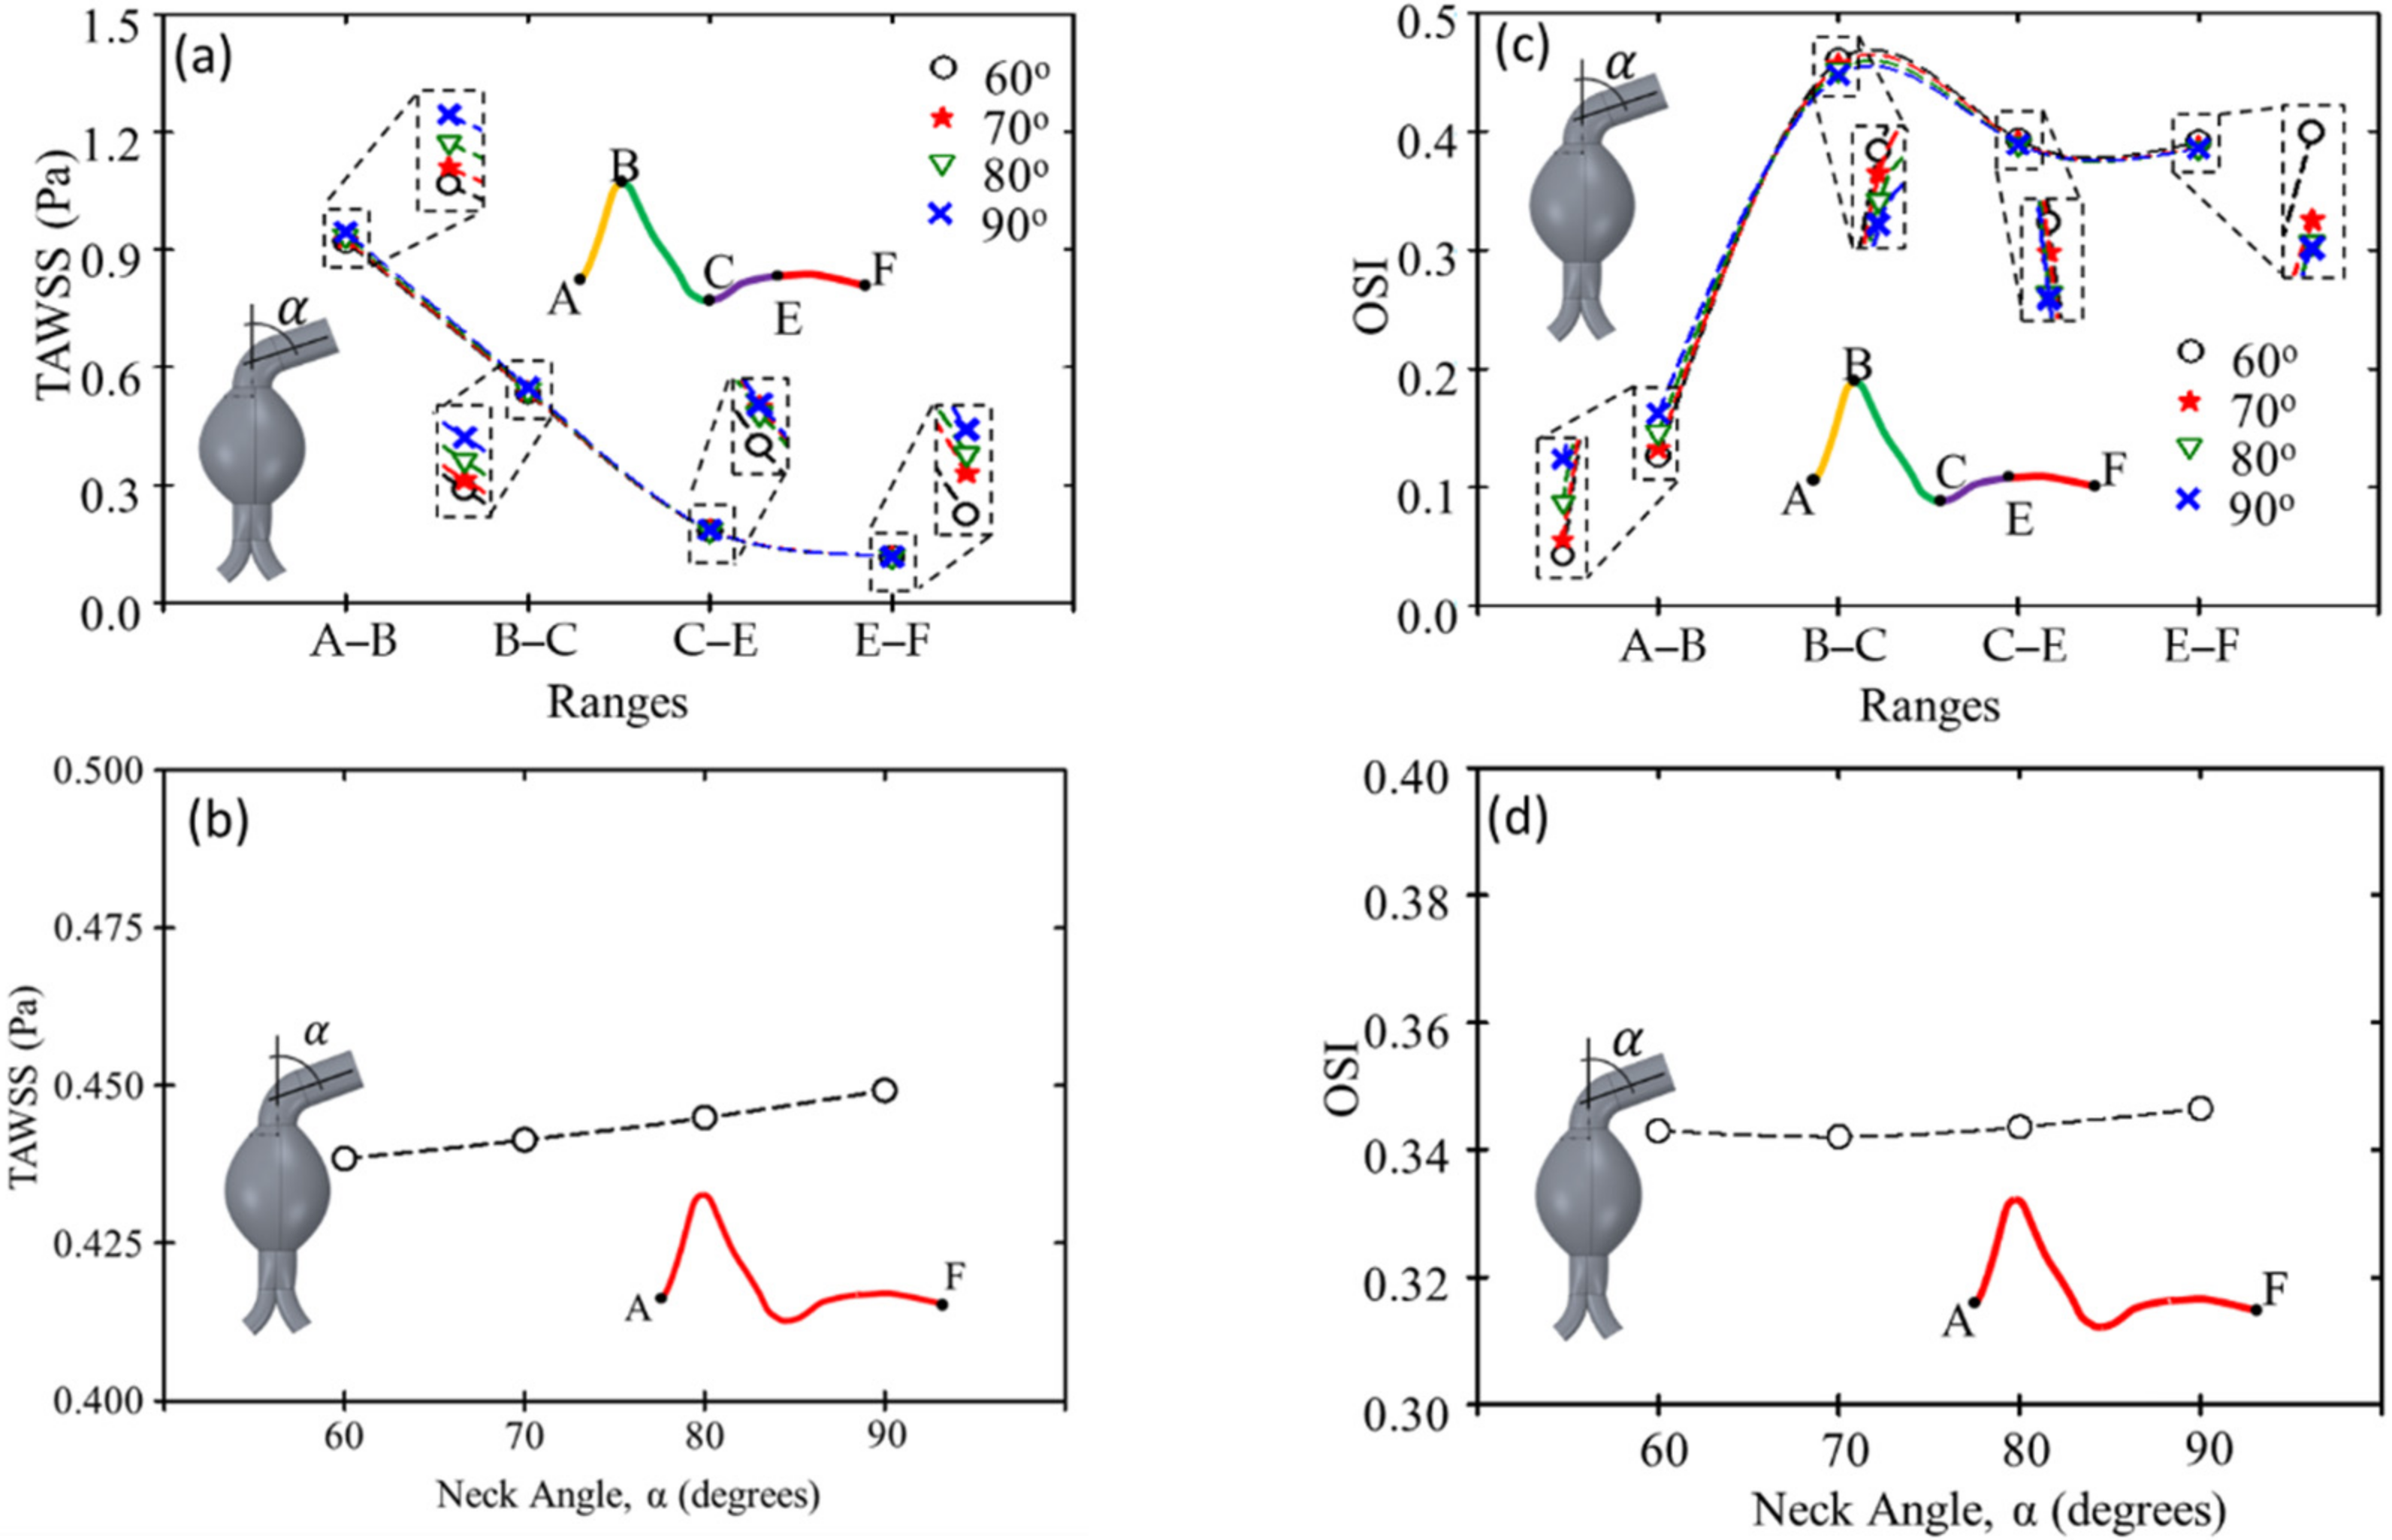
3.5. Time-Average Wall Shear Stress (TAWSS) and Oscillatory Shear Index (OSI)
The results of the TAWSS and OSI are shown in
Figure 11a–d, respectively. The TAWSS was highest from the early to the peak systole and lowest from the mid-to-the late diastole. During systole, the TAWSS increased with the increasing angulation of the proximal neck. In contrast, the OSI was lowest from the early to the peak systole and highest from the late systole to the mid-diastole. The 90° angulation of the proximal neck had the highest OSI from the early to peak systole, but it did not vary significantly in other periods.
4. Discussion
Instead of focusing on patient-specific model analysis, we aimed to evaluate different angulations in proximal AAA necks. Thus, an idealized geometry was used, and the AAA diameter providing an average repairing threshold with an average probability of rupture was used. Notably, the risk of adverse events was higher when the aortic neck angulation became severe (>60°) [
37]. The three-dimensional model of an idealized AAA was used to perform CFD simulations and visualize the effect of severe proximal neck angulation on the hemodynamic parameters, including flow velocity, pressure, and WSS distributions. In addition, CFD simulations of idealized AAA were performed to assess time-dependent hemodynamics. Furthermore, the analytical approach to a fully defined pulsatile velocity waveform was determined to better explain the predicted flow pattern in the abdominal aorta.
The influence of the proximal neck angulation on flow inside the aneurysm sac clearly shows complex recirculation and flow impingement, which alters blood flow patterns in both angulated and non-angulated proximal necks. In contrast, when the proximal neck is straight, blood flow inside the aneurysm sac is laminar, with a very small area of recirculation [
38]. We also evaluated the changes in hemodynamic parameters for four neck angulations of idealized AAA models. The simulation results indicate that increasing the proximal neck angulation increases recirculation in the aneurysm sac, especially at late systole and diastole. Xenos et al. used simple idealized angulated neck AAA models and found an inlet recirculation zone that is dominant during the diastole [
24]. Furthermore, they found that the vortex is retained during this phase.
We investigated the effect of proximal angulations for idealized AAA models on the blood flow and WSS for severe neck angles (>60°), which are scarce in the literature. Drewe et al. computationally demonstrated that peak WSS and TAWSS in the AAA sac increased for proximal neck angulation above 30° [
23]. Furthermore, the peak WSS at an inlet angle of 40° was higher than that at an inlet angle of 20° during the peak systole [
24]. This finding agrees with our results, which show that increasing the neck angulation leads to a higher WSS peak. Moreover, our results show that an angulated neck angle >60° induces flow turbulence and irregularity in blood flow streamlines. This can change the WSS and its distribution, potentially weakening the artery wall [
16,
26]. However, previous studies report inconsistent findings on the thrombus deposition and WSS and OSI sites that induce a high risk of rupture [
39].
Our study has several limitations, including the simplifying assumptions of the AAA geometry and other parameters. Specifically, we neglected intricate blood vessels and small branches. In addition, a laminar model with a second-order implicit method for transient formulations was developed for the cardiac cycle (i.e., systole and diastole). The aortic wall was also assumed to be rigid, potentially underestimating the wall stress in CFD simulations. Moreover, the outlet boundary condition was set to zero-gauge pressure, which can be increased by applying the outflow pressure boundary condition. We also assumed blood to be a Newtonian fluid with a specific hematocrit value, which may be unrealistic for various disease conditions. Finally, the iliac bifurcation angle was neglected as a complement to the proximal neck angulation in the study of hemodynamic changes using the AAA model.
5. Conclusions
We analyzed flow patterns and their effect on WSS at AAA walls through CFD simulations of incompressible, Newtonian, and transient blood flow in three-dimensional rigid models with different proximal neck angulations. The simulation results demonstrate that the angulations of the aortic neck describe the downstream blood flow, influencing flow turbulence and recirculation in the aneurysm sac. This can weaken the aortic wall and form high and low WSS regions. In addition, the velocity increases, and the flow pattern changes when the proximal neck angulation increases, especially at the peak systole and from the early diastole to the mid-diastole. AAA collapse is complicated, being dependent on factors such as maximal diameter, internal asymmetry pressure, wall stresses, intraluminal thrombus, saccular index, and tortuosity. We demonstrated through CFD simulations that the severity of proximal neck angulation affects hemodynamics. In the future, we plan to simulate the vascular intervention using an idealized AAA model as a preliminary visualization of intervention results.
Author Contributions
Y.A.A., N.K., C.N. and S.C.; conceptualization, N.K. and Y.A.A.; methodology, N.K. and T.A.; visualization, Y.A.A. and N.K.; formal analysis, Y.A.A., N.K. and T.A.; writing—original draft preparation, C.N. and S.C.; supervision, C.N. and S.C.; writing—review and editing, S.C.; funding acquisition. All authors have read and agreed to the published version of the manuscript.
Funding
This research received a specific grant from Health Systems Research Institute, Thailand [HSRI 63-147].
Institutional Review Board Statement
Not applicable.
Informed Consent Statement
Not applicable.
Data Availability Statement
Not applicable.
Acknowledgments
We would like to thank Sorracha Rookkapan for his advice on the AAA model generation.
Conflicts of Interest
The authors declare no conflict of interest.
References
- Dua, M.M.; Dalman, R.L. Hemodynamic Influences on abdominal aortic aneurysm disease: Application of biomechanics to aneurysm pathophysiology. Vascul. Pharmacol. 2010, 53, 11–21. [Google Scholar] [CrossRef] [Green Version]
- Joly, F.; Soulez, G.; Garcia, D.; Lessard, S.; Kauffmann, C. Flow stagnation volume and abdominal aortic aneurysm growth: Insights from patient-specific computational flow dynamics of Lagrangian-coherent structures. Comput. Biol. Med. 2018, 92, 98–109. [Google Scholar] [CrossRef] [PubMed]
- McGloughlin, T.M. (Ed.) Biomechanics and Mechanobiology of Aneurysms; Studies in Mechanobiology, Tissue Engineering and Biomaterials; Springer: Berlin/Heidelberg, Germany, 2011; Volume 7, ISBN 978-3-642-18094-1. [Google Scholar]
- Lindquist Liljeqvist, M.; Hultgren, R.; Siika, A.; Gasser, T.C.; Roy, J. Gender, smoking, body size, and aneurysm geometry influence the biomechanical rupture risk of abdominal aortic aneurysms as estimated by finite element analysis. J. Vasc. Surg. 2017, 65, 1014–1021.e4. [Google Scholar] [CrossRef] [PubMed] [Green Version]
- Olsson, C.; Thelin, S.; Ståhle, E.; Ekbom, A.; Granath, F. Thoracic aortic aneurysm and dissection: Increasing prevalence and improved outcomes reported in a nationwide population-based study of more than 14,000 cases from 1987 to 2002. Circulation 2006, 114, 2611–2618. [Google Scholar] [CrossRef] [PubMed] [Green Version]
- Elefteriades, J.A.; Farkas, E.A. Thoracic Aortic Aneurysm. Clinically Pertinent Controversies and Uncertainties. J. Am. Coll. Cardiol. 2010, 55, 841–857. [Google Scholar] [CrossRef] [PubMed]
- Li, Z.; Kleinstreuer, C. A comparison between different asymmetric abdominal aortic aneurysm morphologies employing computational fluid-structure interaction analysis. Eur. J. Mech. B/Fluids 2007, 26, 615–631. [Google Scholar] [CrossRef]
- Muluk, S.L.; Muluk, P.D.; Shum, J.; Finol, E.A. On the Use of Geometric Modeling to Predict Aortic Aneurysm Rupture. Ann. Vasc. Surg. 2017, 44, 190–196. [Google Scholar] [CrossRef]
- Sun, Z.; Mwipatayi, B.P.; Semmens, J.B.; Lawrence-Brown, M.M.D. Short to Midterm Outcomes of Fenestrated Endovascular Grafts in the Treatment of Abdominal Aortic Aneurysms: A Systematic Review. J. Endovasc. Ther. 2006, 13, 747–753. [Google Scholar] [CrossRef]
- Verhagen, H.J.M.; Torsello, G.; De Vries, J.P.P.M.; Cuypers, P.H.; Van Herwaarden, J.A.; Florek, H.J.; Scheinert, D.; Eckstein, H.H.; Moll, F.L. Endurant stent-graft system: Preliminary report on an innovative treatment for challenging abdominal aortic aneurysm. J. Cardiovasc. Surg. 2009, 50, 153–158. [Google Scholar]
- Zipfel, B.; Buz, S.; Düsterhöft, V.; Hetzer, R. Initial Experience with Abdominal Aneurysm Repair Using the E-vita Abdominal Stent-Graft: A Single-Center Study. J. Endovasc. Ther. 2009, 16, 577–589. [Google Scholar] [CrossRef]
- Georgiadis, G.S.; Trellopoulos, G.; Antoniou, G.A.; Gallis, K.; Nikolopoulos, E.S.; Kapoulas, K.C.; Pitta, X.; Lazarides, M.K. Early results of the Endurant endograft system in patients with friendly and hostile infrarenal abdominal aortic aneurysm anatomy. J. Vasc. Surg. 2011, 54, 616–627. [Google Scholar] [CrossRef] [PubMed] [Green Version]
- Metzger, P.B.; Novero, E.R.; Rossi, F.H.; Moreira, S.M.; Barbato, H.A.; Izukawa, N.M.; de Marco, V.L.A.; Cano, M.N.; Kambara, A.M. Endovascular Treatment of Abdominal Aortic Aneurysms with Complex Anatomy: Preliminary Results of the Second-Generation Stent Graft with a Dual-Ring Design. Rev. Bras. Cardiol. Invasiva Engl. Version 2012, 20, 69–76. [Google Scholar] [CrossRef]
- Zambrano, B.A.; Gharahi, H.; Lim, C.Y.; Jaberi, F.A.; Choi, J.; Lee, W.; Baek, S. Association of Intraluminal Thrombus, Hemodynamic Forces, and Abdominal Aortic Aneurysm Expansion Using Longitudinal CT Images. Ann. Biomed. Eng. 2016, 44, 1502–1514. [Google Scholar] [CrossRef] [PubMed]
- Soulis, J.V.; Giannoglou, G.D.; Chatzizisis, Y.S.; Seralidou, K.V.; Parcharidis, G.E.; Louridas, G.E. Non-Newtonian models for molecular viscosity and wall shear stress in a 3D reconstructed human left coronary artery. Med. Eng. Phys. 2008, 30, 9–19. [Google Scholar] [CrossRef] [PubMed]
- Algabri, Y.A.; Rookkapan, S.; Chatpun, S. Three-dimensional finite volume modelling of blood flow in simulated angular neck abdominal aortic aneurysm. IOP Conf. Ser. Mater. Sci. Eng. 2017, 243, 012003. [Google Scholar] [CrossRef] [Green Version]
- Tseng, F.S.; Soong, T.K.; Syn, N.; Ong, C.W.; Liangb, L.H.; Choongc, A.M.T.L. Computational fluid dynamics in complex aortic surgery: Applications, prospects and challenges. J. Surg. Simul. 2017, 4, 1–4. [Google Scholar] [CrossRef]
- Van Bakel, T.M.J.; Lau, K.D.; Hirsch-Romano, J.; Trimarchi, S.; Dorfman, A.L.; Figueroa, C.A. Patient-Specific Modeling of Hemodynamics: Supporting Surgical Planning in a Fontan Circulation Correction. J. Cardiovasc. Transl. Res. 2018, 11, 145–155. [Google Scholar] [CrossRef]
- Lin, S.; Han, X.; Bi, Y.; Ju, S.; Gu, L. Fluid-Structure Interaction in Abdominal Aortic Aneurysm: Effect of Modeling Techniques. Biomed. Res. Int. 2017, 2017, 7023078. [Google Scholar] [CrossRef]
- Carty, G.; Chatpun, S.; Espino, D.M. Modeling Blood Flow through Intracranial Aneurysms: A Comparison of Newtonian and Non-Newtonian Viscosity. J. Med. Biol. Eng. 2016, 36, 396–409. [Google Scholar] [CrossRef]
- Owen, B.; Lowe, C.; Ashton, N.; Mandal, P.; Rogers, S.; Wein, W.; McCollum, C.; Revell, A. Computational hemodynamics of abdominal aortic aneurysms: Three-dimensional ultrasound versus computed tomography. Proc. Inst. Mech. Eng. Part H J. Eng. Med. 2016, 230, 201–210. [Google Scholar] [CrossRef]
- Xiang, J.; Tutino, V.M.; Snyder, K.V.; Meng, H. CFD: Computational fluid dynamics or confounding factor dissemination? The role of hemodynamics in intracranial aneurysm rupture risk assessment. Am. J. Neuroradiol. 2014, 35, 1849–1857. [Google Scholar] [CrossRef] [Green Version]
- Drewe, C.J.; Parker, L.P.; Kelsey, L.J.; Norman, P.E.; Powell, J.T.; Doyle, B.J. Haemodynamics and stresses in abdominal aortic aneurysms: A fluid-structure interaction study into the effect of proximal neck and iliac bifurcation angle. J. Biomech. 2017, 60, 150–156. [Google Scholar] [CrossRef] [PubMed] [Green Version]
- Xenos, M.; Alemu, Y.; Zamfir, D.; Einav, S.; Ricotta, J.J.; Labropoulos, N.; Tassiopoulos, A.; Bluestein, D. The effect of angulation in abdominal aortic aneurysms: Fluid–structure interaction simulations of idealized geometries. Med. Biol. Eng. Comput. 2010, 48, 1175–1190. [Google Scholar] [CrossRef] [PubMed]
- Li, Z.; Kleinstreuer, C. Effects of blood flow and vessel geometry on wall stress and rupture risk of abdominal aortic aneurysms. J. Med. Eng. Technol. 2006, 30, 283–297. [Google Scholar] [CrossRef]
- Yeow, S.L.; Leo, H.L. Hemodynamic Study of Flow Remodeling Stent Graft for the Treatment of Highly Angulated Abdominal Aortic Aneurysm. Comput. Math. Methods Med. 2016, 2016, 3830123. [Google Scholar] [CrossRef] [PubMed] [Green Version]
- Meecham, L.; Evans, R.; Buxton, P.; Allingham, K.; Hughes, M.; Rajagopalan, S.; Fairhead, J.; Asquith, J.R.; Pherwani, A.D. Abdominal aortic aneurysm diameters: A study on the discrepancy between inner to inner and outer to outer measurements. Eur. J. Vasc. Endovasc. Surg. 2015, 49, 28–32. [Google Scholar] [CrossRef] [Green Version]
- Duncan, J.L.; Harrild, K.A.; Iversen, L.; Lee, A.J.; Godden, D.J. Long term outcomes in men screened for abdominal aortic aneurysm: Prospective cohort study. BMJ 2012, 344, e2958. [Google Scholar] [CrossRef] [Green Version]
- Roache, P.J. Perspective: A Method for Uniform Reporting of Grid Refinement Studies. J. Fluids Eng. 1994, 116, 405–413. [Google Scholar] [CrossRef]
- Celik, I.B.; Ghia, U.; Roache, P.J.; Freitas, C.J.; Coleman, H.; Raad, P.E. Procedure for Estimation and Reporting of Uncertainty Due to Discretization in CFD Applications. J. Fluids Eng. 2008, 130, 078001. [Google Scholar] [CrossRef] [Green Version]
- Algabri, Y.A.; Altwijri, O.; Chatpun, S. Visualization of Blood Flow in AAA Patient-Specific Geometry: 3-D Reconstruction and Simulation Procedures. Bionanoscience 2019, 9, 966–976. [Google Scholar] [CrossRef]
- Caruso, M.V.; Gramigna, V.; Renzulli, A.; Fragomeni, G. Computational analysis of aortic hemodynamics during total and partial extracorporeal membrane oxygenation and intra-aortic balloon pump support. Acta Bioeng. Biomech. 2016, 18, 3–9. [Google Scholar] [CrossRef] [PubMed]
- Algabri, Y.A.; Rookkapan, S.; Gramigna, V.; Espino, D.M.; Chatpun, S. Computational study on hemodynamic changes in patient-specific proximal neck angulation of abdominal aortic aneurysm with time-varying velocity. Australas. Phys. Eng. Sci. Med. 2019, 42, 181–190. [Google Scholar] [CrossRef] [PubMed]
- Kao, R.H.; Chen, W.L.; Leu, T.S.; Chen, T.; Kan, C.D. Numerical Simulation of Blood Flow in Double-Barreled Cannon EVAR and its Clinical Validation. J. Vasc. Med. Surg. 2014, 2, 1000160. [Google Scholar] [CrossRef] [Green Version]
- Rissland, P.; Alemu, Y.; Einav, S.; Ricotta, J.; Bluestein, D. Abdominal Aortic Aneurysm Risk of Rupture: Patient-Specific FSI Simulations Using Anisotropic Model. J. Biomech. Eng. 2009, 131, 031001. [Google Scholar] [CrossRef]
- Morbiducci, U.; Gallo, D.; Massai, D.; Consolo, F.; Ponzini, R.; Antiga, L.; Bignardi, C.; Deriu, M.A.; Redaelli, A. Outflow conditions for image-based hemodynamic models of the carotid bifurcation: Implications for indicators of abnormal flow. J. Bomech. Eng. 2010, 132, 091005. [Google Scholar] [CrossRef] [PubMed]
- Sternbergh, W.C.; Carter, G.; York, J.W.; Yoselevitz, M.; Money, S.R. Aortic neck angulation predicts adverse outcome with endovascular abdominal aortic aneurysm repair. J. Vasc. Surg. 2002, 35, 482–486. [Google Scholar] [CrossRef] [Green Version]
- Finol, E.A.; Keyhani, K.; Amon, C.H. The Effect of Asymmetry in Abdominal Aortic Aneurysms under Physiologically Realistic Pulsatile Flow Conditions. J. Biomech. Eng. 2003, 125, 207–217. [Google Scholar] [CrossRef]
- Salman, H.E.; Ramazanli, B.; Yavuz, M.M.; Yalcin, H.C. Biomechanical Investigation of Disturbed Hemodynamics-Induced Tissue Degeneration in Abdominal Aortic Aneurysms Using Computational and Experimental Techniques. Front. Bioeng. Biotechnol. 2019, 7, 111. [Google Scholar] [CrossRef]
Figure 1.
Three-dimensional idealized AAA models with angulated proximal necks.
Figure 1.
Three-dimensional idealized AAA models with angulated proximal necks.
Figure 2.
Mesh generation for idealized AAA model with angulated proximal neck.
Figure 2.
Mesh generation for idealized AAA model with angulated proximal neck.
Figure 3.
Inlet velocity waveform.
Figure 3.
Inlet velocity waveform.
Figure 4.
Variation in time-averaged magnitude velocity at different mesh refinements compared with those obtained from Richardson extrapolation.
Figure 4.
Variation in time-averaged magnitude velocity at different mesh refinements compared with those obtained from Richardson extrapolation.
Figure 5.
Computational results of velocity fields at (A) 0.14 s, (B) 0.25 s, (C) 0.50 s, (D) 0.55 s, (E) 0.70 s, and (F) 0.94 s of cardiac cycle for AAA models with angulated proximal necks (VR, velocity ratio).
Figure 5.
Computational results of velocity fields at (A) 0.14 s, (B) 0.25 s, (C) 0.50 s, (D) 0.55 s, (E) 0.70 s, and (F) 0.94 s of cardiac cycle for AAA models with angulated proximal necks (VR, velocity ratio).
Figure 6.
Velocity ratios (VRs) at four sac cross-sections (a–d) and at (A) 0.14 s, (B) 0.25 s, (C) 0.50 s, (D) 0.55 s, (E) 0.70 s, and (F) 0.94 s of cardiac cycle for AAA models with angulated proximal necks.
Figure 6.
Velocity ratios (VRs) at four sac cross-sections (a–d) and at (A) 0.14 s, (B) 0.25 s, (C) 0.50 s, (D) 0.55 s, (E) 0.70 s, and (F) 0.94 s of cardiac cycle for AAA models with angulated proximal necks.
Figure 7.
Velocities and streamlines at midplane of aneurysm sac and at (A) 0.14 s, (B) 0.25 s, (C) 0.50 s, (D) 0.55 s, (E) 0.70 s, and (F) 0.94 s of cardiac cycle for AAA models with angulated proximal necks.
Figure 7.
Velocities and streamlines at midplane of aneurysm sac and at (A) 0.14 s, (B) 0.25 s, (C) 0.50 s, (D) 0.55 s, (E) 0.70 s, and (F) 0.94 s of cardiac cycle for AAA models with angulated proximal necks.
Figure 8.
Pressure ratios (PRs) at four sac cross-sections and at (A) 0.14 s, (B) 0.25 s, (C) 0.50 s, (D) 0.55 s, (E) 0.70 s, and (F) 0.94 s of cardiac cycle for AAA models with angulated proximal necks.
Figure 8.
Pressure ratios (PRs) at four sac cross-sections and at (A) 0.14 s, (B) 0.25 s, (C) 0.50 s, (D) 0.55 s, (E) 0.70 s, and (F) 0.94 s of cardiac cycle for AAA models with angulated proximal necks.
Figure 9.
WSS distributions at (A) 0.14 s, (B) 0.25 s, (C) 0.50 s, (D) 0.55 s, (E) 0.70 s, and (F) 0.94 s of cardiac cycle for AAA models with proximal neck angulations.
Figure 9.
WSS distributions at (A) 0.14 s, (B) 0.25 s, (C) 0.50 s, (D) 0.55 s, (E) 0.70 s, and (F) 0.94 s of cardiac cycle for AAA models with proximal neck angulations.
Figure 10.
Peak WSS according to proximal neck angulation.
Figure 10.
Peak WSS according to proximal neck angulation.
Figure 11.
TAWSS according to (a) interval (A–F) in cardiac cycle and (b) proximal neck angulation. OSI according to (c) interval (A–F) in cardiac cycle and (d) proximal neck angulation.
Figure 11.
TAWSS according to (a) interval (A–F) in cardiac cycle and (b) proximal neck angulation. OSI according to (c) interval (A–F) in cardiac cycle and (d) proximal neck angulation.
Table 1.
Mesh convergence results in computational simulations.
Table 1.
Mesh convergence results in computational simulations.
| Mesh Type (Index i) | dvi (Thousands) | ri | | GCIi+1,i |
|---|
| Fine (1) | 670 | ~1.93 | 0.065 | 1.92% |
| Intermediate (2) | 350 | ~1.93 | 0.063 | 5.95% |
| Coarse (3) | 180 | – | 0.057 | – |
| Publisher’s Note: MDPI stays neutral with regard to jurisdictional claims in published maps and institutional affiliations. |
© 2022 by the authors. Licensee MDPI, Basel, Switzerland. This article is an open access article distributed under the terms and conditions of the Creative Commons Attribution (CC BY) license (https://creativecommons.org/licenses/by/4.0/).


 ,
, 
