Article

Probability-Based Crack Width Estimation Model for Flexural Members of Underground RC Box Culverts

1
School of Civil and Environmental Engineering, Yonsei University, Seoul 03722, Korea
2
KEPCO Research Institute, Daejeon 34056, Korea
3
Department of Civil and Environmental Engineering, University of Nebraska-Lincoln, Omaha, NE 68182, USA
*
Author to whom correspondence should be addressed.
Appl. Sci. 2022, 12(4), 2063; https://doi.org/10.3390/app12042063
Submission received: 5 December 2021 / Revised: 8 February 2022 / Accepted: 12 February 2022 / Published: 16 February 2022

Abstract

:
Crack control for slabs and beams in current design practices in Korea are based on the Frosch’s model, which is adapted in ACI 318. It is more difficult to have consistent quality control in underground construction sites, such as the RC box culverts used for electric power distribution built below the ground level. There are more discrepancies between the as-built dimensions and the design dimensions provided in drawings in these structures. Due to this variability in construction error, the crack widths measured in such structures have higher potential to have more differences than the calculated values. Although crack control is a serviceability concern, if the owner chooses to have a target crack width that needs better control, crack width estimations can be improved by considering such construction variability. The probability-based crack width model suggested in this study will allow minimizing the discrepancies between the measured and calculated crack widths and provide reliable estimations of crack widths. Typical size of slabs and beams ranging between 300 mm (12 in.) to 500 mm (20 in.) used in underground RC box culverts in Korea were tested under the four-point bending test program. The thicker specimens had smaller bar spacings which created more cracks with smaller crack widths. However, with smaller crack widths generated in these specimens, there were more errors between the measurements and calculated values. From site investigations in Korea, the thickness of slabs in underground box culverts varied the most among all parameters. As a result, the bottom concrete covers had the highest variability. Bottom concrete covers and bar spacings are the two most important parameters in concrete crack control. A probability-based crack width estimation model for flexural members was developed in this study to consider this construction variability. Monte Carlo simulations were performed to evaluate the probabilistic characteristics of the design surface crack widths with a target width of either 0.3 mm (12 mils) or 0.5 mm (20 mils). The probabilistic models of design variables included in the crack width estimation model were generated based on field-collected information from construction sites in Korea. Because the surface crack widths in RC flexural members are sensitive to the construction errors of concrete cover depths, and since there are differences between the assumed and actual stress distribution closer to the reinforcing bars, the probability of having surface cracks of 0.3 mm width (12 mils) is found to be quite high, such as 89% at the positive moment region (mid-span, bottom surface) of the top slab in RC box culverts and 45% for the negative moment region (support area, top surface) of the top slab with current design practice. In order to ensure crack widths to be smaller than the design target width, probability-based crack width factors are recommended in this study to improve estimations depending on the selected target reliability levels.

1. Introduction

Strength and serviceability are the two main criteria to be satisfied in the design of reinforced concrete (RC) structures. Strength is the ability of the structure to carry the design ultimate loads without collapse while serviceability covers the functionality, durability, and sustainability of the structural members. Surface crack width is one of the important serviceability criteria in RC members. The deterioration of RC structures can be caused by steel rebar corrosion which occurs due to the cracking of concrete. In underground RC box culverts, the cracking of the concrete may reduce the service life of the structure by permitting the penetration of corrosive factors, such as high humidity, repeated saturation with moisture, and water with reacting agents, to reach the reinforcement. Cracking also reduces the stiffness of culverts and crack widths can potentially increase even under normal service loads. This study is conducted to develop a probability-based crack width estimation model for flexural members of underground RC box culverts utilized in power supply lines.
The stress in the steel reinforcement is proportional to the width of the cracks and is one of the most important factors for the cracking behavior of RC members [1]. Clark [1] identified the importance of stress in the steel reinforcement and observed that crack width can be prevented from growing by using a large number of smaller reinforcement bars and by increasing the reinforcement ratio. Broms [2] found that the difference in crack width between the concrete surface and the reinforcing bar is small at low tensile stresses (just after crack formation), and this difference increases as the tensile stress increases in bars. Therefore, the crack width at the reinforcing bar increases more slowly than the width at the concrete surface with an increase in load. Gergely and Lutz [3] performed an extensive statistical evaluation of data from six different investigations and proposed an empirical model as the result of correlation and regression analyses. The major parameter controlling the cracking behavior of a two-way system, apart from the reinforcement stress level, is the spacing of the intersecting bars or wires in the two orthogonal directions, and the diameter of the reinforcement and the concrete cover are the two other parameters that influence the cracking behavior [4]. Beeby [5] stated that crack patterns can be controlled by the depth to which the cracks penetrate to or by the proximity of the reinforcement. He showed that the spacing of transverse reinforcement had a strong influence on the crack width and crack spacing. After some initial cracks have formed, the tensile stress on the concrete that would widen the cracks is resisted by the area of concrete immediately surrounding the steel, which is less than the total area of the concrete in the tensile zone of the member subjected to pure flexure [2].
Due to the formation of cracks in reinforced concrete elements, the compatibility of deformations between reinforcing bars and concrete is not maintained. The bond stress–slip characteristics of the reinforcing bar have a significant influence on crack width, crack spacing, and the stiffening of tensioned concrete [6]. Makhlouf and Malhas [7] investigated the effect of thick concrete cover on maximum flexural crack width under service loads and further examined the validity of crack width prediction formulas given in old provisions such as the ACI 318–1995 [8] and BS8110: part 2–1985 [9]. The maximum acceptable crack width depends on the structural type, the location of the crack within the structure, the surrounding environment, and the consequences of excessive cracking. Park and Paulay [10] found that cracks up to 0.25–0.38 mm (10–15 mils) may be aesthetically acceptable. The ACI Committee 224R-01 [11] has recommended tolerable crack widths for various exposure conditions which can protect reinforcement against corrosion.
Colotti and Spadea [12] proposed an analytical model for crack control in reinforced concrete members based on the softened truss theory. The crack width of reinforced concrete elements under combined axial, flexural, and shear load can be predicted using their model. Kwak and Song [13] proposed an analytical model based on the polynomial strain distribution function of steel and concrete for the prediction of cracking loads and the elongation of reinforcing steel. They conducted correlation studies between analytical results and experimental results to verify the validity of the proposed model. Visintin et al. [14] studied the crack behavior of reinforced concrete members under instantaneous short-term and long-term sustained load conditions. In this paper, the crack widths of flexural members of underground reinforced concrete box culvert are discussed. A probability-based crack width estimation model is presented as a result, focusing on instantaneous short-term load conditions. The cross-section of a typical underground RC box culvert used for power supply lines is shown in Figure 1 [15], which has a height and width of 2600 mm (8.5 ft) with haunch dimensions of 150 mm × 150 mm (6 by 6 inches). The thickness of the top and bottom slab and wall member are all 250 mm (10 inches). This is a common design practice in Korea [15].

2. Control of Crack Width

The purpose of crack control in RC structures includes maintaining good appearance, protecting rebars from corrosion, and having water tightness. Since the 1970s, various approaches have been used to control the width of cracks. From 1971 to 1995, the ACI 318 restrictions on the distribution of tension reinforcement were designed to limit the width of surface cracks. ACI 318-1995 [8] included provisions for keeping crack widths under 0.41 mm (16 mils) for interior and 0.30 mm (12 mils) for exterior applications, respectively. ACI 318-1995 [8] requirements for flexural crack control in beams and one-way slabs at the tensile reinforcement level were based on the equation proposed by Gergely-Lutz [3], which was derived from regression analyses on data from several crack width studies.
Frosch [16] re-evaluated Brom’s model [2] and available crack width data [3] to suggest a model based on physical phenomena for determining the widths of flexural cracks in RC structures. The current ACI 318-2019 [17] crack control equation is based on Frosch’s study [6], and considers bar spacing, concrete cover, and bar stress to limit crack widths towards target level. Frosch’s study showed that previous crack width equations suggested by Kaar-Mattock [18], Beeby [19], and Gergely-Lutz [3] worked reasonably well for concrete covers up to 63.5 mm (2.5 inches). The equation proposed by Frosch [16] can be used for both beams and slabs if large deflection does not take place and the plane section remains plane. The crack width at the concrete surface can be calculated using the following equation:
w c = ψ s f s E s d c 2 + s 2 2  
where w c is the crack width (mm), ψ s is the crack spacing factor (1.0 for minimum, 1.5 for average, and 2.0 for maximum crack spacing; in this study the maximum crack spacing was used to calculate crack widths), f s is calculated rebar stress (MPa), E s is the modulus of steel, is the ratio of distances to the neutral axis from extreme tension fiber and from the centroid of reinforcement h c d c , h is the slab thickness (mm), c is the distance to the neutral axis from the top face of the concrete (mm), d is the effective depth of the bottom reinforcement (mm), d c is the distance from the center of the lowest bar to the bottom face of the concrete (mm), and s is the rebar spacing (mm).
The Comité Euro-International du Béton and Fédération Internationale de la Précontrainte (CEB-FIP 1990) [20] approach to predict crack width is similar to the ACI approach. The CEB-FIP model considers the average strain in reinforcing steel but within the bond transfer length. The characteristic crack width, w k , in flexural members (beams) is calculated in terms of the maximum bond transfer length, l s , m a x , over which a slip occurs between the steel reinforcement and the concrete. Eurocode EC2 [21] requires that cracking should be limited to a level that does not impair the proper functioning of the structure. It limits the maximum design crack width to 0.30 mm (12 mils) for sustained loads under normal environmental conditions. This study is performed for the crack width estimation of the flexural member of the underground RC box culverts used for power supply lines in Korea with a target crack width in the range between 0.3 to 0.5 mm (12 to 20 mils).

3. Experimental Work

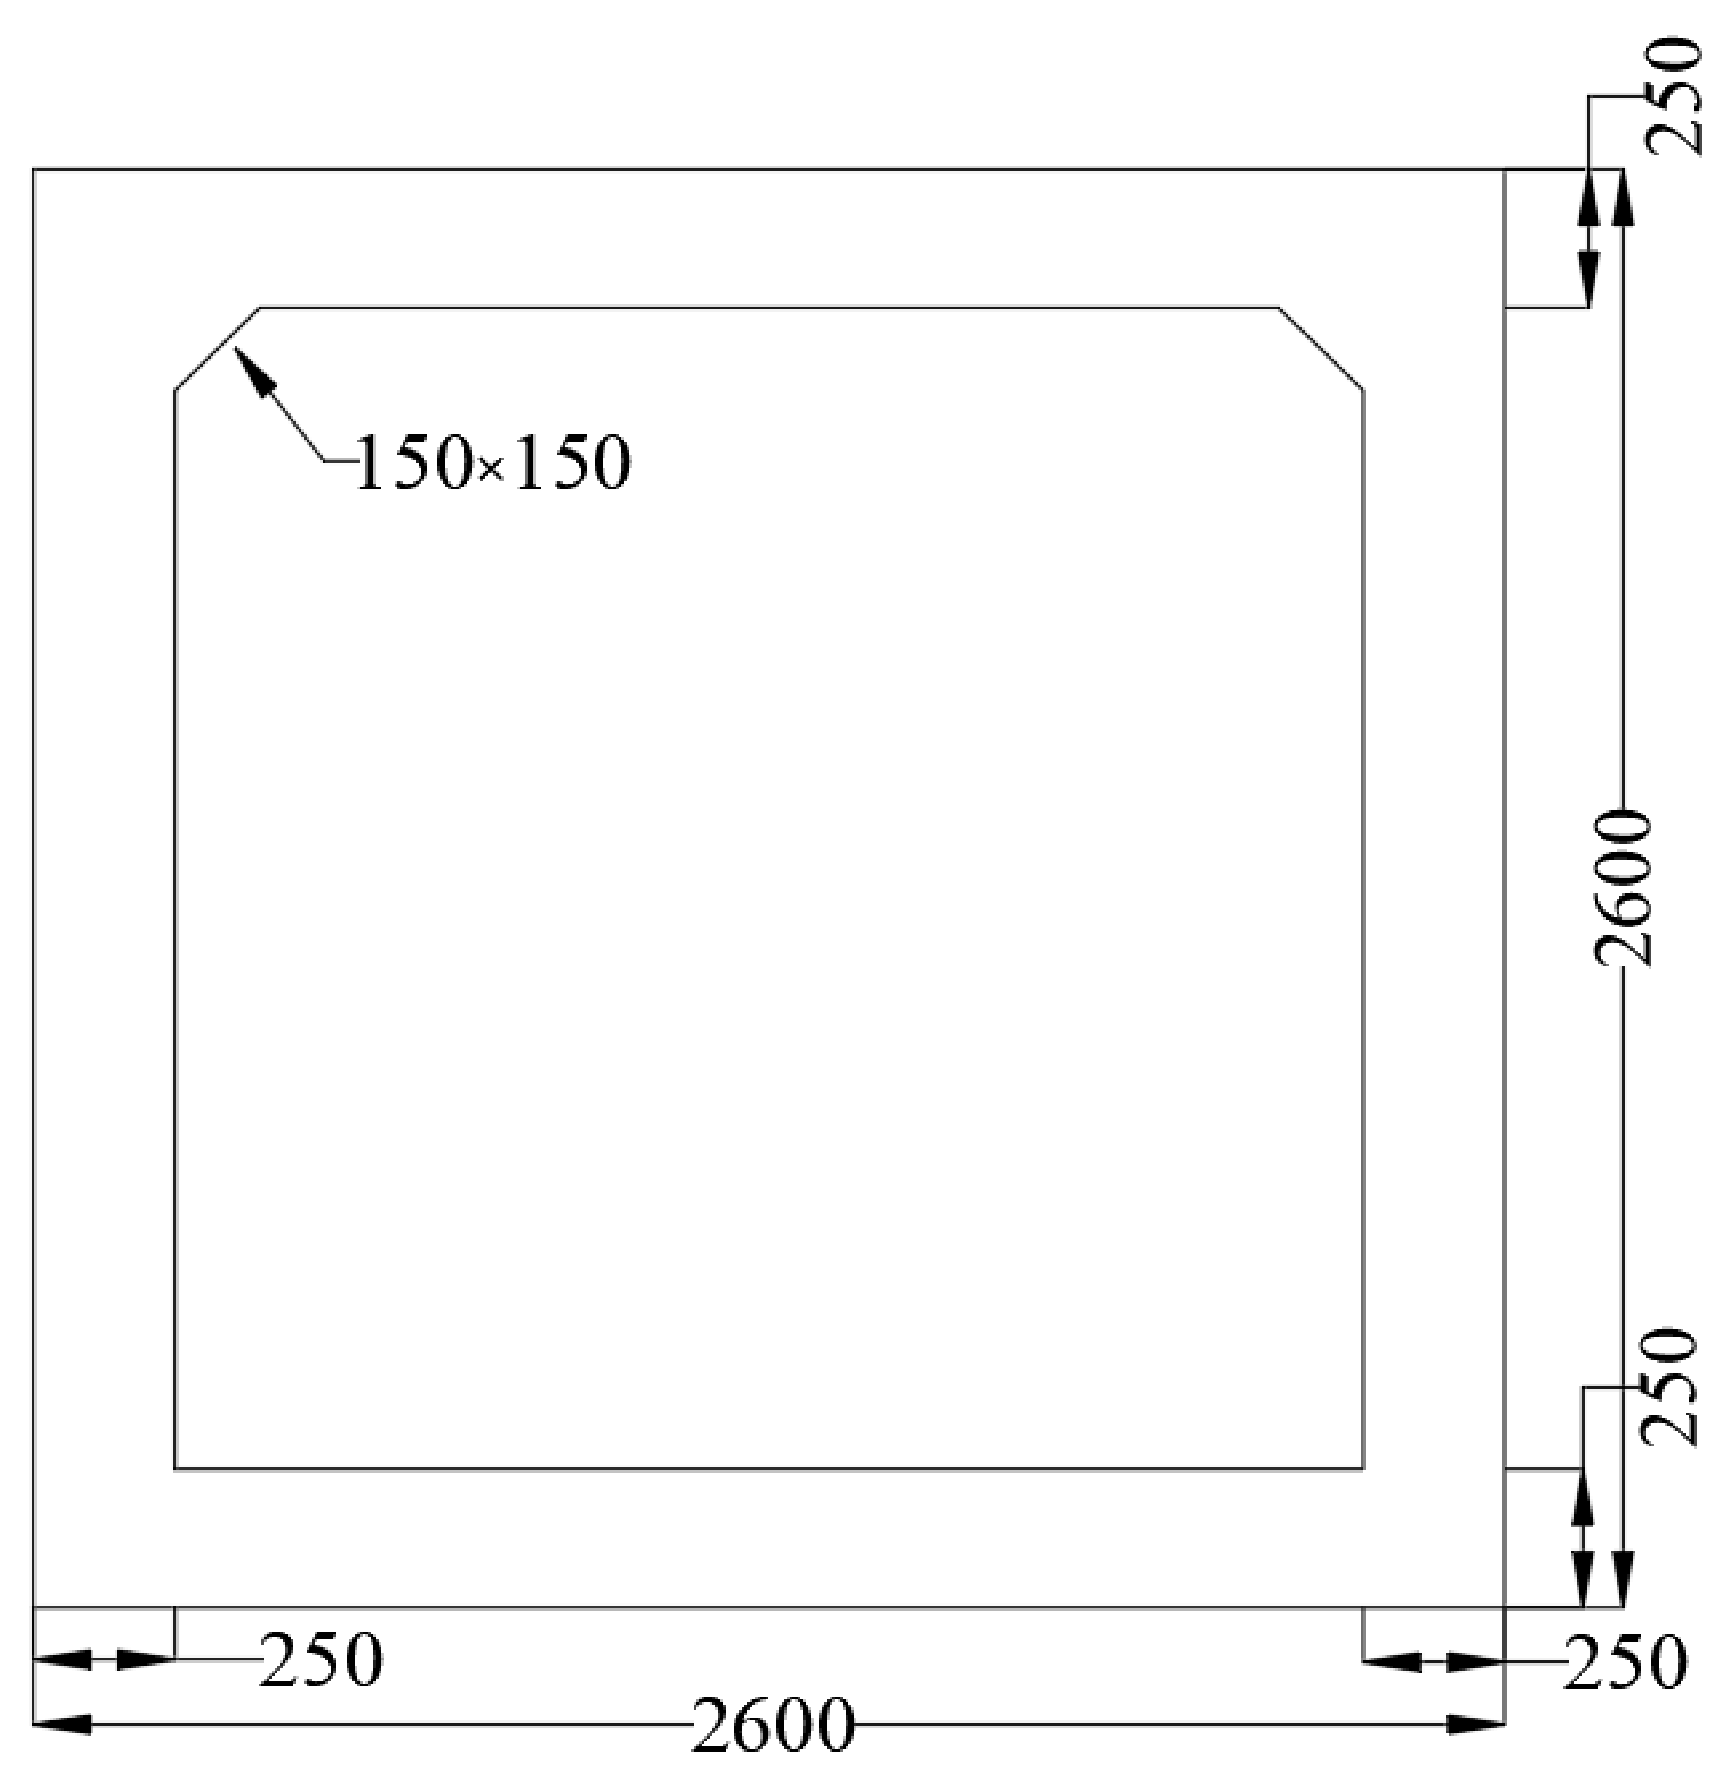
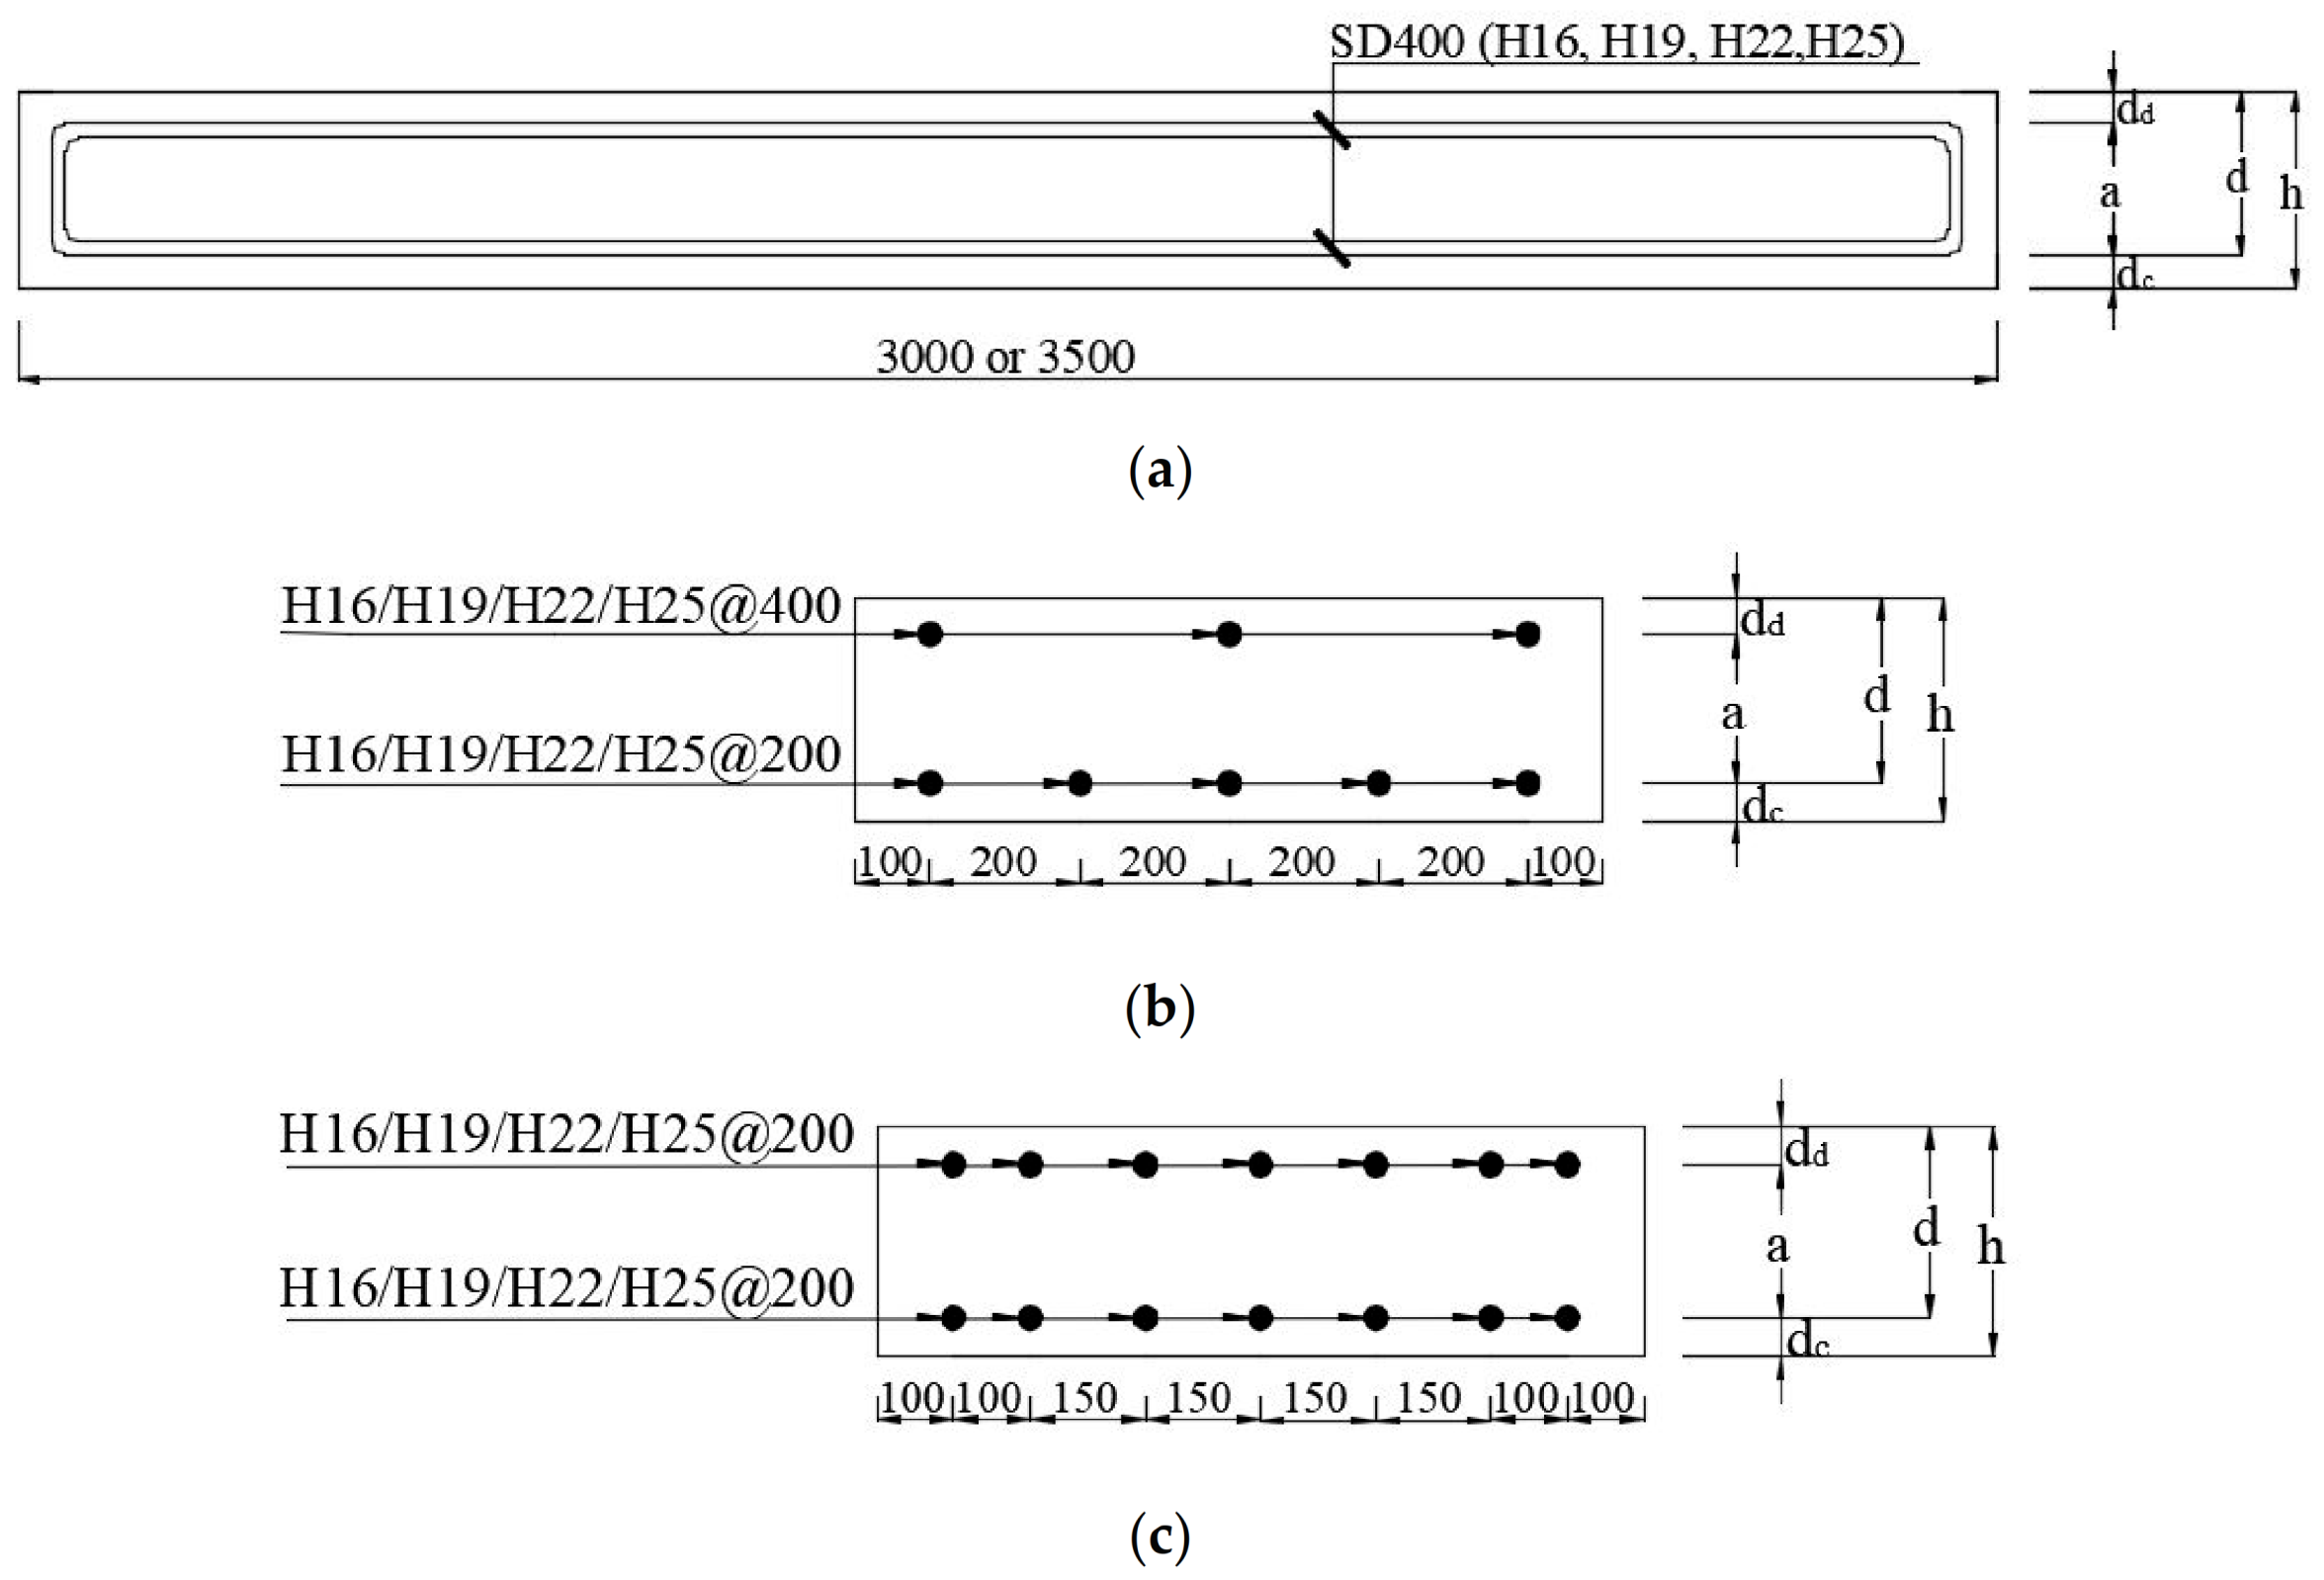
3.1. Fabrication of Specimens and Material Properties

Four-point flexural test was conducted for 24 RC slabs. Twenty slabs were 3000 mm (10 ft) long and four slabs were 3500 mm (11.5 ft) long. All slabs were 1000 mm (3.3 ft) wide. The thicknesses of specimens were 300, 400, and 500 mm (12, 16, and 20 in.). SD 400 grade (Grade 60 ksi) steel rebar with diameters of 16, 19, 22, and 25 mm (#5 to #8 bars) was used as longitudinal reinforcements. The dimensions and reinforcement details of the RC slabs are shown in Figure 2. The spacing of the longitudinal tension and compression reinforcement bars is 200 and 400 mm (8 and 16 in.), respectively, in 16 slabs, and 150 mm (6 in.) for both tension and compression reinforcement bars in 8 slabs.
For shear reinforcement, stirrups with a diameter of 13 mm (H13) were placed in between two loading points at 200 mm spacing, and 16 mm (H16) stirrups were placed from the end of the slab to the loading point at 120 mm spacing. The detailed dimensions of the specimens and reinforcement ratios are presented in Table 1.
Concrete with a target compressive strength of 27 MPa (4000 psi) was used to construct test specimens. All cylinders for the compression tests were cast and cured in an identical manner as the test specimens. Test results of concrete cylinders are summarized in Table 2.

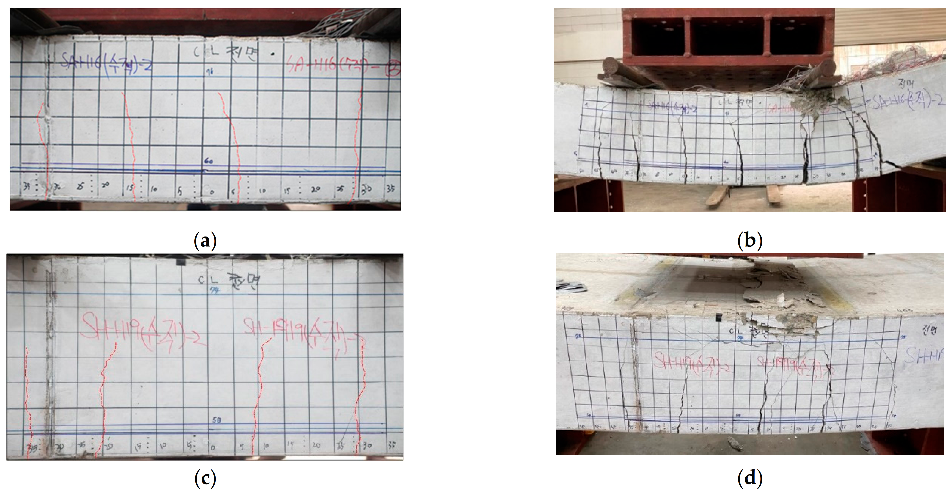
3.2. Direction of Casting and Testing of Slab Specimens

In underground RC box culverts, the concrete casting direction of the slab and wall members may be different due to the limited working space in ground excavations. In order to consider differences in casting positions, slab specimens were cast and tested in different directions to have a better representation of the field conditions in estimating crack widths. Slab specimens were cast and tested in three different ways: (1) cast parallel to the direction of loading (PL), (2) cast opposite to the direction of loading (OP), and (3) cast perpendicular to the direction of loading (PR).

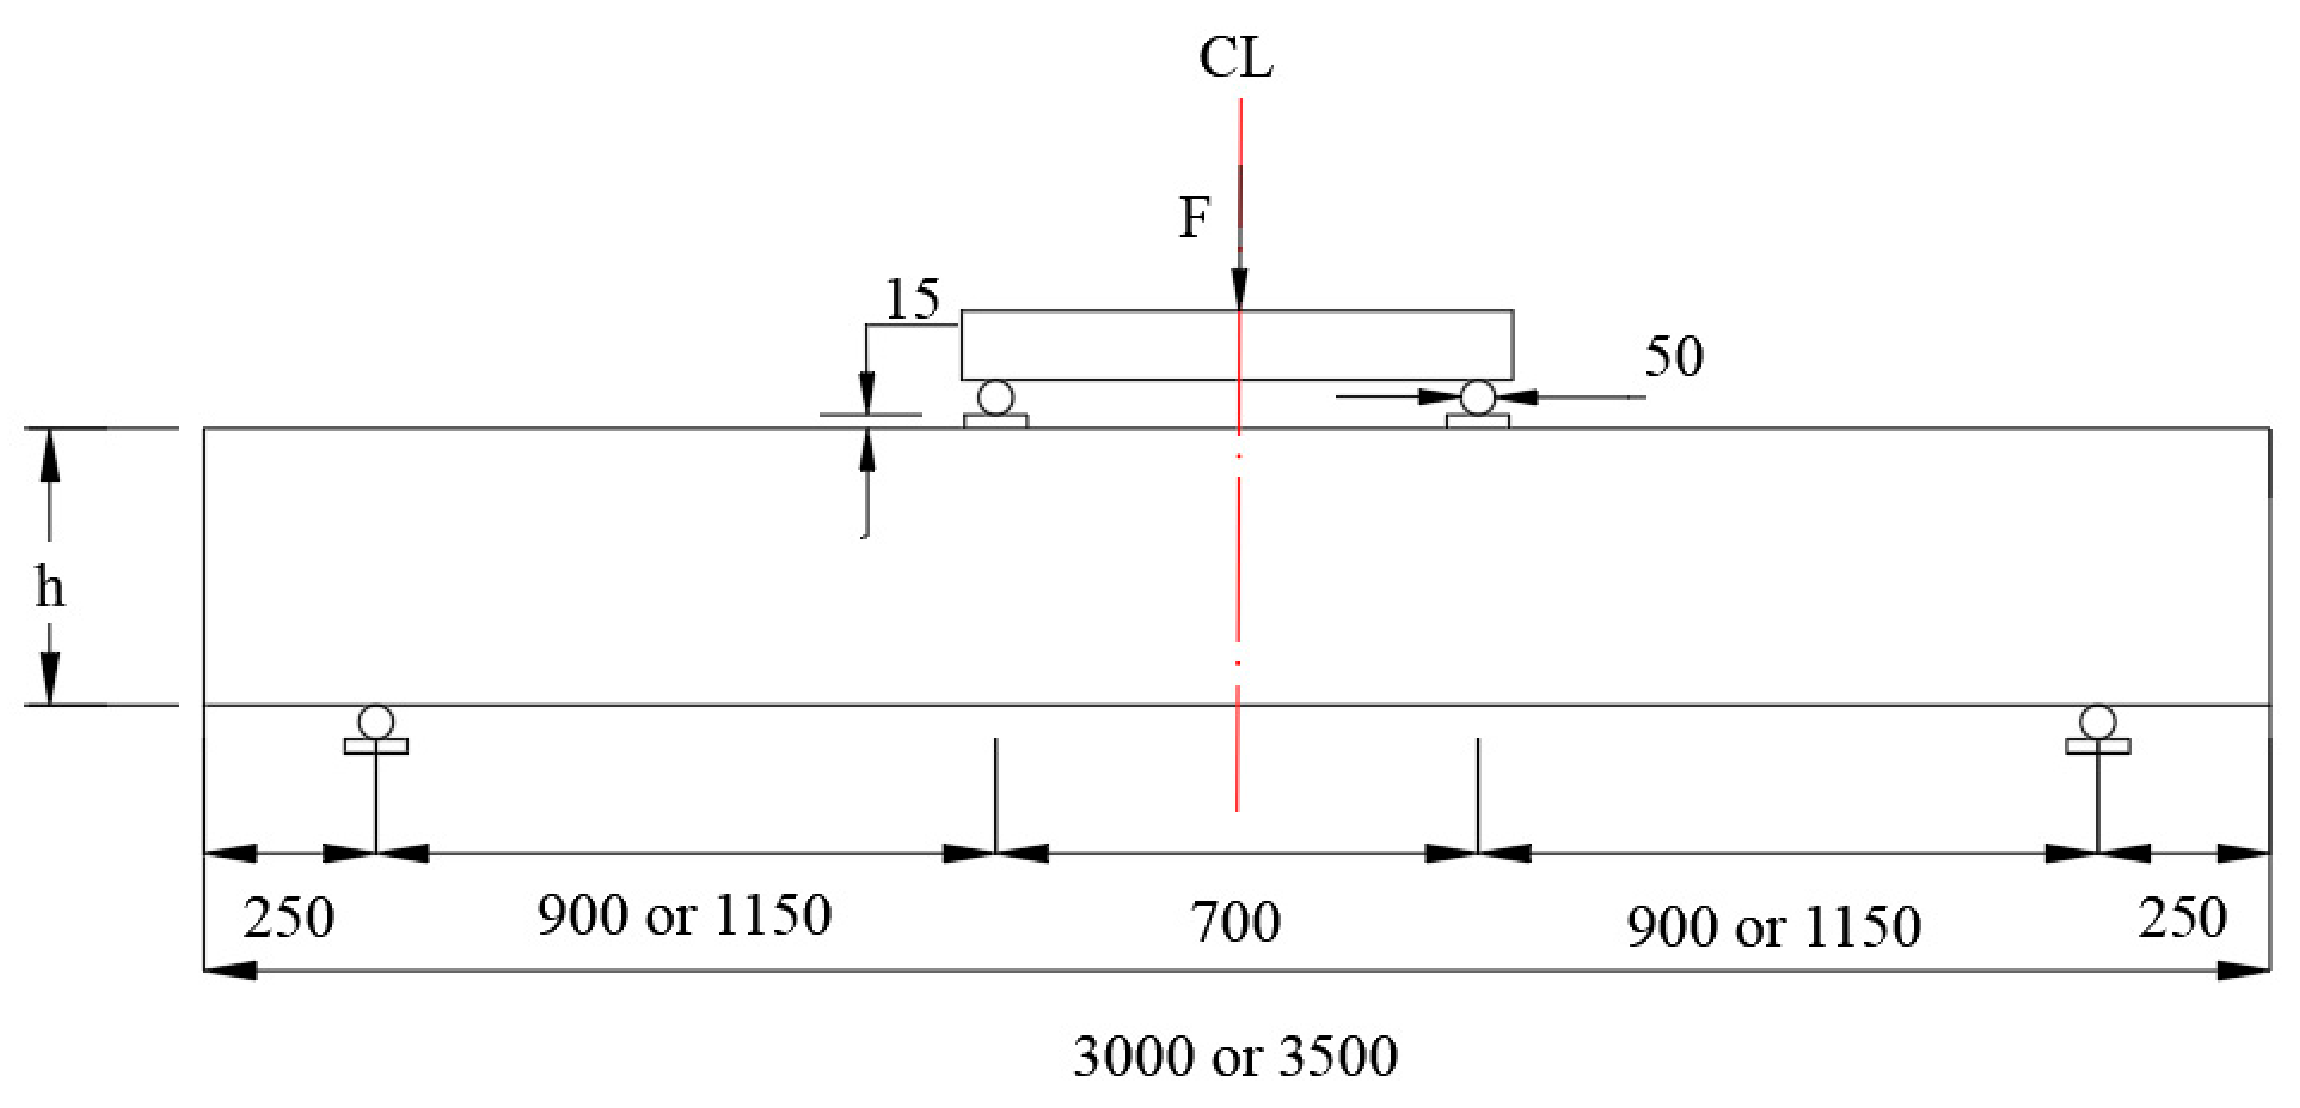
3.3. Experimental Setup

Slabs that are 3000 and 3500 mm long were supported over spans of 2500 and 3000 mm, respectively. Two concentrated loads were placed symmetrically on the slabs 700 mm apart (Figure 3). A 10 mm thick soleplate designed to prevent bearing failure was installed at the point of contact between the specimen and the roller support.
Crack widths were measured close to the bottom side surface of the RC slabs using an optical crack width gauge with a least count of 0.01 mm (0.4 mils). Crack widths were measured within the constant moment region. The load values that produced crack widths of 0.3 and 0.5 mm (12 to 20 mils) were recorded and used to calculate the rebar stress in the tensile section by cracked transform section analysis. Each bar stress was further used to estimate the crack widths with Equation (1). Most of the slabs had three to four cracks forming in the constant moment region at the load that produced the first 0.3 mm (12 mils) crack and had two to three additional cracks formed at the failure of the slab specimen outside the constant moment region. As shown in Figure 4, SA-H16-PR-2 has 4 cracks at the load that produced the 1st 0.3 mm crack. At failure, the crack widths of the 4 cracks in the constant moment region became much wider with three additional cracks formed outside the constant moment region prior to failure. Similarly, for SH-H19-PR-2, 4 cracks appeared at the load that produced the first 0.3 mm crack within the constant moment region, and two additional cracks formed outside the constant moment region at failure. Figure 4 shows that the crack widths observed in SH specimens that have tighter bar spacing are smaller compared to the SA specimens, which have larger bar spacing. This is a typical behavior observed in RC members with smaller bar spacing where the bond between steel reinforcement and concrete is better and more cracks with smaller crack widths are generated than the case with larger bar spacings. To distinguish the cracks of 0.3 mm width, which are not easily visible in these pictures, red-colored dash lines are drawn next to the cracks.

4. Analysis of Crack Width

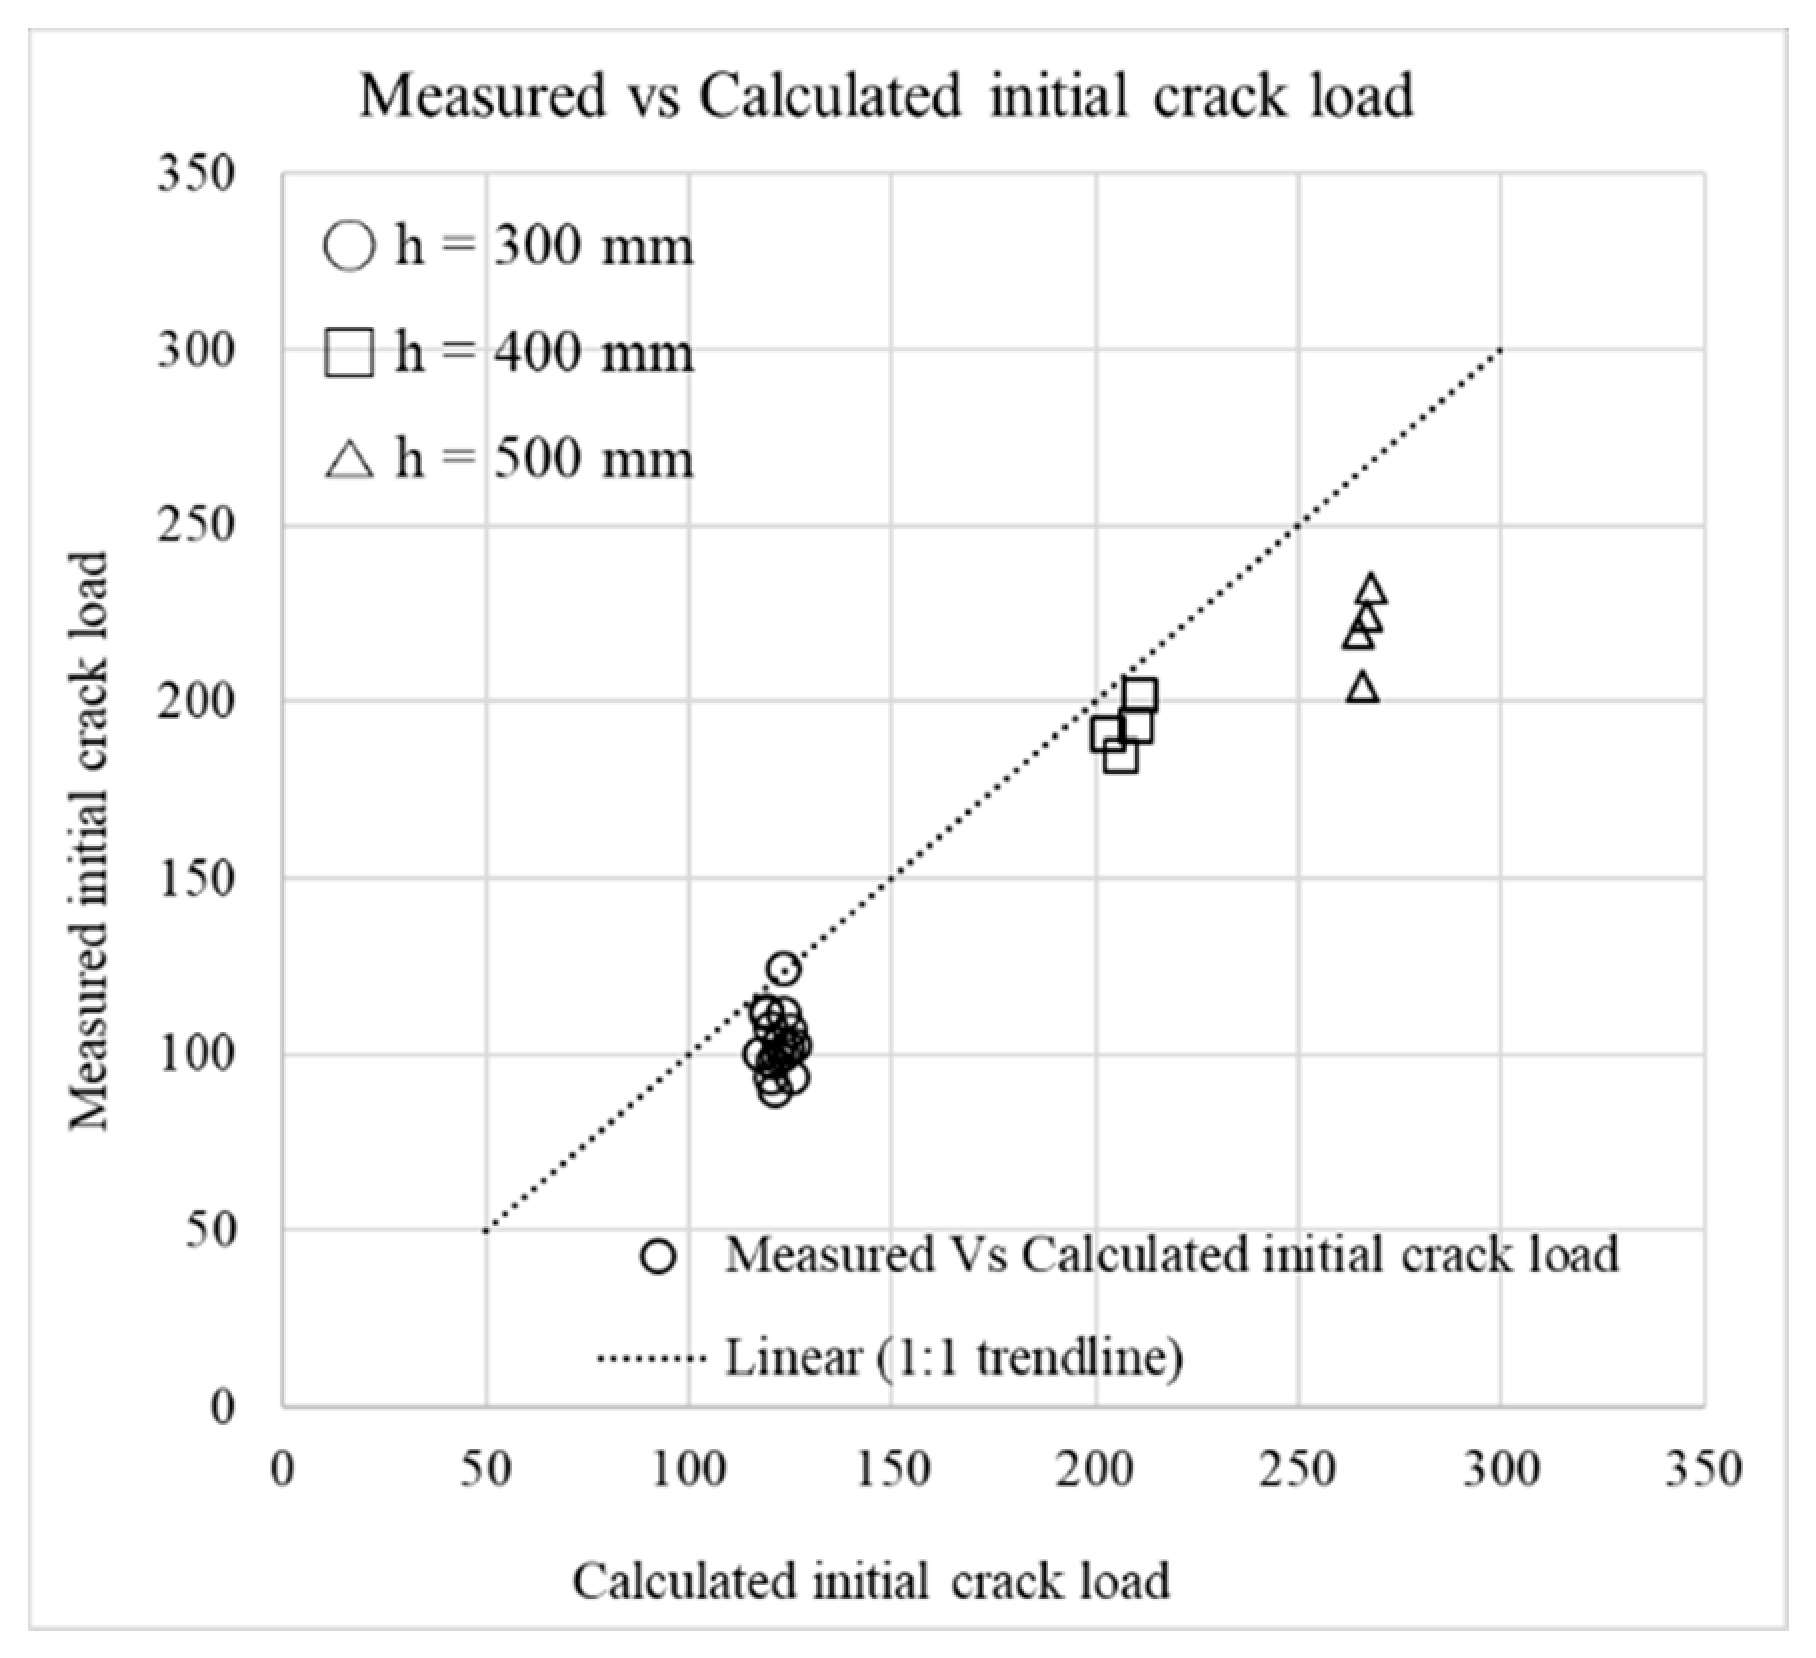
4.1. Moment at First Cracking

The moment at first cracking is calculated using the following equation:
M cr = f r I g y t
where M cr is the moment at first cracking (KN.m), f r is the modulus of rupture for concrete, f r = 0.63 × 1 × f c k ; f c k is the standard compressive strength (MPa), I g is the moment of inertia of the gross uncracked section (mm4), and y t is the distance from the centroidal axis of the gross section to the extreme tension fiber (mm).
Initial cracking load values are obtained using Equation (2) and measured during testing of the slabs. As shown in Figure 5, the initial cracking load values for slabs with a thickness of 300 and 400 mm are closer to the calculated values, whereas for slabs with a thickness of 500 mm, the measured values are lower than the calculated values, which indicates that cracking occurred early in the case with 500 mm slab specimens.

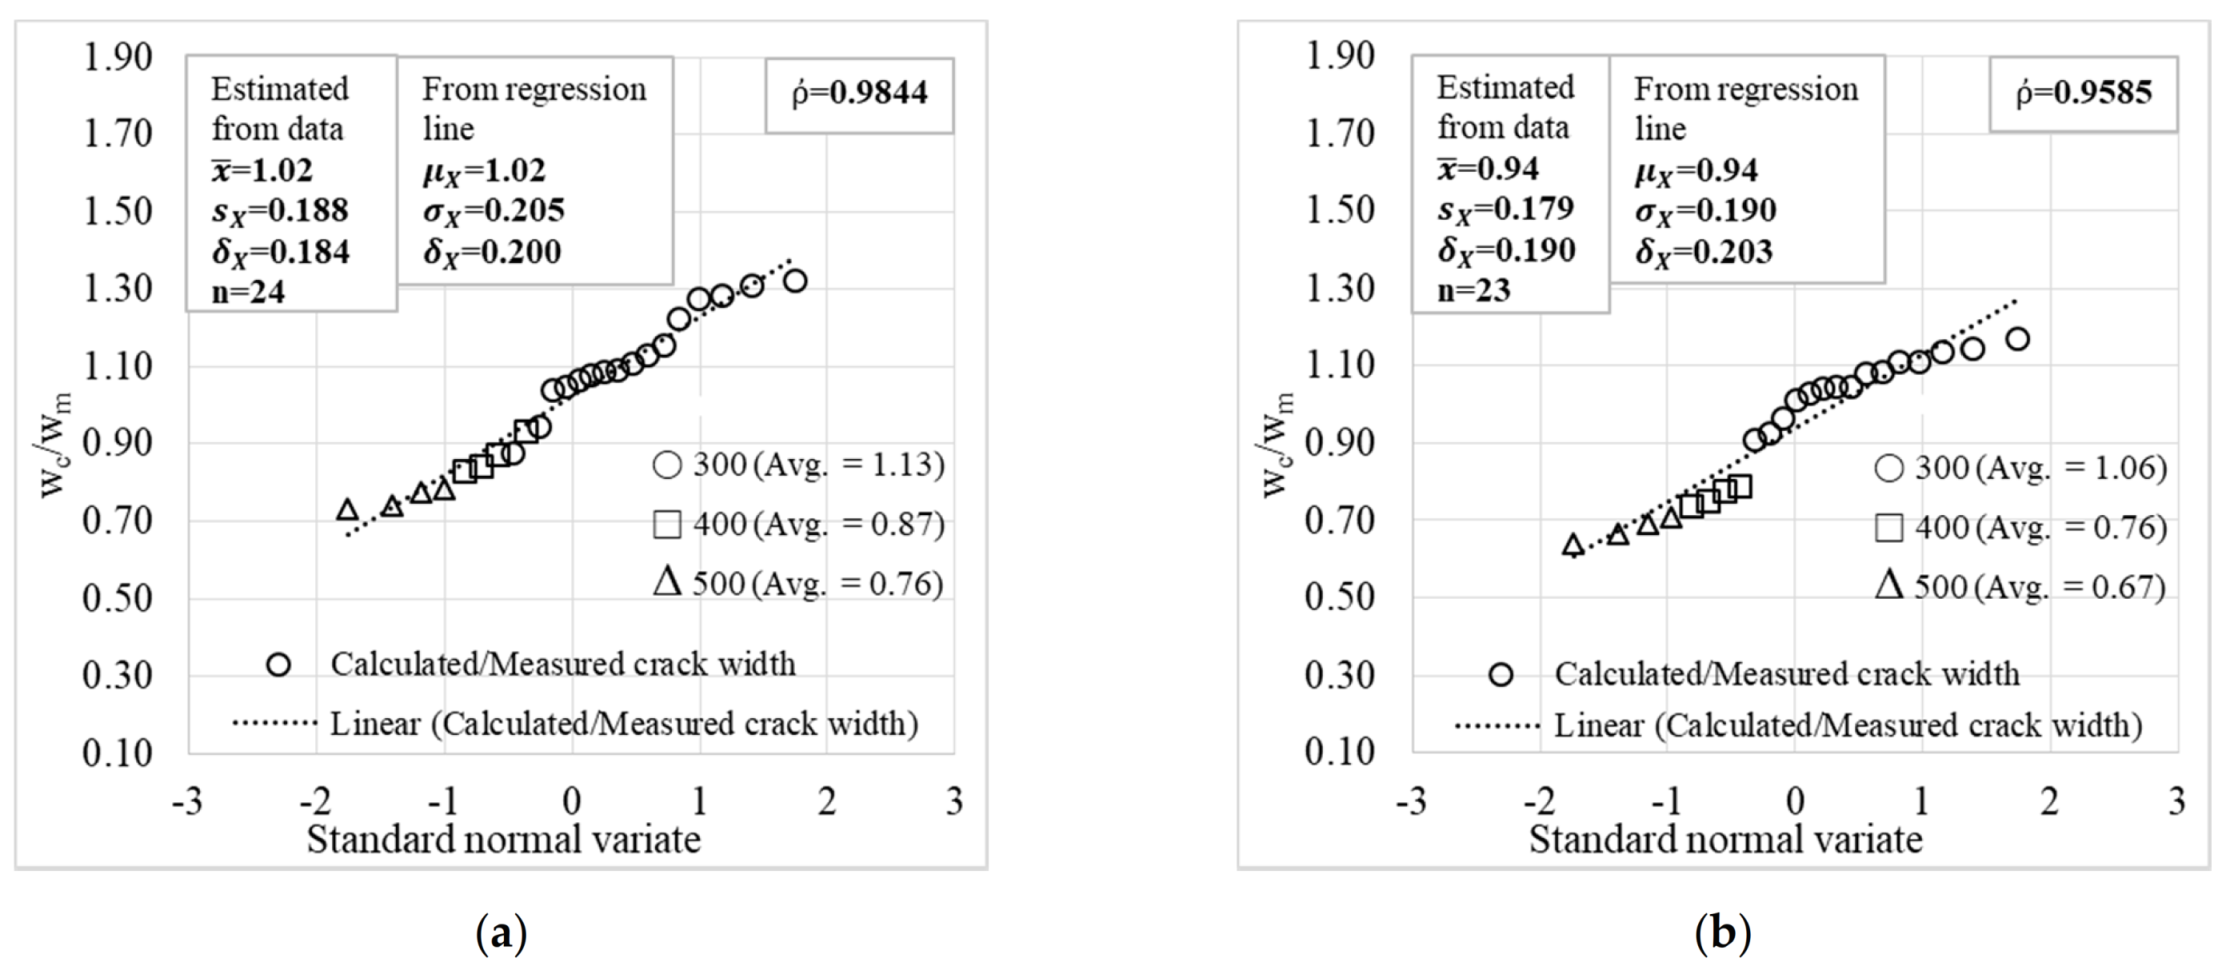
4.2. Estimation of Crack Widths

The crack widths of the RC slab members were calculated using Equation (1) by considering the rebar stress of the tension reinforcement in the slab specimens. The cross-section dimensions of the slab were measured before the experiment and the as-built dimensions were used in calculations. Calculated crack widths in Table 3 and Table 4 were generated using the measured load values obtained while the first measured crack widths were 0.3 mm and 0.5 mm, respectively. The ratios of calculated-to-measured crack width are presented in Table 3 and Table 4, which demonstrates the difference in estimation. As given in Table 3 and Table 4, the calculated-to-measured crack width ratio for specimens that are 300 mm thick (SA specimens) are mostly above 1, while this ratio drops below 1 for specimens that are 400 mm thick (SH-specimens). This ratio drops further below 1 for slabs that have a thickness of 500 mm (SK-specimens). All the slab specimens have the same top and bottom concrete cover. However, the rebar spacing is smaller for the 400 and 500 mm specimens (150 mm spacing; 6 in. spacing) than the 300 mm specimens (200 mm spacing; 8 in. spacing). With more bars provided for the 400 and 500 mm slab specimens, more cracks with smaller crack widths were observed compared to the 300 mm slab specimens. Measured values were larger for the 400 and 500 mm slab specimens than the calculated values. One possibility that there are discrepancies between crack width measurements and calculations in specimens with smaller bar spacings and larger thickness (SH and SK specimens) is that these specimens would have smaller crack widths than specimens with larger bar spacings and smaller thicknesses, and slight error may cause larger differences. One other note to make is that the measurements in this study were made only at the bottom side surface of the specimens for all specimens and no measurements on the bottom surface of the specimens due to the difficulties to be underneath the specimens, and the measurements at the bottom surface could have provided larger crack widths. The casting direction of the specimens did not have much effect on the occurrence of the design crack widths of 0.3 mm and 0.5 mm, as shown in Table 3 and Table 4.
Figure 6 shows the distribution of calculated-to-measured crack width ratios for the first major crack. There is more discrepancy between the measurements and calculations of crack width for specimens with increased thickness. Although it is understood that crack width calculations are rather estimations than an exact calculation, a correction factor based on the probabilistic study is suggested in this study to minimize the variation in estimations observed in measurements.

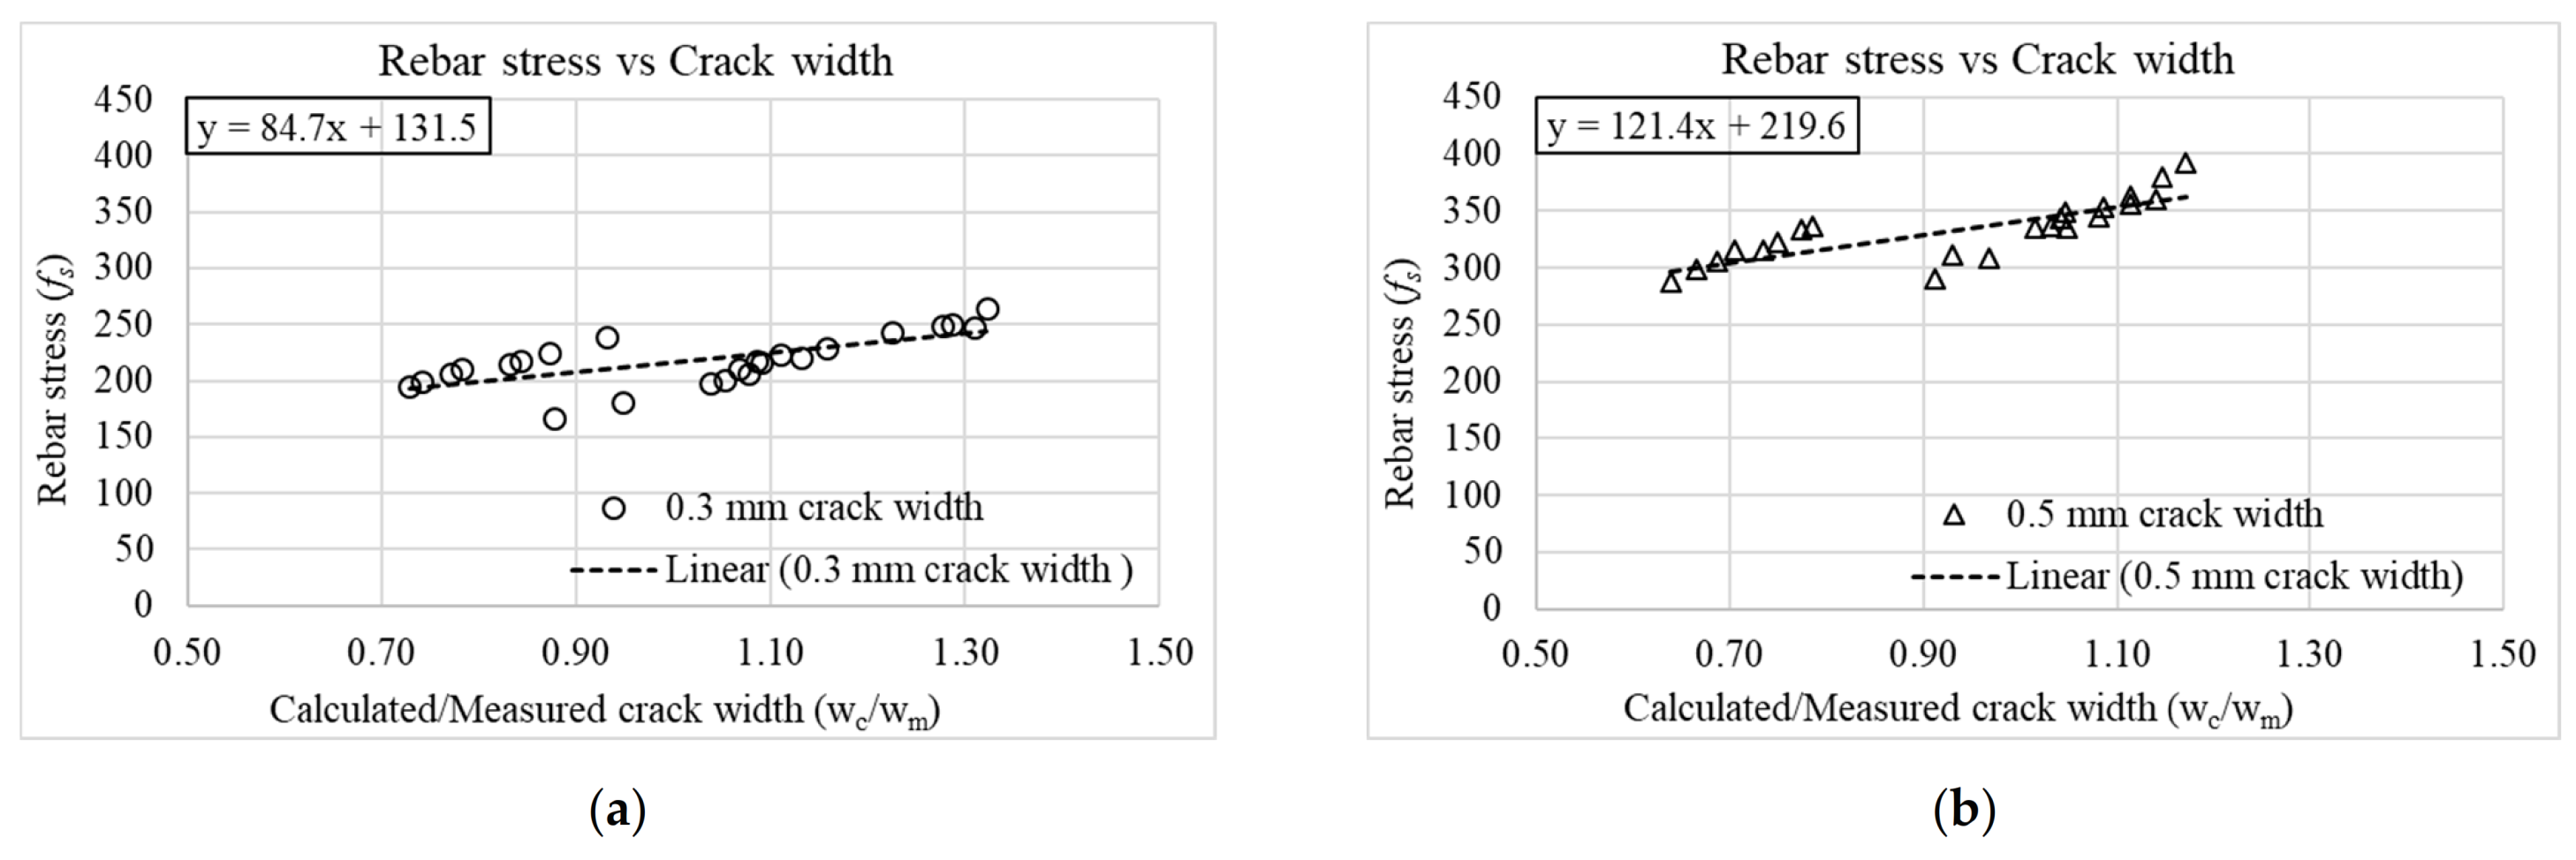
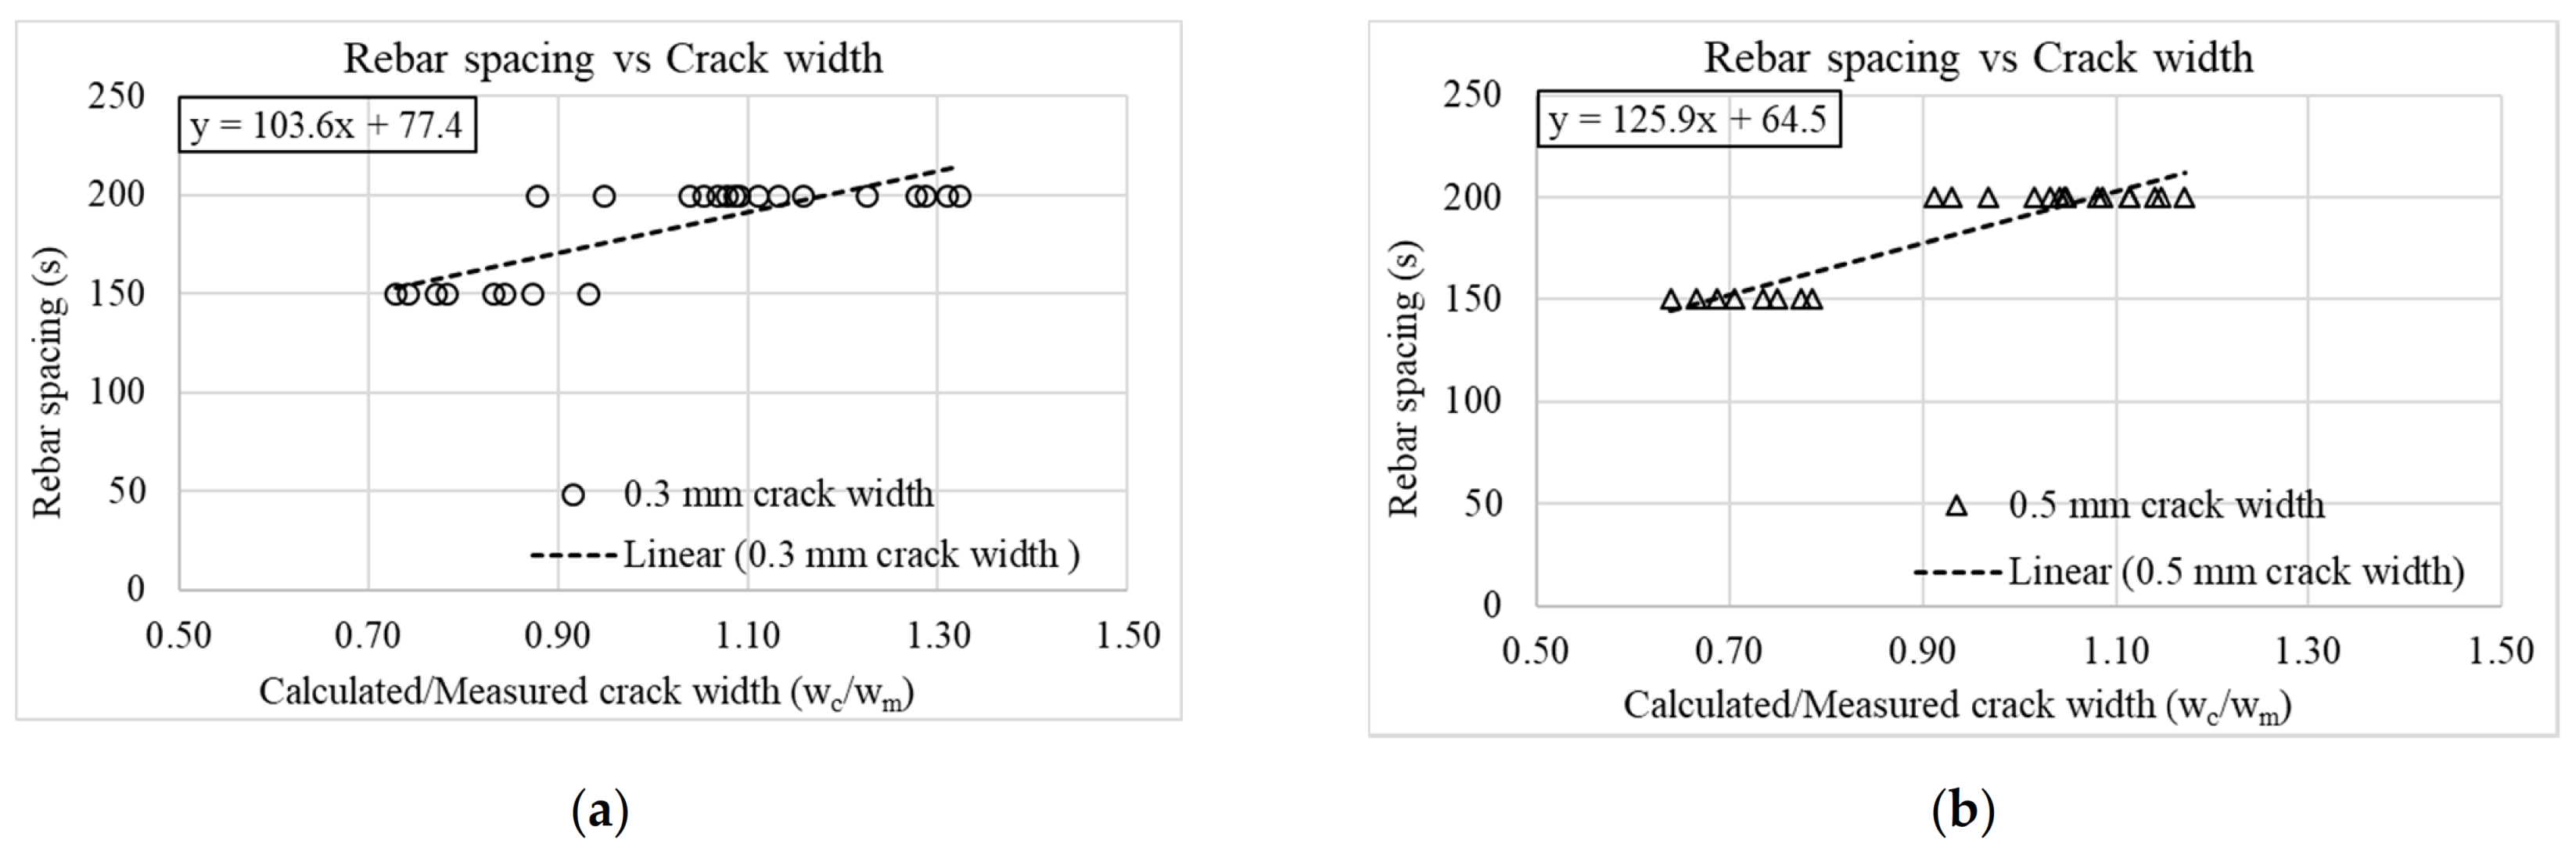
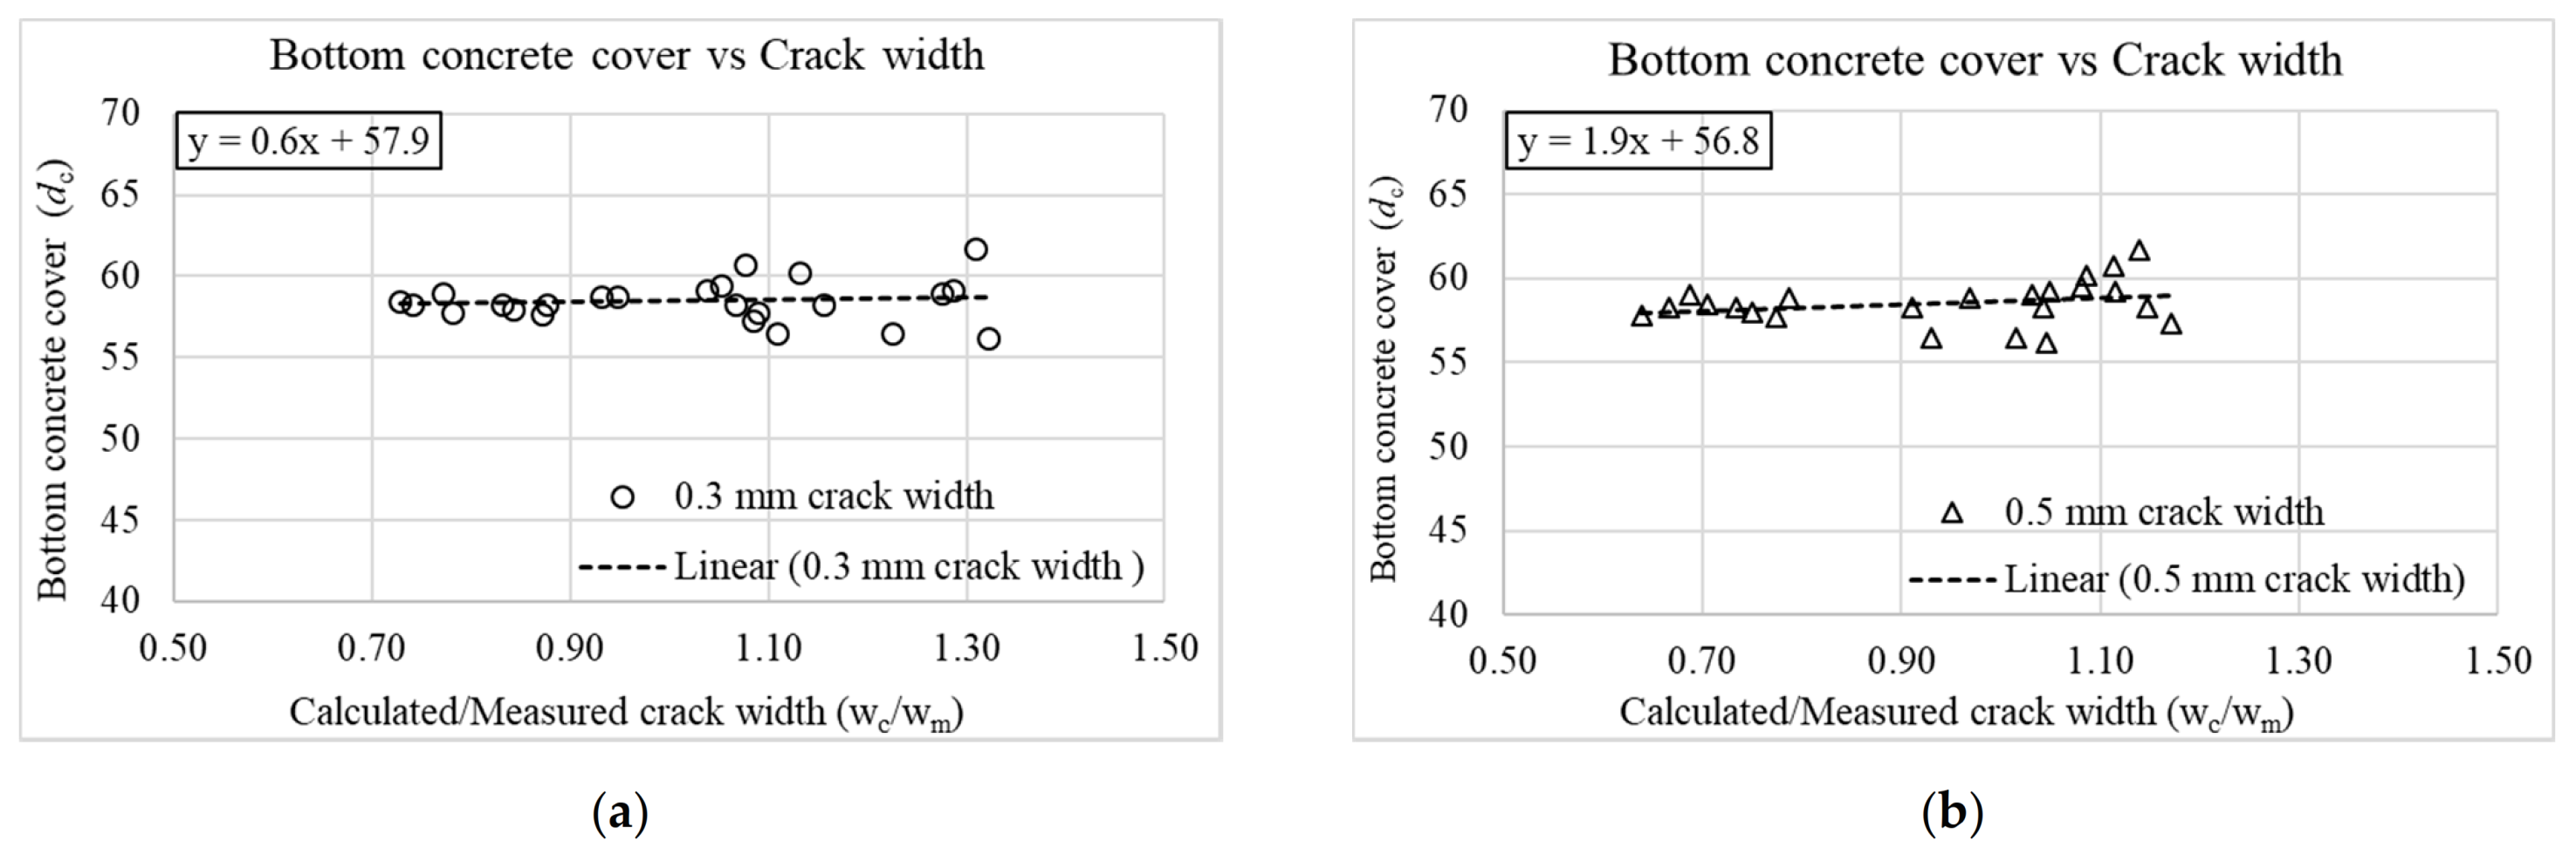
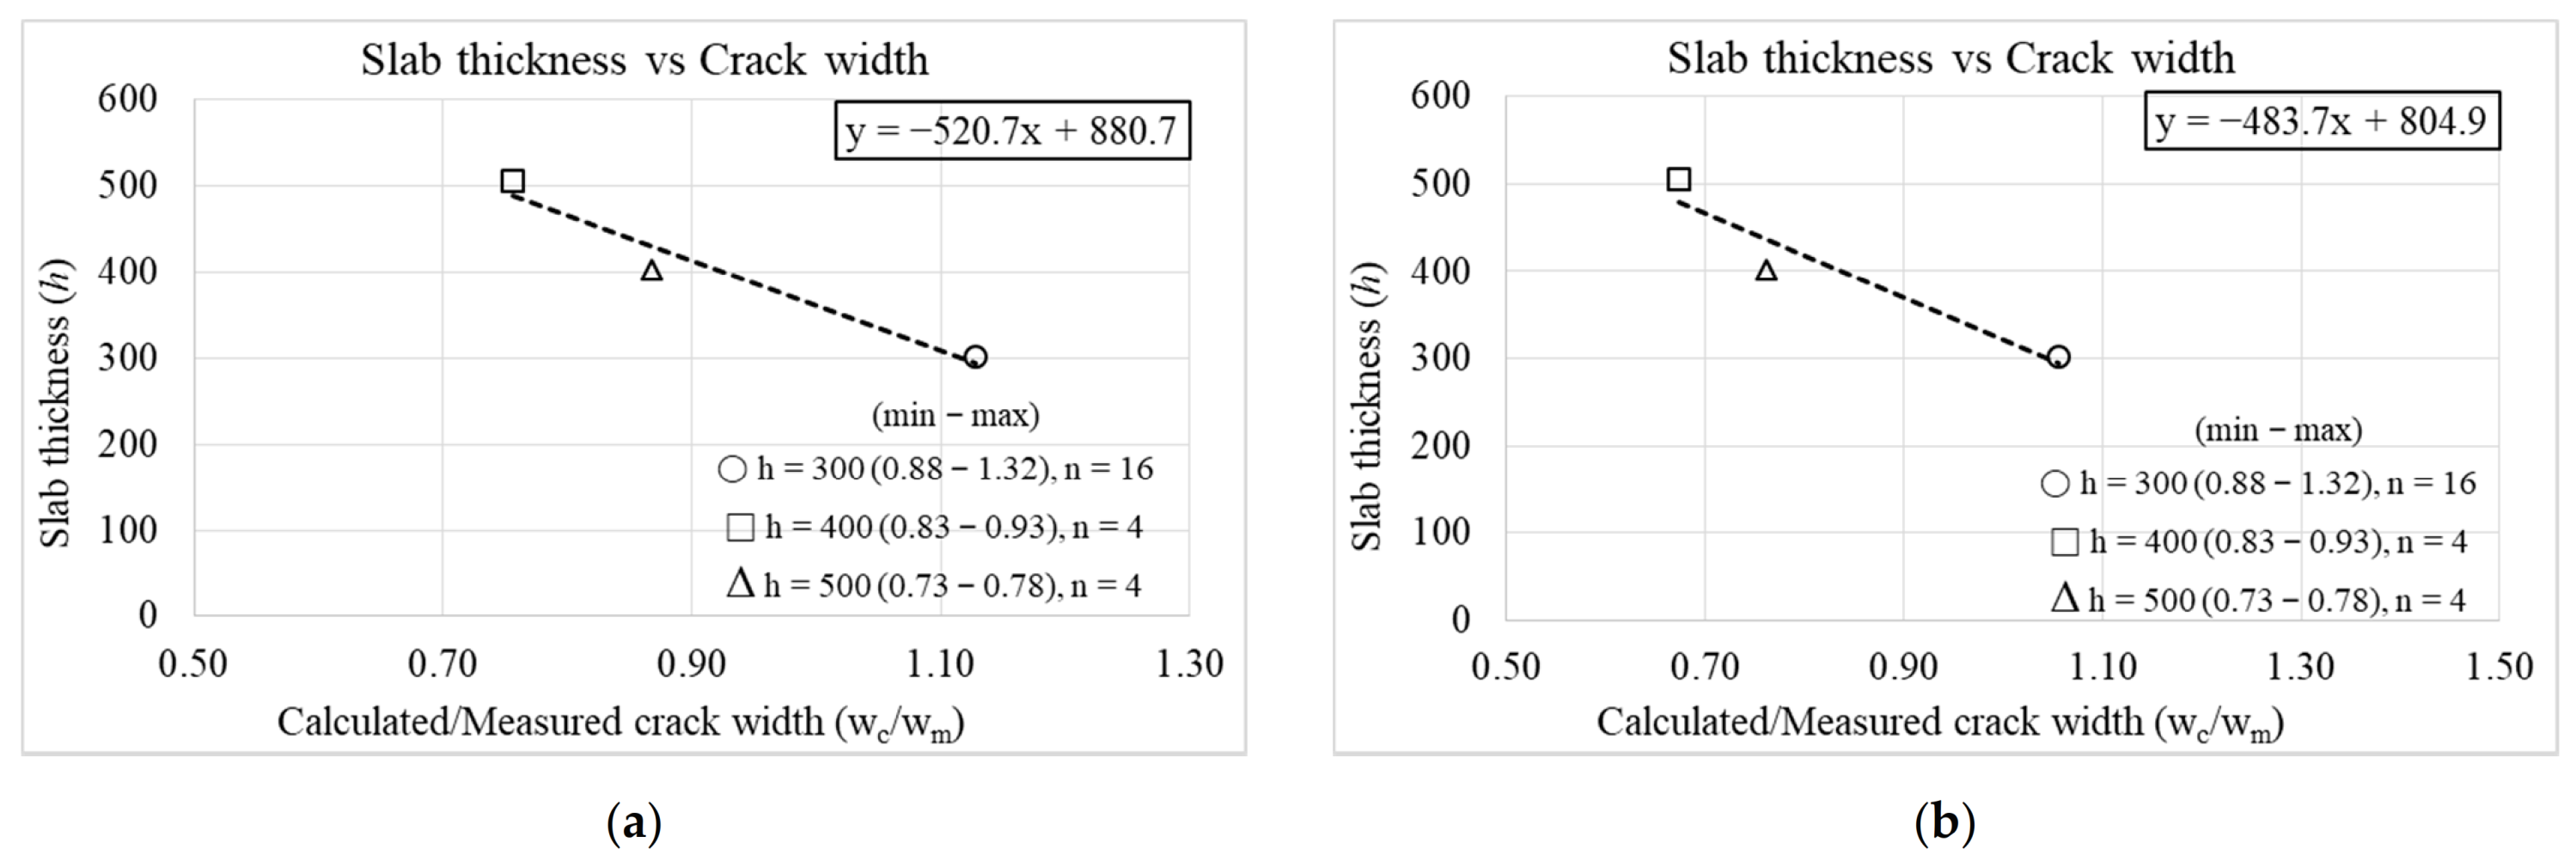
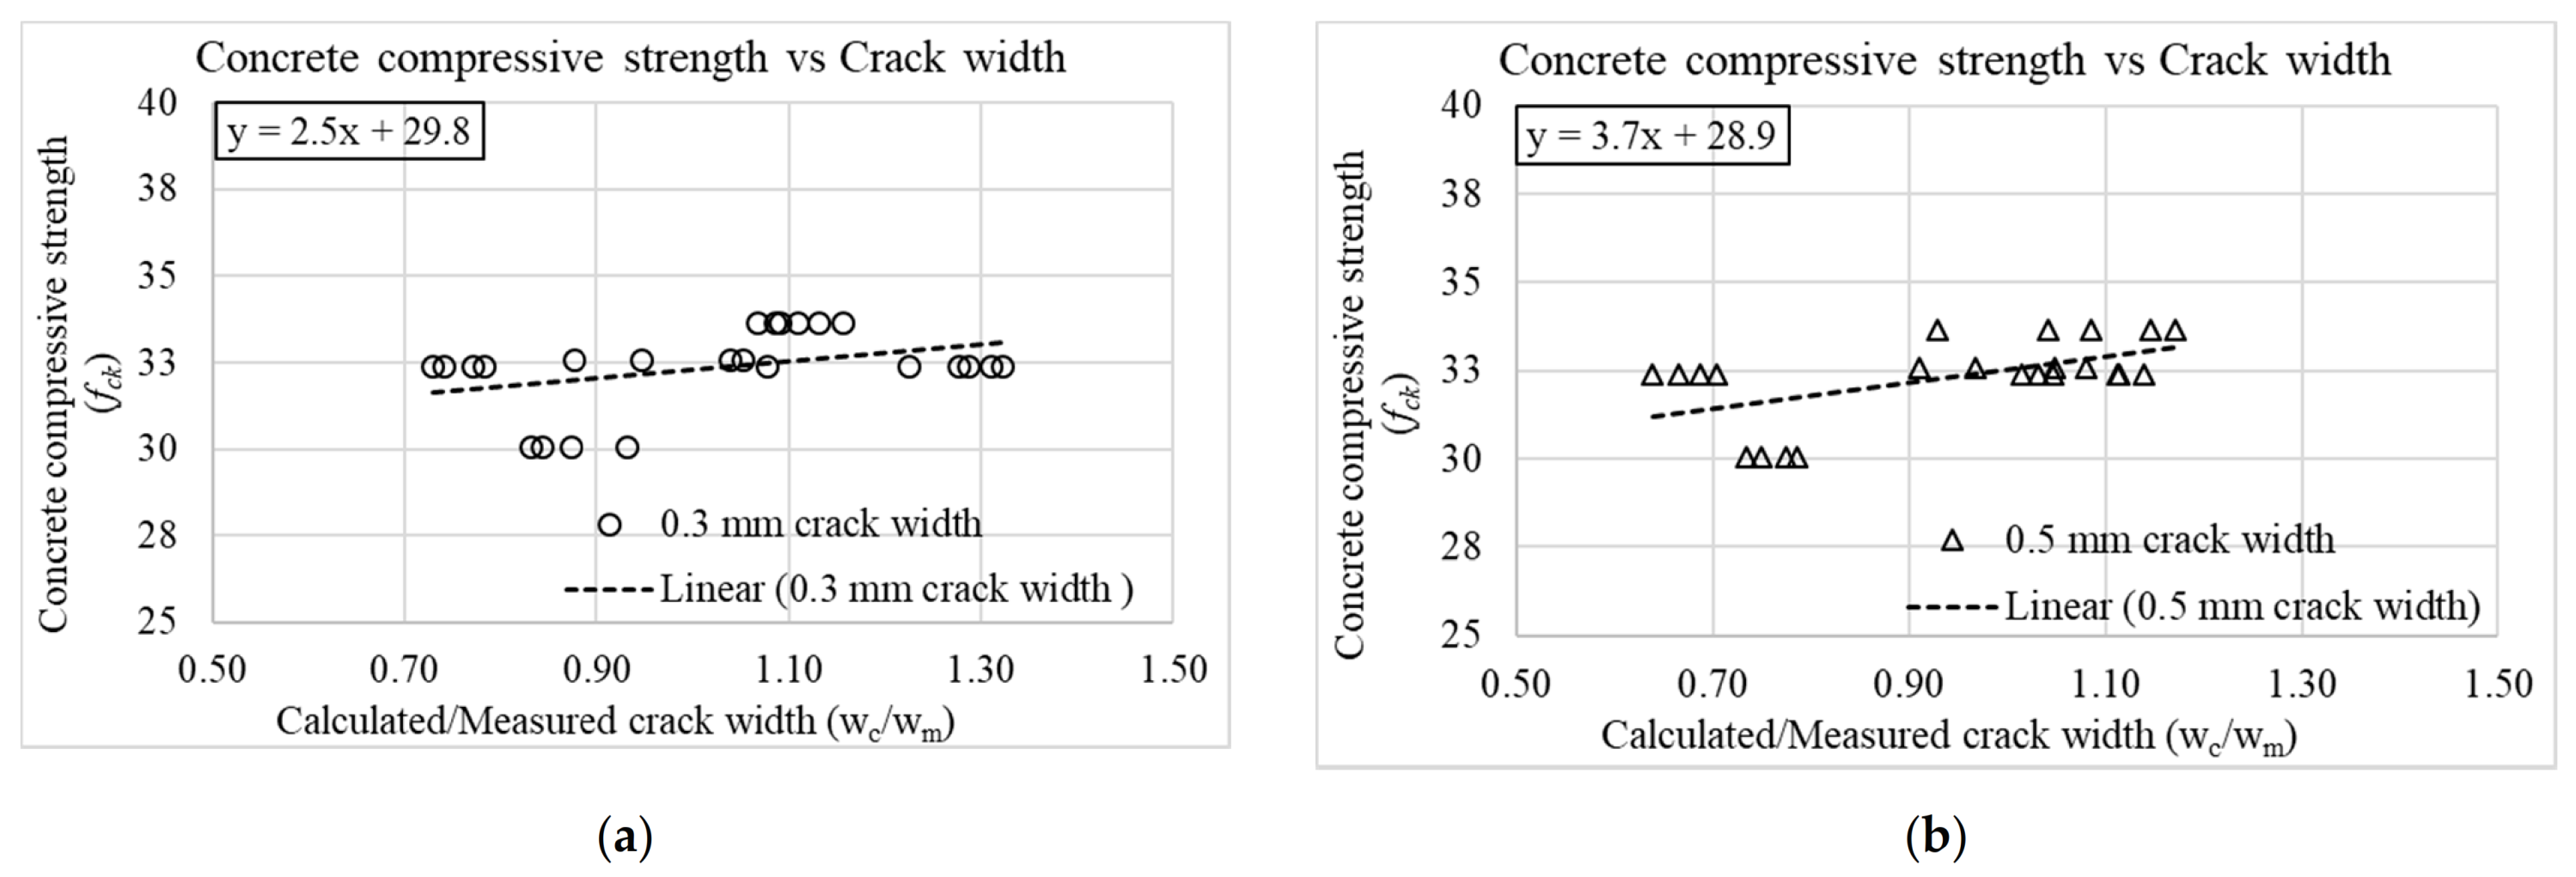
4.3. Effect of Design Variables on Crack Width

The three important parameters in flexural cracking (Equation (1)) are rebar stress, concrete cover depth, and rebar spacing. The relationships between calculated-to-measured crack width ratios regarding the 1st major primary crack and the basic design variables (rebar stress, rebar spacing, bottom concrete cover, slab thickness, and concrete compressive strength) are presented in Figure 7, Figure 8, Figure 9, Figure 10 and Figure 11. The rebar stress and calculated-to-measured crack width ratio show a linear relationship, as demonstrated in Figure 7. In Figure 8, it is found that Frosch’s model generates different estimation errors for different rebar spacings. As shown in Figure 8, Frosch’s model provides lower crack width estimations for smaller rebar spacing (thicker slab specimens). However, more experimental work is needed to verify this trend. Figure 9 does not show a clear trend between the calculated-to-measured crack width ratio and bottom concrete cover. However, this may be because there is only one nominal bottom cover size for all specimens in this study. In Figure 10, it is found that Frosch’s model underestimates the crack width with increasing the slab thickness. In Figure 10, the average value for each nominal thickness is plotted. There is no strong relationship between concrete compressive strength and crack width estimation by Frosch’s model (Figure 11). However, it should be noted that the concrete compressive strength did not vary significantly (30.1–33.7 MPa) in this study.

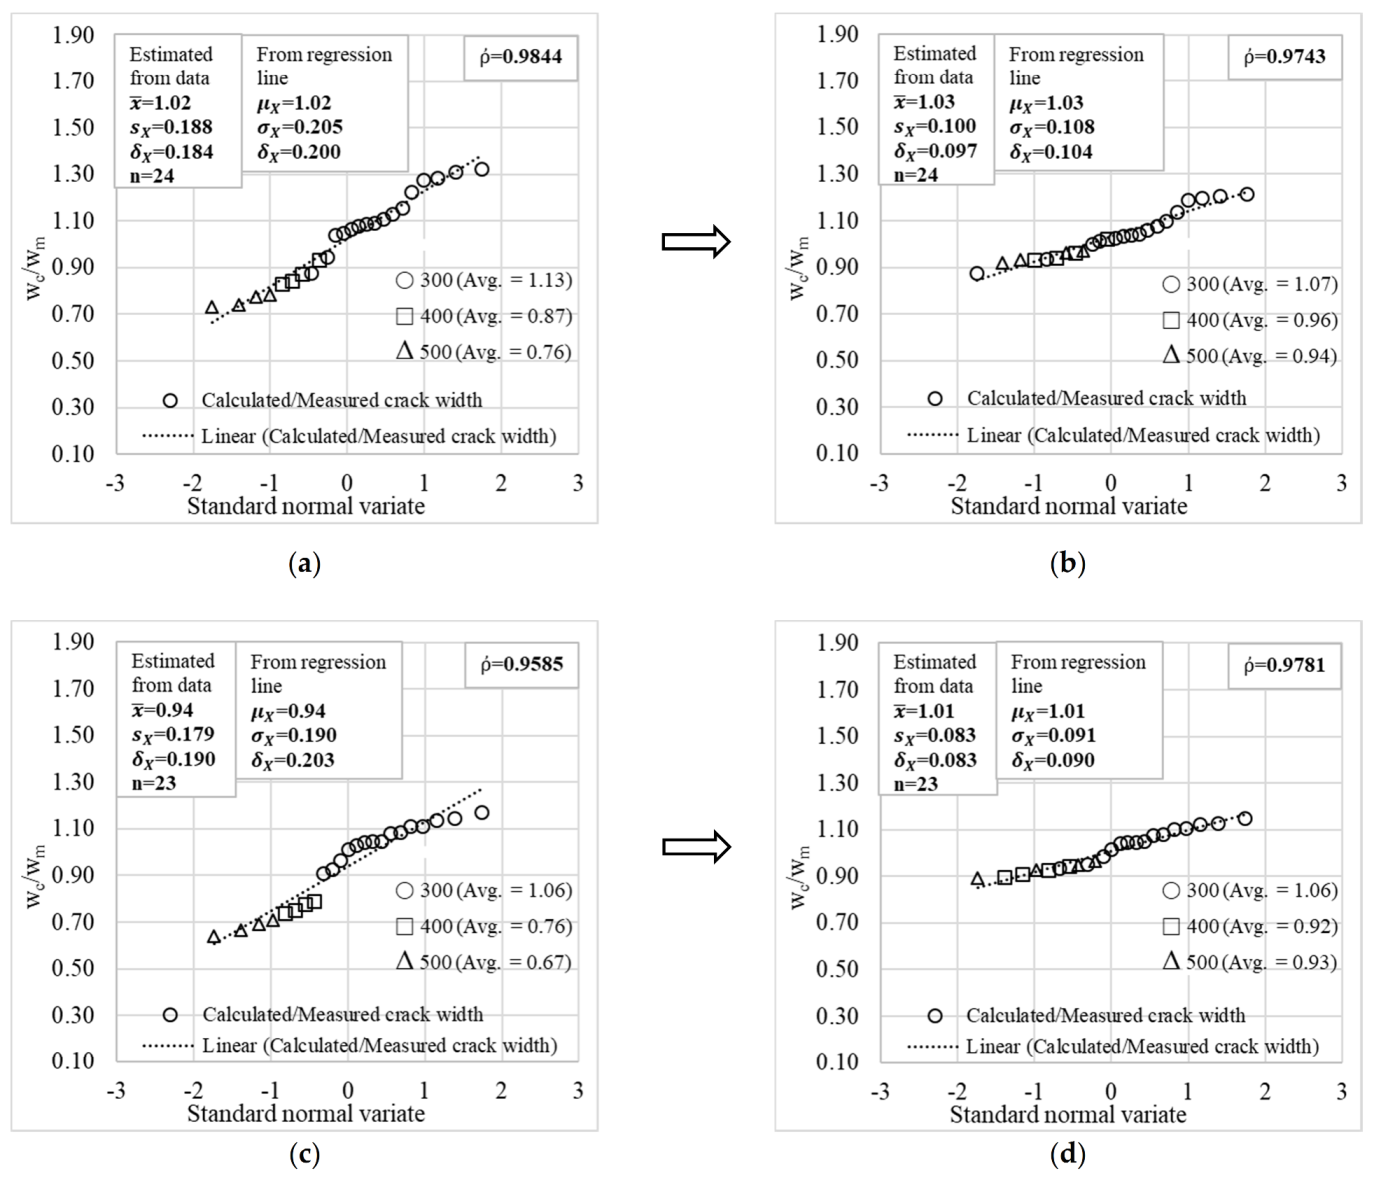
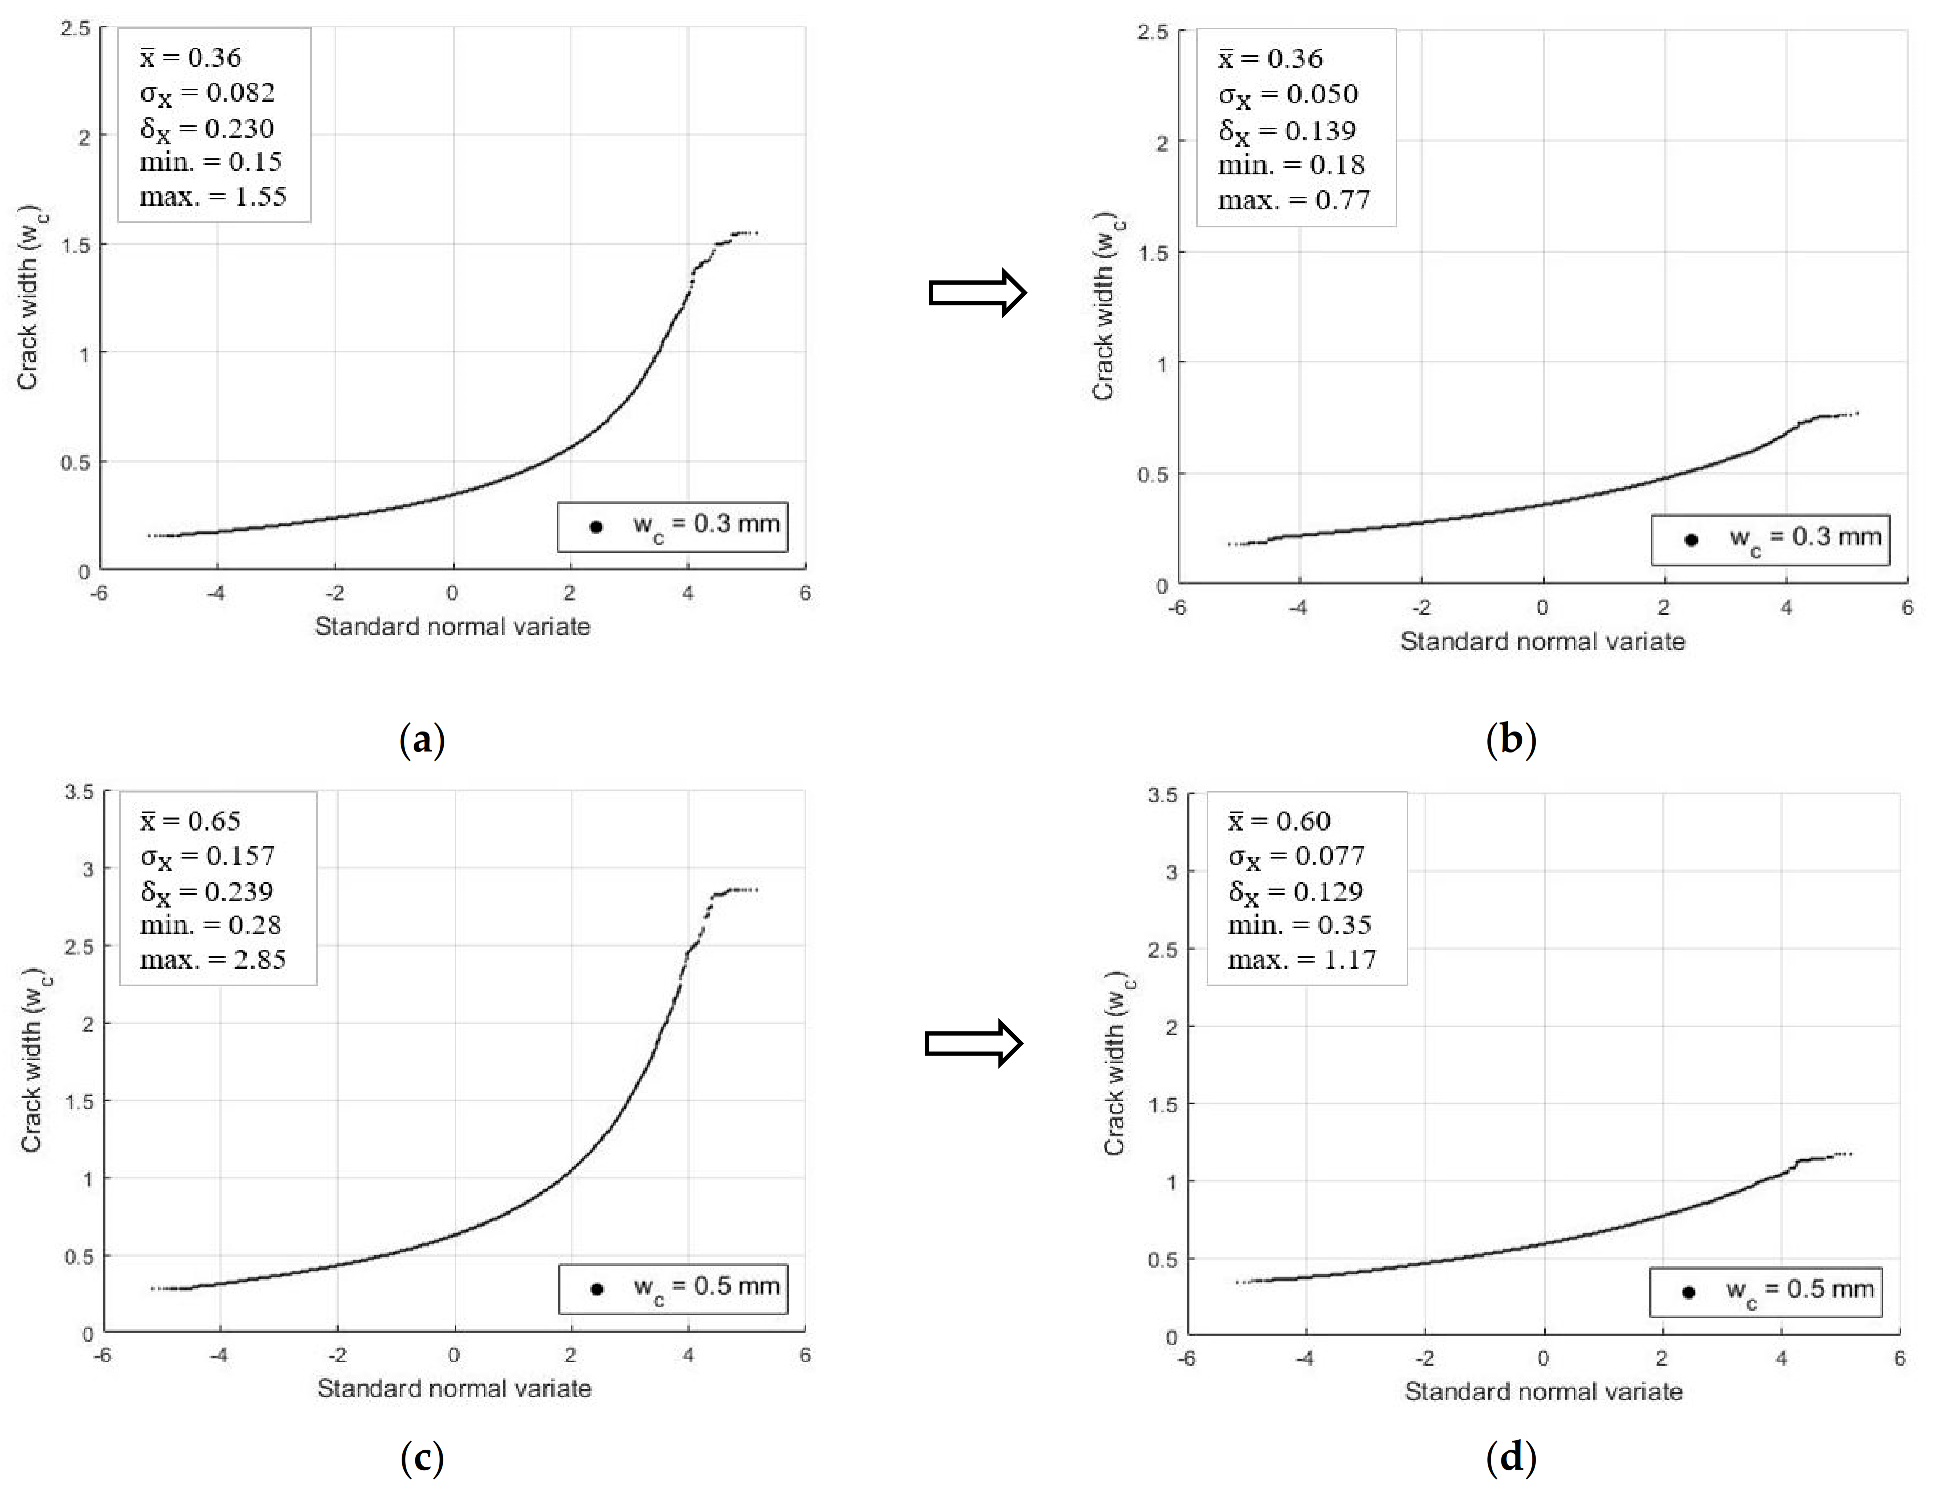
4.4. Correction Factor for Frosch’s Crack Width Estimation Equation

Frosch’s [16] model is found to generate larger differences between measurements and crack width estimations for RC flexural members with thicker slabs (bar spacings were smaller). Frosch’s equation underestimates the crack widths with the increase in the thickness of the slab member. Correction factor related to slab thickness is calculated based on the regression analysis of crack width ratios with the thicknesses of slab members. A correction factor to the original equation (Equation (1)) related to the slab member thickness is proposed as follows:
w c = 2 f s E s d c 2 + s 2 2 × ϒ c
where ϒ c is the correction factor suggested in this study to reduce the crack estimation error for the first major crack as follows:
ϒ c = 0.4 × e 0.7 h 350 0.8 for   0.3   mm   crack   width
ϒ c = 0.4 × e 0.85 h 350 0.8 for   0.5   mm   crack   width
where h is the slab thickness (mm).
Crack widths were estimated using this modified equation (Equation (3)) and the estimated-to-measured crack width ratios for the first major crack were calculated to check the modified equation’s improvement in estimations. The improvement in the crack width estimation after applying the correction factor is presented in Figure 12 and Table 5, in which the error variations are reduced from 0.184 (cov) in the original estimations to 0.097 (cov) after adopting the correction factors for the cracks with 0.3 mm widths. The variation is reduced from 0.190 (cov) to 0.083 (cov) for cracks with 0.5 mm widths. In addition, the underestimation in the original equation (Equation (1)) has been improved from x ¯ (mean ratio of estimated/measured) = 0.94 to x ¯ = 1.01, for the 0.5 mm cracks.
Crack widths were also measured for the second and third cracks for some selected specimens, as presented in Table 6 and Table 7. The ratio of estimated-to-measured crack width is provided for all cases. In Table 6 and Table 7, the 1st, 2nd, and 3rd represent the first, second, and third cracks observed during the testing. Crack widths of 0.3 and 0.5 mm occur in the later stage of the loading for the second and third cracks than the first crack. As shown in the last two columns of Table 6, the estimated crack width could be overestimated up to 7% from first to second crack and 13% from first to third crack for the 0.3 mm crack width. The data from the third crack for specimens SA-H22 (PL)-1 and SK-H22 (PR)-2 are excluded in Table 7 because the third crack occurs at quite a later stage of the loading with higher bar stresses, and it was not meaningful to make comparisons with the estimations.

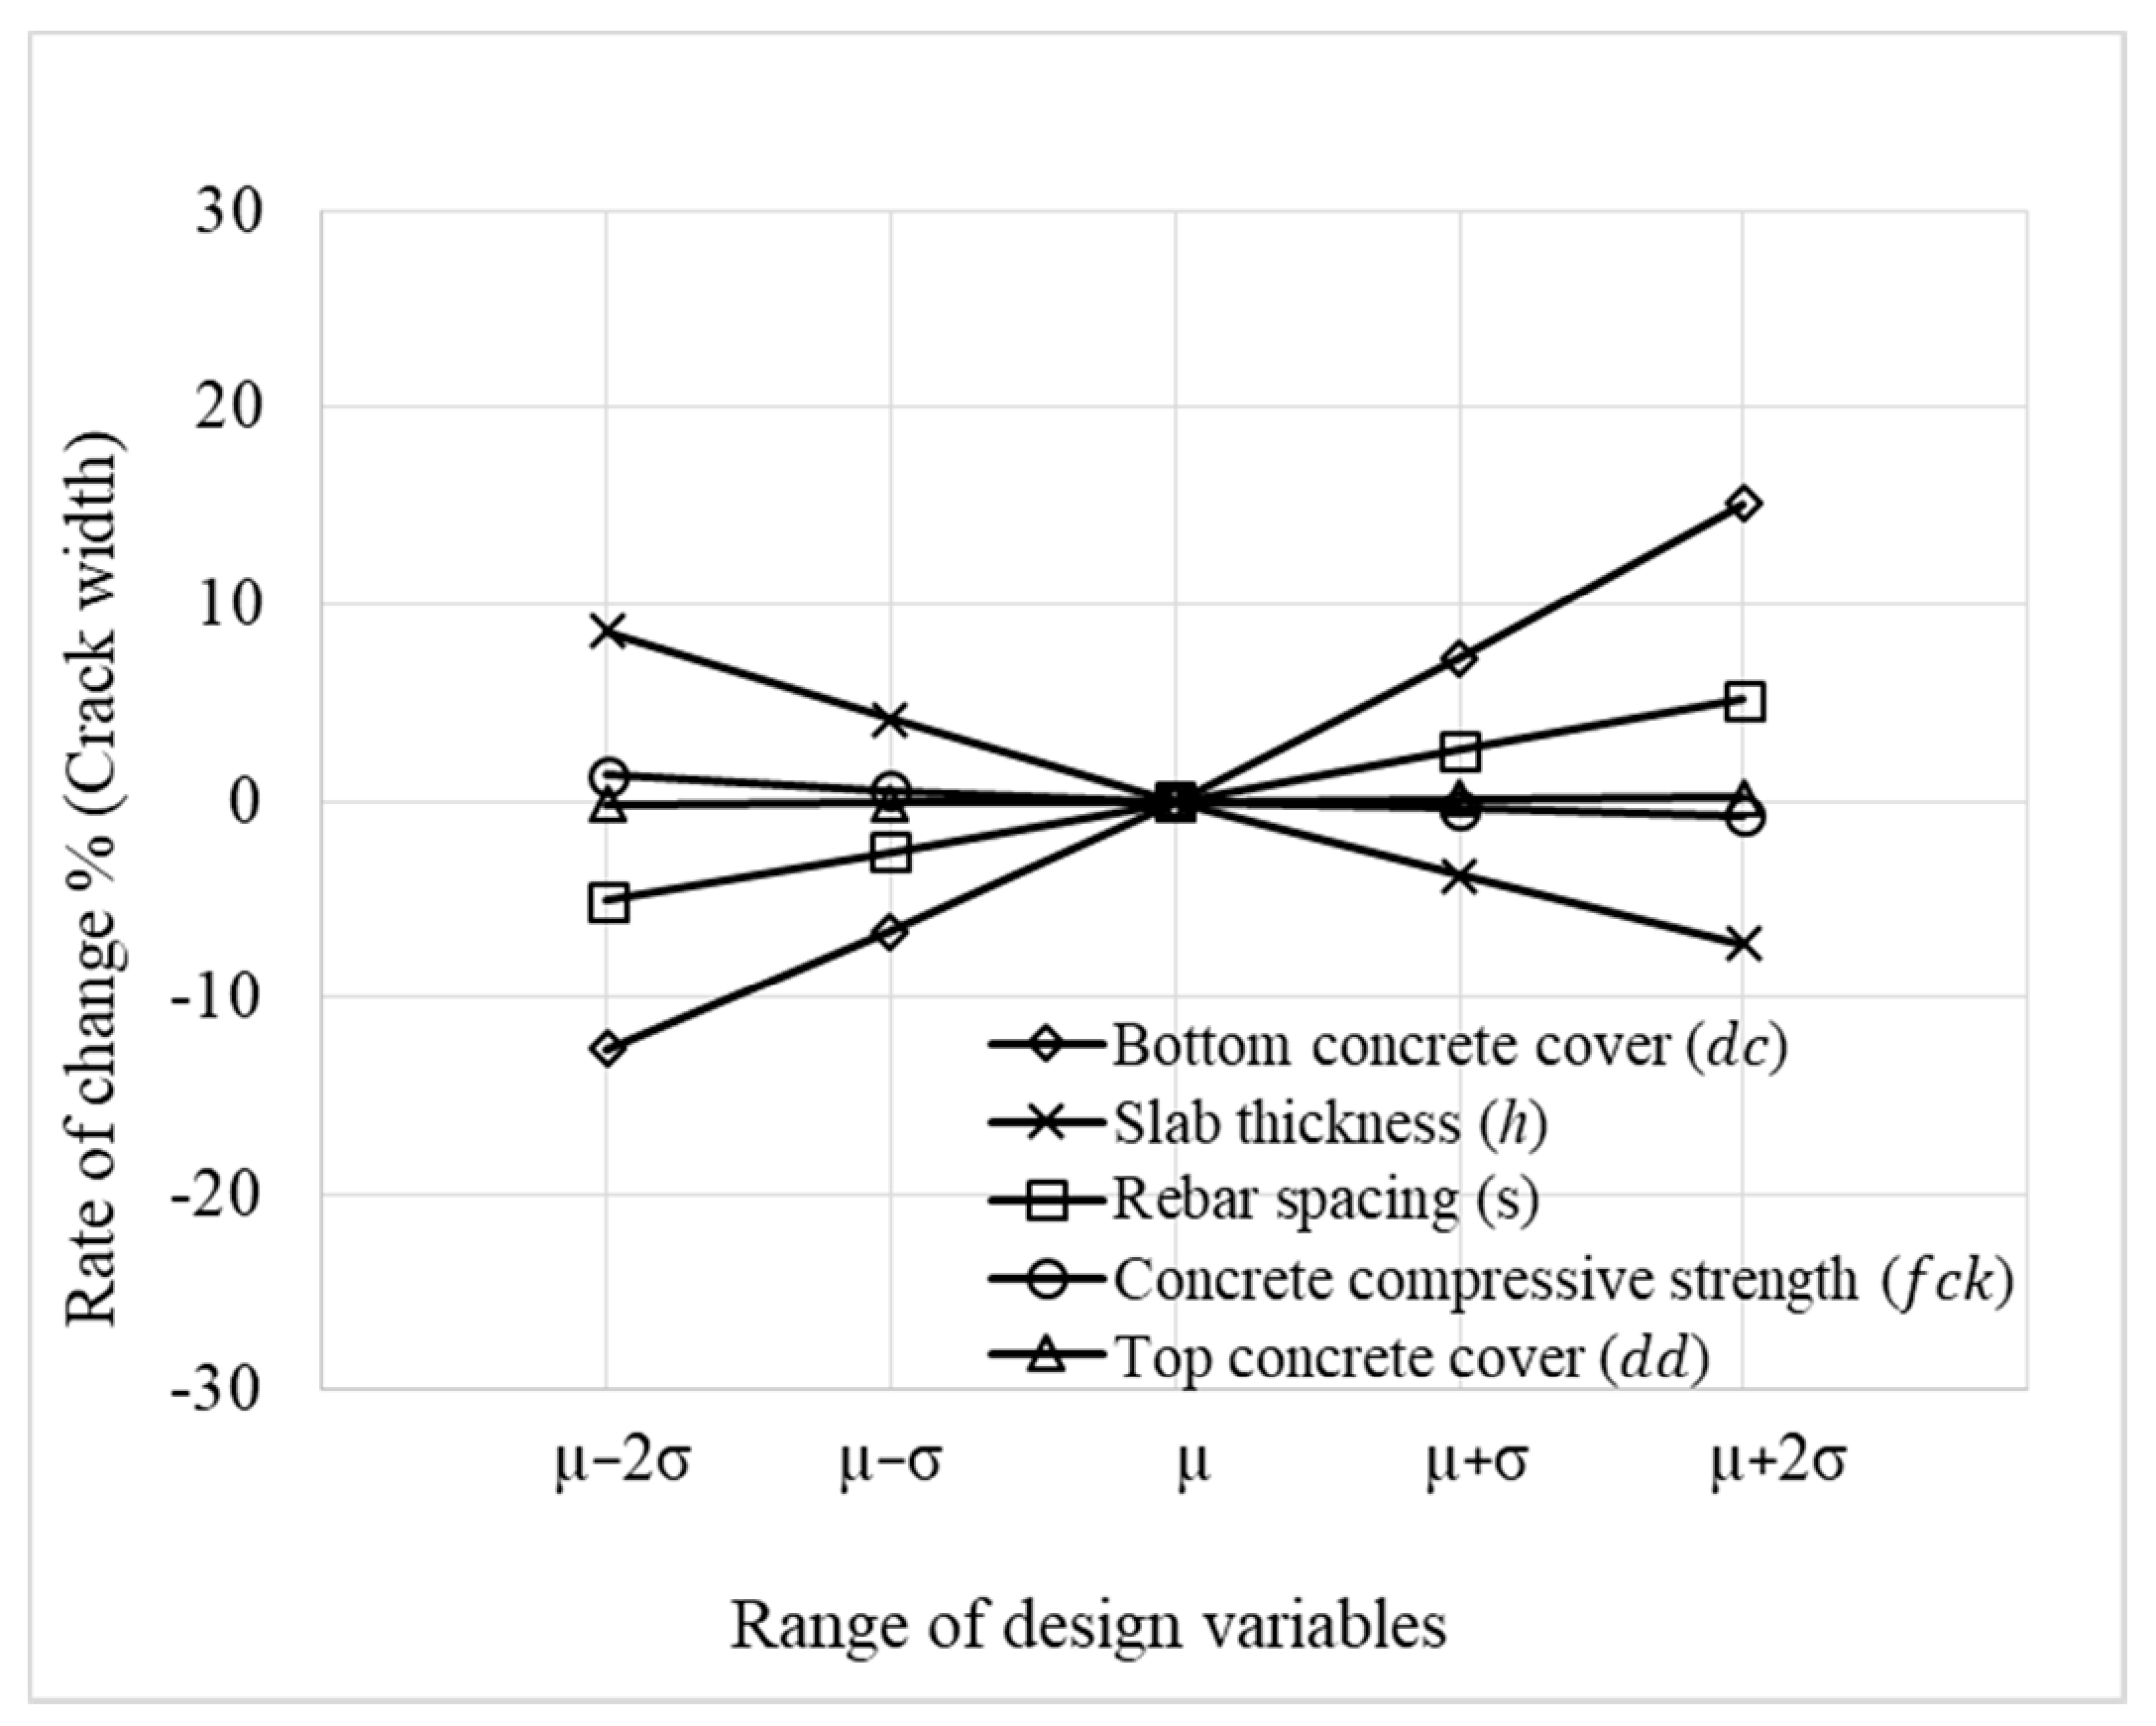
4.5. Sensitivity Analysis of Crack Width

The sensitivity analysis of the crack widths in the RC slabs in the underground box culverts is performed to evaluate the effects of basic design variables through Monte Carlo simulations. The numerical simulations are performed for µ 2 σ , µ σ , µ , µ + σ , and µ + 2 σ . The compressive strength of concrete f c k , rebar spacing s , slab thickness h , bottom concrete cover d c , and top concrete cover d d are selected as basic variables. The statistical information for the basic design variables is given in Table 8. The results of the sensitivity analysis for the first major crack in the positive moment region are presented in Figure 13 and Table 9.
As illustrated in Figure 13, crack widths are most sensitive to the bottom concrete cover ( d c ), slab thickness ( h ), and rebar spacing (s), which directly affects the crack width estimations through the suggested model (Equation (3)). The crack width is changed with a rate from −12.65% to 15.15% due to the bottom concrete cover deviation ( ± 2 σ ), and from 8.64% to −7.24% due to the slab thickness deviation ( ± 2 σ ). The crack width changes from −5.08% to 5.17% for rebar spacing (s). For parameters such as the compressive strength of concrete, and top concrete cover, the rate of change is between 1.31% and −0.76%, and −0.17% and 0.17%, respectively, with minimal influence on crack widths.

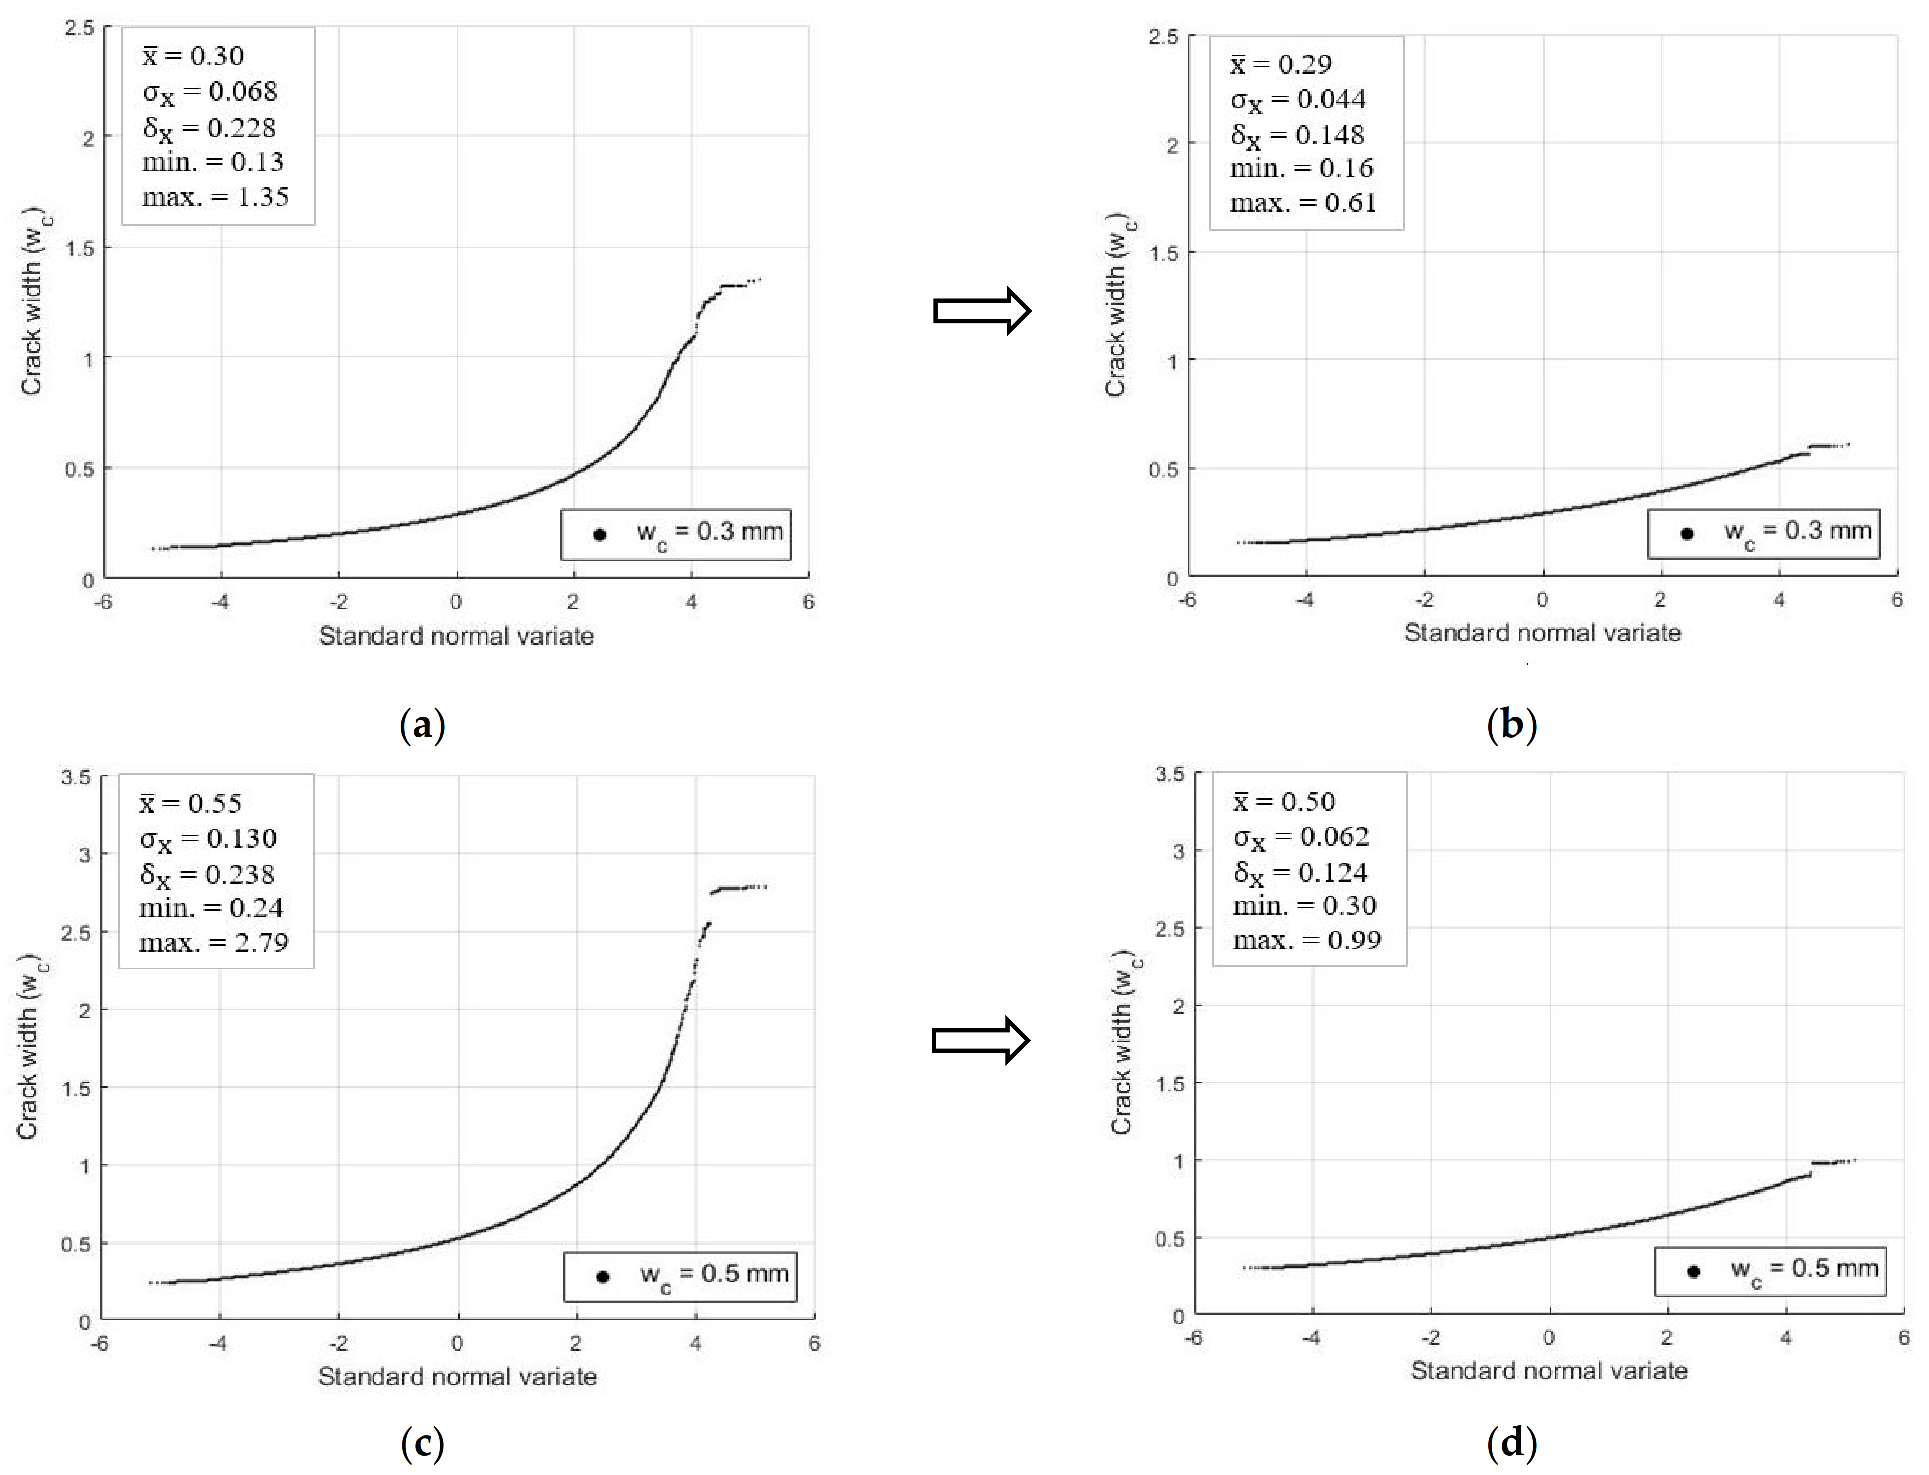
5. Probability-Based Crack Width Factors

Nominal design surface crack widths of either 0.3 mm or 0.5 mm were calculated using the nominal values of the basic design variables for each case of slab specimen with Equations (1) and (3). Crack widths are also calculated considering the variability inherent in the basic design variables. The probabilistic characteristics of the crack widths are evaluated through Monte Carlo simulations based on the probabilistic models of basic design variables, including the compressive strength of concrete f c k , rebar spacing biasness λ s , slab thickness biasness λ h , bottom concrete cover d c , top concrete cover d d , and the probabilistic models of experimental crack width biasness ( λ c ).
Probabilistic models of all basic design variables are presented in Table 8 and were selected based on studies from Kim et al. [15] except the probabilistic model of rebar spacing biasness ( λ s ). A probabilistic model for rebar spacing biasness is developed from the information collected from various construction sites of underground RC box culverts in Korea. Probabilistic models of crack width biasness are summarized in Table 10, in which the means and covariances are estimated from the cumulative density function of the calculated-to-measured crack width ratios summarized in Figure 12.
The thickness of the simulation slab model ranges from 300 to 500 mm. The sectional area of the bottom reinforcement in the tension side varies from 993 mm2 to 2578 mm2, which are widely used design values for underground RC box culverts in Korea, and the area of the upper reinforcement in the compression side is taken as half of the bottom rebar area. Different simulation sizes were assigned to various slab models based on the inventory survey, as presented in Table 11. The basic simulation size was 100 K. The slab with a thickness of 300 mm and bottom rebar area of 1324 mm2 had a weight factor of 20, as shown in Table 11. Therefore, 2000 K simulations were conducted for cracks with a crack width of both 0.3 mm and 0.5 mm. For the slab with a thickness of 500 mm and bottom rebar area of 1324 mm2, 100 K simulations were conducted. Therefore, in total, 8300 K simulation results were conducted to investigate each crack width model for RC slabs in underground box culverts.
The Monte Carlo simulation results considering both the original (Equation (1)) and the modified (Equation (3)) equations are plotted in Figure 14 on a normal probability paper for 0.3 mm and 0.5 mm crack widths regarding the first major crack in the positive moment region (mid-span, bottom surface of the top slab). The results for the negative moment region (support area, top surface of the top slab) are plotted in Figure 15. The Monte Carlo simulation results plotted in Figure 14 and Figure 15 both demonstrate that the modified equation has a better fitting to the normal probability distribution function compared to the original equation (Equation (1)).
The probability of having crack widths of 0.3 mm or 0.5 mm may be higher than expected due to the construction error and variability in design parameters. The mean value of the bottom concrete cover based on the information collected from the local construction sites is 71.5 mm for the design value of 60 mm, which is normally expected due to the difficulty of quality control in underground box culvert constructions. Moreover, the crack widths for the RC flexural members in the underground box culverts are sensitive to the bottom concrete cover depth. Even properly designed members can reach the target crack width of 0.3 mm or 0.5 mm at a much lower rebar stress level than the design bar stress level due to the increase in bottom concrete cover. The crack width estimations can be improved by introducing a design factor to control the occurrence probability for the target design crack width. The probability-based crack width factor, ϕ w , can be multiplied to the crack width estimation equation, Equation (3), as in the following equation for design purposes:
w c = ϕ w 2 f s E s d c 2 + s 2 2 × ϒ c
where w c is the maximum design crack width (mm) is, ϕ w is the probability-based crack width factor, and the expressions in the parenthesis are identical to Equation (3).
Based on the Monte Carlo simulation results with the modified equation (Equation (3)), the crack width factors ( ϕ w ) are derived to obtain the target crack width levels of 0.3 mm and 0.5 mm depending upon the target reliability level. The safety index, β , is directly calculated from the Monte Carlo simulation results without considering the probability distribution function. The various crack width factors ( ϕ w ) are provided in Table 12 and Table 13 for the positive moment region (mid-span, bottom surface) and negative moment region (support area, top surface) of the top slab for the first major crack, respectively. Although crack width control is a serviceability limit, for structures that require better control by the owner’s request, such factors can be multiplied as a correction factor to consider the construction variability between as-built dimensions and design parameters/dimensions on drawings. The safety levels to be achieved by adopting the crack width factors are also tabulated in Table 12 and Table 13 (safety index). It is found that the occurrence probability for the first major crack of 0.3 mm at the positive moment region will be very high (0.8932) when the crack width factor is not adopted, that is, adopting ϕ w = 1.0. The occurrence probability can be reduced from 0.8932 to 0.1184 by adopting ϕ w = 1.5. The crack width factor between the tabulated values can be selected by linear interpolation, but an error may occur due to the nonlinearity between the safety index ( β ) and the crack width factors ( ϕ w ).

6. Conclusions

The surface crack widths in RC flexural members for typical underground box culverts built in Korea were studied. Structural members built below the ground, such as underground RC box culverts used for electric power distribution, have more likelihood to have differences between the as-built dimensions and the dimensions provided in design drawings. Due to this variability in construction dimensions, the crack widths measured in such underground structures are more likely to have differences with the calculated values if the thicknesses of the specimens are different than what was used for design. Although crack control is a serviceability concern, if the owner chooses to have a target crack width that needs better control, crack width estimations can be improved by considering this construction variability with a newly proposed probability-based crack estimation model suggested in this study. Monte Carlo simulations were conducted to evaluate the probabilistic characteristics of the important parameters that control the crack widths in RC flexural members. These parameters include the bottom concrete cover and bar spacings provided in such flexural members. The bottom concrete cover depth in the tension surface was found to be the most sensitive design variable based on Monte Carlo simulations. It was found that the mean value of the bottom concrete cover depth, considering the construction variabilities, could increase to 20% higher than the nominal design values. With the increase in bottom concrete cover, the estimated crack widths at the surface become larger with identical bar stresses. With current design practice, it was found from simulations that 0.3 mm (12 mils) cracks can be observed with a probability of 89% in the positive moment region of the top slab, while it is 45% in the negative moment region of the top slab, which is a high potential to see such cracks. Therefore, this study additionally suggests probability-based crack width design factors that can be applied to the current crack estimation models used in design, if the target crack width must be controlled to be below 0.3 mm (12 mils) or 0.5 mm (20 mils) in underground RC box culverts.

Author Contributions

Conceptualization and methodology, S.-H.K. and S.-K.W.; experiment and formal analysis, S.H.A.S.; investigation, S.H.A.S. and C.S.; writing—original draft preparation, S.H.A.S. and C.S.; writing—review and editing, C.S. and S.-H.K.; project administration, S.-K.W. and I.C. All authors have read and agreed to the published version of the manuscript.

Funding

This research work is supported by the Korea Electric Power Research Institute (Grant R18SA02) as well as the Korea Institute of Energy Technology Evaluation and Planning (KETEP) and the Ministry of Trade, Industry and Energy (MOTIE) of the Republic of Korea. (No. 20194030202460).

Institutional Review Board Statement

Not applicable.

Informed Consent Statement

Not applicable.

Data Availability Statement

Not applicable.

Conflicts of Interest

The authors declare no conflict of interest.

References

  1. Clark, A.P. Cracking in reinforced concrete flexural members. ACI J. Proc. 1956, 52, 851–862. [Google Scholar]
  2. Broms, B.B. Crack width and crack spacing in reinforced concrete members. ACI J. Proc. 1965, 62, 1237–1256. [Google Scholar]
  3. Gergely, P.; Lutz, L.A. Maximum crack width in reinforced concrete flexural members. Am. Concr. Inst. 1968, 20, 87–117. [Google Scholar]
  4. Nawy, E.G.; Blair, K.W. Further studies on flexural crack control in structural slab systems. ACI Spec. Publ. 1971, 30, 1–41. [Google Scholar]
  5. Beeby, A.W. The prediction of crack widths in hardened concrete. Struct. Eng. 1979, 57, 9–17. [Google Scholar]
  6. Balázs, G.L. Cracking analysis based on slip and bond stresses. ACI Mater. J. 1993, 90, 340–348. [Google Scholar]
  7. Makhlouf, H.M.; Malhas, F.A. The effect of thick concrete cover on the maximum flexural crack width under service load. ACI Struct. J. 1996, 93, 257–265. [Google Scholar]
  8. ACI Committee 318; Building Code Requirements for Structural Concrete: (ACI 318-95) and Commentary. American Concrete Institute: Farmington Hills, MI, USA, 1995.
  9. BS 8110-2; Structural Use of Concrete, Part 2: Code of Practice for Special Circumstances. British Standard Institution: London, UK, 1985.
  10. Park, R.; Paulay, T. Reinforced Concrete Structures; John Wiley & Sons: New York, NY, USA, 1975. [Google Scholar]
  11. ACI Committee 224; 224R-01: Control of Cracking in Concrete Structures (Reapproved 2008). ACI: Farmington Hills, MI, USA, 2001.
  12. Colotti, V.; Spadea, G. An analytical model for crack control in reinforced concrete elements under combined forces. Cem. Concr. Compos. 2005, 27, 503–514. [Google Scholar] [CrossRef]
  13. Kwak, H.G.; Song, J.Y. Cracking analysis of RC members using polynomial strain distribution function. Eng. Struct. 2002, 24, 455–468. [Google Scholar] [CrossRef]
  14. Visintin, P.; Sturm, A.B.; Oehlers, D.J. Long- and short-term serviceability behavior of reinforced concrete beams: Mechanics models for deflections and crack widths. Struct. Concr. 2018, 19, 489–507. [Google Scholar] [CrossRef]
  15. Kim, S.H.; Boldoo, T.; Kim, D.Y.; Chu, I.; Woo, S.K. Probabilistic Moment Capacity Models of RC Slab Members for Underground Box Culverts. Appl. Sci. 2021, 11, 8520. [Google Scholar] [CrossRef]
  16. Frosch, R.J. Another look at cracking and crack control in reinforced concrete. ACI Struct. J. 1999, 96, 437–442. [Google Scholar]
  17. ACI Committee 318; Building Code Requirements for Structural Concrete: (ACI 318-19) and Commentary. American Concrete Institute: Farmington Hills, MI, USA, 2019.
  18. Kaar, P.B.; Mattock, A.B. High strength bars as concrete reinforcement, Part 4, Control of cracking. J. PCA Res. Dev. Lab. 1963, 5, 15–38. [Google Scholar]
  19. Beeby, A.W. The prediction and control of flexural cracking in reinforced concrete members. Cracking, deflection, and ultimate load of concrete slab systems. Am. Concr. Inst. 1971, 20, 55–76. [Google Scholar]
  20. CEB. CEB-FIP Model. Code 90; CEB: London, UK, 1992. [Google Scholar]
  21. EN1992-1-1; Eurocode 2–1992, Design of Concrete Structures, Part 1.1: General Rules and Rules for Buildings. European Committee for Standardization: Brussels, Belgium, 2004.
Figure 1. Underground RC box culverts for power supply (unit: mm).
Applsci 12 02063 g001
Figure 2. (a) RC slab dimensions (unit: mm); (b) Cross-section of 300 mm thick RC slab (unit: mm); (c) Cross-section of 400 and 500 mm thick RC slab (unit: mm).
Applsci 12 02063 g002
Figure 3. Four-point flexural RC slab test setup (unit: mm).
Applsci 12 02063 g003
Figure 4. SA-H16-PR-2 specimen (a) with the 1st 0.3 mm crack, (b) after the failure of the slab, and SH-H19-PR-2 specimen (c) with the 1st 0.3 mm crack, (d) after the failure of the slab.
Applsci 12 02063 g004
Figure 5. Measured vs. calculated initial cracking load (unit: KN).
Applsci 12 02063 g005
Figure 6. CDFs for the ratio of calculated-to-measured crack widths for (a) 0.3 mm and (b) 0.5 mm crack widths (Equation (1)).
Applsci 12 02063 g006
Figure 7. Rebar stress and calculated-to-measured crack width ratios for (a) 0.3 mm and (b) 0.5 mm crack widths (Equation (1)).
Applsci 12 02063 g007
Figure 8. Rebar spacing and calculated-to-measured crack width ratios for (a) 0.3 mm and (b) 0.5 mm crack widths (Equation (1)).
Applsci 12 02063 g008
Figure 9. Bottom concrete cover and calculated-to-measured crack width ratios for (a) 0.3 mm and (b) 0.5 mm crack widths (Equation (1)).
Applsci 12 02063 g009
Figure 10. Slab thickness and calculated-to-measured crack width ratios for (a) 0.3 mm and (b) 0.5 mm crack widths (Equation (1)).
Applsci 12 02063 g010
Figure 11. Concrete compressive strength and calculated-to-measured crack width ratios for (a) 0.3 mm and (b) 0.5 mm crack widths (Equation (1)).
Applsci 12 02063 g011
Figure 12. CDFs for the calculated-to-measured crack width ratios produced by the (a) original equation for 0.3 mm crack width, (b) modified equation for 0.3 mm crack widths, by the (c) original equation for 0.5 mm crack width, and (d) modified equation for 0.5 mm crack widths.
Applsci 12 02063 g012
Figure 13. Sensitivity analysis of crack width of RC slab (first major crack in the positive moment region).
Applsci 12 02063 g013
Figure 14. Distribution of simulated crack widths: (a) Original equation (Equation (1)); (b) Modified equation (Equation (3)) for 0.3 mm crack; (c) Original equation (Equation (1)); (d) Modified equation (Equation (3)) for 0.5 mm crack widths at the positive moment region of the top slab (first major crack).
Applsci 12 02063 g014
Figure 15. Distribution of simulated crack widths: (a) Original equation (Equation (1)); (b) Modified equation (Equation (3)) for 0.3 mm; (c) Original equation (Equation (1)); (d) Modified equation (Equation (3)) for 0.5 mm crack widths at the negative moment region of the top slab (first major crack).
Applsci 12 02063 g015
Table 1. Dimensions of RC slab specimens.
ParameterSpecimens
SA-H16SA-H19SA-H22SA-H25SH-H19SK-H22
Number of specimens662244
d d (mm)808080808080
a (mm)160160160160260360
d c (mm)606060606060
h (mm)300300300300400500
d (mm)240240240240340440
L (mm)300030003000300030003500
Rebar diameter (mm)161922251922
Tensile reinforcement ratio (%)0.410.600.811.060.590.62
Table 2. Concrete compressive strength.
ParameterSpecimens
SA-H16SA-H19SA-H22SA-H25SH-H19SK-H22
Experimental data (MPa)31.5, 34.2,
35.2
30.3, 32.5,
34.4
33.4, 32.3,
32.2
30.1, 31.5,
28.6
33.7, 32.1,
31.5
Average strength (MPa)33.732.432.630.132.4
Table 3. Calculated crack widths against measured crack width of 0.3 mm (first major crack using Equation (1)).
Specimen
Name
ThicknessRebar StressBottom
Concrete Cover
Rebar
Spacing
Neutral Axis
Factor
Calculated Crack Width Using
Measured Load
Calculated-To-
Measured Crack Width Ratio
H f s d c s w c   w c / w m  
Unit:(mm)(MPa)(mm)(mm)-(mm)-
SA-H16 (PL)-1297.8216.157.82001.310.331.09
SA-H16 (OP)-1303.5229.558.32001.310.351.16
SA-H16 (PR)-1304.7217.657.32001.300.331.08
SA-H16 (PL)-2300.0223.156.52001.300.331.11
SA-H16 (OP)-2301.7211.258.32001.310.321.07
SA-H16 (PR)-2304.0220.860.22001.320.341.13
SA-H19 (PL)-1297.3242.856.52001.320.371.22
SA-H19 (OP)-1302.5206.260.72001.340.321.08
SA-H19 (PR)-1305.7250.959.22001.320.391.29
SA-H19 (PL)-2301.0264.056.22001.310.401.32
SA-H19 (OP)-2301.5248.161.72001.350.391.31
SA-H19 (PR)-2304.5249.159.02001.320.381.28
SA-H22 (PL)-1300.3201.059.52001.350.321.05
SA-H22 (PL)-2297.8198.559.22001.350.311.04
SA-H25 (PL)-1298.7167.258.32001.360.260.88
SA-H25 (PL)-2303.8180.958.82001.350.280.95
SH-H19 (PL)-1401.5217.558.01501.230.250.84
SH-H19 (PR)-1405.7214.358.31501.220.250.83
SH-H19 (PL)-2398.0225.357.71501.230.260.87
SH-H19 (PR)-2403.7238.658.81501.230.280.93
SK-H22 (PL)-1507.3199.358.31501.170.220.74
SK-H22 (PR)-1505.3206.259.01501.180.230.77
SK-H22 (PL)-2504.8211.257.81501.170.230.78
SK-H22 (PR)-2505.0195.858.51501.170.220.73
Mean ,   x ¯ 0.311.02
Standard
deviation, s x
0.0560.188
cov, δ 0.1840.184
Maximum 0.401.32
Minimum 0.220.73
Number of
measurements
2424
Table 4. Calculated crack widths against measured crack width of 0.5 mm (first major crack using Equation (1)).
Specimen
Name
ThicknessRebar StressBottom
Concrete Cover
Rebar
Spacing
Neutral Axis
Factor
Calculated Crack Width Using
Measured Load
Calculated-To-
Measured Crack Width Ratio
H f s d c s w c   w c / w m  
Unit:(mm)(MPa)(mm)(mm)-(mm)-
SA-H16 (PL)-1297.8-57.82001.31--
SA-H16 (OP)-1303.5379.258.32001.310.571.15
SA-H16 (PR)-1304.7391.657.32001.300.591.17
SA-H16 (PL)-2300.0311.656.52001.300.460.93
SA-H16 (OP)-2301.7343.958.32001.310.521.04
SA-H16 (PR)-2304.0353.260.22001.320.541.09
SA-H19 (PL)-1297.3335.656.52001.320.511.02
SA-H19 (OP)-1302.5355.560.72001.340.561.11
SA-H19 (PR)-1305.7362.459.22001.320.561.11
SA-H19 (PL)-2301.0348.356.22001.310.521.05
SA-H19 (OP)-2301.5359.961.72001.350.571.14
SA-H19 (PR)-2304.5335.859.02001.320.521.03
SA-H22 (PL)-1300.3344.359.52001.350.541.08
SA-H22 (PL)-2297.8334.459.22001.350.521.05
SA-H25 (PL)-1298.7289.858.32001.360.460.91
SA-H25 (PL)-2303.8308.358.82001.350.480.97
SH-H19 (PL)-1401.5322.358.01501.230.370.75
SH-H19 (PR)-1405.7315.758.31501.220.370.73
SH-H19 (PL)-2398.0333.357.71501.230.390.77
SH-H19 (PR)-2403.7335.958.81501.230.390.79
SK-H22 (PL)-1507.3298.758.31501.170.330.67
SK-H22 (PR)-1505.3306.259.01501.180.340.69
SK-H22 (PL)-2504.8287.757.81501.170.320.64
SK-H22 (PR)-2505.0315.458.51501.170.350.70
Mean ,   x ¯ 0.470.94
Standard
deviation, s x
0.0890.179
cov, δ 0.1900.190
Maximum 0.591.17
Minimum 0.320.64
Number of
measurements
2323
Table 5. Statistical parameters of calculated-to-measured crack width ratios for first major crack (Equations (1) and (3)).
Variables0.3 mm Crack Width0.5 mm Crack Width
Original Equation (1)Modified Equation (3)Original Equation (1)Modified Equation (3)
Mean ,   x ¯ 1.021.030.941.01
Standard   deviation ,   s x 0.1880.1000.1790.083
cov, δ0.1840.0970.1900.083
Maximum 1.321.221.171.15
Minimum0.730.870.640.89
Table 6. Calculated crack widths against measured crack width of 0.3 mm (3 major cracks in selected specimens, Equation (3)).
Specimen
Name
ThicknessRebar StressBottom
Concrete Cover
Rebar
Spacing
Neutral Axis
Factor
Calculated Crack Width Using
Measured Load
Calculated-To-
Measured Crack Width Ratio
Ratio
h f s d c s w c   w c / w m
1st2nd3rd 1st2nd3rd1st2nd3rd2nd/
1st
3rd/
1st
Unit:(mm)(MPa)(mm)(mm)-(mm)--
SA-H16 (PR)-2304.0220.8246.9250.960.22001.320.330.330.331.081.181.191.091.11
SA-H19 (PR)-1305.7250.9270.4283.059.22001.320.330.340.341.201.271.321.061.10
SA-H19 (PR)-2304.5249.1251.9275.759.02001.320.330.330.341.191.201.291.011.08
SA-H22 (PL)-1300.3201.0221.3-59.52001.350.330.33-1.011.09-1.08-
SH-H19 (PL)-1217.5217.5242.4246.758.01501.230.330.330.330.941.021.041.091.11
SH-H19 (PR)-1214.3214.3239.6246.758.31501.220.330.330.330.931.021.041.091.12
SH-H19 (PL)-2225.3225.3237.6259.257.71501.230.330.330.330.961.001.081.041.12
SH-H19 (PR)-2238.6238.6256.3261.358.81501.230.330.340.341.021.081.101.061.08
SK-H22 (PL)-1199.3199.3213.7283.358.31501.170.320.310.330.930.981.231.061.32
SK-H22 (PR)-1206.2206.2217.1224.959.01501.180.320.320.320.961.001.031.041.07
SK-H22 (PL)-2211.2211.2240.1253.657.81501.170.310.320.320.971.071.121.111.16
SK-H22 (PR)-2195.8195.8227.3-58.51501.170.320.32-0.921.03-1.13-
Mean ,   x ¯ 0.320.330.331.011.081.141.071.13
Standard
deviation, s x
0.0070.0080.0080.0970.0910.1070.0330.074
cov, δ 0.0210.0260.0240.0970.0850.0940.0310.066
Maximum 0.330.340.341.201.271.321.131.32
Minimum 0.310.310.320.920.981.031.011.07
Table 7. Calculated crack widths against measured crack width of 0.5 mm (three major cracks in selected specimens, Equation (3)).
Specimen
Name
ThicknessRebar StressBottom
Concrete Cover
Rebar
Spacing
Neutral Axis
Factor
Calculated Crack Width Using
Measured Load
Calculated-To-
Measured Crack Width Ratio
Ratio
h f s d c s w c   w c / w m
1st2nd3rd 1st2nd3rd1st2nd3rd2nd/
1st
3rd/
1st
Unit:(mm)(MPa)(mm)(mm)-(mm)--
SA-H16 (PR)-2304.0353.2393.4415.560.22001.320.500.510.511.081.181.231.091.14
SA-H19 (PR)-1305.7362.4377.7404.259.22001.320.500.500.511.111.151.211.031.09
SA-H19 (PR)-2304.5335.8359.6379.2592001.320.500.500.501.041.101.151.061.10
SA-H22 (PL)-1300.3344.3347.5363.659.52001.350.510.510.511.071.081.121.011.04
SH-H19 (PL)-1401.5322.3331.6355.1581501.230.510.500.500.910.930.981.021.08
SH-H19 (PR)-1405.7315.7324.2332.758.31501.220.510.510.510.900.920.931.021.04
SH-H19 (PL)-2398.0333.3351.3358.557.71501.230.500.500.500.930.970.981.041.06
SH-H19 (PR)-2403.7335.9340.1350.858.81501.230.510.510.510.940.950.981.011.04
SK-H22 (PL)-1507.3298.7303.9306.458.31501.170.490.490.490.920.940.941.011.02
SK-H22 (PR)-1505.3306.2307.8321.2591501.180.490.490.490.940.950.981.001.04
SK-H22 (PL)-2504.8287.7315.2341.657.81501.170.500.490.480.890.961.021.081.15
SK-H22 (PR)-2505.0315.4328.3-58.51501.170.490.49-0.961.00-1.03-
Mean ,   x ¯ 0.500.500.500.981.011.051.031.07
Standard
deviation,   s x
0.0070.0090.0100.0790.0930.1090.0270.043
cov, δ 0.0130.0180.0210.0810.0920.1040.0270.040
Maximum 0.510.510.511.111.181.231.091.15
Minimum 0.490.490.480.890.920.931.001.02
Table 8. Probabilistic models of basic design variables.
LocationVariablesNominalMean/Mediancov/Zeta PDF
Concrete   compressive   strength   ( f c k ) 27 MPa30.40.222Normal
Rebar   spacing   biasness   ( λ s )-0.9980.035Normal
Slab   thickness   biasness   ( λ h )-1.0040.028Normal
Positive moment region Bottom   concrete   cover   ( d c )60 mm71.50.065Normal
Top   concrete   cover   d d 80 mm78.60.068Log-Normal
Negative moment region Bottom   concrete   cover   ( d c )80 mm78.60.068Log-Normal
Top   concrete   cover   d d 60 mm71.50.065Normal
Table 9. Sensitivity analysis of crack width of RC slab (first major crack in the positive moment region).
VariablesRate of Change, (%)
µ − 2σµ − σµµ + σµ + 2σ
Bottom   concrete   cover ,   d c (mm)−12.65−6.610.007.2315.15
Slab   thickness ,   h (mm)8.644.120.00−3.77−7.24
Rebar   spacing ,   s (mm)−5.08−2.550.002.585.17
Concrete   compressive   strength ,   f c k (MPa)1.310.540.00−0.42−0.76
Top   concrete   cover ,   d d (mm)−0.17−0.080.000.080.17
Table 10. Probabilistic models of experimental crack width biasness (1st major crack).
EquationVariablesMean/Mediancov/ZetaPDF
Original equation (Equation (1)) λ c   (crack width biasness) (0.3)1.020.184Normal
λ c   (crack width biasness) (0.5)0.940.190Normal
Modified equation (Equation (3)) λ c   (crack width biasness) (0.3)1.030.097Normal
λ c   (crack width biasness) (0.5)1.010.083Normal
Table 11. Weight factor for simulation size of each slab model.
Thickness, h (mm) Bottom   Rebar   Area ,   A s   ( mm 2 )  
993132419102578
300122041
35041681
4004441
5001111
Table 12. Crack width factors and safety index values for the positive moment region of the top slab.
Crack Width
Factor, ϕ w
Safety   Index ,   β The Occurrence Probability of the Design Crack
0.3 mm0.5 mm0.3 mm0.5 mm
1.00−1.24−1.270.89320.8973
1.250.210.300.41590.3824
1.501.181.340.11840.0896
1.751.882.090.03030.0184
2.002.402.650.00830.0041
Table 13. Crack width factors and safety index values for negative moment region of the top slab.
Crack Width
Factor, ϕ w
Safety   Index ,   β The Occurrence Probability of Design Crack
0.3 mm0.5 mm0.3 mm0.5 mm
1.000.130.010.44860.4948
1.251.491.640.06820.0506
1.502.402.720.00830.0032
1.753.043.500.00120.0002
2.003.524.080.00020.00002
Publisher’s Note: MDPI stays neutral with regard to jurisdictional claims in published maps and institutional affiliations.

