Article

Chainlet-Based Ear Recognition Using Image Multi-Banding and Support Vector Machine

by
Matthew Martin Zarachoff
1,*,
Akbar Sheikh-Akbari
1,* and
Dorothy Monekosso
2,*
1
School of Built Environment, Engineering and Computing, Leeds Beckett University, Leeds LS6 3QR, UK
2
Department of Computer Science, Durham University, Durham DH1 3LE, UK
*
Authors to whom correspondence should be addressed.
Appl. Sci. 2022, 12(4), 2033; https://doi.org/10.3390/app12042033
Submission received: 7 January 2022 / Revised: 29 January 2022 / Accepted: 8 February 2022 / Published: 16 February 2022
(This article belongs to the Topic Applied Computer Vision and Pattern Recognition)

Abstract

:
This paper introduces the Chainlet-based Ear Recognition algorithm using Multi-Banding and Support Vector Machine (CERMB-SVM). The proposed technique splits the gray input image into several bands based on the intensity of its pixels, similar to a hyperspectral image. It performs Canny edge detection on each generated normalized band, extracting edges that correspond to the ear shape in each band. The generated binary edge maps are then combined, creating a single binary edge map. The resulting edge map is then divided into non-overlapping cells and the Freeman chain code for each group of connected edges within each cell is determined. A histogram of each group of contiguous four cells is computed, and the generated histograms are normalized and linked together to create a chainlet for the input image. The created chainlet histogram vectors of the images of the dataset are then utilized for the training and testing of a pairwise Support Vector Machine (SVM). Results obtained using the two benchmark ear image datasets demonstrate that the suggested CERMB-SVM method generates considerably higher performance in terms of accuracy than the principal component analysis based techniques. Furthermore, the proposed CERMB-SVM method yields greater performance in comparison to its anchor chainlet technique and state-of-the-art learning-based ear recognition techniques.

1. Introduction

Ear recognition is a biometric identification method in which an ear image is utilized to distinguish a person, which has advanced over the past years. Ears are distinctive to an individual; even indistinguishable twins’ ear patterns are different [1]. There are several challenges attached with ear recognition in comparison to face recognition. More obstruction can be found when dealing with ear images than face images due to coverings that are sometimes present in such images, e.g., hair and jewelry. Additionally, there is currently a limited number of ear image datasets available. These datasets usually contain a small number of images. A typical ear recognition technique consists of a feature extractor and a classification method. Some of the existing feature extraction algorithms for ear recognition are Principal Component Analysis (PCA) [2,3,4,5,6], Curvelet-based [7], wavelet-based [8], local oriented patterns based [9] and neural-network-based techniques [10,11,12,13]. Over the years, researchers have proposed several machine-learning-based approaches and statistical methods for ear recognition. Some of these methods include: ‘Eigenfaces’ [6], wavelet [8], SVM [14,15] and deep learning [12] based techniques for feature extraction and classification. Both learning and statistical-based algorithms have been successfully used for ear recognition; however, more accurate results are often obtained using the learning-based techniques due to the ‘width’ of the data. Promising results have been noticed with recently reported statistical-based algorithms, e.g., chainlets [16] and 2D-MBPCA [17]. High-performing ear recognition techniques use a mixture of statistical-based feature extraction methods along with a learning-based classification algorithm [2]. This has inspired the authors to investigate a new combination of multi-band image processing with chainlets and a learning-based classifier. Application of the multi-band image processing for ear recognition on non-decimated wavelet subbands of ear images utilizing Principal Component Analysis (PCA) shows the effectiveness of multi-band image processing in recognition. In [18], the authors showed that the intersection of the number of feature graphs and the Eigenvector energy defines the optimum number of bands for recognition, where increasing the number of multi-band images changes the distribution of the energy across image Eigenvectors, and consolidates most of the image Eigenvectors’ energy into a smaller number of Eigenvectors. The result of this was an increased accuracy in recognition. In [16], the authors introduced chainlets as an efficient feature descriptor for encoding the shapes formed by the edges of an object, where the connections and orientations of the edges are more invariant to translation and rotation. They have successfully applied their method to ear recognition and reported promising results; however, to the authors’ knowledge, the application of multi-band image processing along with chainlets for ear recognition has not been informed in the literature. This has motivated the authors to investigate a new combination of multi-band image processing with chainlets and a learning-based classifier for ear recognition.
This paper presents a Chainlet-based Multi-Band Ear Recognition method using Support Vector Machine (CERMB-SVM). The suggested algorithm splits the input ear image into a few image bands based on the image pixel intensity. More ear features can be extracted using the created image bands rather than just the input image. The Canny edge detection is performed on each generated image band, generating a binary image representing its edges. To remove isolated edges, connect adjacent left edges and discard inappropriate edges within each resulting binary image, morphological operators are employed. The generated edge bands are then compacted into one binary edge map. The generated binary edge map is divided into several cells using a windowing algorithm and the Freeman chain code for each edge group within each cell is determined. The cells are then categorized into overlapping blocks and a histogram is then computed from the chain codes for each block. These histograms are then normalized and linked together to create the normalized chainlet histogram vector for the input image. A pairwise support vector machine is then trained and utilized to perform ear recognition. The IITD II [19] and USTB I [20] ear image datasets were used to generate experimental results. Results show that the suggested CERMB-SVM method surpasses both the statistical and state-of-the-art learning-based ear recognition techniques. The rest of the paper is structured as follows: Section 2 presents the proposed CERMB-SVM algorithm, Section 3 discusses the pairwise support vector machine classifier, Section 4 presents the experimental results, and Section 5 concludes the paper.

2. Proposed CERMB-SVM Technique

A block diagram of the Chainlet-based Ear Recognition algorithm using Multi-Banding and Support Vector Machine (CERMB-SVM) is shown in Figure 1. This figure shows that the proposed algorithm contains five main stages: image pre-processing; multi-band image generation; binary edge image creation; chainlet calculation; classification.

2.1. Image Pre-Processing

Assume that E is the set of all ear images in the ear image dataset. Assuming that the input image eE is an unsigned 8-bit, grayscale image. The proposed technique performs a histogram equalization on the input image to improving its contrast. This is achieved by computing the Probability Mass Function (PMF) P X of the input image.
P X ( x k ) = P ( X = x k ) for k = 0 , 1 , , 255
where x 0 , x 1 , , x 255 indicates the pixel values and P X ( x k ) indicates the probability of pixel value in bin k. The Cumulative Distribution Function (CDF) C X of the image is then computed using the calculated PDF:
C X ( k ) = P ( X x k ) for k = 0 , 1 , , 255
where C X ( k ) indicates the cumulative probability of X x k . Finally, each pixel value inside the image is converted to a new value utilizing its computed CDF, creating a histogram equalized image.

2.2. Multi-Band Image Generation

The proposed CERMB-SVM algorithm divides the resulting histogram equalized image into several bands based on its pixel values. Assume N be the number of aim bands for the input image e to be split into. The pixel value borders B = { b 1 , b 2 , , b N 1 } are then determined utilizing (3):
b n = n / N for n = 1 , 2 , , ( N 1 )
The histogram equalized image has now been divided into F image bands, creating a multi-band image F = { f 1 , f 2 , , f N } .

2.3. Edge Selection

Input image edge selection process is as follows: the proposed algorithm first performs Canny edge detection to each resulting intensity band f F. A Gaussian filter with sigma 0.5 is applied on each resulting intensity band to smoothing the band. Then, the intensity gradient of the created band is computed in four directions (0 , 45 , 90 and 135 ) utilizing a first-order derivative function. The horizontal and vertical edge gradients are first determined and employed to calculate the gradients of the diagonals. The non-maximum suppression algorithm is then performed on the resultant gradients to maintain the edges with the greatest gradients. The leftover edge pixels are then exposed to two empirical thresholds, low and high. Pixels lower than the low threshold value are discarded, pixels with value greater than the high threshold are categorized as strong edges, and pixels in the middle of the two thresholds are believed to be weak edges. Ultimately, the resultant edges are exposed to edge tracing by hysteresis, in which a weak-edge pixel is discarded if none of its 8-connected neighborhood pixels are strong-edge pixels. The resulting edge maps are then binarized, generating a binary edge map g G for each band.
Each resultant binary edge map g G is then exposed to two morphological operations. First, single edges are set to zero. Second, a ‘bridge’ morphological operator is performed on the resultant edge map. If a zero-value pixel has two or more non-zero neighbors, its value is set to one, by this means decreasing the quantity of distinct contours in the binary image map. The resultant contours in the maps more precisely demonstrate the ear features of the input image.
One side-impact of applying edge detection on each band is that multi-band image generation may generate extra edges, as pixels with values just above and under the given boundary values are often contiguous; therefore, those pixels are inaccurately categorized as edges. To solve this problem, these pixels are assessed with their 8-connected neighborhood. If any of the neighbors has a value of zero, the edge is believed to be generated by multi-band image creation and is then removed. After all redundant edges have been eliminated, the binary image bands g G are mixed, creating the ultimate binary edge image.

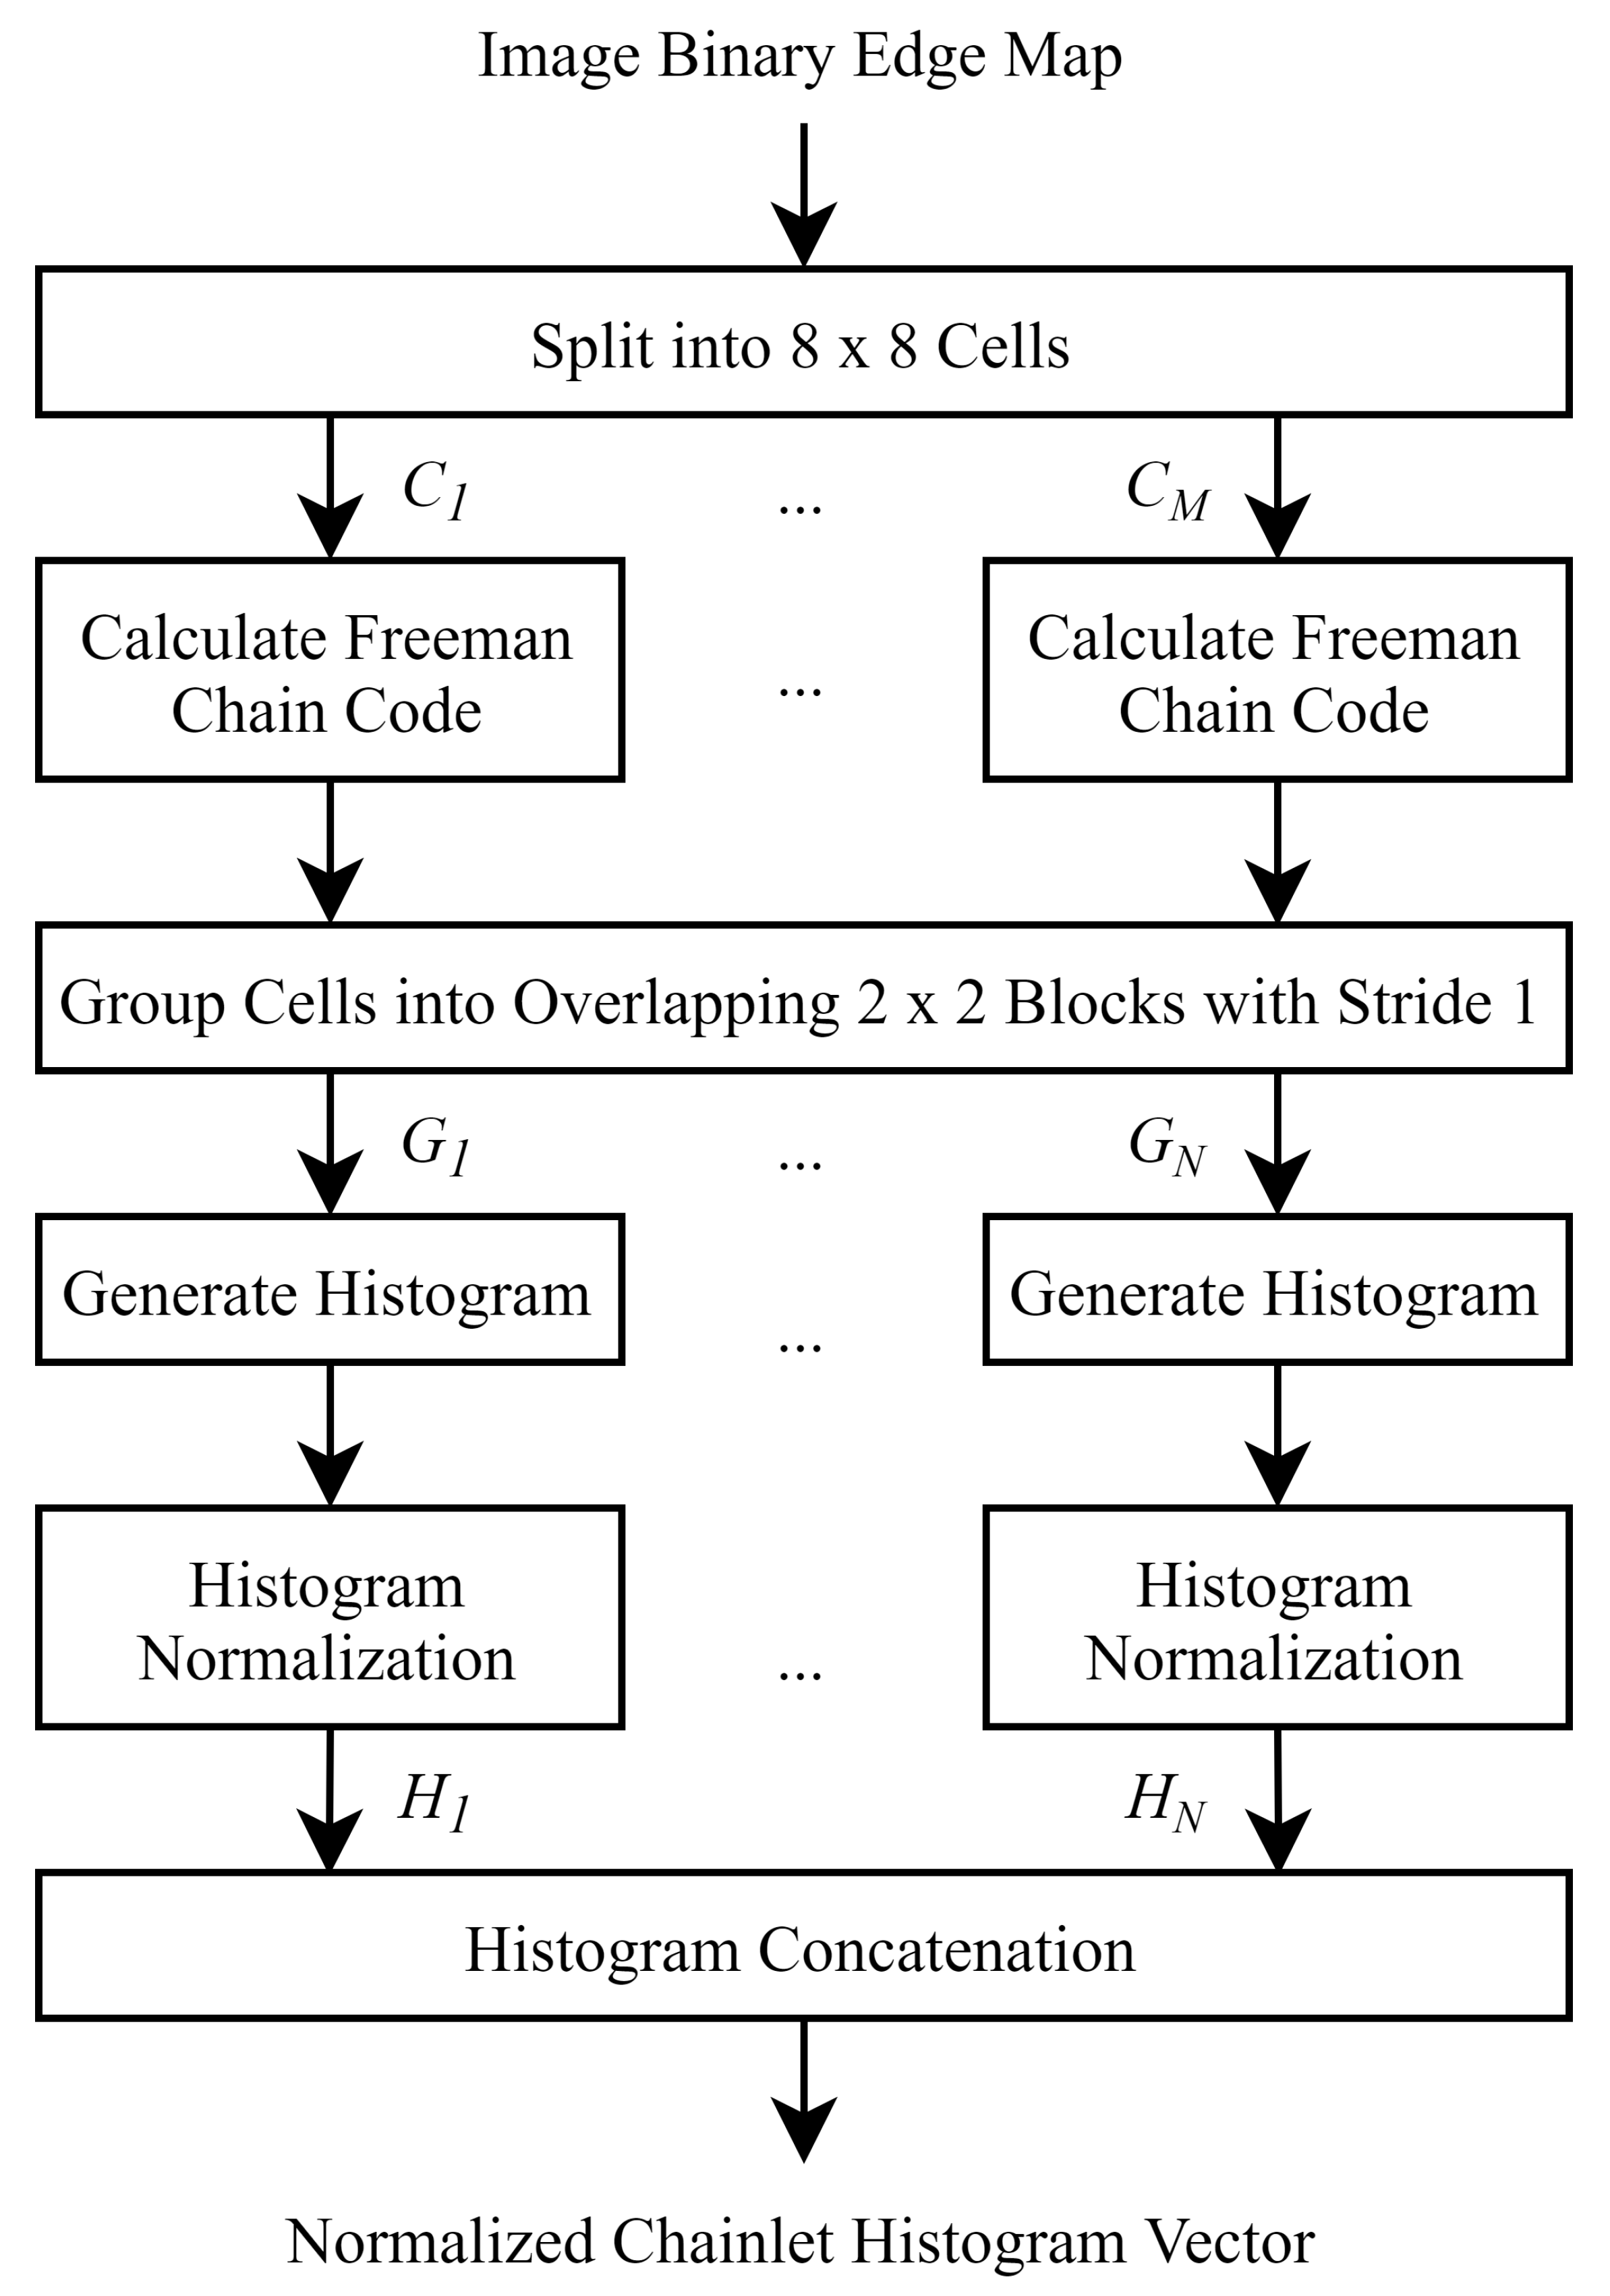
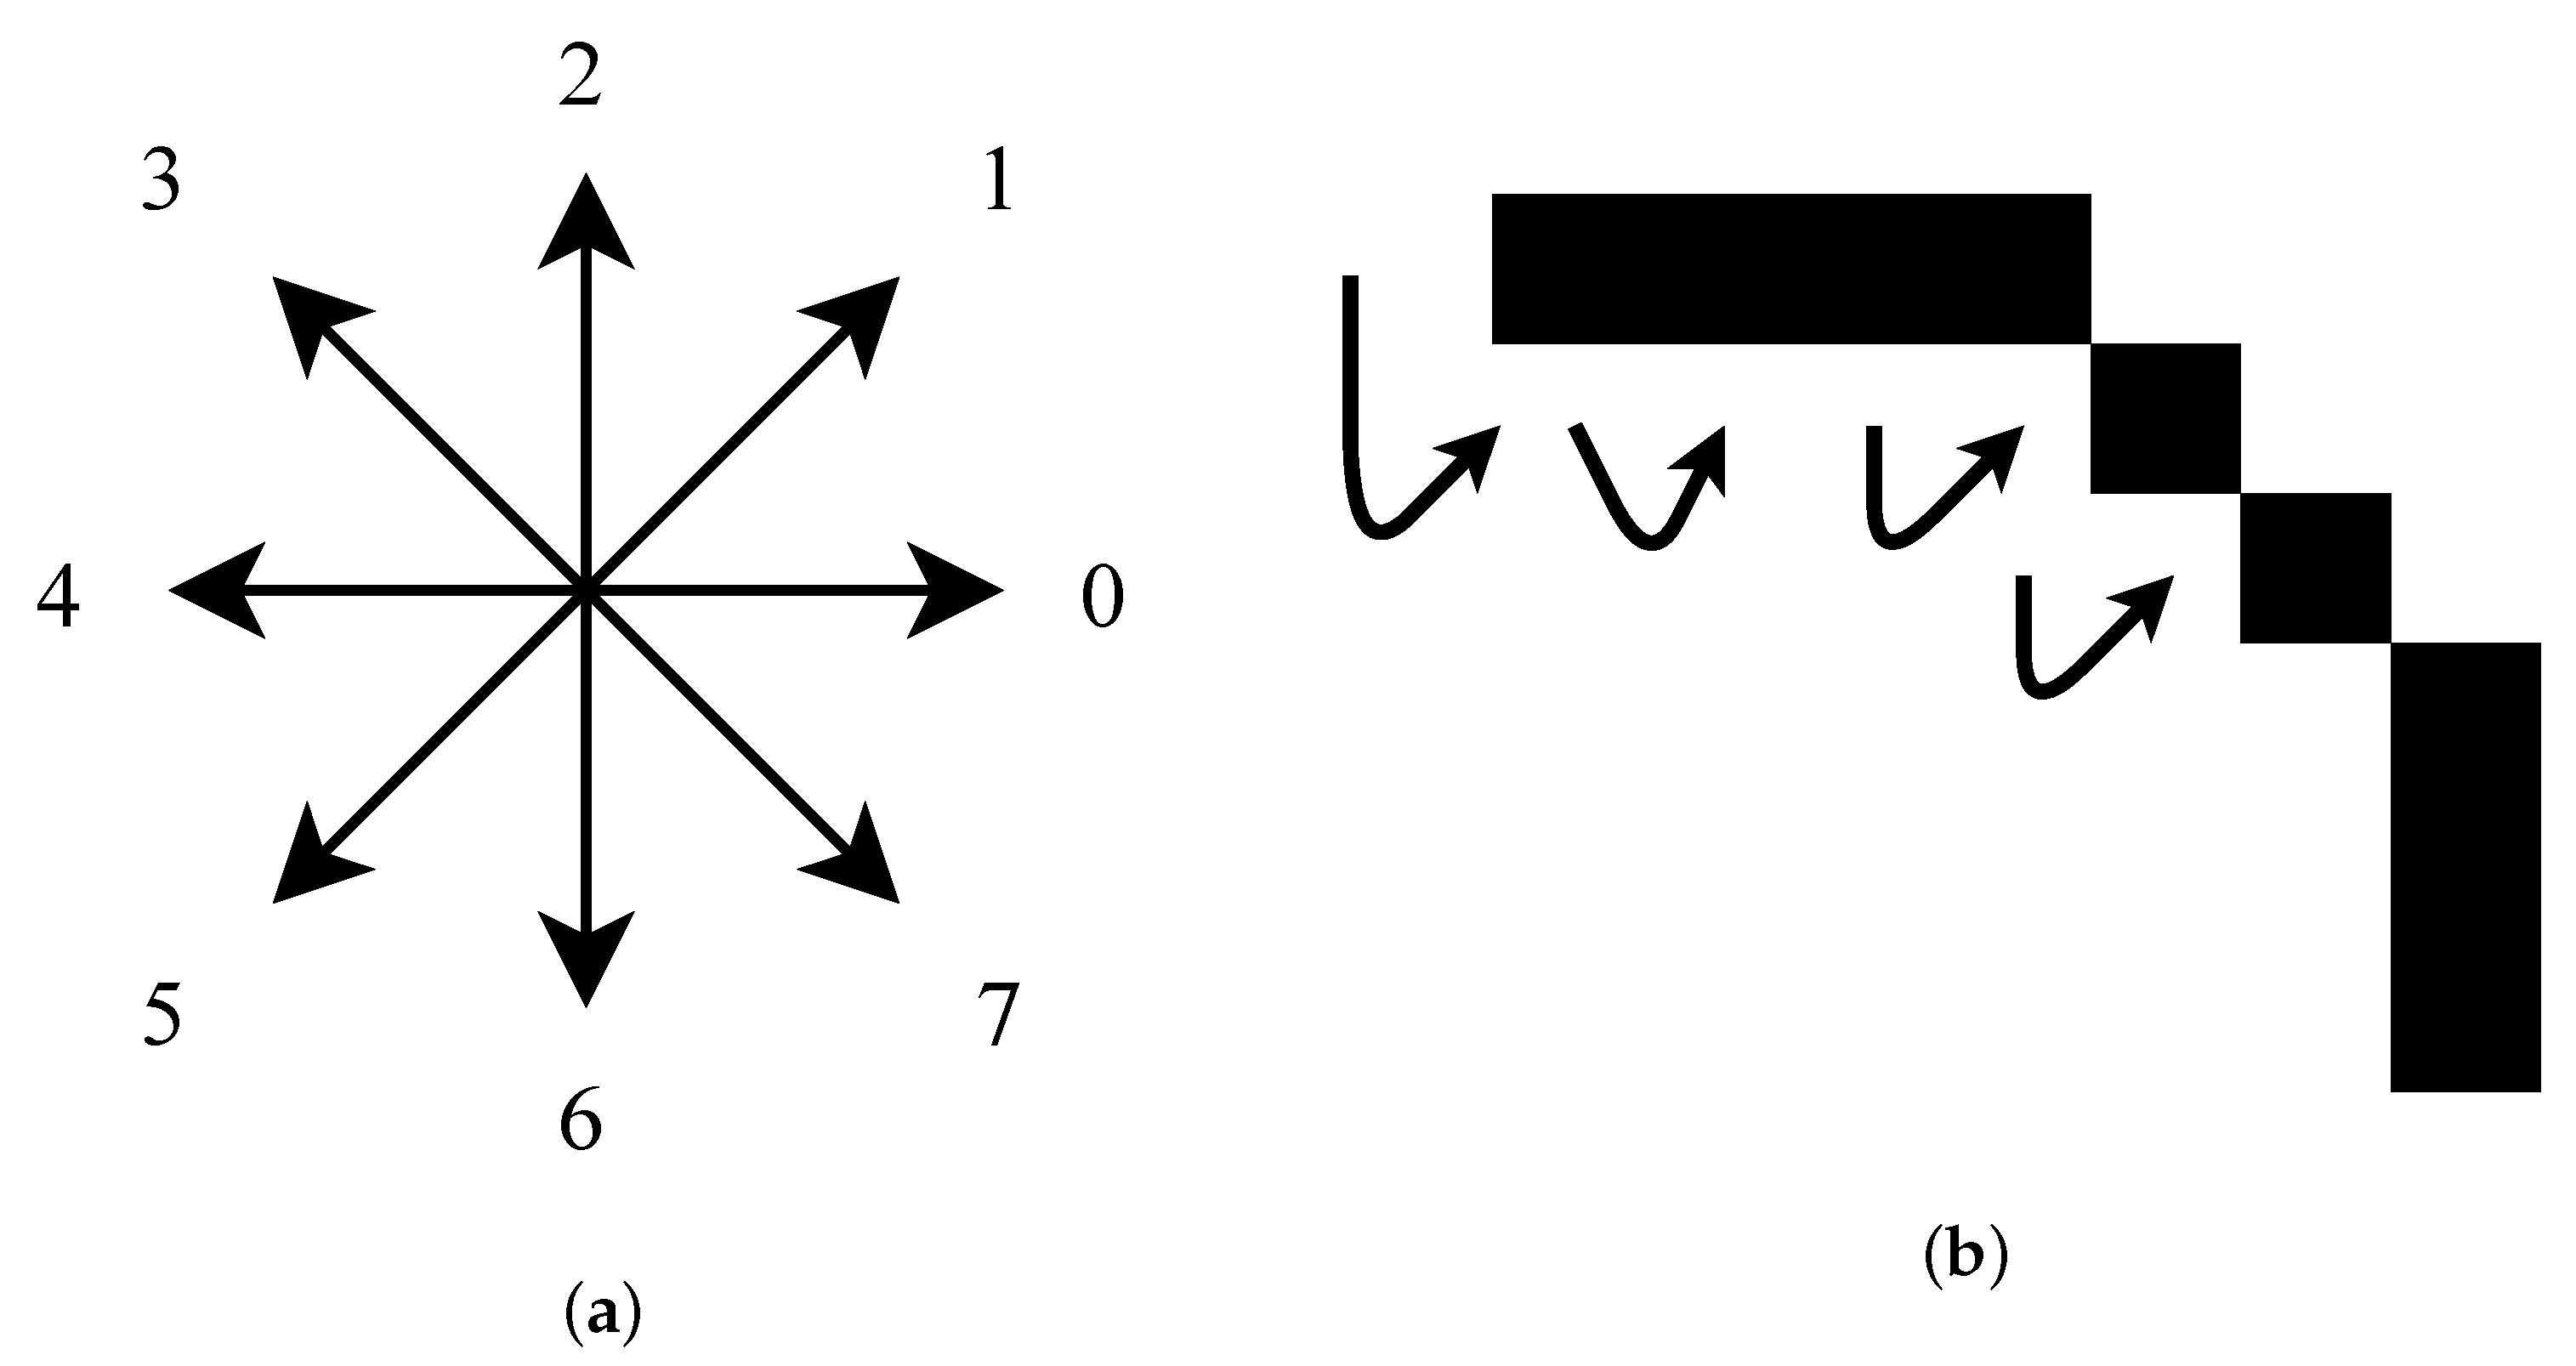
2.4. Chainlet Calculation

A block diagram of the chainlet computation procedure is shown in Figure 2. Chainlets are based on the Freeman chain code of eight directions, where the chain code is normally used to create a vector demonstrating the edge contour. The direction from an edge pixel is shown by a one in the binary edge map, to each of its possible eight edge neighbors is assigned a value between zero and seven as demonstrated in Figure 3a.
To compute the chain codes, the resultant combined input binary edge map is split into non-overlapping cells of size 8 × 8 pixels. For each edge contour in each cell, the Freeman chain code is determined starting from that edge-contour’s upper leftmost pixel and pass-through counter-clockwise as displayed in Figure 3b. For the shown edge-contour, the chain code is [0 0 0 7 7 7 6 6 2 2 3 3 3 4 4]. The resultant cell chain codes are categorized into overlapping blocks of size 2 × 2 cells with a stride of 1 cell. For each block’s resultant chain codes, a histogram is created, which is normalized utilizing the L2 norm. The resultant normalized histograms of all blocks are linked together row by row generating a normalized chainlet histogram vector.

3. Pairwise Support Vector Machine

Although various categorization algorithms can be used, in this research, a pairwise Support Vector Machine (SVM) is utilized for its simplicity. Pairwise SVM takes two inputs and defines if they are from the same class, whereas standard SVM takes only one input and seeks to determine its class. Assume R = { H 1 1 , , H i j , , H N M } be a training set of chainlets where H i j links to the j-th training image of the i-th person. The pairwise decision function between H i j and the inquiry chainlet H p q can then be written as:
D ( H i j , H p q ) = ( m , n ) α m n y m n K ( ( H m , H n ) , ( H i j , H p q ) ) + γ
where α and K represent the learned weights and the kernel function, respectively, and γ indicates the learned bias, and:
y m n = + 1 , m = n 1 , m n
In this paper, the kernel K represents the direct sum pairwise kernel, i.e.,
K ( ( a , b ) , ( c , d ) ) : = k ( a , c ) + k ( b , d )
where k indicates a standard kernel; in this instance, the linear kernel:
k ( a , c ) = a T c
In this paper, the parameters alpha and gamma were learned as explained in [21]. Moreover, the first two ear images of each subject in the dataset were employed for training the algorithm and the rest of its images were utilized for testing the algorithm.

4. Experimental Results

Two standard benchmark ear image datasets named the Indian Institute of Technology Delhi II (IITD II) [19] and the University of Science and Technology Beijing I (USTB I) [20], which are widely used in the literature [8,14,15,17,22], were used to create experimental results. These datasets were chosen since their images are aligned and also, they have extensively used in recent journal and conference papers. The IITD II dataset contains 793 images of the right ear of 221 people, where there are three to six images for each person’s ear and the images are unsigned 8-bit grayscale of size 180 × 50 pixels. All the images of IITD II dataset have the same size and are centered and aligned manually. The USTB I dataset contains 180 unsigned 8-bit grayscale of size 150 × 80 images of the right ear of 60 people (three images per person). The images in USTB I are tightly cropped; however, they demonstrate some minor rotation and shearing. Example images from both datasets are shown in Figure 4.
The suggested CERMB-SVM algorithm was applied to images of the IITD II and USTB I datasets utilizing two to ten bands of constant size as detailed in Section 2.2. The number of accurate matches was computed for each set of bands. A subgroup of the results for both the IITD II and USTB I image datasets are presented in Table 1 and Table 2 respectively. From these tables, it is clear that the proposed technique attains its highest performance at four and seven bands when dealing with the images of the IITD II and USTB I datasets, respectively. From these tables, it can be observed that the proposed CERMB-SVM technique has marginally superior performance when dealing with the images of the IITD II dataset than the images of the USTB I dataset.
To assess and compare the effectiveness of the suggested CERMB-SVM algorithm with the statistical PCA and anchor chainlet, and state-of-the-art learning based methods, the Rank-1 experimental results of the suggested CERMB-SVM, single image PCA, ‘Eigenfaces’ [4], 2D-MBPCA [17], ‘BSIF and SVM’ [15], GoogLeNet [11], ‘ResNet18 and SVM’ [12], VGG-based Ensembles [23] and ‘neural network and SVM’ based [14] methods are presented in Table 3. From this table, the presented CERMB-SVM method meaningfully outperforms both the PCA-based and learning based state-of-the-art algorithms for the images of the IITD II dataset. Additionally, the proposed CERMB-SVM method considerably outperforms the PCA-based methods and slightly outperforms the learning-based algorithms on the USTB I dataset.
A further comparison between the proposed 2D-CERMB-SVM technique and the aforementioned algorithms is demonstrated using Cumulative Match Curves (CMC). Regions of interest for the CMC curves comparing 2D-CERMB-SVM to the statistical based methods on the IITD II and USTB I datasets are shown in Figure 5 and Figure 6, respectively. In addition, regions of interest for the CMC curves for both the proposed 2D-CERMB-SVM and learning based techniques on both datasets are shown in Figure 7 and Figure 8. From Figure 5 and Figure 6, it can be seen that the proposed 2D-CERMB-SVM algorithm greatly outperforms the PCA-based methods. In addition, the proposed technique generates superior results to its anchor chainlet method. From Figure 7 and Figure 8, it is evident that the 2D-CERMB-SVM algorithm generates superior results to the ‘BSIF and SVM’, GoogLeNet, VGG-based Ensembles, and ‘Neural Network and SVM’ methods; however, the proposed technique generates identical results to that of the ‘ResNet18 and SVM’ method on the USTB I dataset.

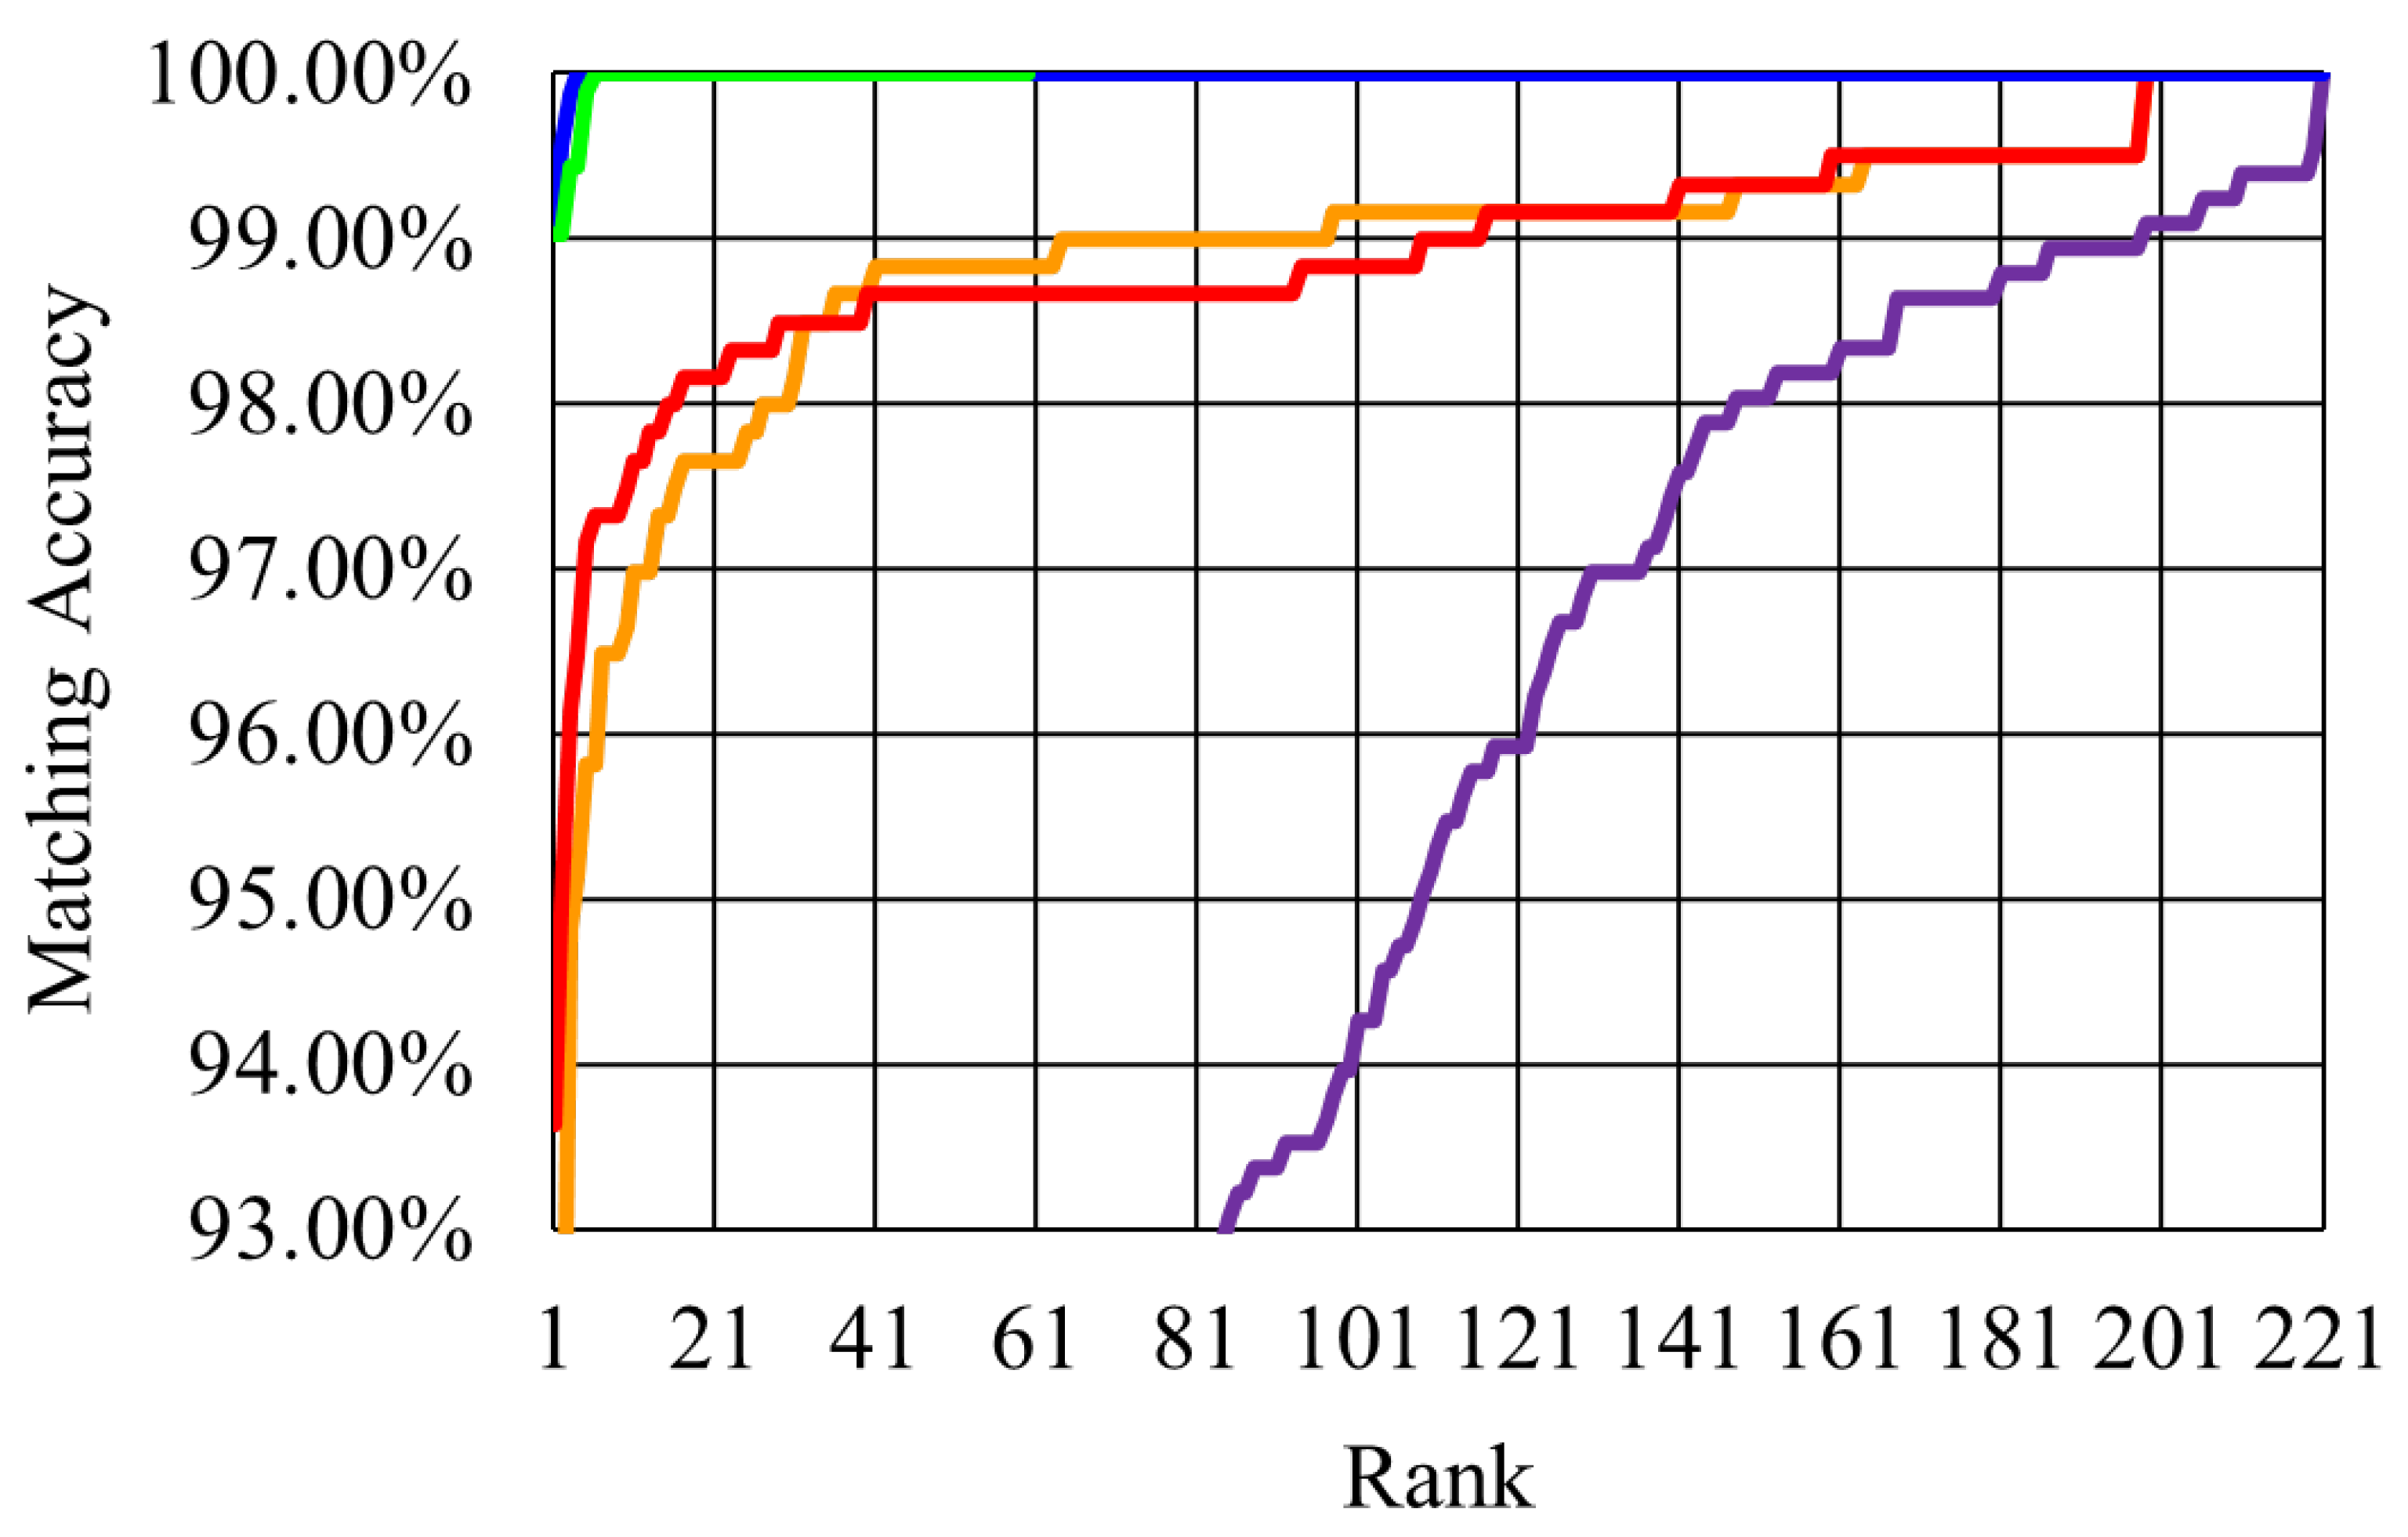
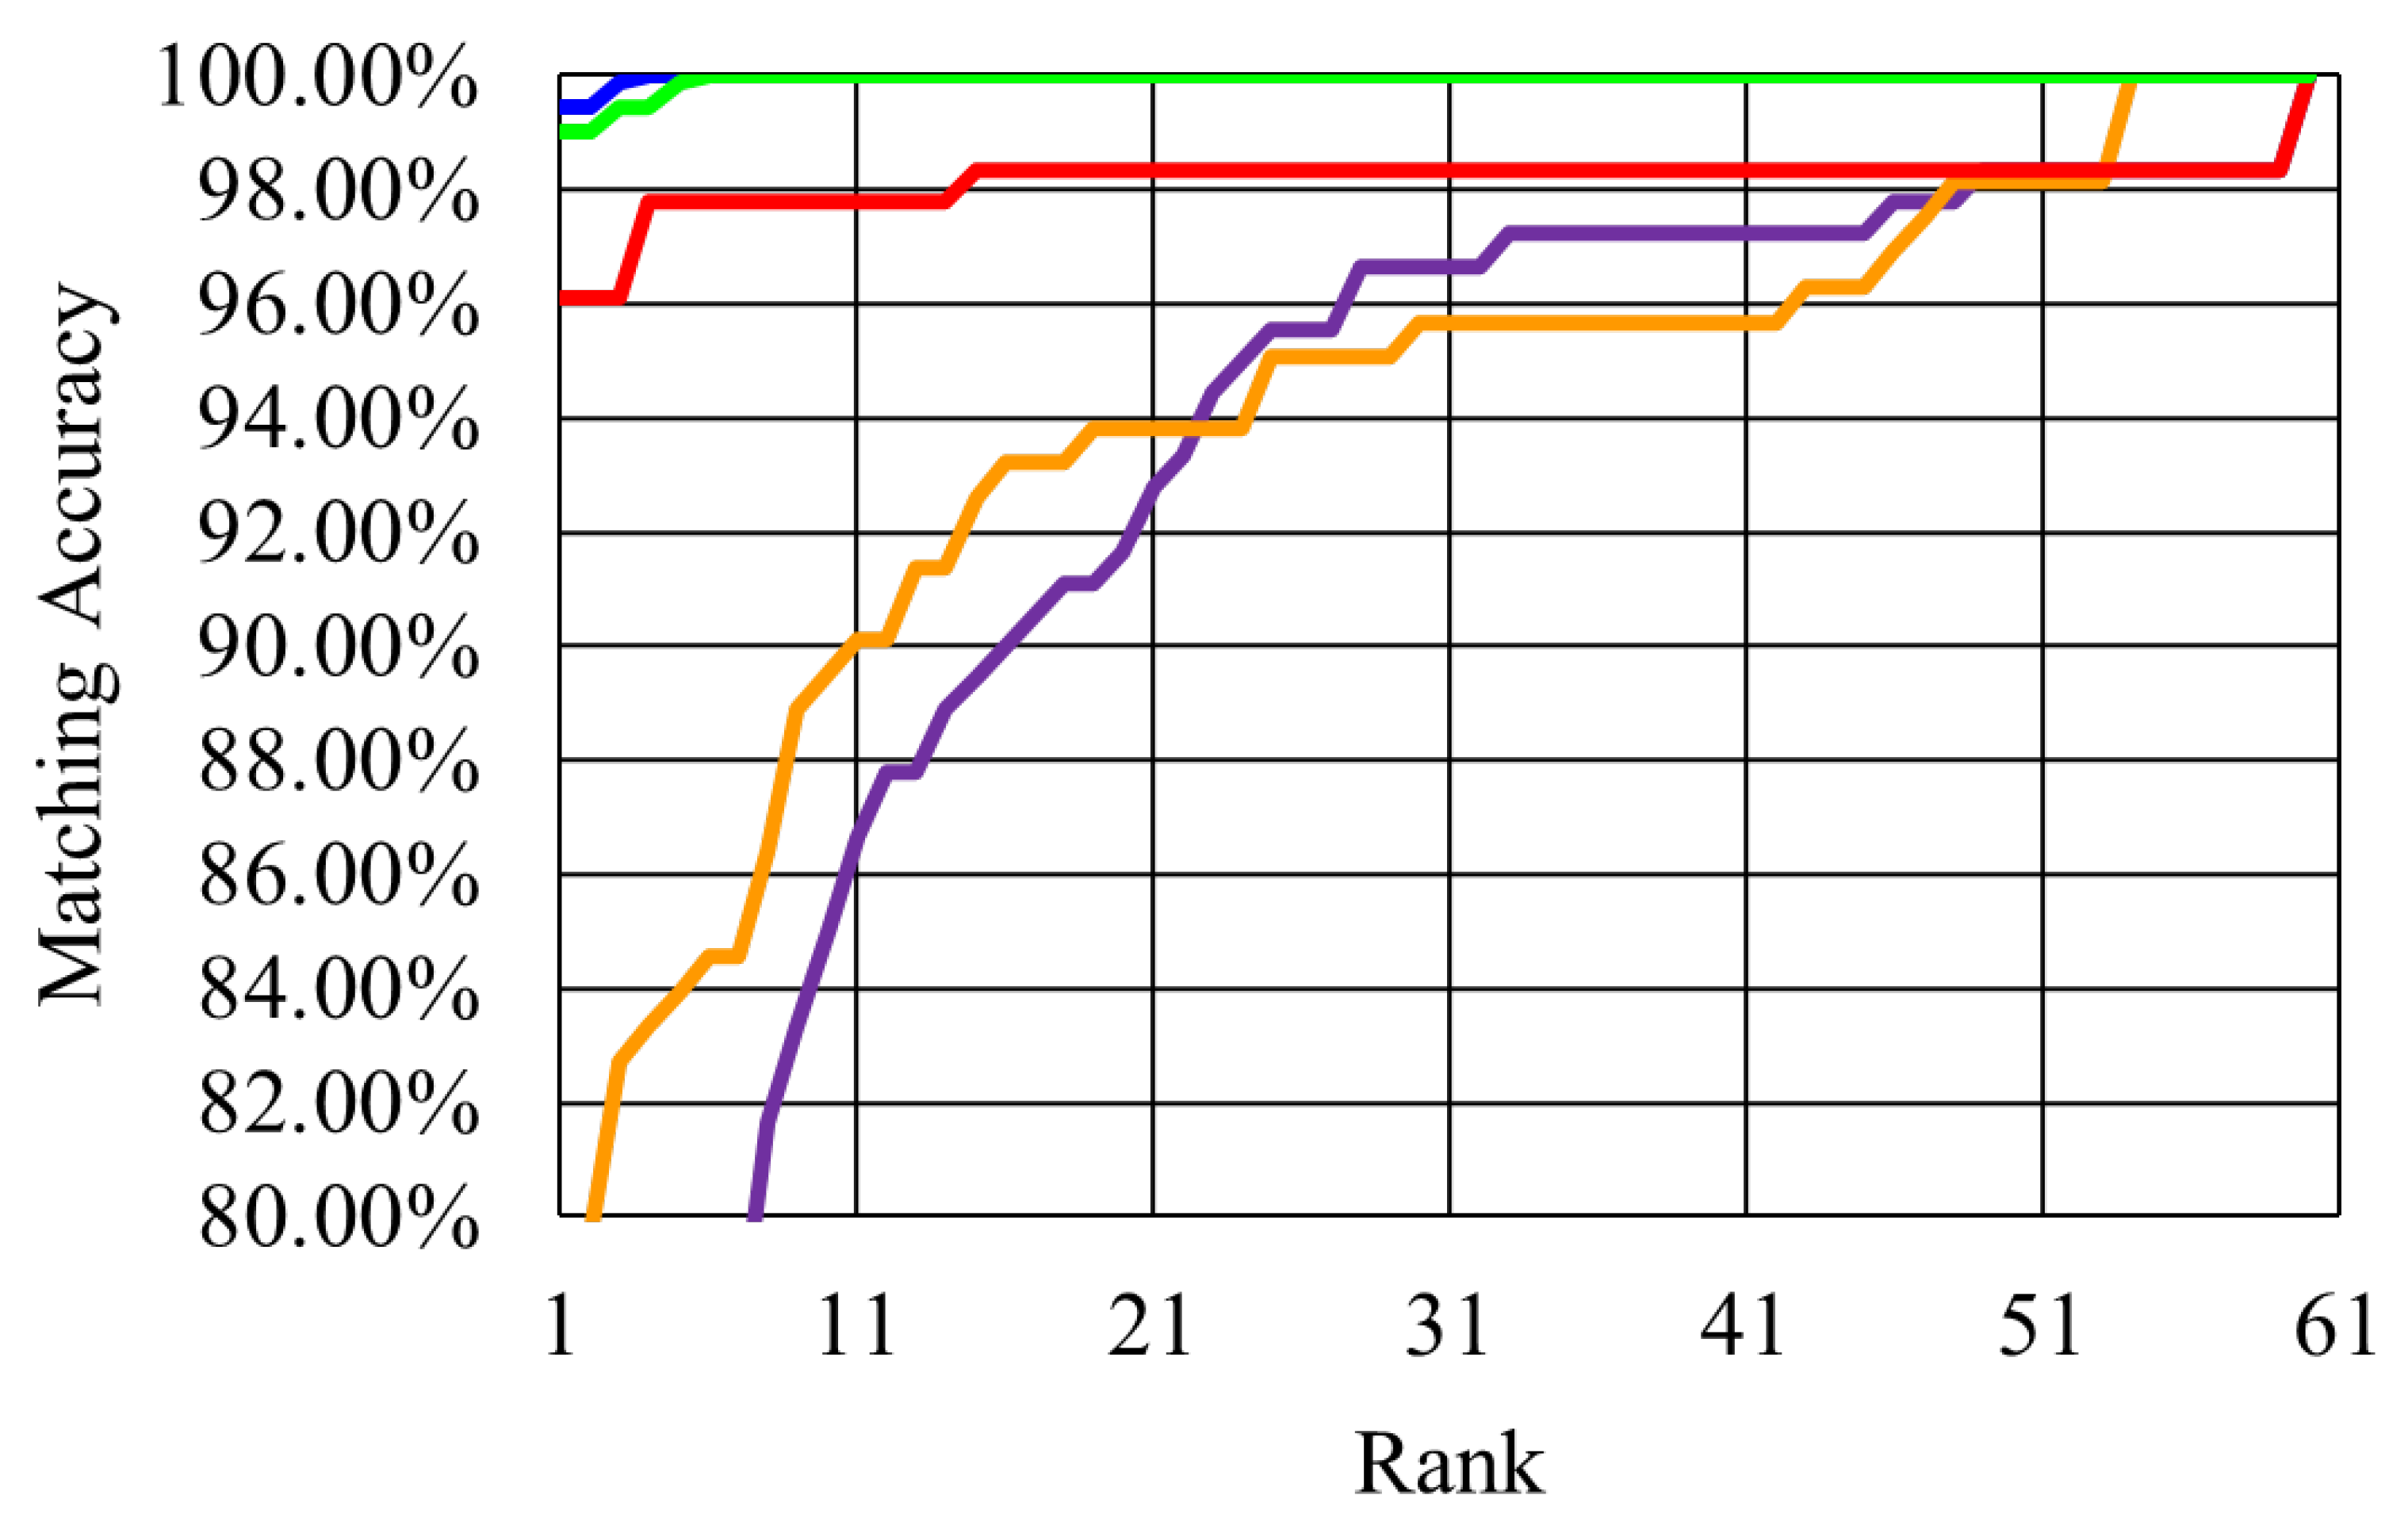
4.1. Justification of the Achieved Performance

From the experimental results, it is evident that the proposed CERMB-SVM technique considerably outperforms the PCA-based methods. This performance can be justified by the fact that the multiple band image generation process expands the ear image feature space by a factor of b 1 , where b is the number of frames; however, due to flattening of the resulting edge maps of different bands, some edges will overlap, resulting in a slight reduction in the increased feature space. To give the reader a visualized justification of the selection of optimum number of bands, the average of the total eigenvector energy for the resulting edge maps for different bands are calculated to represent the effectiveness of the resulting features generated by the multi-banding process. In addition, the average number of features for different number of bands is also plotted on the same graph. These two calculations can be seen in Figure 9 and Figure 10 for the IITD II and USTB I datasets, respectively.
From these figures, it can be seen that the total eigenvector energy for the resulting edge maps decreases as the number of bands increases. At the same time, the average number of features post-flattening increases with the number of the bands in a slightly less than linear fashion due to edge overlap in the flattening process. The intersection of these two graphs represents the optimal number of frames that can be used to produce the highest matching performance. The intersection of the eigenvector energy and number of features graphs occurs at approximately four bands for the IITD II dataset and seven bands for the USTB I dataset. This is consistent with the experimental results for finding the optimal number of bands in Section 4.

4.2. Execution Time

Ear recognition methods can normally be categorized into two main groups: statistical-based and learning-based algorithms. Statistical-based methods, comprising PCA, eigenfaces, 2D-MBPCA and the anchor chainlet technique, extract some statistics or features directly from the image and use these features to find the best match, whereas learning-based methods employ a range of information comprising image statistics, features and other data extracted from the image dataset to train classifiers, e.g., neural networks and support vector machines such as the proposed CERMB-SVM method. Learning-based techniques then use the trained classifiers to find the best match for an input query image. Subsequently, learning-based ear recognition methods are considerably more computationally costly than their statistical-based counterparts.
To give the reader a sense of the computational complexity of the proposed CERMB-SVM algorithm with respect to statistical based algorithms and the state-of-the-art learning-based methods, Single Image PCA, eigenfaces [4], 2D-MBPCA [17], the anchor chainlet, ‘BSIF and SVM’ [15], GoogLeNet [11], ‘ResNet18 and SVM’ [12], VGG-based Ensembles [23], ‘neural network and SVM’ based [14] and the proposed CERMB-SVM methods were implemented in MATLAB. The resulting techniques were then executed on a Windows 10 personal computer equipped with a 7th generation Intel core i7 processor, an NVIDIA GTX 1080 graphics card and a 512 GB Toshiba NVMe solid-state drive (no other applications, updates or background programs were running during the computation). The average computation time for processing an query image using each technique (learning-based algorithms were previously trained and their training time has not been contained in their measurement) was calculated using 100 randomly chosen query images from each dataset. The resulting measurements are presented in Table 4.

5. Conclusions

In this paper, application of multi-band image processing together with chainlets and support vector machine for ear recognition was investigated. This resulted in development of a Chainlet-based Ear Recognition Algorithm using Multi-Banding and Support Vector Machine (CERMB-SVM) algorithm, which significantly outperforms the statistical based ear recognition techniques and gives superior results to those of the learning-based methods in terms of accuracy. The proposed CERMB-SVM method splits the input ear image into several bands based on the intensity of its pixels. Canny edge detection algorithm along with morphological operators were used to generate and select the edge map for each resulting bands. One binary edge map image was created by combining the edge maps of different image bands. This resulting single binary edge map was divided into cells. The Freeman chain code for each cell was then calculated. The resulting cells are then clustered into overlapping blocks, and a histogram for each block is computed. The resulting histograms are normalized and linked together to create a normalized chainlet histogram vector for the original input image. The normalized chainlet histogram vectors of the images of the dataset are considered as features for matching using pairwise SVM.
Experimental results show that the proposed CERMB-SVM technique significantly outperforms the statistical-based techniques, in terms of accuracy. The proposed CERMB-SVM technique generates 62.67 % , 9.24 % , 7.90 % and 0.48 % higher than single image PCA, Eigenfaces, 2D-MBPCA and anchor chainlet in terms of accuracy on images of IITD II dataset, respectively. The proposed algorithm produces 54.44 % , 23.51 % , 14.25 % and 0.42 % higher accuracy than single image PCA, Eigenfaces, 2D-MBPCA and anchor chainlet technique on images of USTM I dataset, respectively. Experimental results show that the proposed CERMB-SVM technique generates superior or the same performance in terms of accuracy than those of learning-based methods. It generates 1.71 % , 0.45 % , 0.26 % and 0.14 % higher accuracy on images of IITD II datasets compared to those of “BSIF and SVM”, “GoogLeNet2”, “ResNet18 and SVM” and “Neural Network and SVM” techniques, respectively. Moreover, the proposed technique produces 0.08 % , 0.2 % , 1.14 % greater accuracy on images of USTM I dataset than those of “GoogLeNet”, “VGG-based Ensembles” and “Neural Network and SVM” methods, respectively. The proposed algorithm generates similar results to “ResNet18 and SVM” method.
The proposed CERMB-SVM algorithm can be applied to different applications including iris and drone recognition. The MATLAB implementation of the algorithm indicates that the proposed algorithm generates competitive results compared to those of learning-based algorithms at a portion of their computation cost; however, the real-time implementation of the proposed algorithm on DSP or FPGA can be considered as the future work for this research.

Author Contributions

Conceptualization, M.M.Z. and A.S.-A.; Funding acquisition, A.S.-A. and D.M.; Investigation, M.M.Z.; Methodology, M.M.Z. and A.S.-A.; Software, M.M.Z.; Supervision, A.S.-A. and D.M.; Writing—original draft, M.M.Z.; Writing—review and editing, M.M.Z. and A.S.-A. All authors have read and agreed to the published version of the manuscript.

Funding

This research was partly funded under a knowledge transfer partnership by Innovate UK (KTP 10304).

Institutional Review Board Statement

Not applicable.

Informed Consent Statement

Not applicable.

Data Availability Statement

The IITD II [19] and USTB I [20] datasets.

Acknowledgments

The first author would like to thank Leeds Beckett University for their support through a fully funded studentship.

Conflicts of Interest

The authors declare no conflict of interest.

References

  1. Nejati, H.; Zhang, L.; Sim, T.; Martinez-Marroquin, E.; Dong, G. Wonder ears: Identification of identical twins from ear images. In Proceedings of the 21st International Conference on Pattern Recognition (ICPR2012), Tsukuba, Japan, 11–15 November 2012; pp. 1201–1204. [Google Scholar]
  2. Emeršič, V.; Štruc, V.; Peer, P. Ear recognition: More than a survey. Neurocomputing 2017, 255, 26–39. [Google Scholar] [CrossRef] [Green Version]
  3. Victor, B.; Bowyer, K.; Sarkar, S. An evaluation of face and ear biometrics. Object Recognit. Support. User Interact. Serv. Robot. 2002, 1, 429–432. [Google Scholar] [CrossRef]
  4. Chang, K.; Bowyer, K.W.; Sarkar, S.; Victor, B. Comparison and combination of ear and face images in appearance-based biometrics. IEEE Trans. Pattern Anal. Mach. Intell. 2003, 25, 1160–1165. [Google Scholar] [CrossRef]
  5. Querencias-Uceta, D.; Ríos-Sánchez, B.; Sánchez-Ávila, C. Principal component analysis for ear-based biometric verification. In Proceedings of the 2017 International Carnahan Conference on Security Technology (ICCST), Madrid, Spain, 23–26 October 2017; pp. 1–6. [Google Scholar] [CrossRef]
  6. Turk, M.A.; Pentland, A.P. Face recognition using eigenfaces. In Proceedings of the 1991 IEEE Computer Society Conference on Computer Vision and Pattern Recognition Proceedings, Maui, HI, USA, 3–6 June 1991; pp. 586–591. [Google Scholar] [CrossRef]
  7. Basit, A.; Shoaib, M. A human ear recognition method using nonlinear curvelet feature subspace. Int. J. Comput. Math. 2014, 91, 616–624. [Google Scholar] [CrossRef]
  8. Nosrati, M.S.; Faez, K.; Faradji, F. Using 2D wavelet and principal component analysis for personal identification based on 2D ear structure. In Proceedings of the 2007 International Conference on Intelligent and Advanced Systems, Kuala Lumpur, Malaysia, 25–28 November 2007; pp. 616–620. [Google Scholar] [CrossRef]
  9. Hassaballah, M.; Alshazly, H.A.; Ali, A.A. Robust local oriented patterns for ear recognition. Multimed. Tools Appl. 2020, 79, 31183–31204. [Google Scholar] [CrossRef]
  10. Galdámez, P.L.; Arrieta, A.G.; Ramón, M.R. Ear recognition using a hybrid approach based on neural networks. In Proceedings of the 17th International Conference on Information Fusion (FUSION), Salamanca, Spain, 7–10 July 2014; pp. 1–6. [Google Scholar]
  11. Eyiokur, F.I.; Yaman, D.; Ekenel, H.K. Domain adaptation for ear recognition using deep convolutional neural networks. IET Biom. 2018, 7, 199–206. [Google Scholar] [CrossRef] [Green Version]
  12. Dodge, S.; Mounsef, J.; Karam, L. Unconstrained ear recognition using deep neural networks. IET Biom. 2018, 7, 207–214. [Google Scholar] [CrossRef]
  13. Alshazly, H.; Linse, C.; Barth, E.; Martinetz, T. Deep Convolutional Neural Networks for Unconstrained Ear Recognition. IEEE Access 2020, 8, 170295–170310. [Google Scholar] [CrossRef]
  14. Omara, I.; Wu, X.; Zhang, H.; Du, Y.; Zuo, W. Learning pairwise SVM on deep features for ear recognition. In Proceedings of the 2017 IEEE/ACIS 16th International Conference on Computer and Information Science (ICIS), Wuhan, China, 24–26 May 2017; pp. 341–346. [Google Scholar] [CrossRef]
  15. Benzaoui, A.; Hezil, N.; Boukrouche, A. Identity recognition based on the external shape of the human ear. In Proceedings of the 2015 International Conference on Applied Research in Computer Science and Engineering (ICAR), Beirut, Lebanon, 8–9 October 2015; pp. 1–5. [Google Scholar] [CrossRef]
  16. Ahmad, A.; Lemmond, D.; Boult, T.E. Chainlets: A New Descriptor for Detection and Recognition. In Proceedings of the 2018 IEEE Winter Conference on Applications of Computer Vision (WACV), Lake Tahoe, NV, USA, 12–15 March 2018; pp. 1897–1906. [Google Scholar] [CrossRef]
  17. Zarachoff, M.; Sheikh-Akbari, A.; Monekosso, D. 2D Multi-Band PCA and its Application for Ear Recognition. In Proceedings of the 2018 IEEE International Conference on Imaging Systems and Techniques (IST), Krakow, Poland, 16–18 October 2018; pp. 1–5. [Google Scholar] [CrossRef] [Green Version]
  18. Zarachoff, M.M.; Sheikh-Akbari, A.; Monekosso, D. Non-Decimated Wavelet Based Multi-Band Ear Recognition Using Principal Component Analysis. IEEE Access 2022, 10, 3949–3961. [Google Scholar] [CrossRef]
  19. IIT Delhi Ear Database. Available online: https://bit.ly/3rAPbWE. (accessed on 13 March 2018).
  20. Ear Recoginition Laboratory at USTB. Available online: http://www1.ustb.edu.cn/resb/en/index.htm (accessed on 25 June 2018).
  21. Brunner, C.; Fischer, A.; Luig, K.; Thies, T. Pairwise Support Vector Machines and their Application to Large Scale Problems. J. Mach. Learn. Res. 2012, 13, 2279–2292. [Google Scholar]
  22. Benzaoui, A.; Boukrouche, A. Ear recognition using local color texture descriptors from one sample image per person. In Proceedings of the 2017 4th International Conference on Control, Decision and Information Technologies (CoDIT), Barcelona, Spain, 5–7 April 2017; pp. 0827–0832. [Google Scholar] [CrossRef]
  23. Alshazly, H.; Linse, C.; Barth, E.; Martinetz, T. Ensembles of Deep Learning Models and Transfer Learning for Ear Recognition. Sensors 2019, 19, 4139. [Google Scholar] [CrossRef] [PubMed] [Green Version]
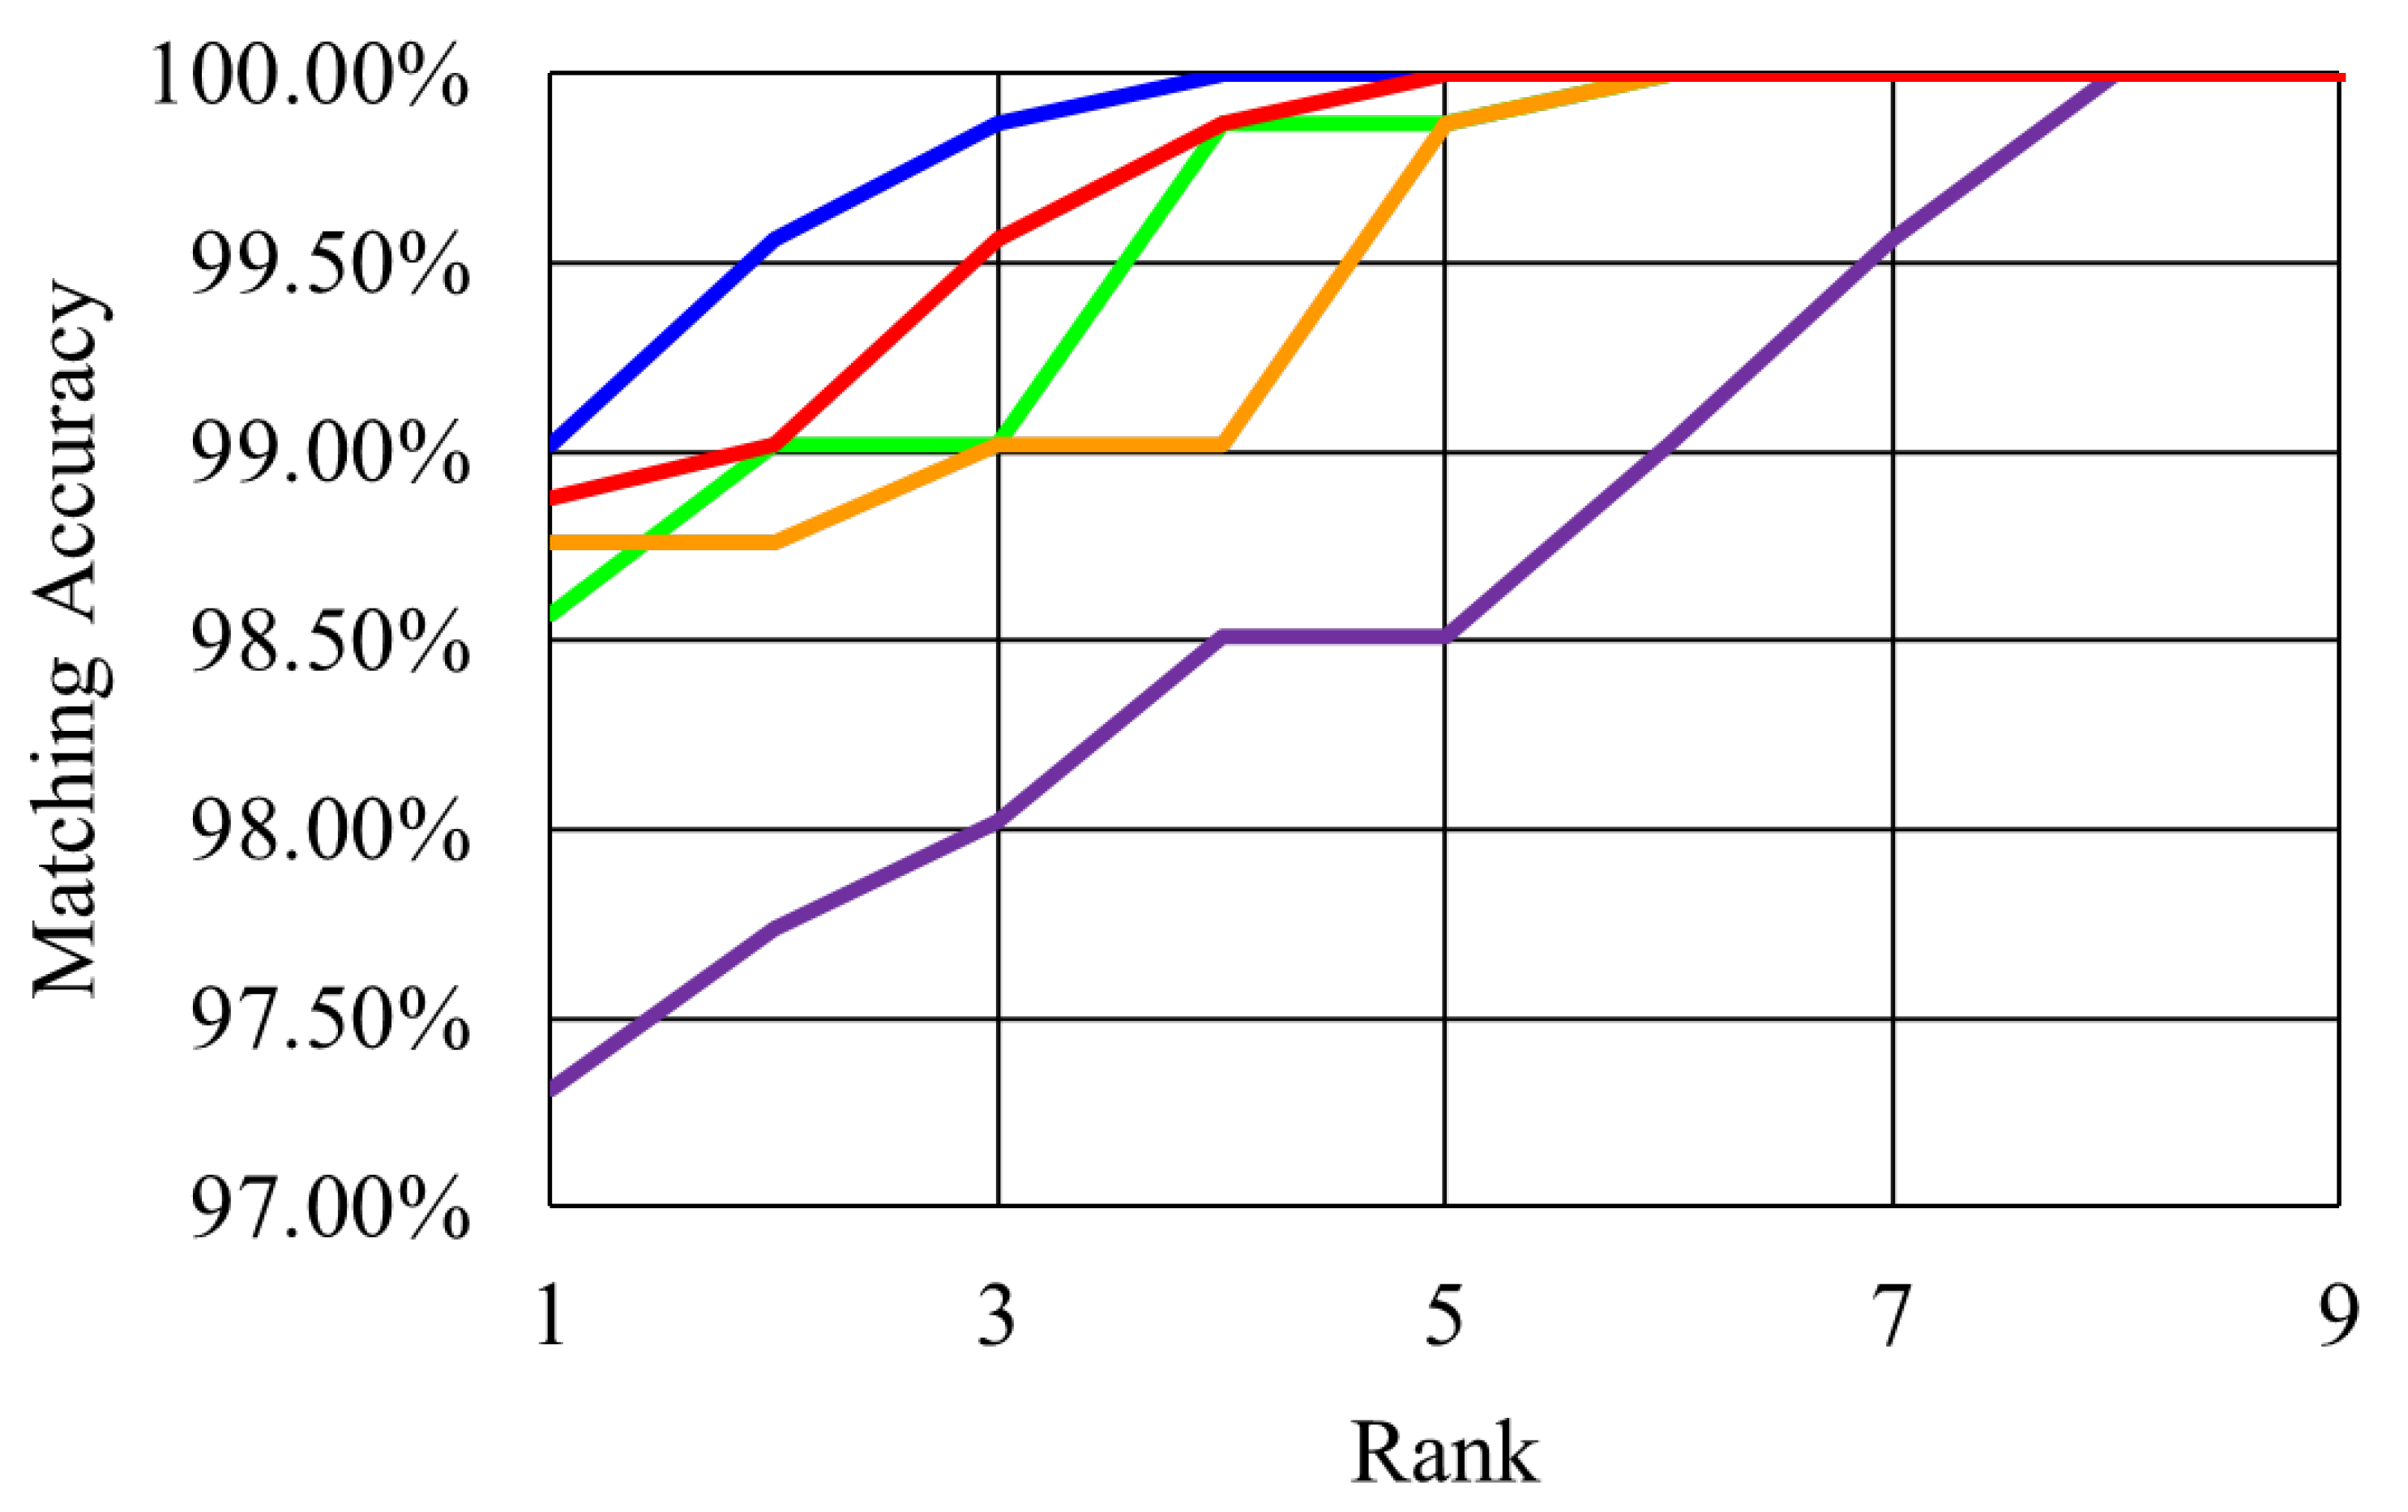
Figure 1. Chainlet-based Multi-Band SVM (CERMB-SVM) ear recognition algorithm.
Applsci 12 02033 g001
Figure 2. Chainlet code calculation process.
Applsci 12 02033 g002
Figure 3. The Freeman Chain Code of eight directions and a traversed edge, generating the chain code [0 0 0 7 7 7 6 6 2 2 3 3 3 4 4]. (a) Freeman Chain Code. (b) Edge Traversion.
Applsci 12 02033 g003
Figure 4. Two example images of unique persons from the IITD II dataset (a,b) [19]. Two example images of two unique persons from the USTB I dataset (c,d) [20].
Applsci 12 02033 g004
Figure 5. Region of interest of the CMC curves for Single Image PCA (purple), eigenfaces (orange), 2D-MBPCA (red), chainlets (green) and 2D-CERMB-SVM (blue) for the IITD II dataset [19].
Applsci 12 02033 g005
Figure 6. Region of interest of the CMC curves for single image PCA (purple), eigenfaces (orange), 2D-MBPCA (red), chainlets (green) and 2D-CERMB-SVM (blue) for the USTB I dataset [20].
Applsci 12 02033 g006
Figure 7. Region of interest of the CMC curves for ‘BSIF and SVM’ (purple), GoogLeNet (green), ‘ResNet18 and SVM’ (orange), VGG-based ensembles (red) and 2D-CERMB-SVM (blue) for the IITD II dataset [19].
Applsci 12 02033 g007
Figure 8. Region of interest of the CMC curves for ‘neural network and SVM’ (purple), GoogLeNet (green), VGG-based ensembles (red) and 2D-CERMB-SVM (blue) for the USTB I dataset [20]. The ‘ResNet18 and SVM’ method produced identical results to 2D-CERMB-SVM.
Applsci 12 02033 g008
Figure 9. The number of features and total eigenvector energy against the number of frames, where the intersection shows the number of frames for maximum attainable performance, for the IITD II dataset [19].
Applsci 12 02033 g009
Figure 10. The number of features and total eigenvector energy versus the number of frames, where the intersection reveals the number of frames for maximum attainable performance, for the USTB I dataset [20].
Applsci 12 02033 g010
Table 1. Experimental results for the suggested Chainlet-based Multi-Band Ear Recognition using Support Vector Machine (CERMB-SVM) ear recognition algorithms on the IITD II [19] dataset.
Number of BandsRank-1Rank-5
297.7999.85
398.44100.00
499.02100.00
598.25100.00
696.9499.63
Table 2. Experimental results for the suggested Chainlet-based Multi-Band Ear Recognition using Support Vector Machine (CERMB-SVM) ear recognition algorithm on the USTB I [20] dataset.
Number of BandsRank-1Rank-5
599.17100.00
699.17100.00
799.44100.00
899.44100.00
998.89100.00
Table 3. Experimental results for the suggested Chainlet-based Multi-Band Ear Recognition using Support Vector Machine (CERMB-SVM) ear recognition algorithm on IITD II [19] and USTB I [20] datasets.
AlgorithmDataset
IITD IIUSTB I
Statistical based Techniques
Single Image PCA36.3545.00
Eigenfaces [4]89.7875.93
2D-MBPCA [17]91.1285.19
Chainlets [16]98.5499.02
Learning based Techniques
BSIF and SVM [15]97.31-
GoogLeNet [11]98.5799.36
ResNet18 and SVM [12]98.7699.44
VGG-based Ensembles [23]98.8899.24
Neural Network and SVM [14]-98.30
Proposed CERMB-SVM Technique99.0299.44
Table 4. Average execution time (milliseconds) of the suggested CERMB-SVM and the state-of-the-art PCA-based and learning-based methods.
AlgorithmDataset
IITD IIUSTB I
PCA-based Techniques
Single Image PCA13.5512.16
Eigenfaces [4]3.101.82
2D-MBPCA [17]13.6413.07
Learning based Techniques
BSIF and SVM [15]23.57-
GoogLeNet [11]22.8821.59
ResNet18 and SVM [12]24.2423.88
VGG-based Ensembles [23]23.5122.79
Neural Network and SVM [14]-22.78
Proposed CERMB-SVM Technique22.2121.85
Publisher’s Note: MDPI stays neutral with regard to jurisdictional claims in published maps and institutional affiliations.

