Article

Site-Specific Earthquake Ground Motions for Seismic Design of Port Facilities in Indonesia

1
Department of Marine Transportation Engineering, Faculty of Marine Technology, Institut Teknologi Sepuluh Nopember, Surabaya 60111, Indonesia
2
Department of Civil Infrastructure Engineering, Faculty of Vocational, Institut Teknologi Sepuluh Nopember, Surabaya 60111, Indonesia
3
Research Center for Urban Safety and Security, Kobe University, Kobe City 657-8501, Japan
*
Author to whom correspondence should be addressed.
Appl. Sci. 2022, 12(4), 1963; https://doi.org/10.3390/app12041963
Submission received: 25 December 2021 / Revised: 30 January 2022 / Accepted: 2 February 2022 / Published: 14 February 2022
(This article belongs to the Topic Advances on Structural Engineering)

Abstract

:
In Indonesia, infrastructure, such as port facilities, has been damaged by earthquakes. Therefore, evaluating rational earthquake ground motions (EGMs) for seismic design is necessary to mitigate earthquake disasters in the future. The EGMs in the Indonesian Seismic Code are stipulated based on the ASCE standards and not on site-specific ones. This study aims to propose site-specific EGMs for the seismic design of port facilities in Indonesia. The EGM records and ground data in Indonesia were used for analysis. The EGM incidents in the bedrock were evaluated with deconvolution analysis. The obtained EGMs were amplitude-adjusted to peak ground acceleration similar to that of the EGMs in the bedrock in the Indonesian Seismic Code. A seismic response analysis considering nonlinear soil characteristics was conducted, and 144 EGMs at port sites were obtained. Considering the variation in the obtained EGMs, we propose site-specific EGMs for the seismic design of port facilities. A comparison of the proposed EGMs with those in the design code reveals that the difference between them is significant.

1. Introduction

Indonesia is an earthquake-prone country, and Sumatra is one of its high-seismicity regions. The seismic activity in Sumatra is characterized by two geological features: the Sunda megathrust, which is an inter-plate subduction zone between the Indo-Australian and Eurasian plates, and the Sumatra fault zone that divides Sumatra into two parts [1]. Indonesia’s infrastructure (e.g., port facilities) has been damaged by earthquakes, such as the Sumatra–Andaman Islands earthquake in 2004 [2], the South Sumatra earthquake in 2007 [3], the West Sumatra earthquake in 2009 [4], and the Mentawai earthquake in 2010 [5]. Port facilities are installed on soft soils in coastal areas; therefore, they are vulnerable to earthquakes. Earthquakes that occurred in other areas, such as the 1995 Kobe earthquake [6], the 1999 Kocaeli earthquake [7], and the 2020 Samos earthquake [8], also caused severe damage to port facilities and led to the stagnation of the social economy.
Evaluating the rational earthquake ground motions (EGMs) for seismic design is necessary to mitigate seismic disasters in high-seismicity countries, such as Indonesia. The seismic design code applied to port facilities in Indonesia is SNI 1726:2019, “Seismic Design Criteria for Buildings and Other Structures” (SNI) [9]. The code provides EGMs based on ASCE 7–16 [10] and the 2017 Indonesian Seismic Hazard Maps (ISHM) [11]. We provide a brief overview of how EGMs for seismic design are set up in the SNI.
The ISHM was developed using an enhanced probabilistic seismic hazard analysis (PSHA). In the PSHA, the EGMs corresponding to a certain exceedance probability were evaluated by referring to the historical seismic data around the target area from 1900 to 2016. The distances between the target points and the reference fault planes were also referenced. Only one exceedance probability of the EGM is referred to in the SNI (2% in 50 years, with 2475 years as a return period) [9]. The exceedance probability corresponds to that of the EGM to assess the structural performance level of life safety protection in ASCE 7–16. The representative values of the EGMs shown in the ISHM are peak ground accelerations (PGAs) and spectral accelerations (SAs) with periods of 0.2 s and 1.0 s, respectively, at rock site. The waveforms used in the PSHA are not revealed.
EGM amplification occurs at sites with a sedimentary layer, and the degree of amplification differs depending on the ground condition. The shallow subsurface is classified into six site classes in the SNI (Table 1). Site class SF refers to extremely soft ground on which the construction of structures is prohibited; therefore, it is not subject to seismic design. The SAs of other site classes are obtained by multiplying the amplification factor with the SA of the rock site. The amplification factor for each site class is based on the work of Stewart and Seyhan [12]. Stewart and Seyhan [12] simply modeled the ground using data on the average shear wave velocity of the top 30 m (Vs30) and conducted a seismic response analysis. The amplification factor for seismic design was then determined as the average value of the analysis result for each ground condition.
The EGMs for seismic design shall be determined as site-specific ones [13,14]. Research examples on site-specific EGMs include those of Kim et al. [15], Nguyen et al. [16], and Nagao [17] for the EGMs of Korea, Vietnam, and Japan, respectively. No case study on site-specific EGMs has yet been conducted to replace the EGMs in the SNI. The SNI EGMs might be reasonable in terms of the PGAs for sites with thin sedimentary layers because they were determined by a PSHA considering Indonesian seismicity, and the EGM amplification only had a slight effect. However, its validity has not been confirmed for the SAs at sites with sedimentary layers. First, the ground models of Stewart and Seyhan [12] were overly simplified, and the ground data referred to were those in the United States, Japan, and other areas outside Indonesia. The amplification characteristics of EGMs strongly depend on ground profiles. Soft ground exhibits a nonlinear response during a massive earthquake. The degree of nonlinear response strongly depends on the ground profiles. Second, EGMs are governed by the source, path, and site amplification characteristics. Therefore, the ground motions observed in Indonesia must be analyzed to discuss the EGMs for seismic design in Indonesia.
This study aimed to propose site-specific EGMs for the seismic design of port facilities in Indonesia. The ground is composed of both shallow and deep subsurfaces, and the amplification factor of the EGM is much larger in the latter than in the former. Therefore, the effect of the deep subsurface should be appropriately considered for a site-specific EGM evaluation [13,17,18]. In addition, if there was information on the 3D ground structure down to the deep subsurface, EGMs were estimated using physics-based models [19,20,21,22]. However, no data on the above were available; therefore, we focused only on the shallow subsurface amplification. If there was a number of EGM records available, the horizontal-to-vertical spectral ratio (HVSR) method [23,24,25] can be applied to evaluate the site class and site amplification factors. However, the number of EGM records is very small. Accordingly, we discussed site amplification factors based on borehole data.
Port facilities are constructed on soft ground in coastal areas; thus, the SD and SE site classes were targeted. The EGM records obtained in Indonesia were collected, and the effects of the shallow subsurfaces at the observation sites were removed by a seismic response analysis to calculate the EGM incidents in the bedrock. The seismic waveforms in the bedrock were amplitude-adjusted so the PGA value agreed with that of the SNI bedrock. Next, the borehole data of the port areas in Indonesia were collected to construct ground models. The EGMs in the port areas were calculated by performing a seismic response analysis of 144 cases that considered the nonlinear characteristics of the shallow subsurfaces. Finally, we proposed EGMs for the seismic design of port facilities in Indonesia through a statistical processing of the obtained EGMs, and we compared these proposed EGMs with those in the current design code.

2. Methods

2.1. EGM Incidents in the Bedrock

Although Indonesia has experienced a number of huge earthquakes, only a few EGM records are available, and the EGM records for port areas are missing. Furthermore, the observed EGMs have been affected by the ground at the seismograph installation site; thus, they cannot be used for the seismic design of port facilities by simply adjusting the amplitudes of the observed EGMs. The effects of the shallow subsurfaces must be removed by a seismic response analysis, and the EGM incidents in the bedrock must be evaluated. In this study, nine EGM records (Figure 1, Table 2) were collected with the ground data of the observation sites. All were records of massive earthquakes with a moment magnitude (Mw) of 6.0 or larger. However, the PGAs were small due to the long hypocentral distances.
The observed EGM records contained two horizontal component records. To make the most of the limited number of EGM records, the two horizontal components were treated independently in this study. As a result, the number of EGM records was 18. Before the seismic response analysis was conducted, baseline correction was first performed, and the EGM records were tapered. Figure 2 shows the Fourier spectra of the east–west direction component of the EGMs. The Fourier spectra of MTW 1 07 S showed large amplitudes in the frequency range higher than 1 Hz because its peak ground acceleration of 0.12 g was higher than those of the other EGMs (0.015–0.04 g). Predominant frequencies covered a wide range, from 0.5 to 4 Hz, showing that EGMs with varying frequency characteristics were provided.
A frequency domain seismic response analysis that considered nonlinear soil characteristics was performed to evaluate the EGM incidents in the bedrock using the EGM records at the ground surface (deconvolution). For the shear modulus and the damping coefficient dependencies on the shear strain, we referred to Seed and Idriis [26] for sandy soil and Vucetic and Dobry [27] for cohesive soil. Figure 3 illustrates the nonlinear soil characteristics considered in this study. The dashed line expresses the sandy soil characteristics. The solid line denotes those of the cohesive soil. The blue line shows the shear modulus normalized by the initial value (G/Gmax), while the red line depicts the damping coefficient. DEEPSOIL software [28] was used for the analysis.
The collected ground data only provided the unit weight and the N-values obtained by the standard penetration test. The S-wave velocity of each soil layer was calculated using the correlation equation proposed by Imai and Tonouchi [29]. Table 3 shows the soil conditions of the Sikuai Island station as an example. For this site, the hard clay silt of the sixth layer was treated as the bedrock. Figure 4 shows the time history and the Fourier spectrum of the EGM at the ground surface and the bedrock with reference to the east–west direction component of MTW1 07 S. The predominant amplitude of 4 Hz in the EGM on the ground surface was due to the shallow subsurface; thus, the predominant frequency in the EGM incident in the bedrock was unclear.
Next, the PGA of the EGM incident in the bedrock was matched to that of the SNI at the very dense soil site of site class SC. The matched PGA was 0.40 g. Figure 5 shows the SA referring to the east–west direction component of MTW1 07 S (red line), which is compared with the SA of the SNI for site class SC (black line). In this case, the SA of the bedrock in a very short period range was larger than that of the SNI, but the SA was smaller than that of the SNI in the period band of 0.3 s or longer. The amplitudes of the individual SAs are different from that of the SA of the SNI. Regarding the SA shown in Figure 5, the large SA of MTW1 07 S in the very short period range is attributed to the comparatively large Fourier amplitude in the high-frequency range of the bedrock EGM shown in Figure 4.

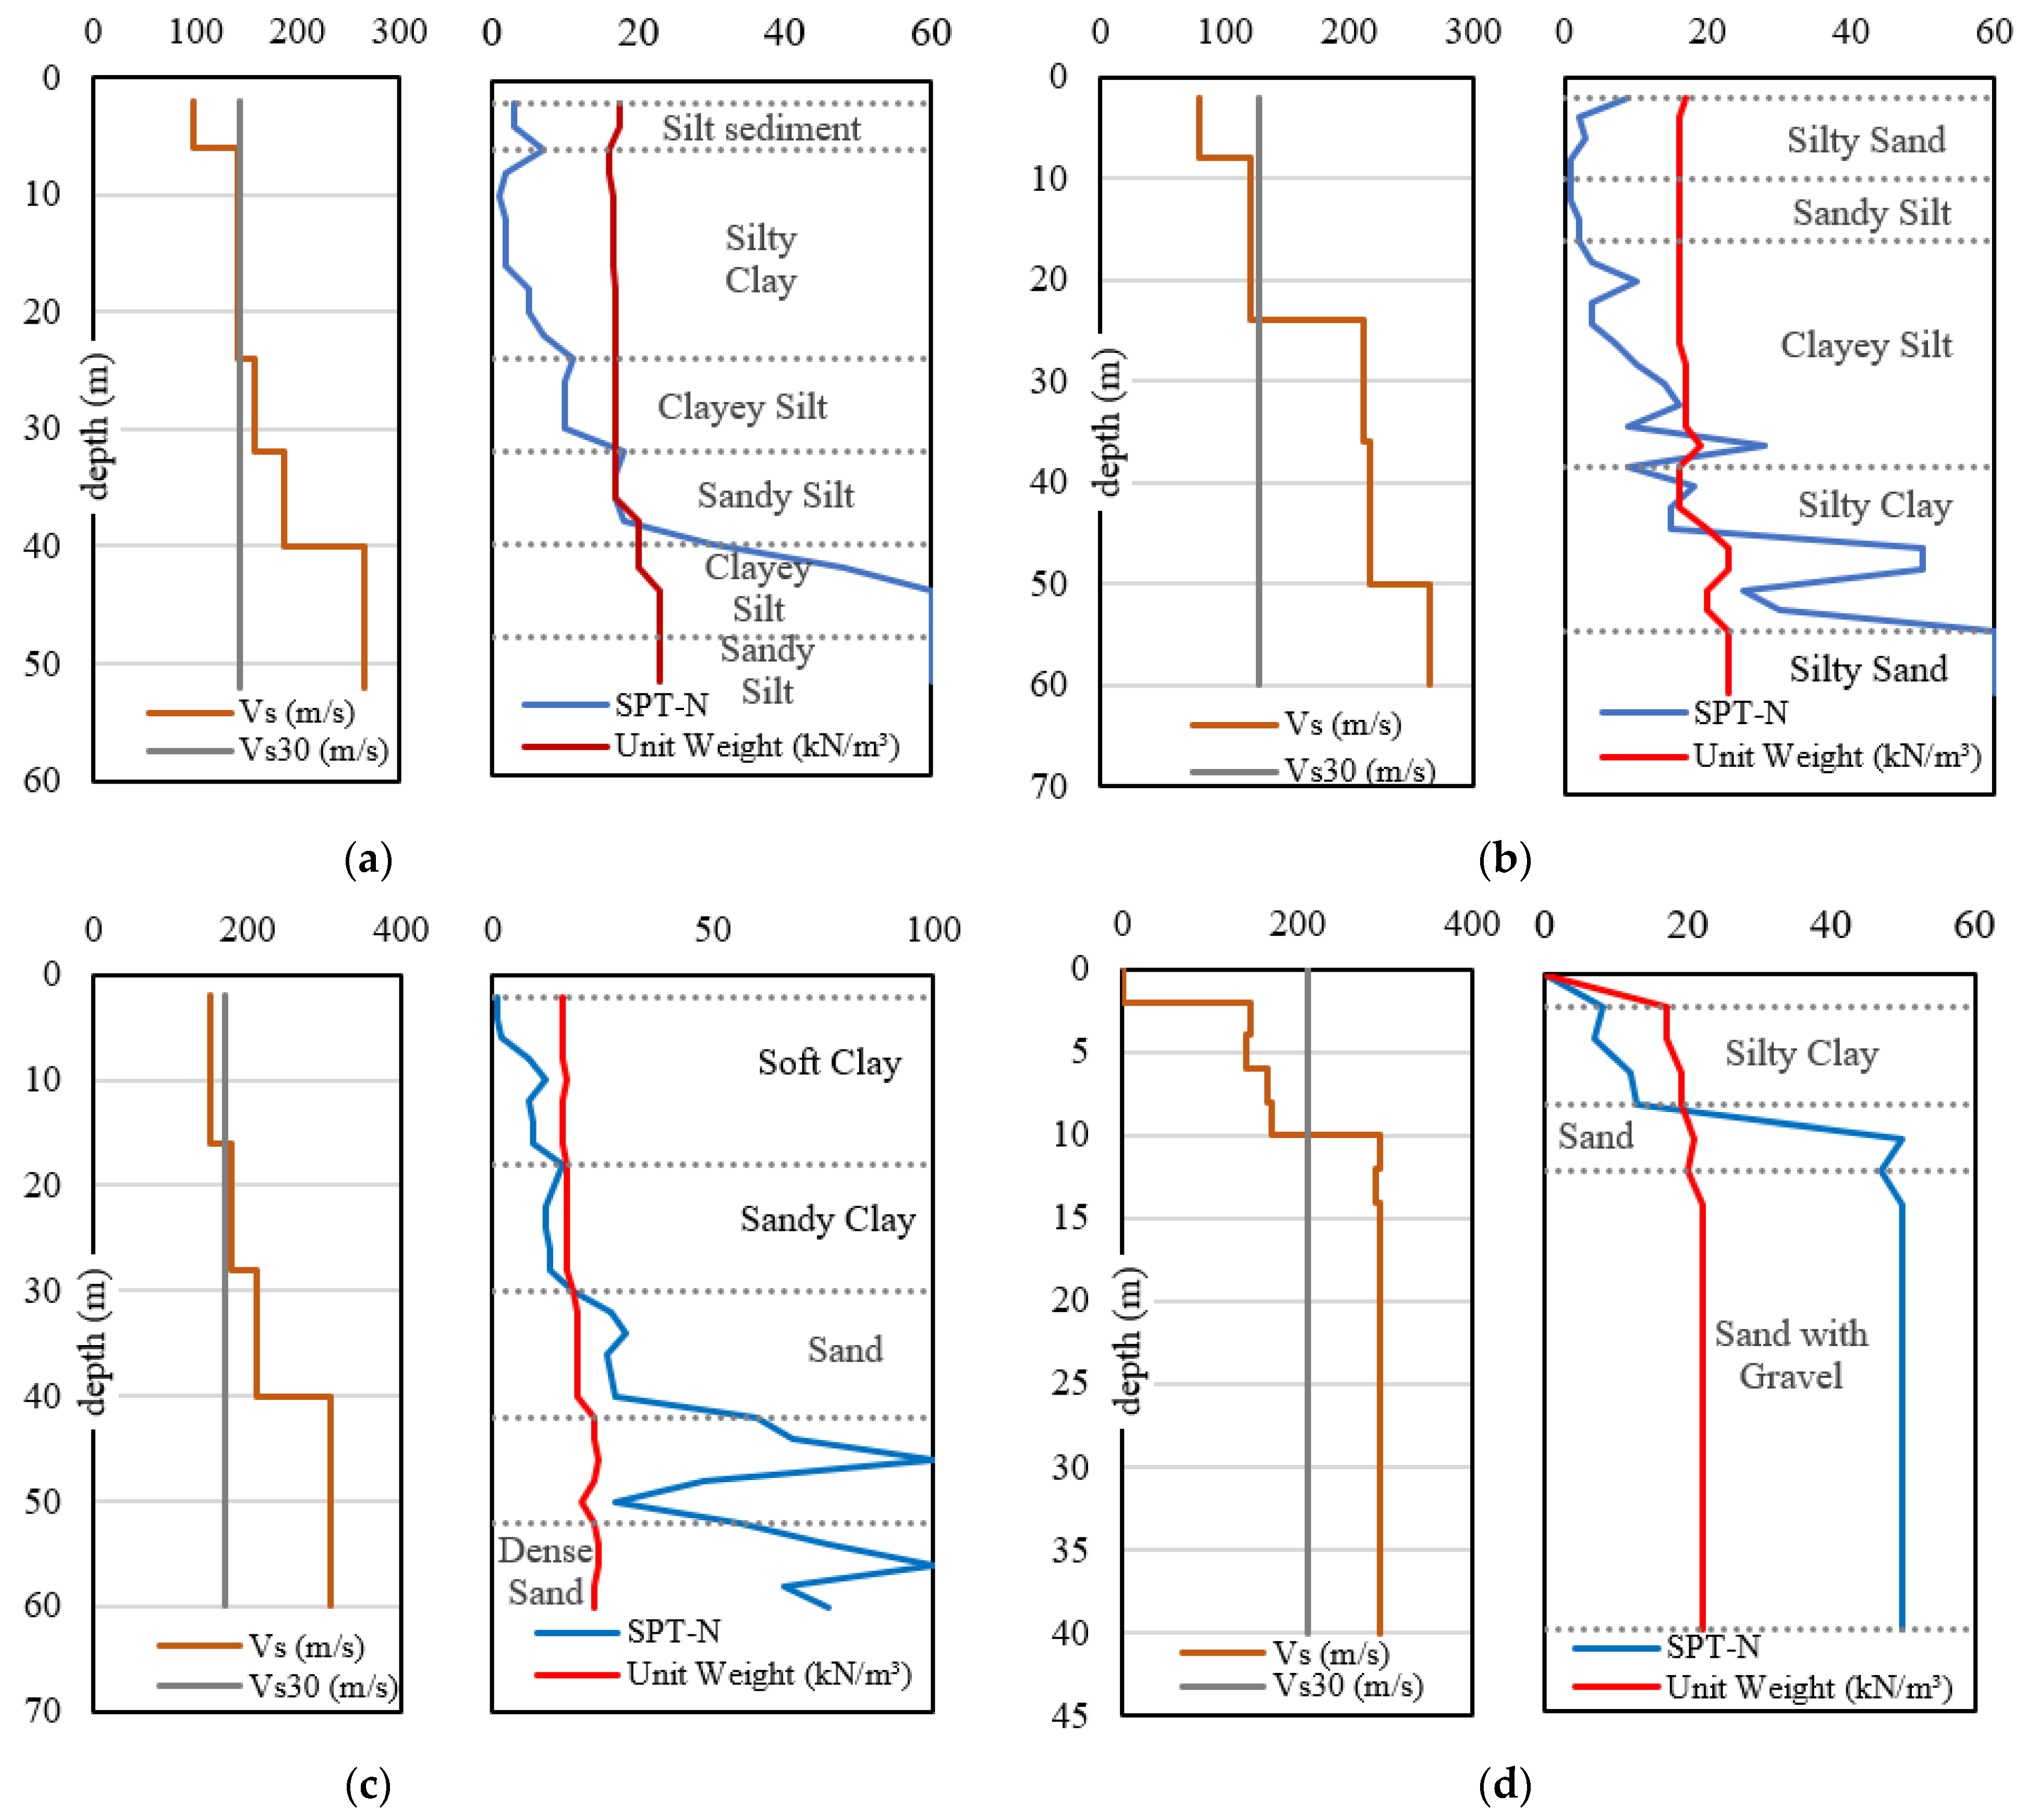
2.2. EGMs in Port Areas

This study targeted four port sites in Sumatra: the Pupuk Iskandar Muda Jetty (PIM), Tarahan Powerplant Jetty (TPJ), Port of Teluk Bayur (PTB), and the Port of Kuala Tanjung (PKT) (Figure 1). Two boring data per site, which provided a total of eight data, were collected. Figure 6 shows four soil profiles. The S-wave velocities were evaluated from the N-values in a manner similar to that described in the previous section. The depths of the bedrock varied from −10 to −50 m. Only the PIM belonged to the SD site class. The other three sites were classified under the SE site class. This meant that most of the site classes of the port sites in Indonesia are classified as SE.
Figure 7 illustrates the transfer functions for the target locations. The transfer function of site class SD (PIM) showed a predominant frequency of 1.92 Hz with an amplification factor of 4.03. The predominant frequencies at site class SE ranged from 0.96 to 1.26 Hz, depicting smaller values compared to the value at site class SD. The peak amplitudes at the predominant frequencies ranged from 3.36 to 3.94. Note that the transfer functions were calculated using the initial shear modulus of the soil (i.e., before an earthquake). Using the 18 EGM incidents in the bedrock and the 8 shallow subsurface data, the 144 EGMs on the ground surfaces were calculated by a seismic response analysis that considered the nonlinear soil characteristics. The numbers of EGMs for site classes SD and SE were 38 and 106, respectively.

3. Results and Discussion

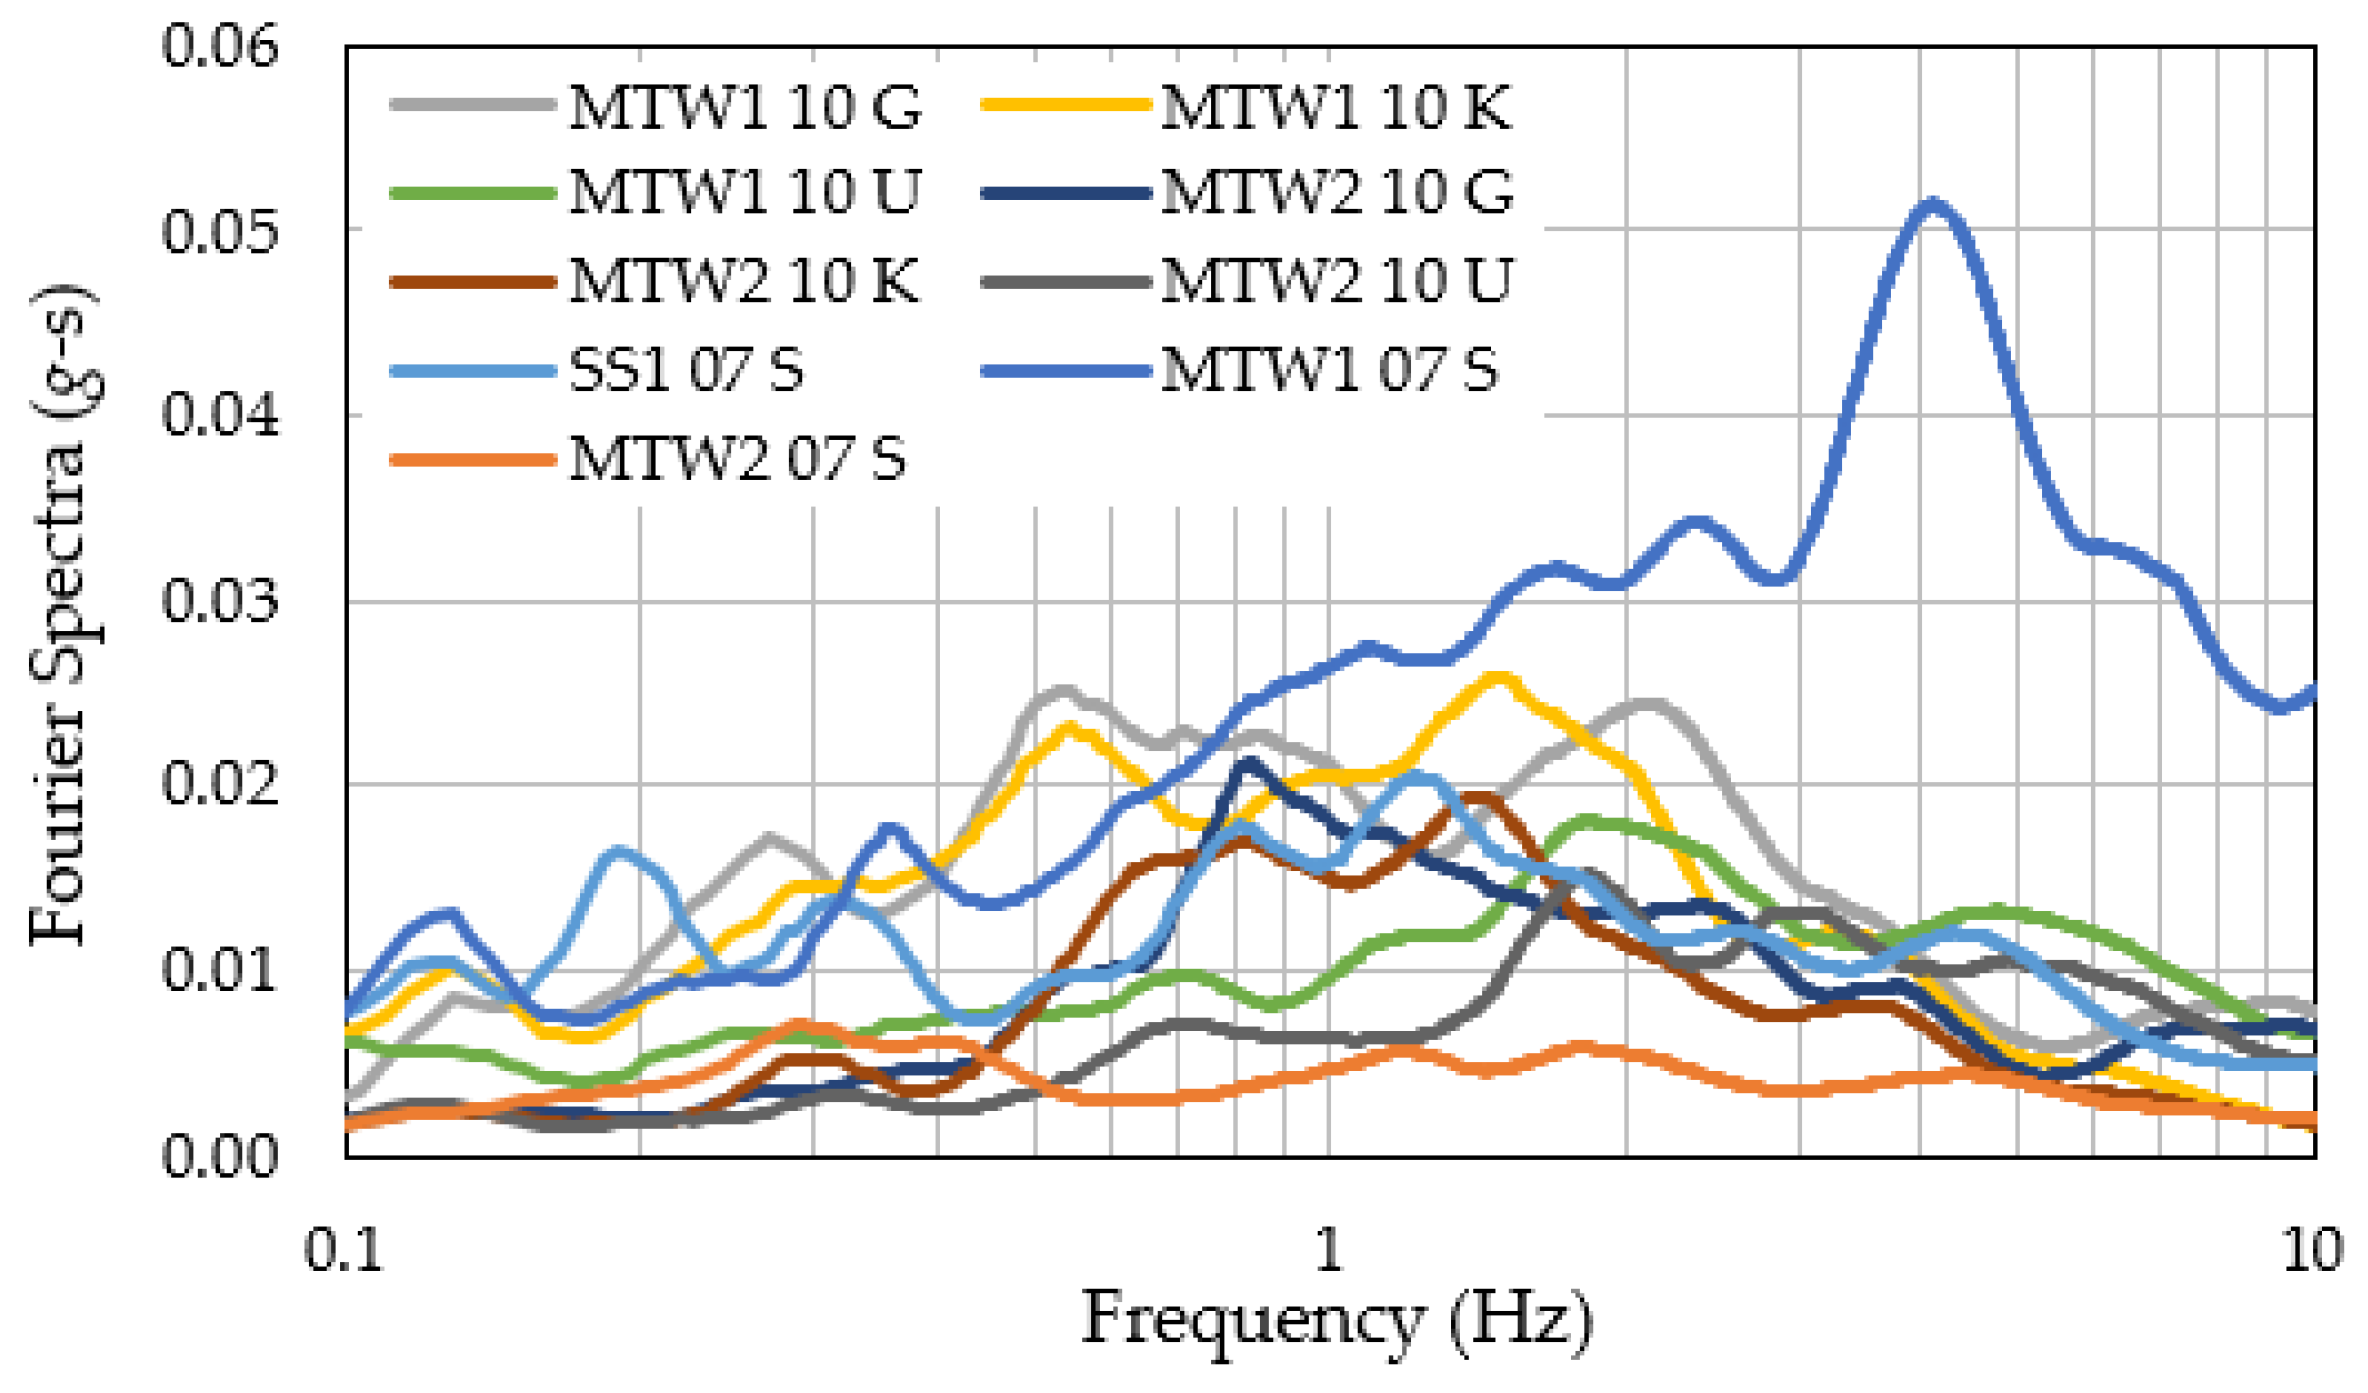
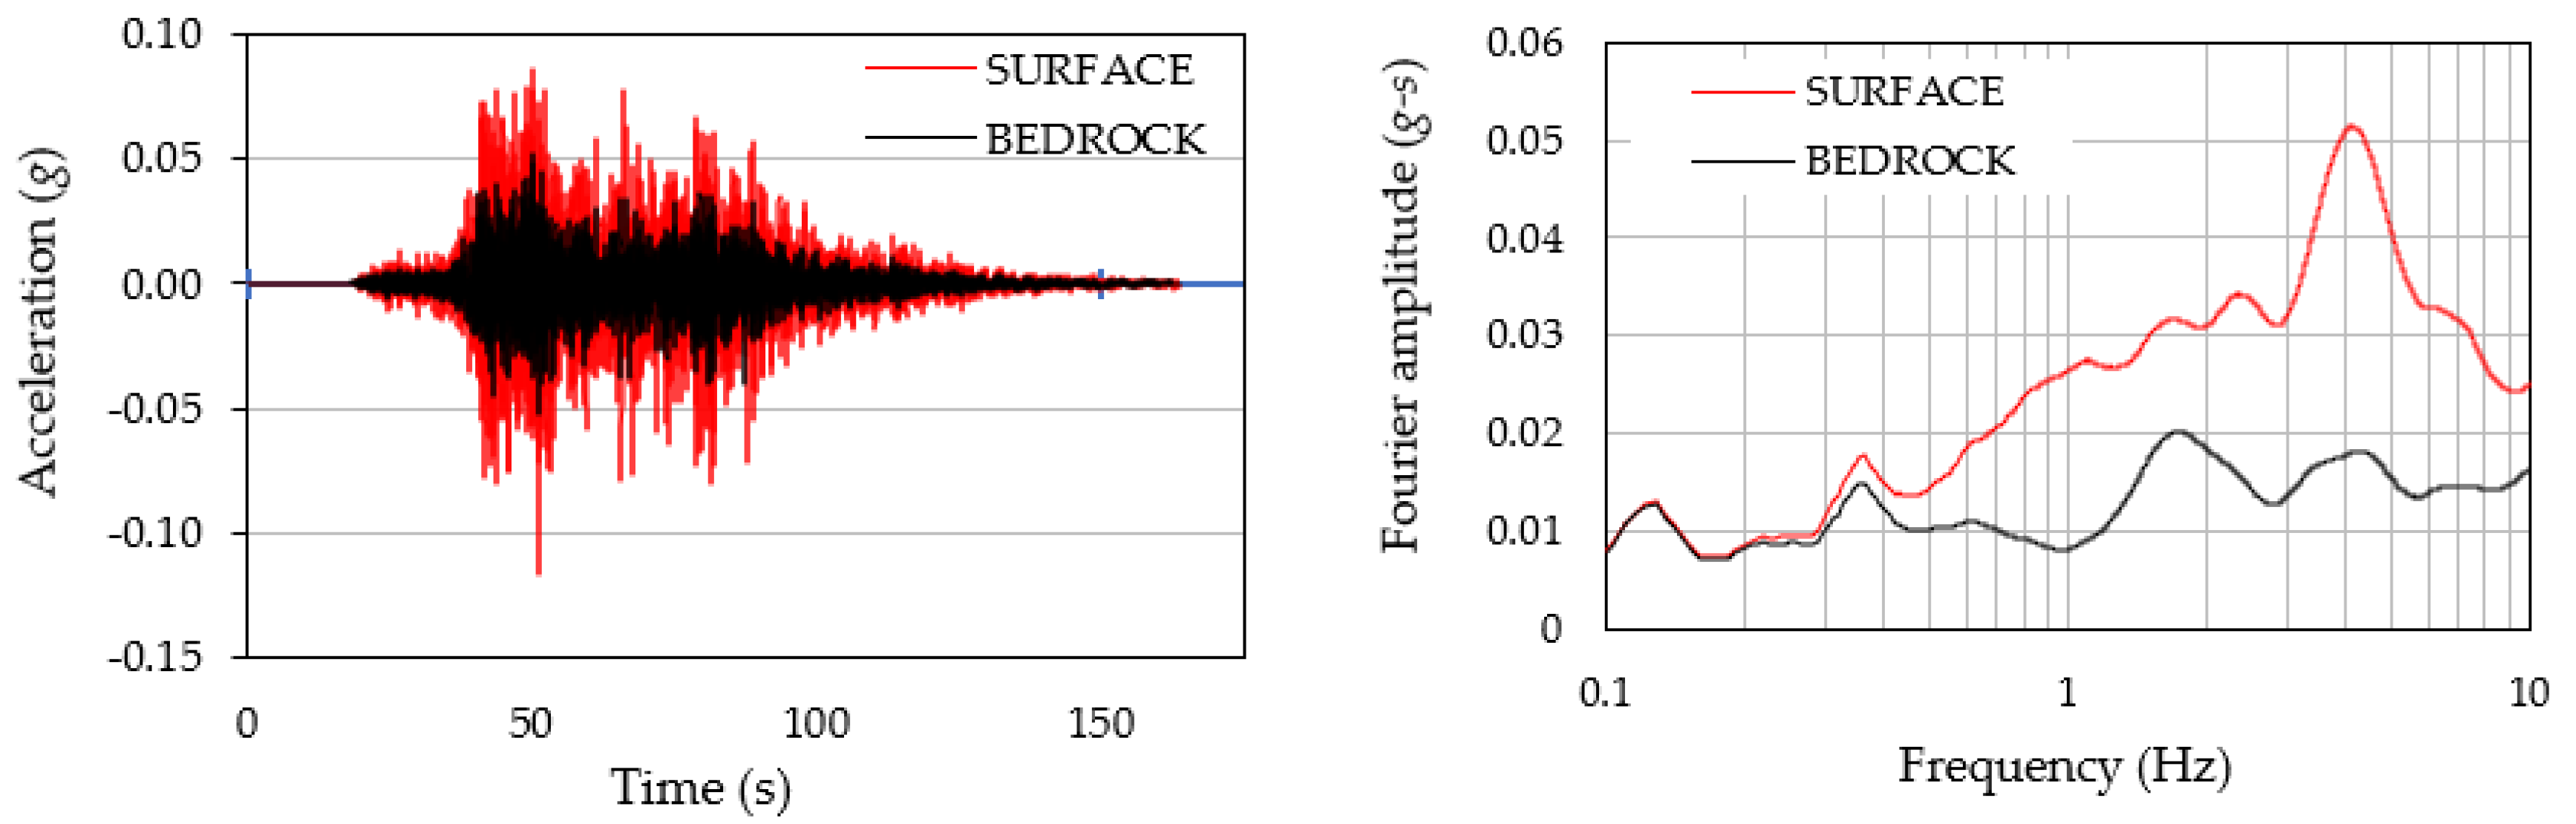
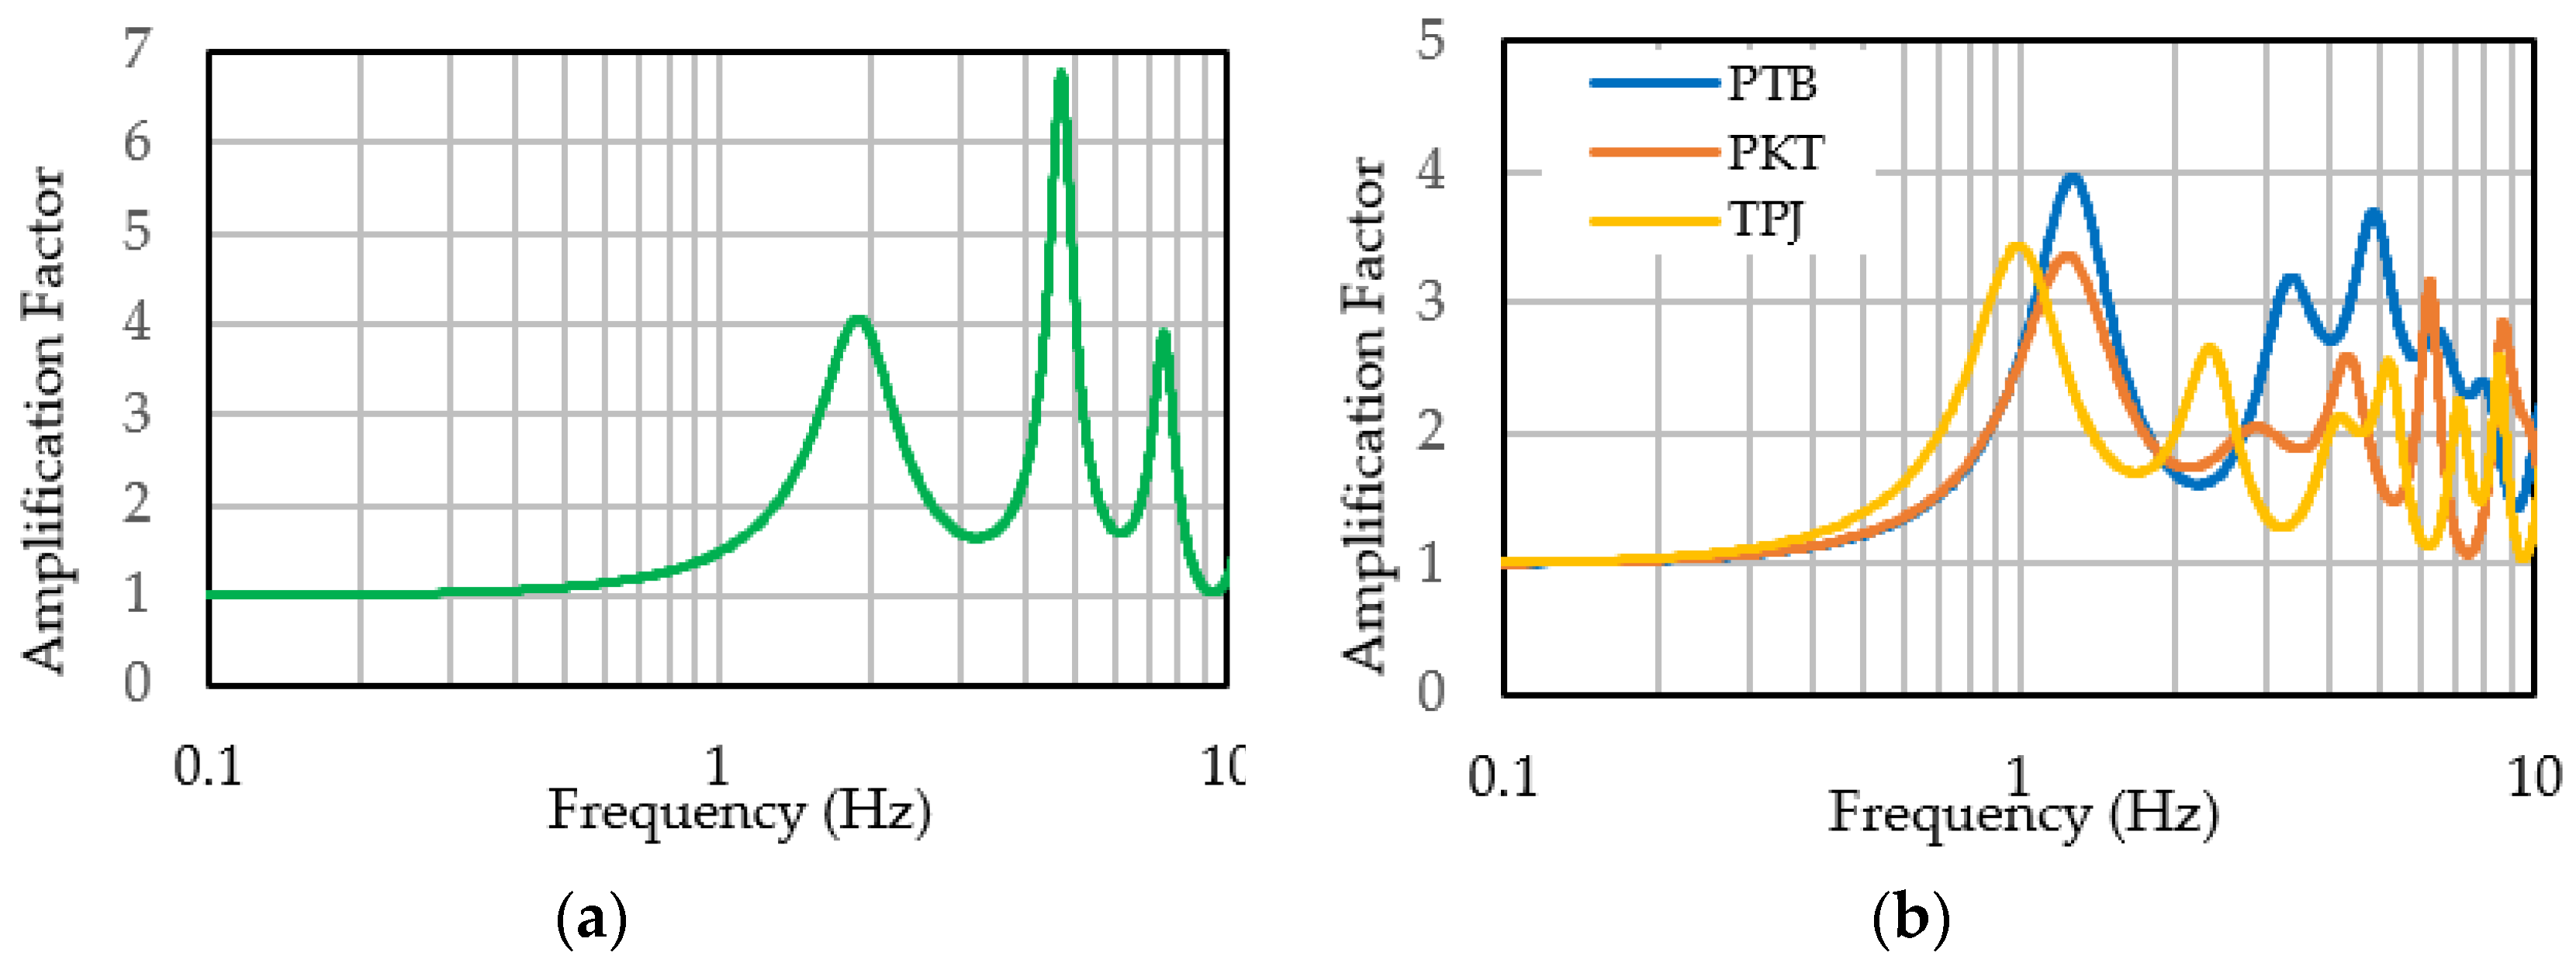
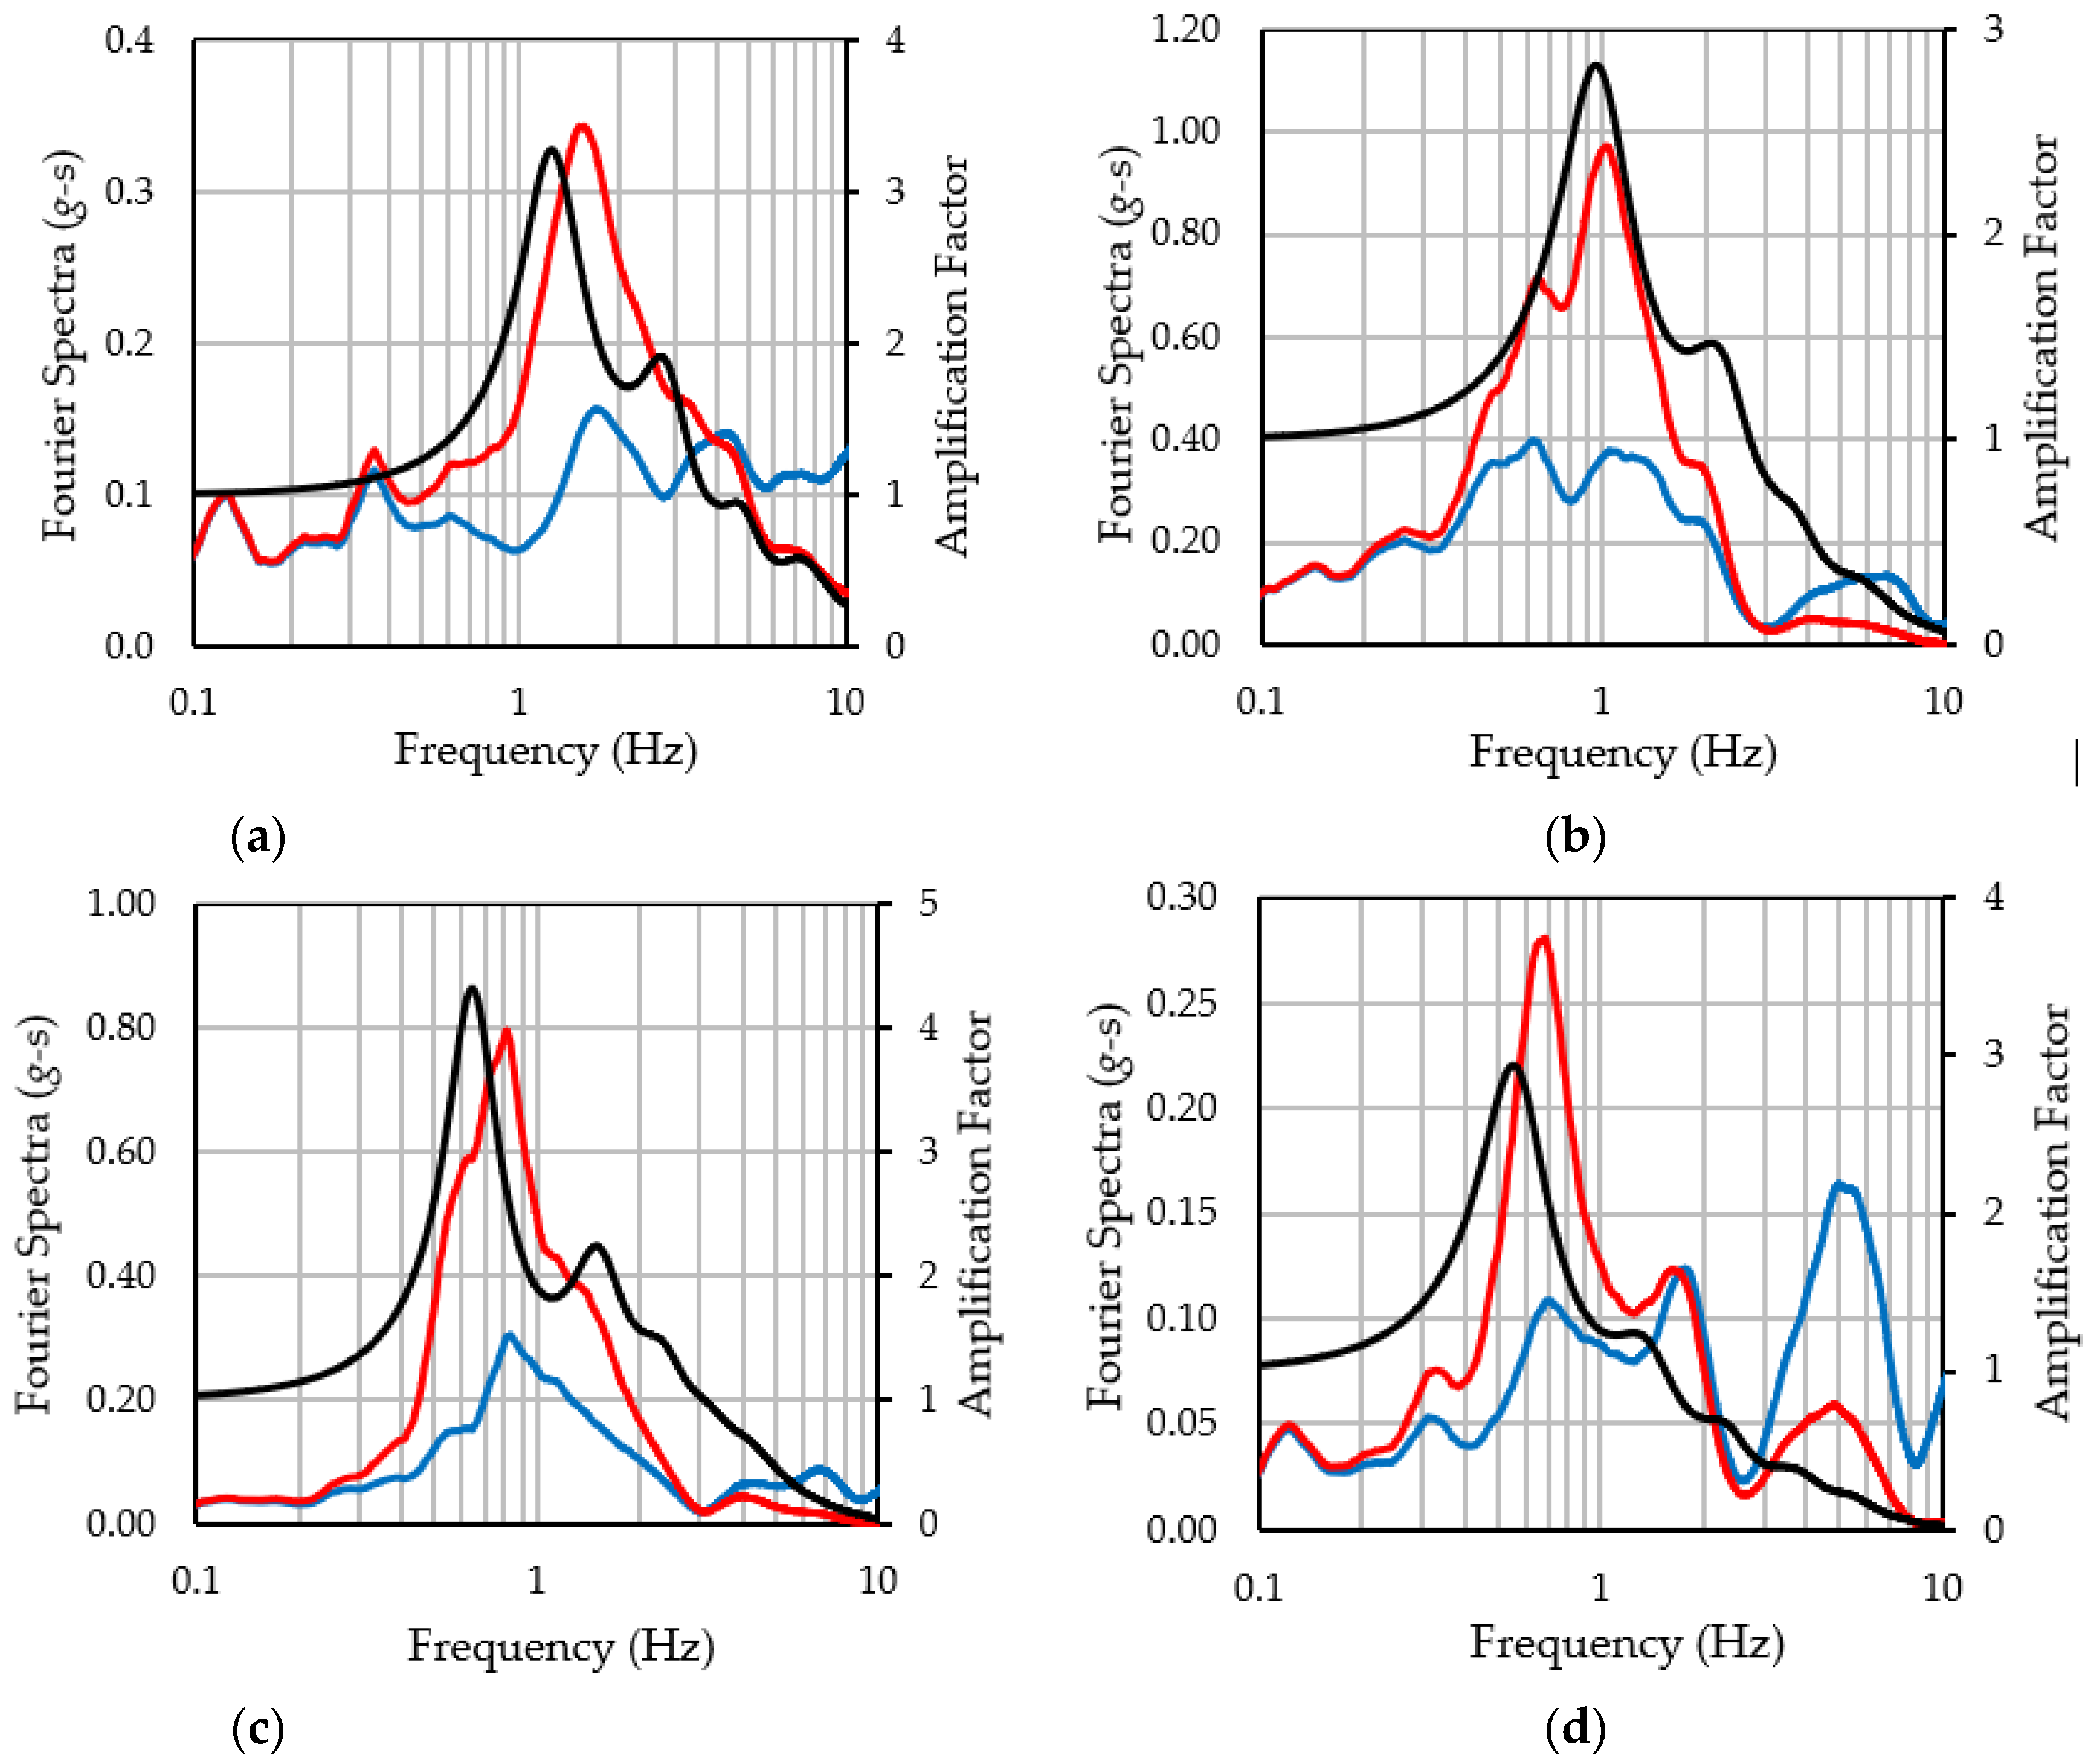
3.1. EGMs at the Port Sites

Figure 8 depicts the obtained SAs for each site class. The SA dispersion was very large for both site classes. In particular, the dispersion was large in the period band of 1.0 s or shorter for site class SD and 1.5 s or shorter for site class SE. The natural period of a quay is usually shorter than 1.5 s; therefore, this result indicated that the SA dispersion was very large in the natural period zone of the quay.
We now discuss the reason behind this large SA dispersion. Figure 9 displays the large (red line) and small (blue line) SA results together with the average + SD SA (black line) for each site class. For the SD class, the case involving a very large SA showed very large values in the period band of 0.7–1.0 s. In the other period bands, the SAs were not large compared with the average + SD SAs. A similar pattern was seen in the SE class. The SAs were very large in the period band of 1.0–1.5 s, but did not show very large values in the other period bands. In contrast, in cases with low SAs, the SAs depicted small values compared to the average + SD SAs in the entire period range. This suggests that the amplification characteristics of the shallow subsurfaces strongly affect the SA amplitudes.
Figure 10 illustrates the Fourier spectrum of the EGM incidents (blue line), the transfer function by the shallow subsurface (black line), and the Fourier spectra of EGMs at the ground surface (red line). In cases where the SA became very large, the predominant frequencies of the EGM incidents in the bedrock agreed with those of the transfer functions, resulting in large SAs at specific period bands. In cases where the SA became very small, in addition to the fact that the Fourier spectra of the EGM incidents were small, the two predominant frequencies did not agree, resulting in small SAs.
The SA variation was very large; thus, site-specific EGMs for seismic design must be set using individual ground conditions by methods such as those shown in this study. However, in many cases, the ground data at sites of interest were not obtained in detail. In such cases, the degree of coincidence between the natural period of the port facilities and that of the shallow subsurfaces must be assessed. Attention must be paid to the decrease in the shear rigidity of soft soils during massive earthquakes because it results in an increase in the natural period of the shallow subsurface. Figure 11 shows a comparison of the transfer functions before an earthquake (red line) and during earthquake (blue line) at the points shown in Figure 9a. The natural frequency decreased from the initial value of 1.28 to 0.92 Hz during an earthquake. The SA became very large when the natural period of the port facilities coincided with that of the shallow subsurface.

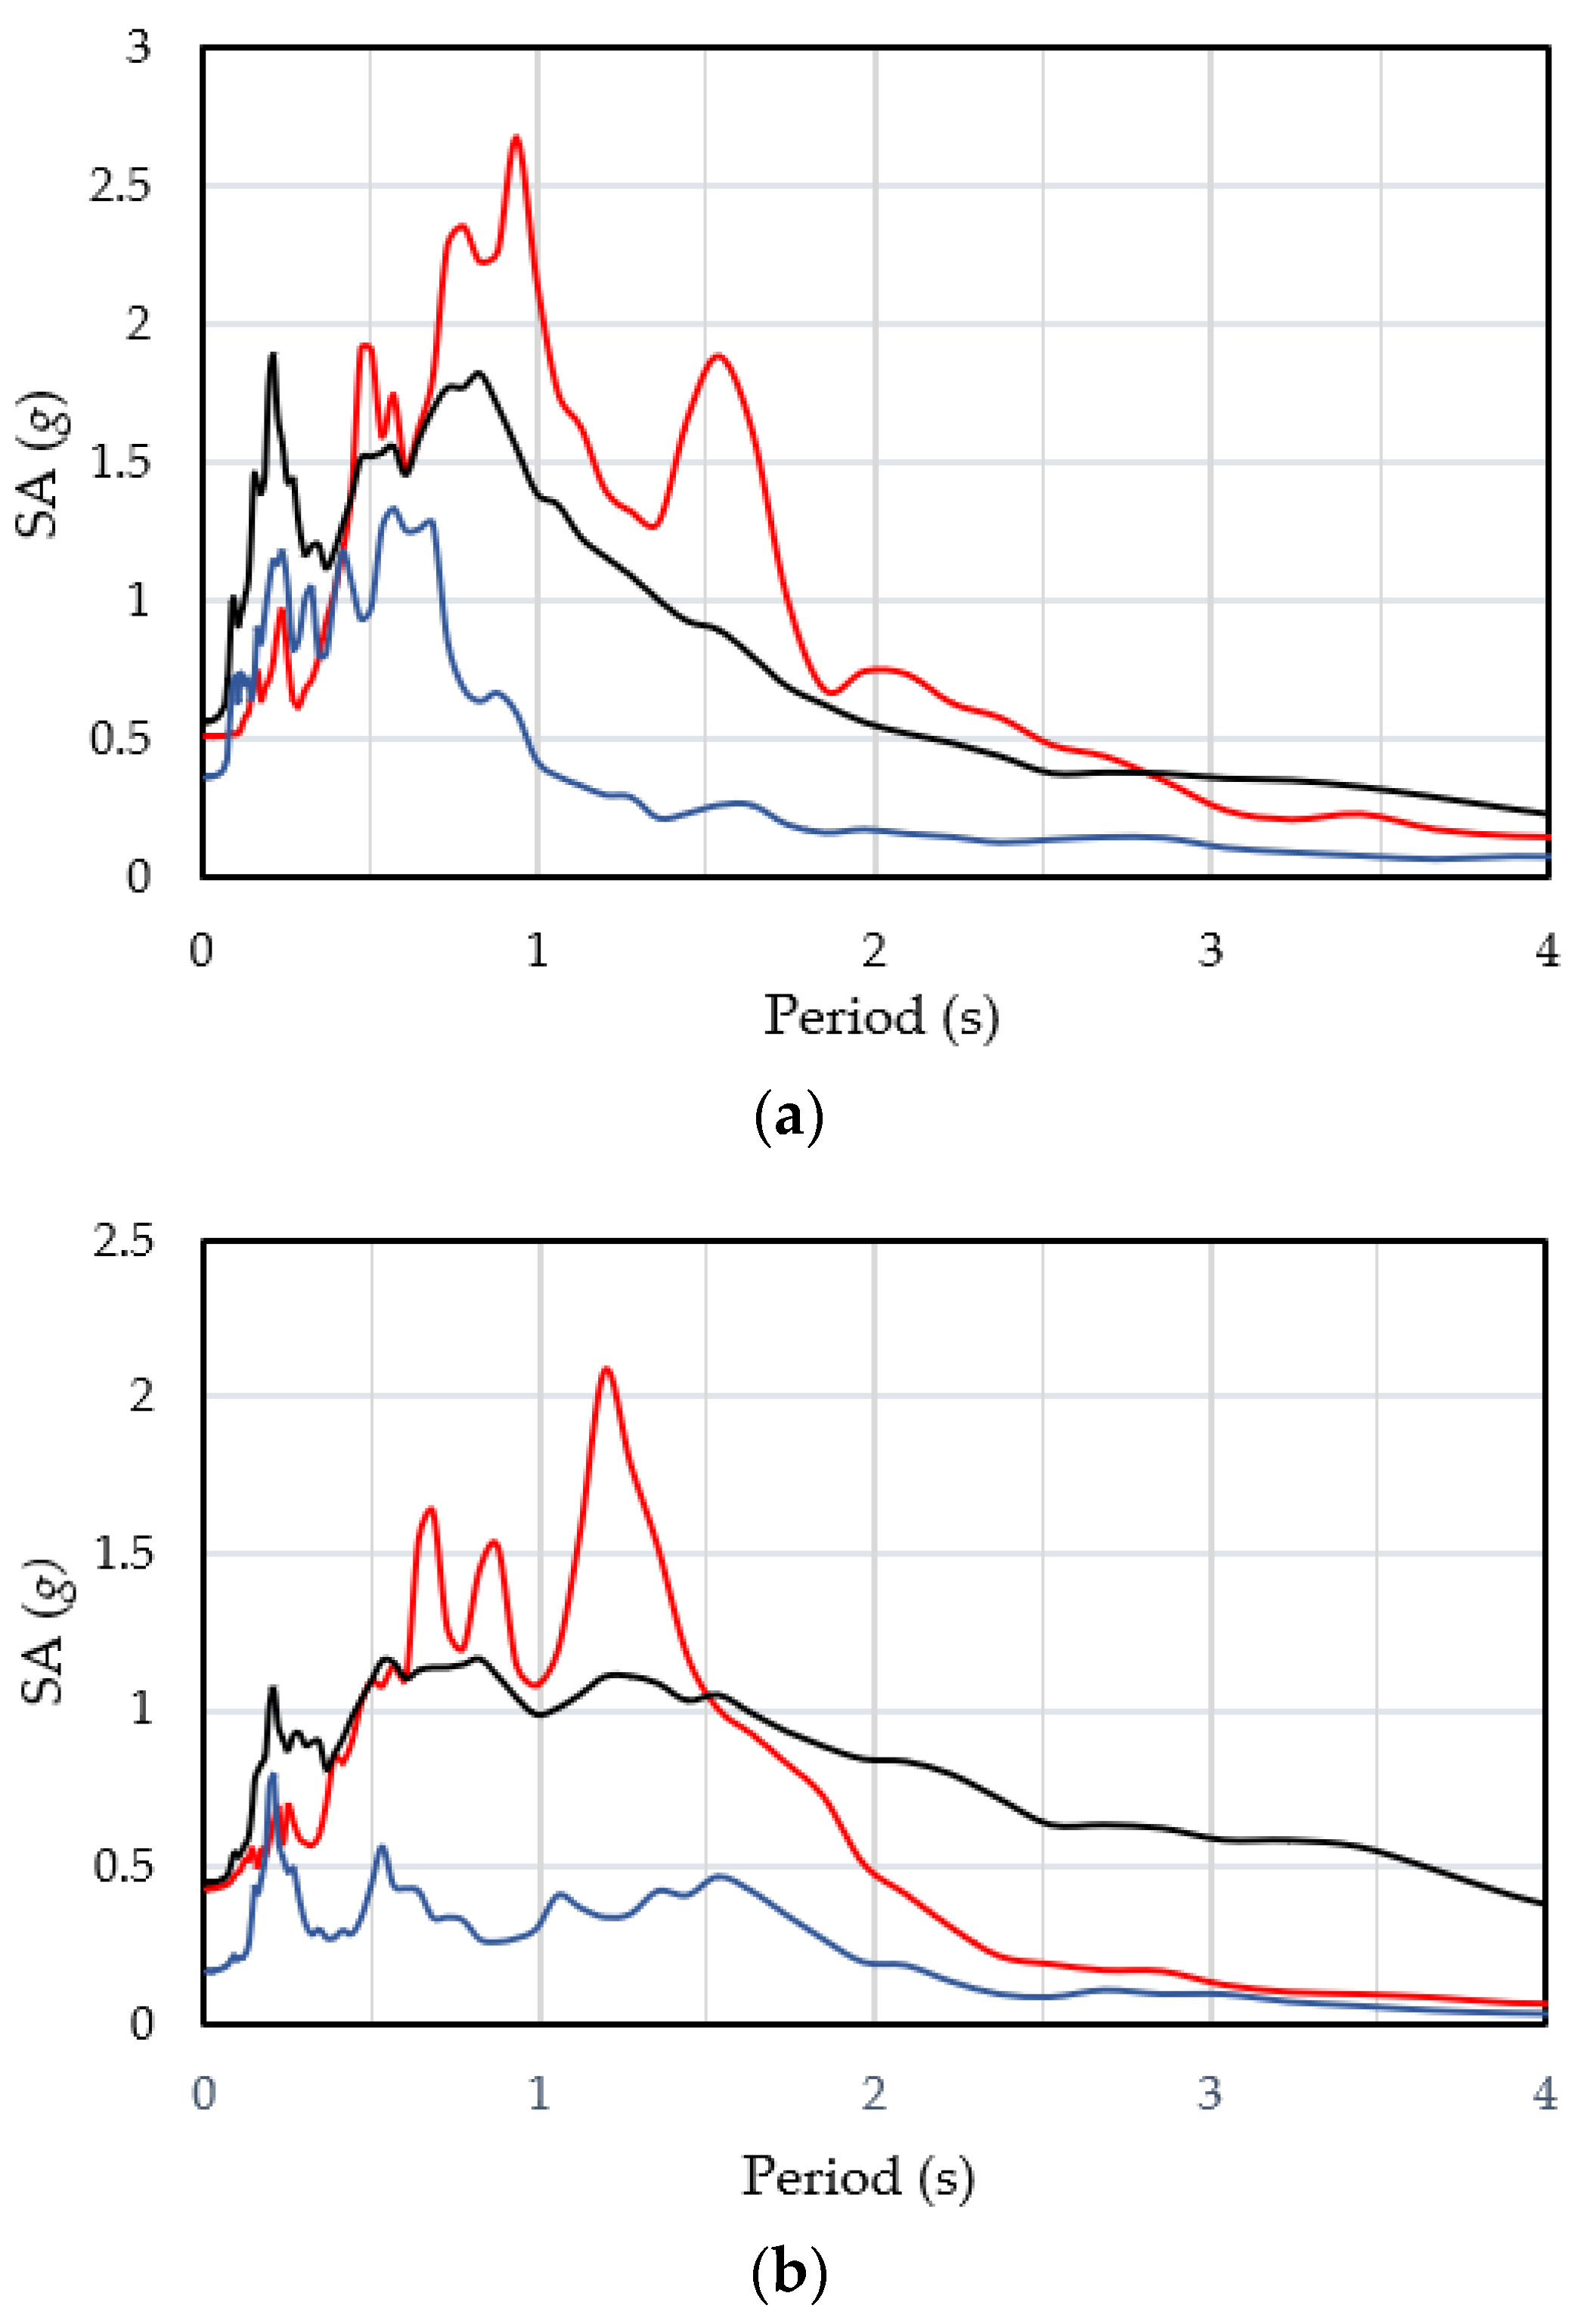
3.2. Proposal of SAs for Seismic Design of Port Facilities

As the SA dispersion was very large, the SAs for seismic design must be set on the conservative side. Nagao [17] pointed out that the SAs for the seismic design of Japanese highway bridges corresponded to the SAs’ average + SD level, except for a short period range. Conservative SAs for seismic design generally lead to a steep rise in the construction cost of a quay. As mentioned above, the SAs for seismic design in the Indonesian code are set to the average level of EGMs with a return period of 2475 years, which is very long compared to the design working life of infrastructure. Considering this as an engineering judgment, we propose that the SAs for the seismic design of port facilities in Indonesia be set by targeting the envelope of the average SAs. The typical shape of the SAs for the seismic design is described as follows: the SA linearly increases in a very short period range, followed by a flat curve, and decreases inversely proportional to the period in a long period range.
Figure 12 illustrates the proposed SAs (red dashed line) with the average SAs (black line), average + SD SAs (brown line), and SAs of the SNI (blue line) for each site class. Table 4 also presents the proposed SAs.

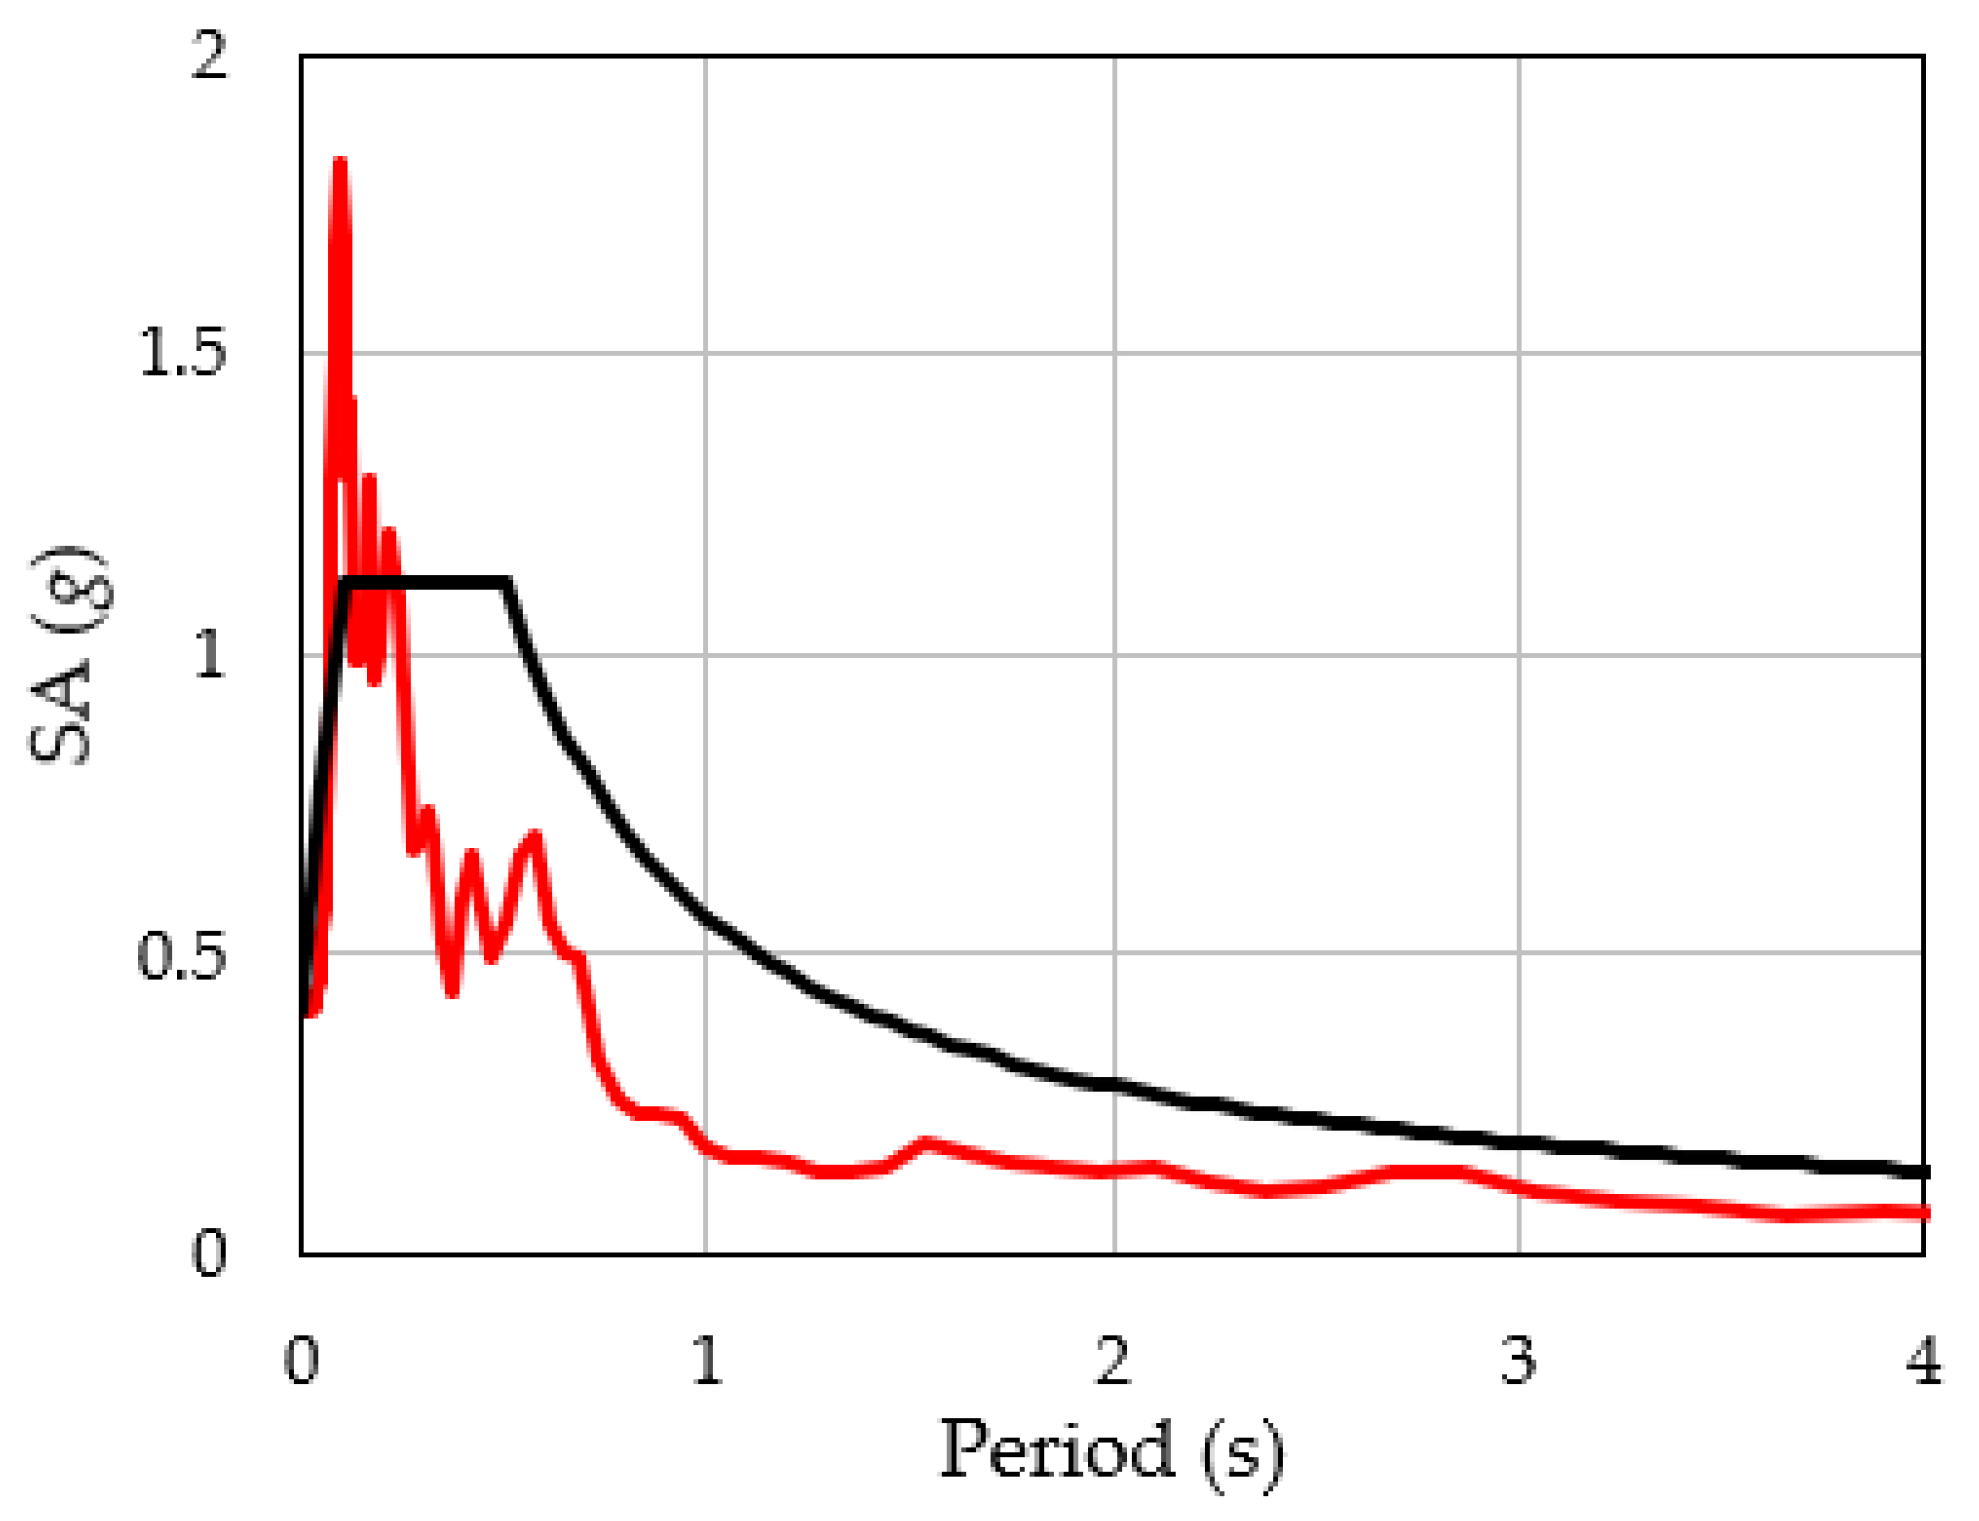
3.3. Comparison of the Proposed SA and That in the SNI

Regarding site class SD, the proposed SA was larger than that of the SNI in the period range of 0.2–2.0 s, which is the natural period range for most port facilities. The proposed SA showed a maximum value of 1.28 g in the period range of 0.2–0.8 s, whereas the maximum SA of the SNI was 0.93 g. The maximum value of the proposed SA was larger than that of the SNI by a factor of 1.38. Figure 5 shows that the SA at the bedrock was smaller than that of the SNI in the period range of 0.3 s or longer. This disagreement in the SAs suggests that the SNI underestimated the amplification factor of the EGMs for site class SD.
For site class SE, the difference between the two SAs was not obvious in the period range of 1.0 s or shorter. However, the proposed SA was larger than that in the SNI in the period range of 1.0 s or longer. At 1.5 s, the proposed SA (=0.65 g) was larger than that in the SNI (=0.54 g) by a factor of 1.20. The natural frequency of the shallow subsurface becomes lower because of the nonlinear soil characteristics during massive earthquakes. The change in the natural period is remarkable for the soft soil condition (i.e., for site class SE). The disagreement in the SAs in the long period range is attributed to the fact that we appropriately considered the nonlinear soil characteristics in the analysis. For both site classes, a reasonable seismic design of the port facilities was made possible by using the proposed SAs.

4. Conclusions

The SNI provides SAs for seismic design, but these have not been obtained with site-specific measurements. The amplification factors of the SAs were referenced from ASCE 7–16 [10], which uses EGM records and ground data obtained from sites other than Indonesia. We proposed site-specific EGMs for the seismic design of port facilities in Indonesia by performing a seismic response analysis of 144 cases using EGM records and ground data obtained in Indonesia. The main conclusions drawn from this study are as follows:
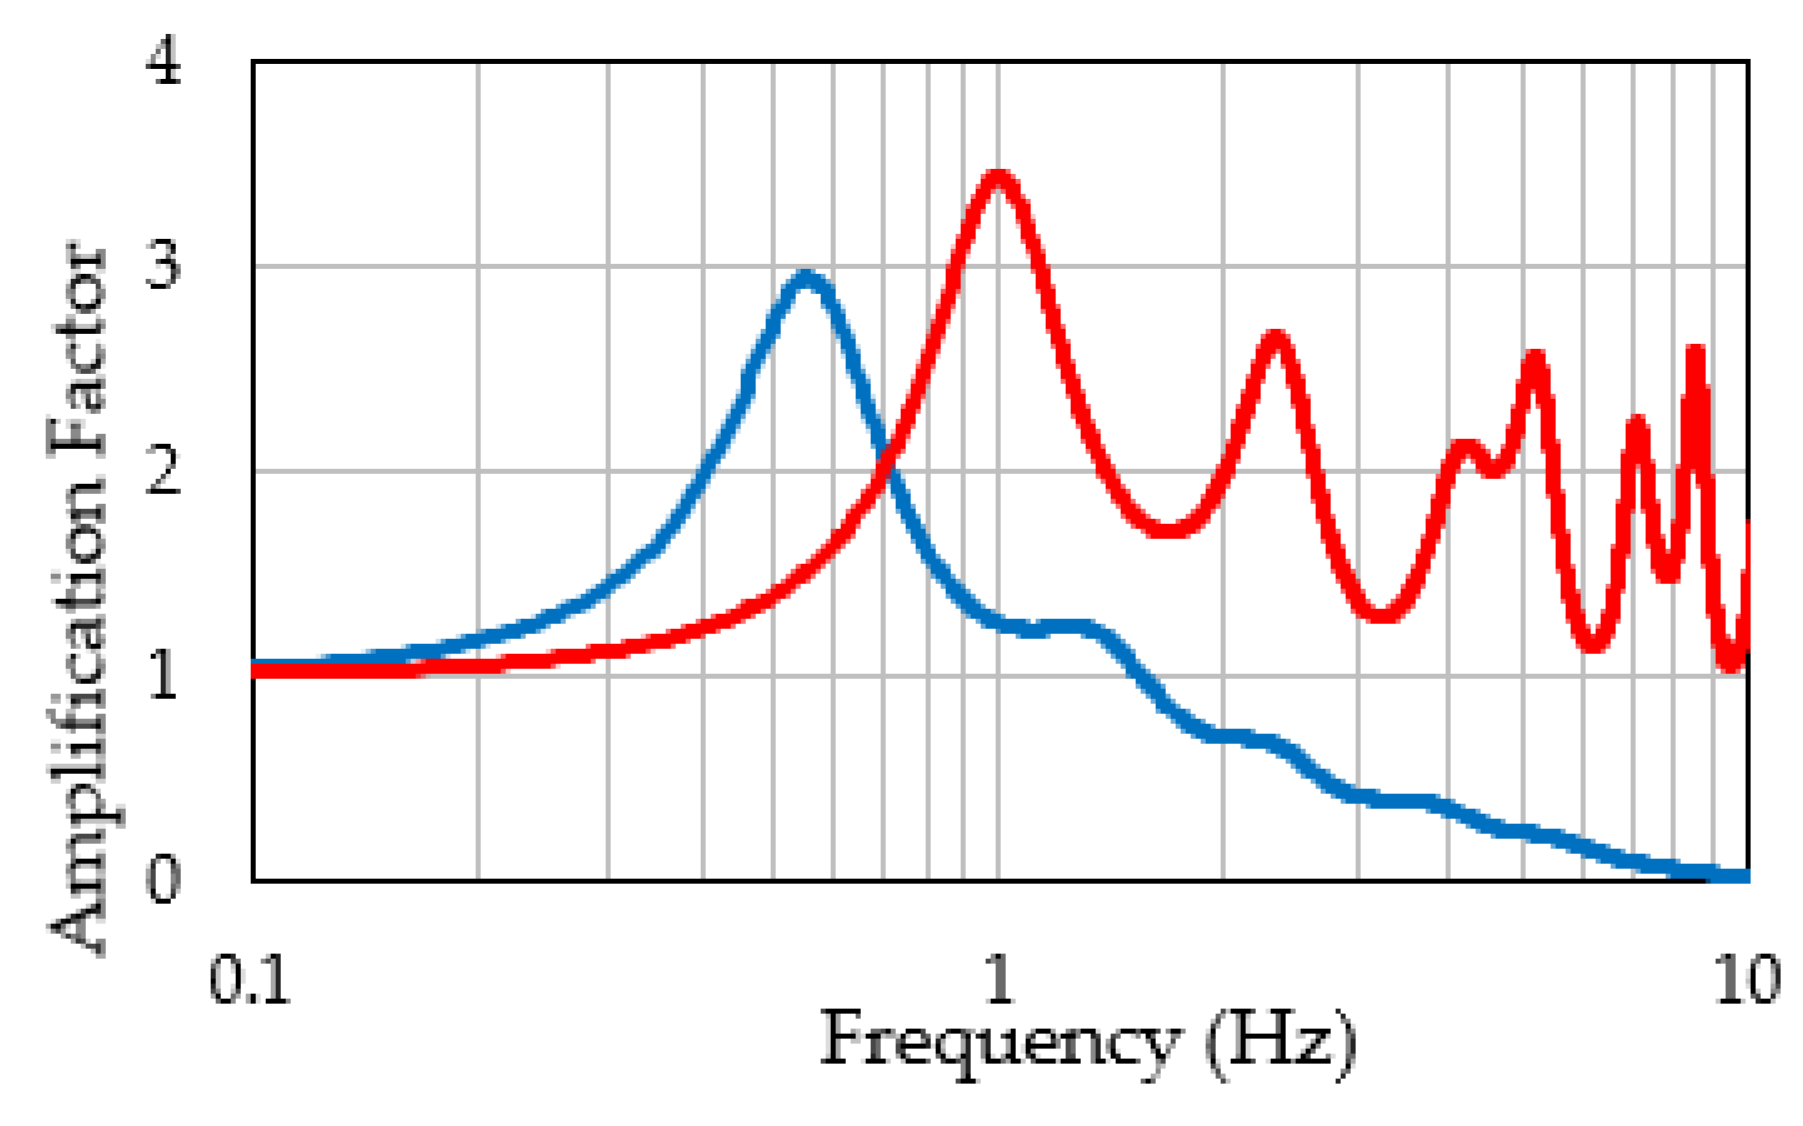
  • The site-specific SAs showed very large variation, especially in the period range of a quay. The SAs became very large when the predominant frequency of the EGM incident in the bedrock agreed with the natural frequency of the ground. The site-specific EGMs must be evaluated using a seismic response analysis that considers the ground conditions at the site of interest. Moreover, the nonlinear soil characteristics must be properly considered.
  • We studied the site-specific EGMs for seismic design for cases where the ground data at the target sites were not obtained in detail. The proposed SA targeted the envelope of the average SAs obtained in the analysis. The comparison of the proposed SAs with those in the SNI revealed that the former is larger than the latter in the period range of 0.2–2.0 s for site class SD and in the period range of 1.0 s or longer for site class SE. The SNI underestimates the amplification factor of the EGMs for site class SD. For site class SE, the SNI falls short of considering the nonlinear characteristics of the soft sediment layers. For both site classes, conducting a reasonable seismic design of port facilities was made possible by using the proposed SAs.

Author Contributions

Conceptualization, C.B., A.N.R. and T.N.; methodology, T.N.; software, C.B. and A.N.R.; validation, C.B., A.N.R. and T.N.; formal analysis, C.B., A.N.R. and T.N.; investigation, C.B. and A.N.R.; resources, C.B. and A.N.R.; data curation, C.B. and A.N.R.; writing—original draft preparation, C.B. and A.N.R.; writing—review and editing, T.N.; visualization, C.B., A.N.R. and T.N.; supervision, T.N.; project administration, C.B. and A.N.R.; funding acquisition, C.B. and A.N.R. All authors have read and agreed to the published version of the manuscript.

Funding

This research was funded by PT. Inti Teknik Solusi Cemerlang (ITSC), Surabaya, Indonesia, grant number: 036/ADM.ITSC/VIII/2019, and the APC was funded by PT. ITSC.

Institutional Review Board Statement

Not applicable.

Informed Consent Statement

Not applicable.

Data Availability Statement

Not applicable.

Acknowledgments

The authors would like to express their gratitude to the PT Inti Teknik Solusi Cemerlang for providing soil investigation reports, Helmi Darjanto from Narotama University and Abdul Hakam from Andalas University for providing EGM records.

Conflicts of Interest

The authors declare no conflict of interest.

References

  1. Natawidjaja, D.H. Neotectonics of the Sumatran Fault and Paleogeodesy of the Sumatran Subduction Zone. Ph.D. Thesis, California Institute of Technology, Pasadena, CA, USA, 27 September 2002. [Google Scholar]
  2. Ghobarah, A.; Saatcioglu, M.; Nistor, I. The impact of the 26 December 2004 earthquake and tsunami on structures and infrastructure. Eng. Struct. 2006, 28, 312–326. [Google Scholar] [CrossRef]
  3. Lorito, S.; Romano, F.; Piatanesi, A.; Boschi, E. Source process of the September 12, 2007, Mw 8.4 Southern Sumatra earthquake from tsunami tide gauge record inversion. Geophys. Res. Lett. 2008, 35, L02310. [Google Scholar] [CrossRef] [Green Version]
  4. Wilkinson, S.M.; Alarcon, J.E.; Mulyani, R.; Whittle, J.; Chian, S.C. Observations of damage to buildings from Mw 7.6 Padang earthquake of 30 September 2009. Nat. Hazards 2012, 63, 521–547. [Google Scholar] [CrossRef]
  5. Newman, A.V.; Hayes, G.; Wei, Y.; Convers, J. The 25 October 2010 Mentawai tsunami earthquake, from real-time discriminants, finite-fault rupture, and tsunami excitation. Geophys. Res. Lett. 2011, 38, L05302. [Google Scholar] [CrossRef] [Green Version]
  6. Chang, S.E. Disasters and transport systems: Loss, recovery and competition at the Port of Kobe after the 1995 earthquake. J. Transp. Geogr. 2000, 8, 53–65. [Google Scholar] [CrossRef]
  7. Erdik, M.; Uckan, E. Earthquake Damage and Fragilities of Industrial Facilities. In Seismic Design of Industrial Facilities; Springer: Wiesbaden, Germany, 2013. [Google Scholar] [CrossRef]
  8. Mavroulis, S.; Triantafyllou, I.; Karavias, A.; Gogou, G.; Katsetsiadou, K.-N.; Lekkas, E.; Papadopoulos, G.A.; Parcharidis, I. Primary and secondary environmental effects triggered by the 30 October 2020, Mw = 7.0, Samos (Eastern Aegean Sea, Greece) earthquake based on post-event field surveys and InSAR analysis. Appl. Sci. 2021, 11, 3281. [Google Scholar] [CrossRef]
  9. National Standardization Agency. SNI 1726:2019; Tata Cara Perencanaan Ketahanan Gempa Untuk Struktur Bangunan Gedung dan Non Gedung. National Standardization Agency: Jakarta, Indonesia, 2019.
  10. American Society of Civil Engineers. Minimum Design Loads and Associated Criteria for Buildings and Other Structures; ASCE/SEI 7-16; American Society of Civil Engineers: Reston, VA, USA, 2017. [Google Scholar] [CrossRef]
  11. Irsyam, M.; Cummins, P.R.; Asrurifak, M.; Faizal, L.; Natawidjaja, D.H.; Widiyantoro, S.; Meilano, I.; Triyoso, W.; Rudiyanto, A.; Hidayati, S.; et al. Development of the 2017 national seismic hazard maps of Indonesia. Earthq. Spectra 2020, 36, 112–136. [Google Scholar] [CrossRef]
  12. Stewart, J.P.; Seyhan, E. Semi-Empirical Nonlinear Site Amplification and Its Application in NEHRP Site Factors; PEER Report 2013/13; Pacific Earthquake Engineering Research Center: Berkeley, CA, USA, 2013. [Google Scholar]
  13. Nagao, T.; Fukushima, Y. Source- and site-specific earthquake ground motions. Eng. Technol. Appl. Sci. Res. 2020, 10, 5882–5888. [Google Scholar] [CrossRef]
  14. Işık, E.; Büyüksaraç, A.; Ekinci, Y.L.; Aydın, M.C.; Harirchian, E. The effect of site-specific design spectrum on earthquake-building parameters: A case study from the Marmara region (NW Turkey). Appl. Sci. 2020, 10, 7247. [Google Scholar] [CrossRef]
  15. Kim, D.K.; Park, H.G.; Sun, C.G. Design earthquake response spectrum affected by shallow soil deposit. Adv. Civ. Eng. 2019, 2019, 1–18. [Google Scholar] [CrossRef] [Green Version]
  16. Nguyen, V.; Aaqib, M.; Nguyen, D.; Luat, N.; Park, D. A site-specific response analysis: A case study in Hanoi, Vietnam. Appl. Sci. 2020, 10, 3972. [Google Scholar] [CrossRef]
  17. Nagao, T. Maximum credible earthquake ground motions with focus on site amplification due to deep subsurface. Eng. Technol. Appl. Sci. Res. 2021, 11, 6873–6881. [Google Scholar] [CrossRef]
  18. Nagao, T. Seismic amplification by deep subsurface and proposal of a new proxy. Eng. Technol. Appl. Sci. Res. 2020, 10, 5157–5163. [Google Scholar] [CrossRef]
  19. Smerzini, C.; Pitilakis, K.; Hashemi, K. Evaluation of earthquake ground motion and site effects in the Thessaloniki urban area by 3D finite-fault numerical simulations. Bull. Earthq. Eng. 2017, 15, 787–812. [Google Scholar] [CrossRef]
  20. Chieffo, N.; Fasan, M.; Romanelli, F.; Formisano, A.; Mochi, G. Physics-based ground motion simulations for the prediction of the seismic vulnerability of masonry building compounds in Mirandola (Italy). Buildings 2021, 11, 667. [Google Scholar] [CrossRef]
  21. Hassan, H.M.; Fasan, M.; Sayed, M.A.; Romanelli, F.; El-Gabry, M.N.; Vaccari, F.; Hamed, A. Site-specific ground motion modeling for a historical Cairo site as a step towards computation of seismic input at cultural heritage sites. Eng. Geol. 2020, 268, 105524. [Google Scholar] [CrossRef]
  22. Paolucci, R.; Gatti, F.; Infantino, M.; Smerzini, C.; Güney Özcebe, A.; Stupazzini, M. Broadband ground motions from 3D physics-based numerical simulations using artificial neural networks. Bull. Seismol. Soc. Am. 2018, 108, 1272–1286. [Google Scholar] [CrossRef]
  23. Yaghmaei-Sabegh, S.; Rupakhety, R. A new method of seismic site classification using HVSR curves: A case study of the 12 November 2017 Mw 7.3 Ezgeleh earthquake in Iran. Eng. Geol. 2020, 270, 105574. [Google Scholar] [CrossRef]
  24. Zhu, C.; Pilz, M.; Cotton, F. Evaluation of a novel application of earthquake HVSR in site-specific amplification estimation. Soil Dyn. Earthq. Eng. 2020, 139, 106301. [Google Scholar] [CrossRef]
  25. Yaghmaei-Sabegh, S.; Tsang, H.H. Site class mapping based on earthquake ground motion data recorded by regional seismographic network. Nat. Hazards 2014, 73, 2067–2087. [Google Scholar] [CrossRef]
  26. Seed, H.B.; Idriss, I.M. Soil Moduli and Damping Factors for Dynamic Response Analyses; Report No. EERC 70-10; Earthquake Engineering Research Center: Oakland, CA, USA, 1970. [Google Scholar]
  27. Vucetic, M.; Dobry, R. Effect of soil plasticity on cyclic response. J. Geotech. Eng. 1991, 117, 89–107. [Google Scholar] [CrossRef]
  28. Hashash, Y.M.A.; Musgrove, M.I.; Harmon, J.A.; Okan, I.; Xing, G.; Numanoglu, O.; Groholski, D.R.; Phillips, C.A.; Park, D. DEEPSOIL 7.0, User Manual; Board of Trustees of University of Illinois at Urbana-Champaign: Urbana, IL, USA, 2020. [Google Scholar]
  29. Imai, T.; Tonouchi, K. Correlation of N-value with S-wave Velocity and Shear Modulus. In Proceedings of the Second European Symposium on Penetration Testing, Amsterdam, The Netherlands, 27 May 1982. [Google Scholar]
Figure 1. Map.
Figure 1. Map.
Applsci 12 01963 g001
Figure 2. Fourier spectra.
Applsci 12 01963 g002
Figure 3. Nonlinear characteristics of the shear modulus and the damping coefficient.
Applsci 12 01963 g003
Figure 4. Time history waveforms and Fourier spectra.
Applsci 12 01963 g004
Figure 5. Comparison of SAs.
Applsci 12 01963 g005
Figure 6. Ground data at each location: (a) PTB; (b) TPJ; (c) PKT; (d) PIM.
Applsci 12 01963 g006
Figure 7. Transfer function: site classes (a) SD and (b) SE.
Applsci 12 01963 g007
Figure 8. SAs in site classes (a) SD and (b) SE. The blue line represents the individual SAs. The black line denotes the average SAs. The red line expresses the average + standard deviation (SD) SAs.
Applsci 12 01963 g008
Figure 9. Comparison of the SAs in site classes (a) SD and (b) SE.
Applsci 12 01963 g009
Figure 10. Comparison of the spectra in (a) site class SD, large SA; (b) site class SD, small SA; (c) site class SE, large SA; and (d) site class SE, small SA.
Applsci 12 01963 g010
Figure 11. Comparison of the transfer functions.
Applsci 12 01963 g011
Figure 12. Proposed SAs in site classes (a) SD and (b) SE.
Applsci 12 01963 g012
Table 1. Site class in the SNI.
Site ClassVs30 (m/s) N ¯ S u ¯   ( kPa )
SA (hard rock)>1500Not applicable
SB (rock)750–1500Not applicable
SC (very dense soil and soft rock)350–750>50≥100
SD (stiff medium soil)175–35015–5050–100
SE (soft clay soil)<175<15<50
Any site with more than 3 m of soil that has the following characteristics:
-
Plasticity index PI > 20; moisture content w ≥ 40%
-
Undrained shear strength S u ¯   < 25 kPa
SF (special soil requiring site response analysis and special geotechnical site investigation)
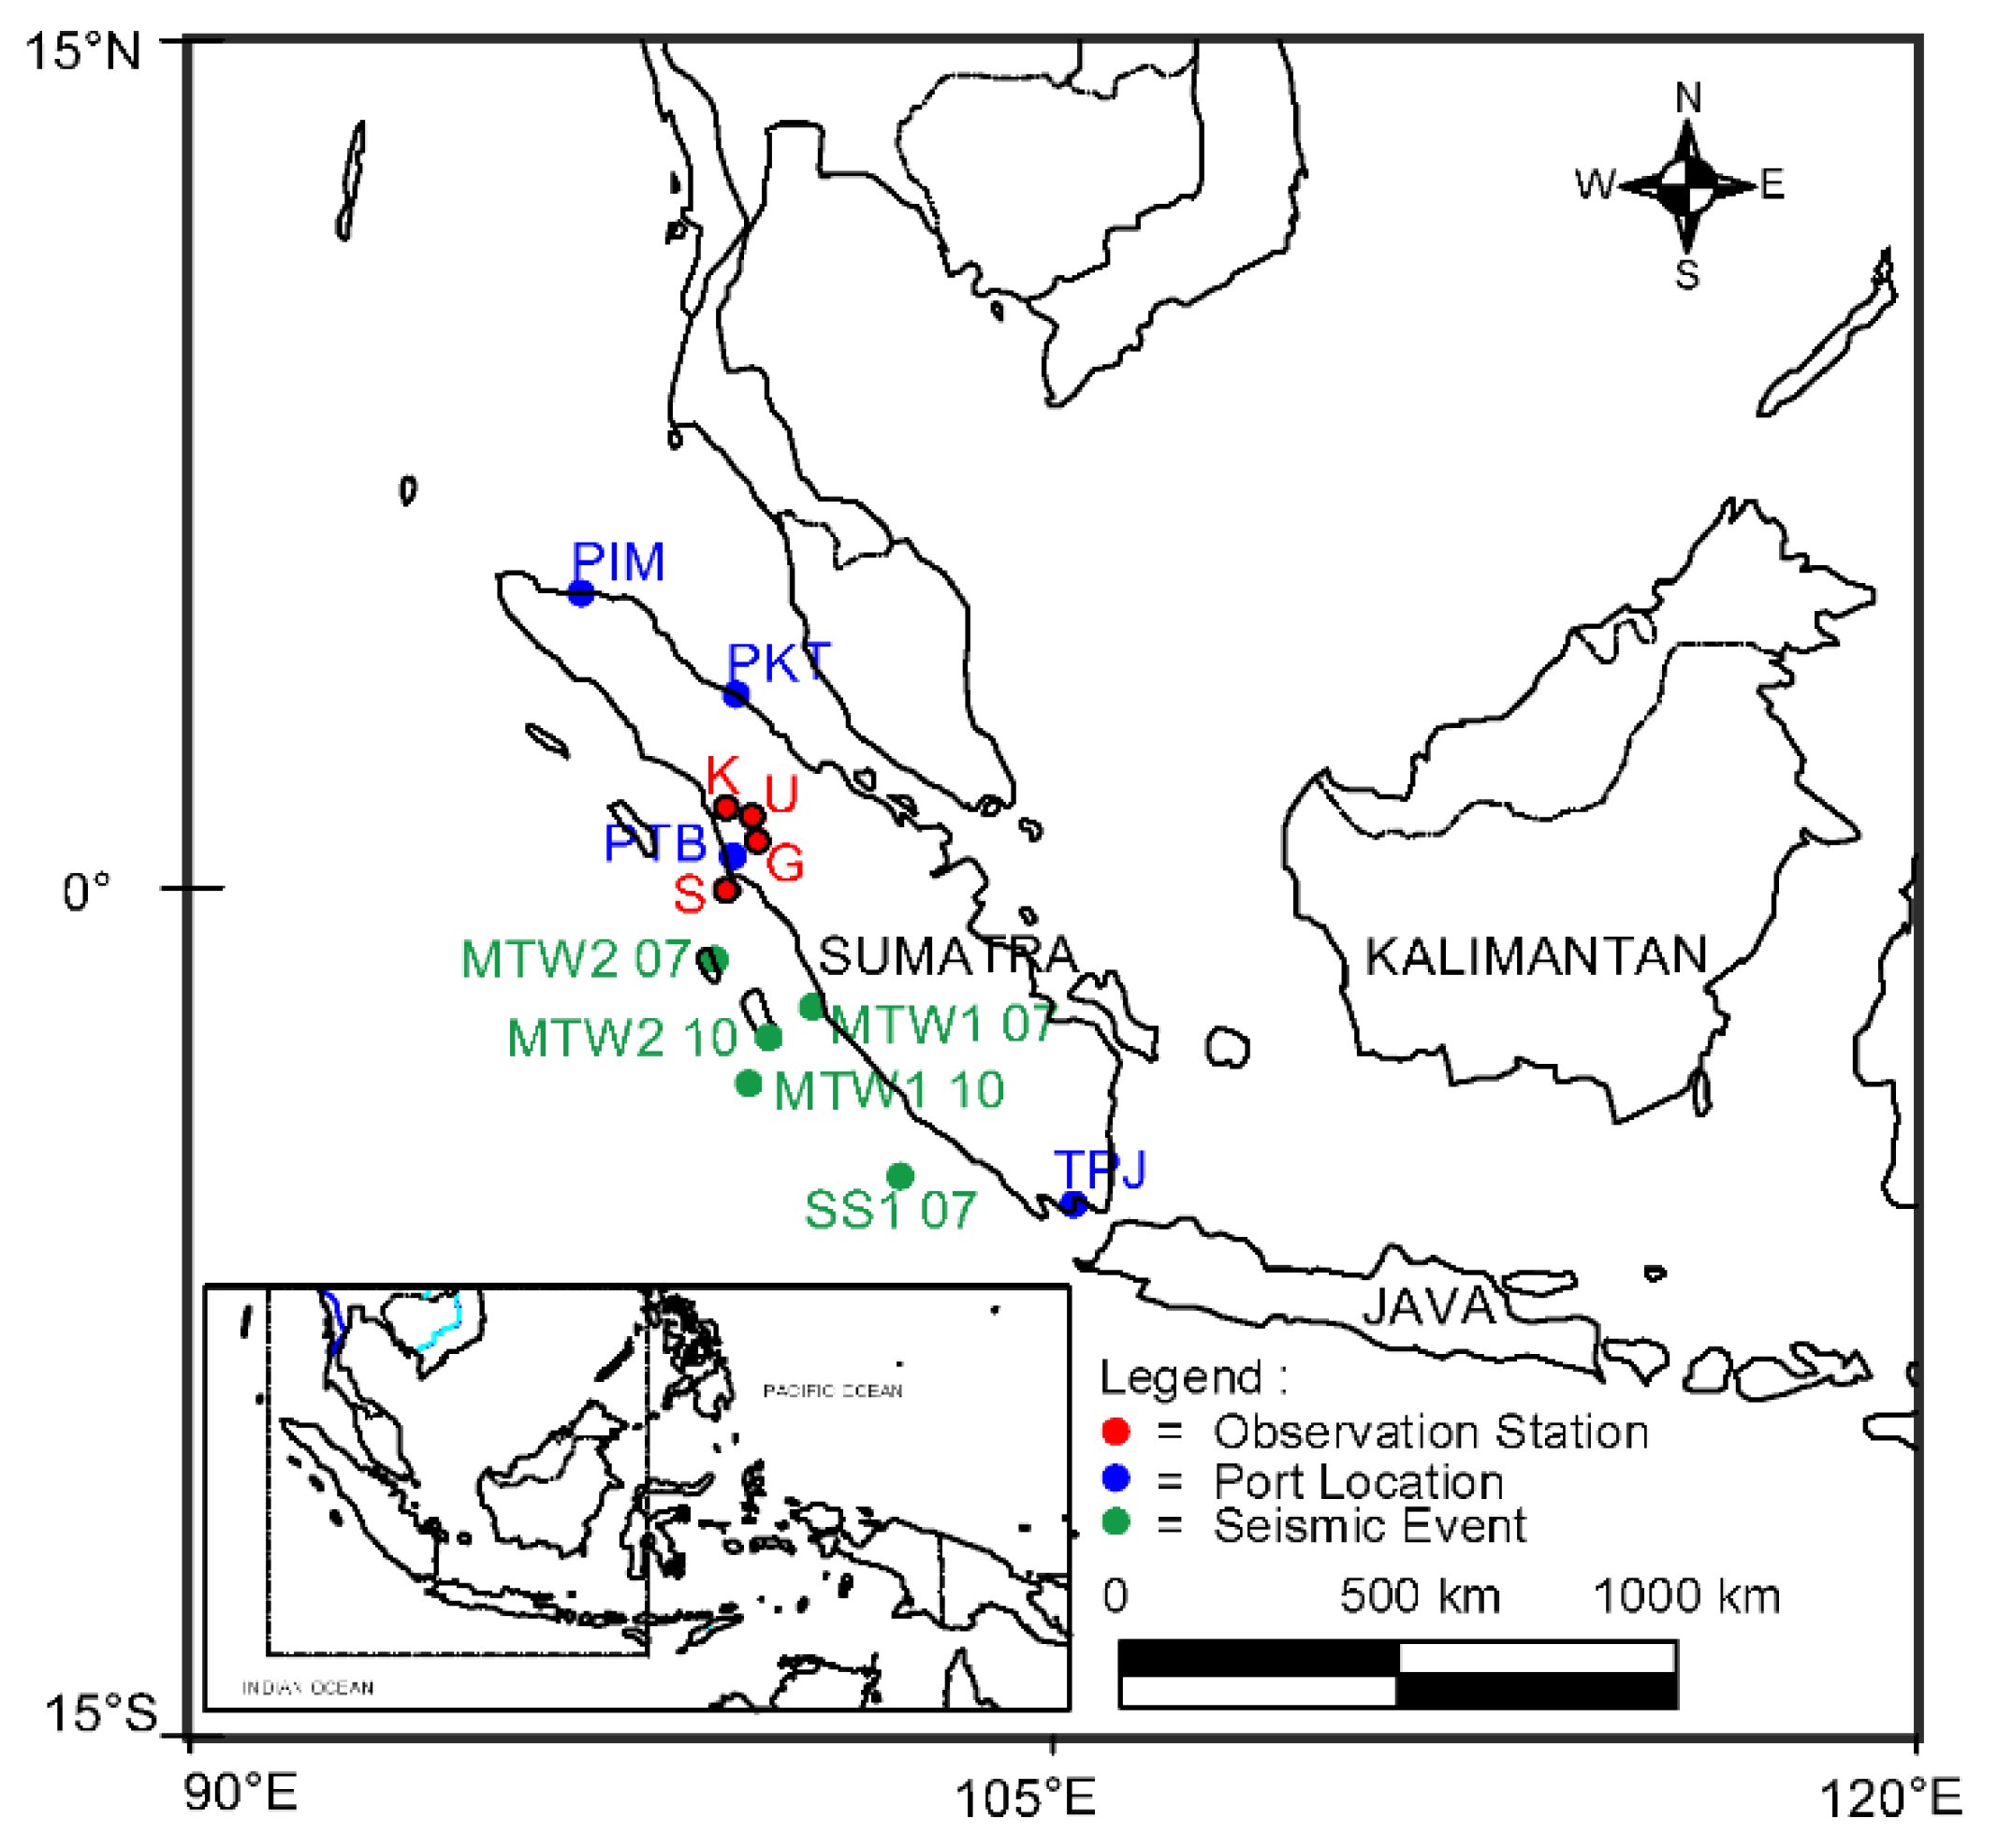
-
For soils with a high risk of failure or collapse under seismic loadings (e.g., liquefiable soils and quick and highly sensitive clays)
-
Peats and highly organic clays with soil thickness (H > 3 m)
-
Very-high-plasticity clays (H > 7.5 m) with PI > 75
-
Very thick, soft/medium-stiff clays (H > 35 m) with ( S u ¯   < 50 kPa)
Table 2. EGM records.
No.Earthquake EventsObservation StationGround Motion CodePGA (g)Site Class
1Mentawai 1, 2010
(Mw 7.8—focal depth: 20.1 km)
Gadut; Kuranji; UnandMTW1 10 G
MTW1 10 K
MTW1 10 U
0.037
0.026
0.037
SC
SD
SD
2Mentawai 2, 2010
(Mw 6.3—focal depth: 26 km)
Gadut; Kuranji; UnandMTW2 10 G
MTW2 10 K
MTW2 10 U
0.039
0.025
0.043
SC
SD
SD
3Southern Sumatra, 2007
(Mw 8.4—focal depth: 34 km)
Sikuai IslandSS1 07 S0.037SD
4Mentawai 1, 2007
(Mw 7.9—focal depth: 30 km)
Sikuai IslandMTW1 07 S0.110SD
5Mentawai 2, 2007
(Mw 7.0—focal depth: 22 km)
Sikuai IslandMTW2 07 S0.014SD
Table 3. Shallow subsurface data.
LayerThickness (m)Soil TypeVs (m/s)Unit Weight (kN/m3)
14Silt sediment8017
218Silty clay14116
38Clayey silt16116
48Sandy silt18620
58Clayey silt19523
66Hard clayey silt36125
Table 4. Proposed SAs.
Site ClassPeriod T (s)SA (g)
SD00.50
0.21.28
0.81.28
>0.80.7/(T − 0.25)
SE00.33
0.30.79
1.20.79
>1.21.1/(T + 0.2)
Publisher’s Note: MDPI stays neutral with regard to jurisdictional claims in published maps and institutional affiliations.

