1. Introduction
In the energy transition time, there is an effort towards a society less dependent on oil and gas. The energy transition requires critical metals to sustain a low-CO
2 economic and social development. Electric mobility, for example, requires cobalt, copper, nickel, and silver, key ingredients in batteries that power e-vehicles [
1].
In fact, many strategic metals are now termed critical raw material (CRM), listed in a catalog regularly updated by the European Commission [
2]. The CRM supply can derive from primary and secondary sources such as extraction mining wastes (stockpiles and tailings) stored at mine sites. Hence, the recovery of CRM from mining wastes has gained attention because (1) mining and quarrying waste represents about a quarter of the total waste production in Europe [
3]; (2) hundreds to thousands of abandoned mine sites occur in many countries, creating a European-scale concern [
4]; (3) mining and quarrying waste is an economic cost; and (4) they contain hazardous substances prone to polluting the environment. The recovery of secondary raw materials has the additional benefit of adding value to mining residues and reducing their environmental risks [
5]. The old mining wastes could represent a significant raw material source considering the deficiency of the old extraction and processing methods. Therefore, prospecting new raw material resources nearby abandoned mines can be prompted for reuse or removal of remained CRM.
The main bottleneck towards the recovery of secondary raw materials is the lack of knowledge on the available resources [
5]. There are few case studies with the available database for prefeasibility studies of resources. The preliminary information needed is chemical and mineralogical composition, as well as volume of mining wastes deposits [
6]. The national registries mainly provide basic information about mining sites location and the main materials extracted [
4]. However, for the preliminary characterization of mining waste, there is the need of on-site geological and geophysical surveys, sampling, material preparation for laboratory analyses, and the acquisition of quality compositional and mineralogical data. Obtaining this information is time-consuming and expensive, especially for large storage facilities.
Up until now, the main attention on mining wastes deals with environmental issues [
7,
8], acid mine drainage [
9], and stability monitoring [
10]. Recently, the recovery of metals and precious elements have become a new aspect to study the mining wastes [
11,
12,
13]. In all mentioned studies, the main challenges are sampling and data collection from mining wastes. A possibility of overcoming these issues could be through the use of earth observation (EO) data, as already performed in some cases [
14,
15]. Hence, remote sensing (RS) methods have a high potential to explore mineral deposits and mining residues, with continuity of data in space and time. The European Union’s Copernicus [
16] EO program is an efficient free data source for mineral mapping, environmental monitoring, urban area management, regional and local planning, etc. RS approaches benefit from the high amount of data and high-tech facilities with minimum ground disturbances. In mining applications, RS techniques can be used for volume evaluations and to detect and classify different mineral formations and alterations on the surface [
17]. On the basis of the objective, different RS methods can be used to detect and map ground features, such as band ratio analysis, principal component analysis, spectral angle mapper, spectral unmixing, etc. Sentinel-2 images are part of the Copernicus program and are widely used in mining applications and mining waste studies [
18]. Sentinel-2 images are chosen since they are freely accessible, with spatial resolution (10 m) and 5-day global revisit periodicity appropriate for mining wastes.
In this research, the exploitation of EO data was highlighted to map elements of potential interest in the Vigonzano mining wastes. The aim was to investigate how the new prospects in environmental geochemistry are enhanced when limited on-site chemical analyses are coupled with multispectral imagery analysis. This objective can be achieved jointly with the regional investigation about the enrichment or depletion of critical elements within the case study. The Vigonzano mining wastes derive from chalcopyrite extraction during the 20th century and have been abandoned since the 1970s. No prefeasibility study is available for this area.
To map the critical elements, we based the standard approach for estimation on geostatistical modelling (an unbiased estimation with minimum error variance), specifically when the variable of interest has a spatial distribution [
19]. However, according to the scarcity of in situ samples, as well as the objective of the study, we chose the geostatistical Co-Kriging method. The Co-Kriging approach is well known in the case of multivariate variable mapping, with the advantage of reducing the estimation variance [
20,
21]. Compared to simple regression methods, the Co-Kriging method can provide uncertainty maps [
22], useful in this phase of the investigations.
2. Background
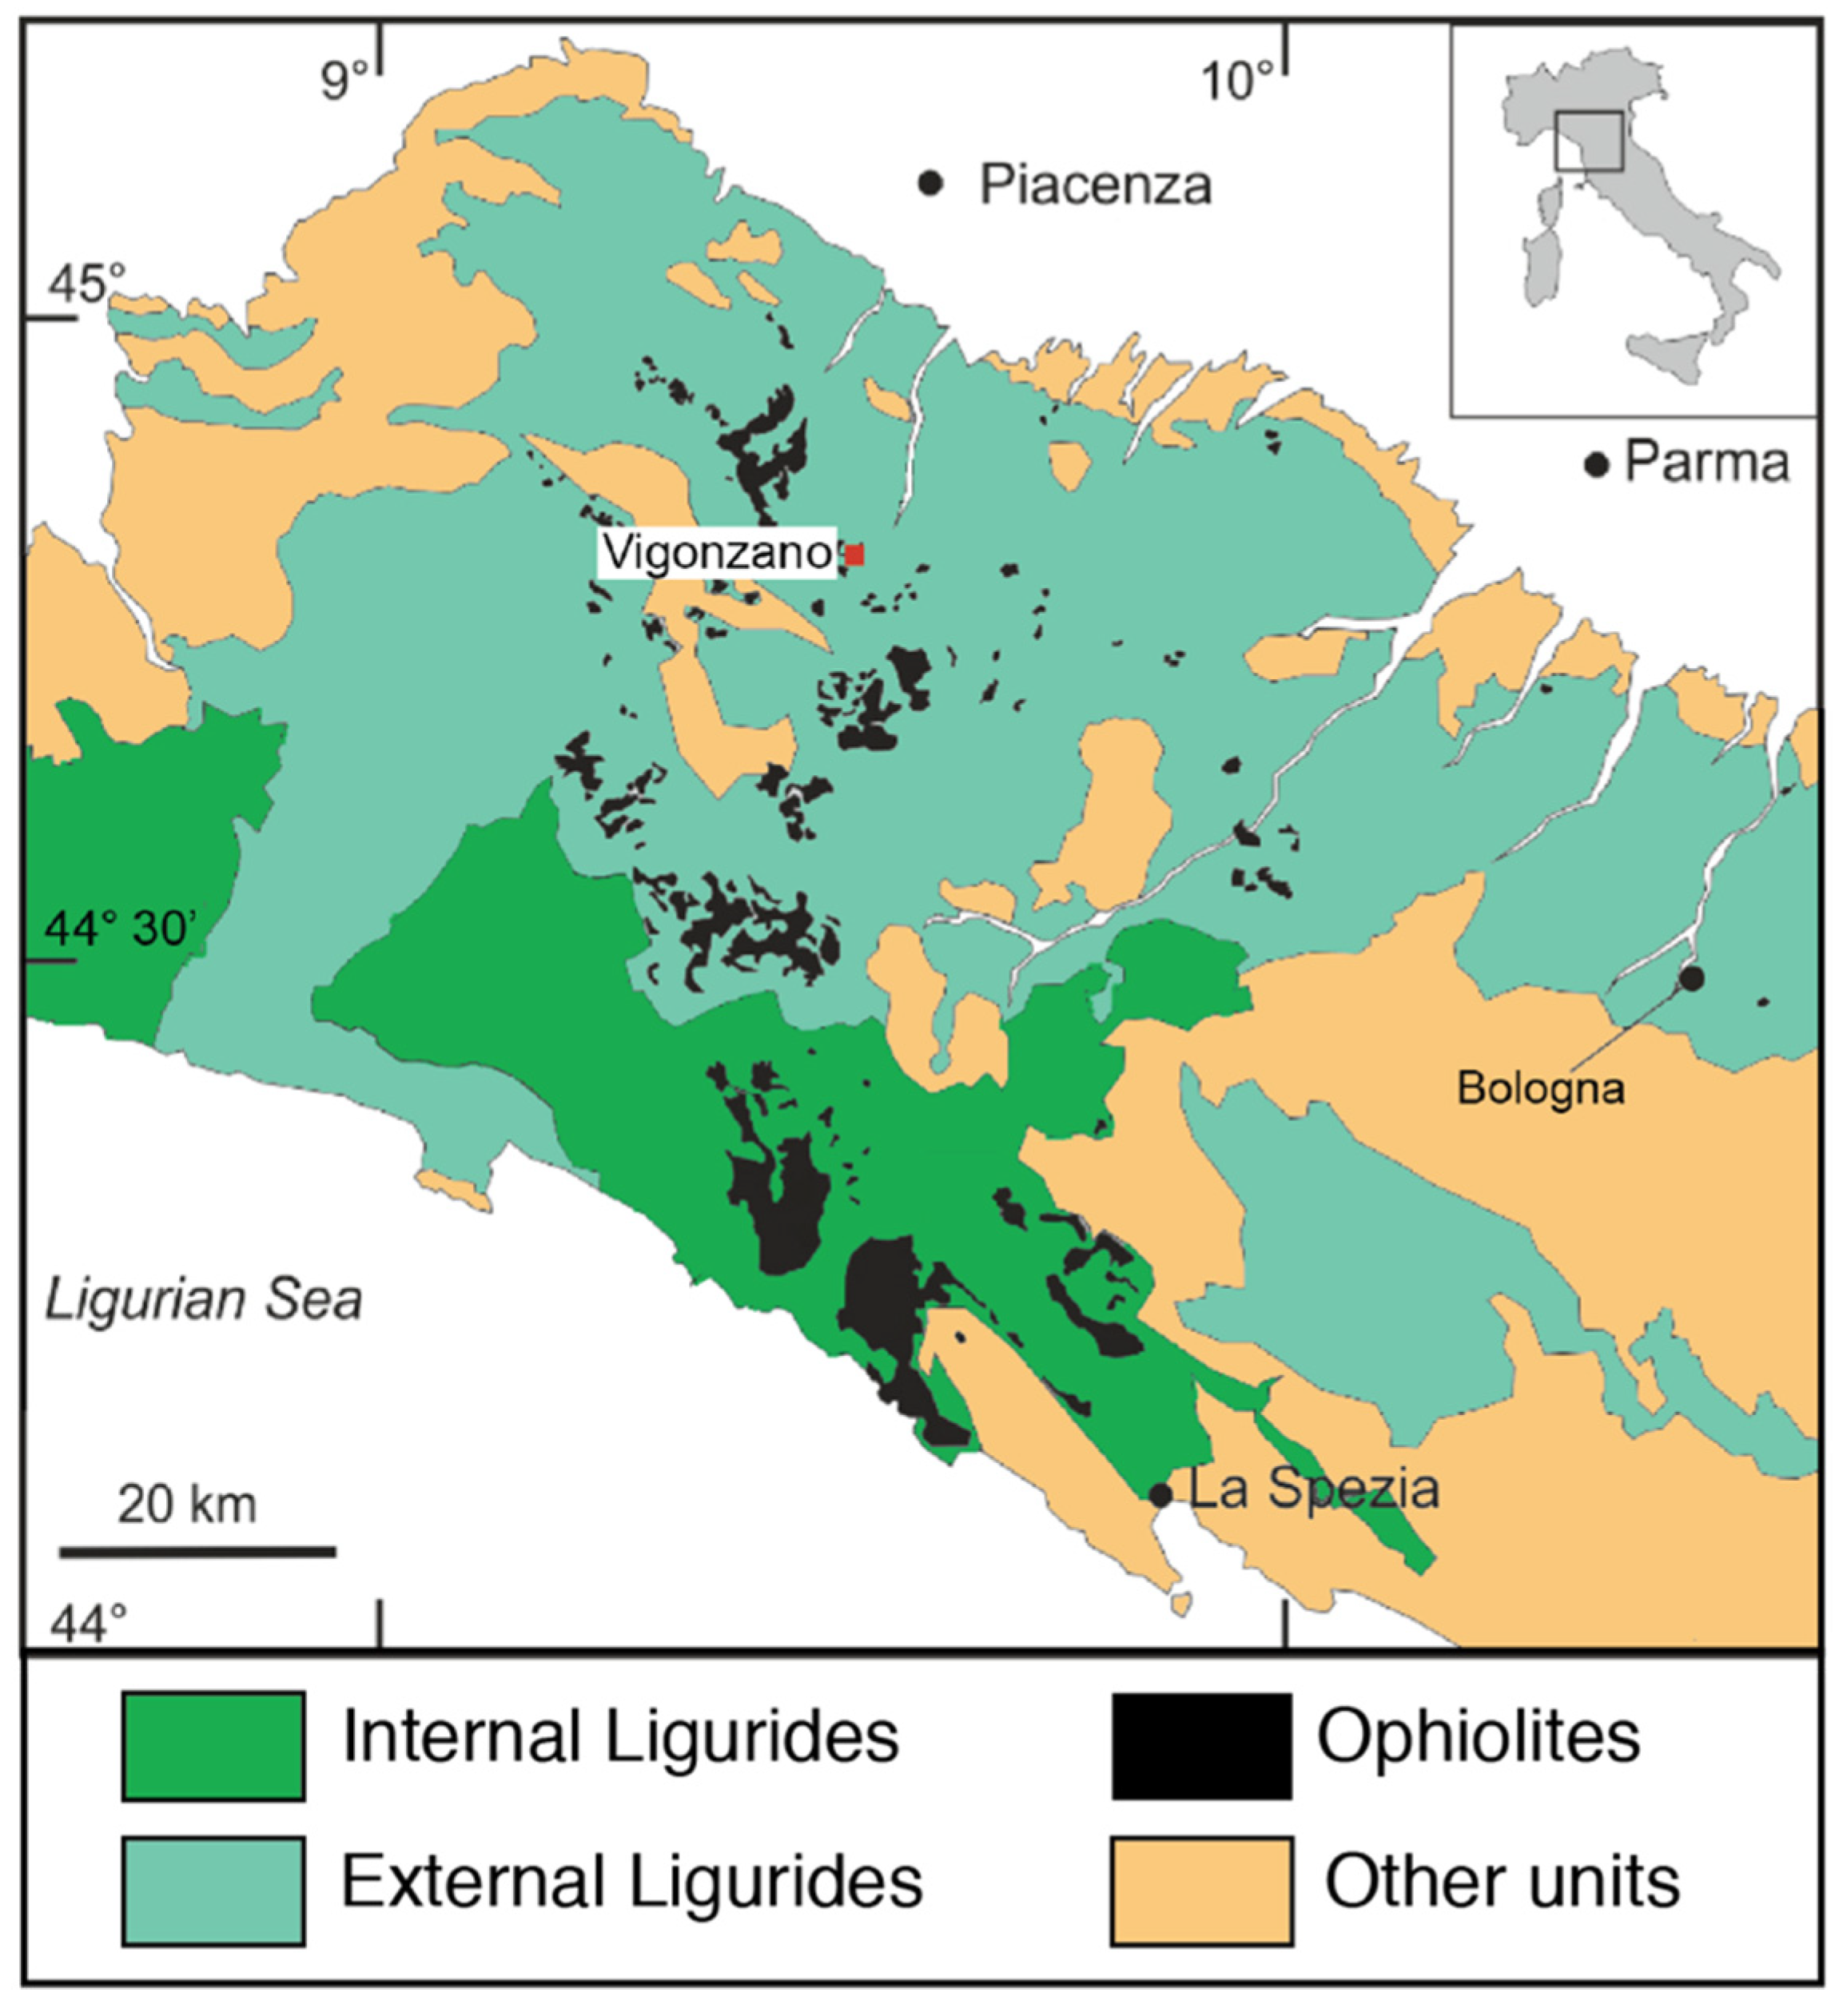
The Northern Apennines (Italy) consists of stacked tectonic units derived from an accretionary wedge formed during the Cenozoic closure of the Ligurian Tethys ocean [
23]. The uppermost, ophiolite-bearing tectonic unit is known as the Ligurian Domain and it is traditionally divided into Internal and External Ligurian Domains (
Figure 1). The former represents the oceanic lithosphere close to the rifting zone, and the latter is interpreted as a transitional zone towards the Adria continental margin. The ocean floor metamorphic overprint does not exceed sub-greenschist facies conditions. The Vigonzano mine belongs to the External Ligurian Domain, characterized by an ophiolite-bearing sedimentary mélange overlain by a thick Upper Cretaceous sedimentary succession.
The Cu mineralization of the Northern Apennines are classified as Cyprus-type volcanogenic massive sulfide deposits [
24] and they occur as (i) massive sulfide lenses in serpentinite breccia and (ii) stockwork-style mineralization hosted by serpentinite, gabbro, and pillow basalt. The exploitation of copper sulfide from the Northern Apennines ophiolites has been known since the Bronze Age [
25], even though the mining activity peaked between 1850 and 1970 [
26].
Figure 1.
Geological sketch of the Northern Apennine between Genova and Bologna, and location of the study area. Modified from [
26].
Figure 1.
Geological sketch of the Northern Apennine between Genova and Bologna, and location of the study area. Modified from [
26].
The Vigonzano mine ore geology consists of a stockwork mineralization hosted in a 100 m serpentinite block. The sulfide assemblage is mostly made of chalcopyrite and minor pyrite and pyrrhotite, whereas quartz and calcite are the main gangue minerals [
9]. According to petrography, fluid inclusion microthermometry, and trace element composition of quartz veins in the stockwork zone [
27], the estimated minimum temperature of formation of the mineralized quartz veins is 260–330 °C. The high temperatures are related to seafloor and sub-seafloor hydrothermal activity close to the hydrothermal centers [
26,
28].
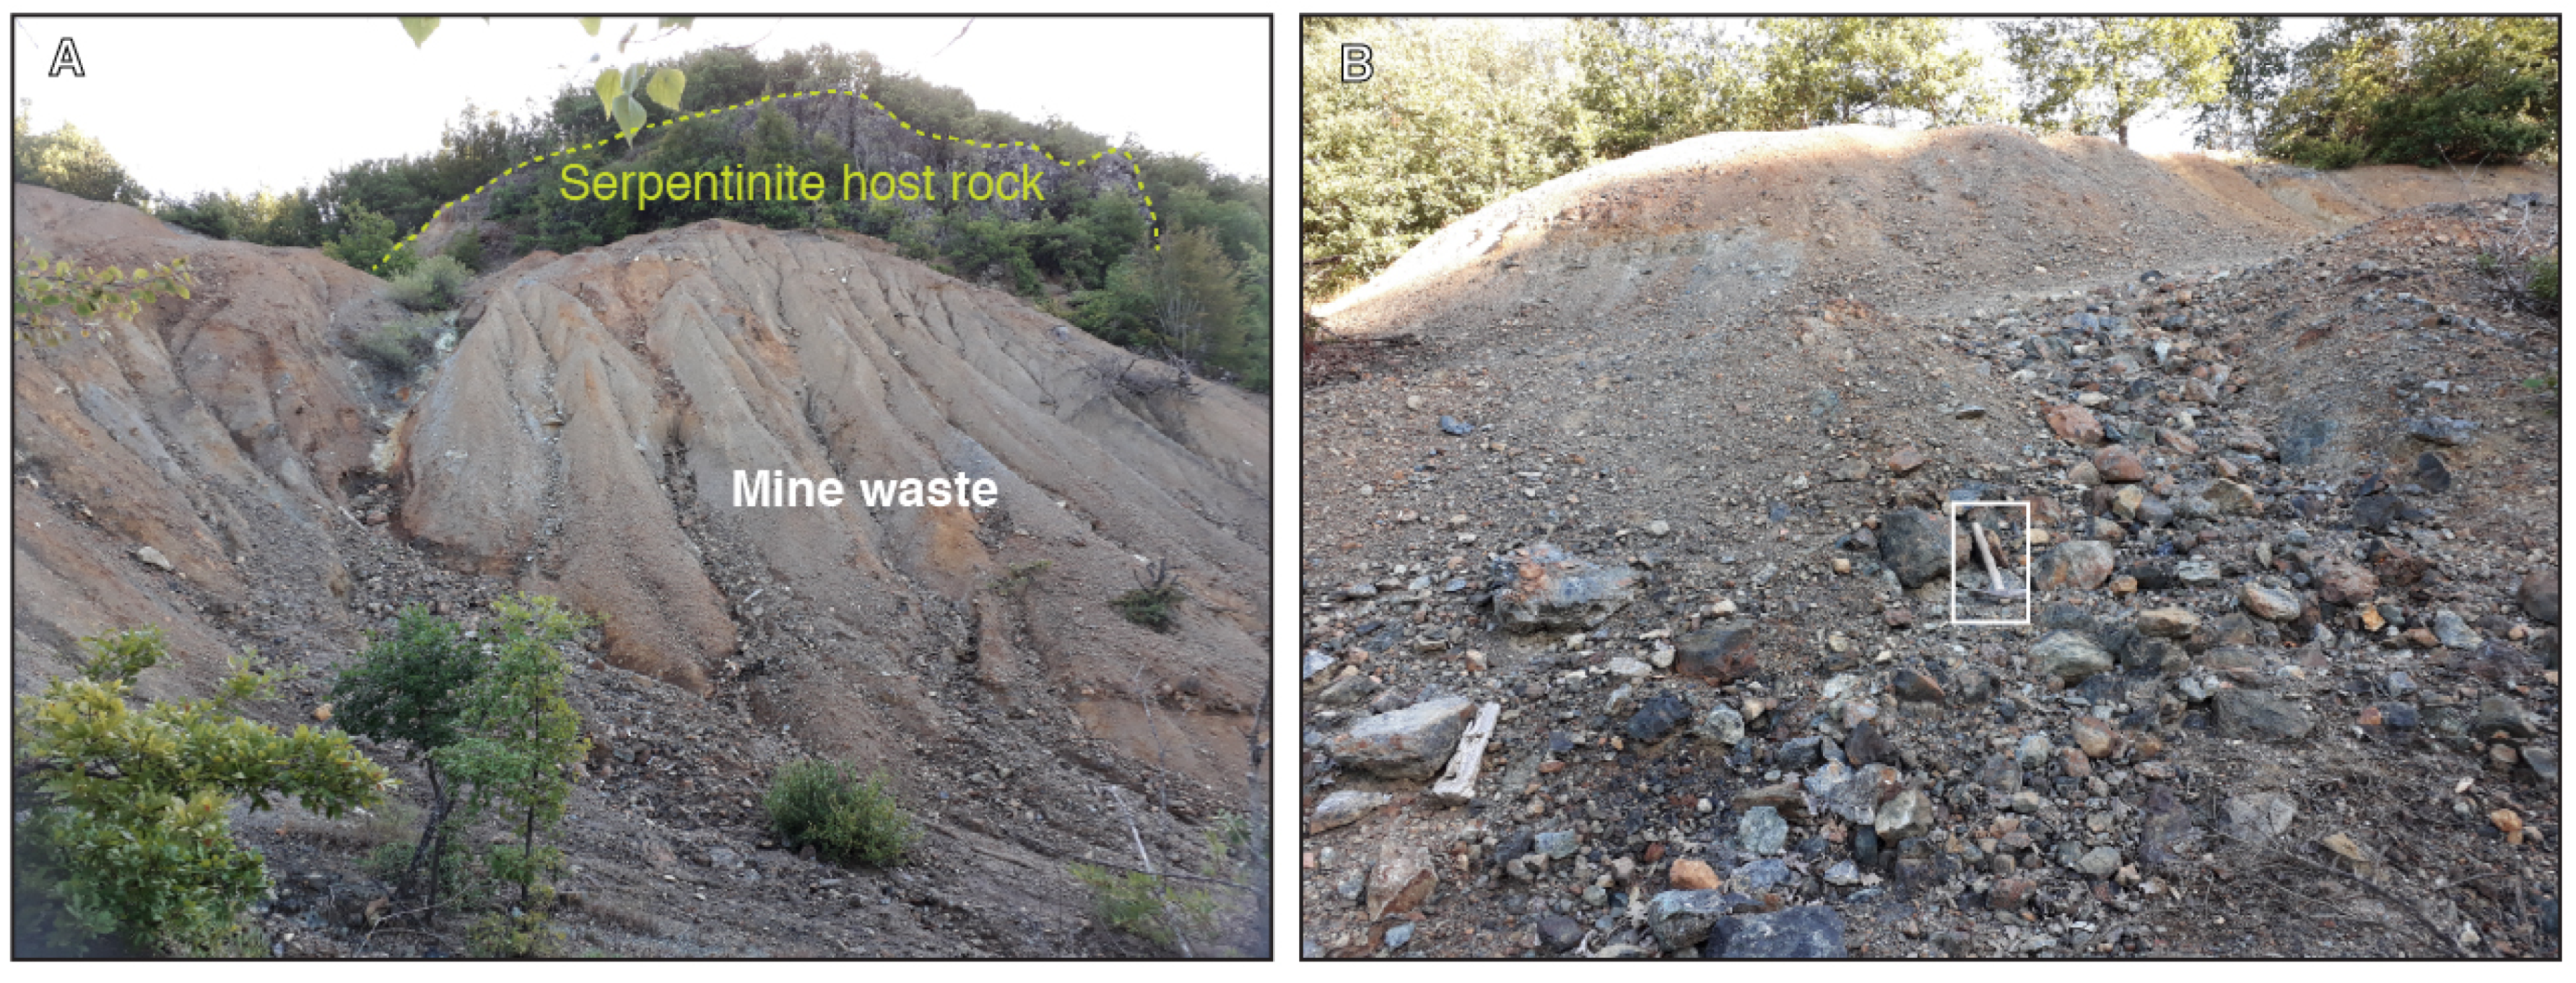
The Vigonzano mine was one of the biggest copper sulfide deposits of the Northern Apennines district and was active between the years 1948 and 1970. The main orebody was about 300,000 t, with an estimated Cu-grade 2–4 wt % [
29]. The detailed description of the local geology and of the stockwork is reported elsewhere [
26,
30]. Today, the mining site facilities are covered by mining waste dumps extending about 5000 m
2. The slopes of the stockpile are steep and shaped by the surface water runoff (
Figure 2). The mining waste materials are heterogeneous in grain size, with gravel size rock fragments embedded in an ochraceous silt–clay matrix (
Figure 2). The <2 µm fraction of the stockpile was previously investigated, and its mineralogy and geochemistry was assessed [
31]. The ochraceous matrix is mostly composed of smectite, chlorite, talc, and variable amounts of goethite, which derives from the oxidation of sulfides. The concentration of Zn; Ni; and, to a minor extent, Cu, is controlled by the cation adsorption ability of matrix smectite [
31].
3. Materials and Methods
3.1. Geochemistry
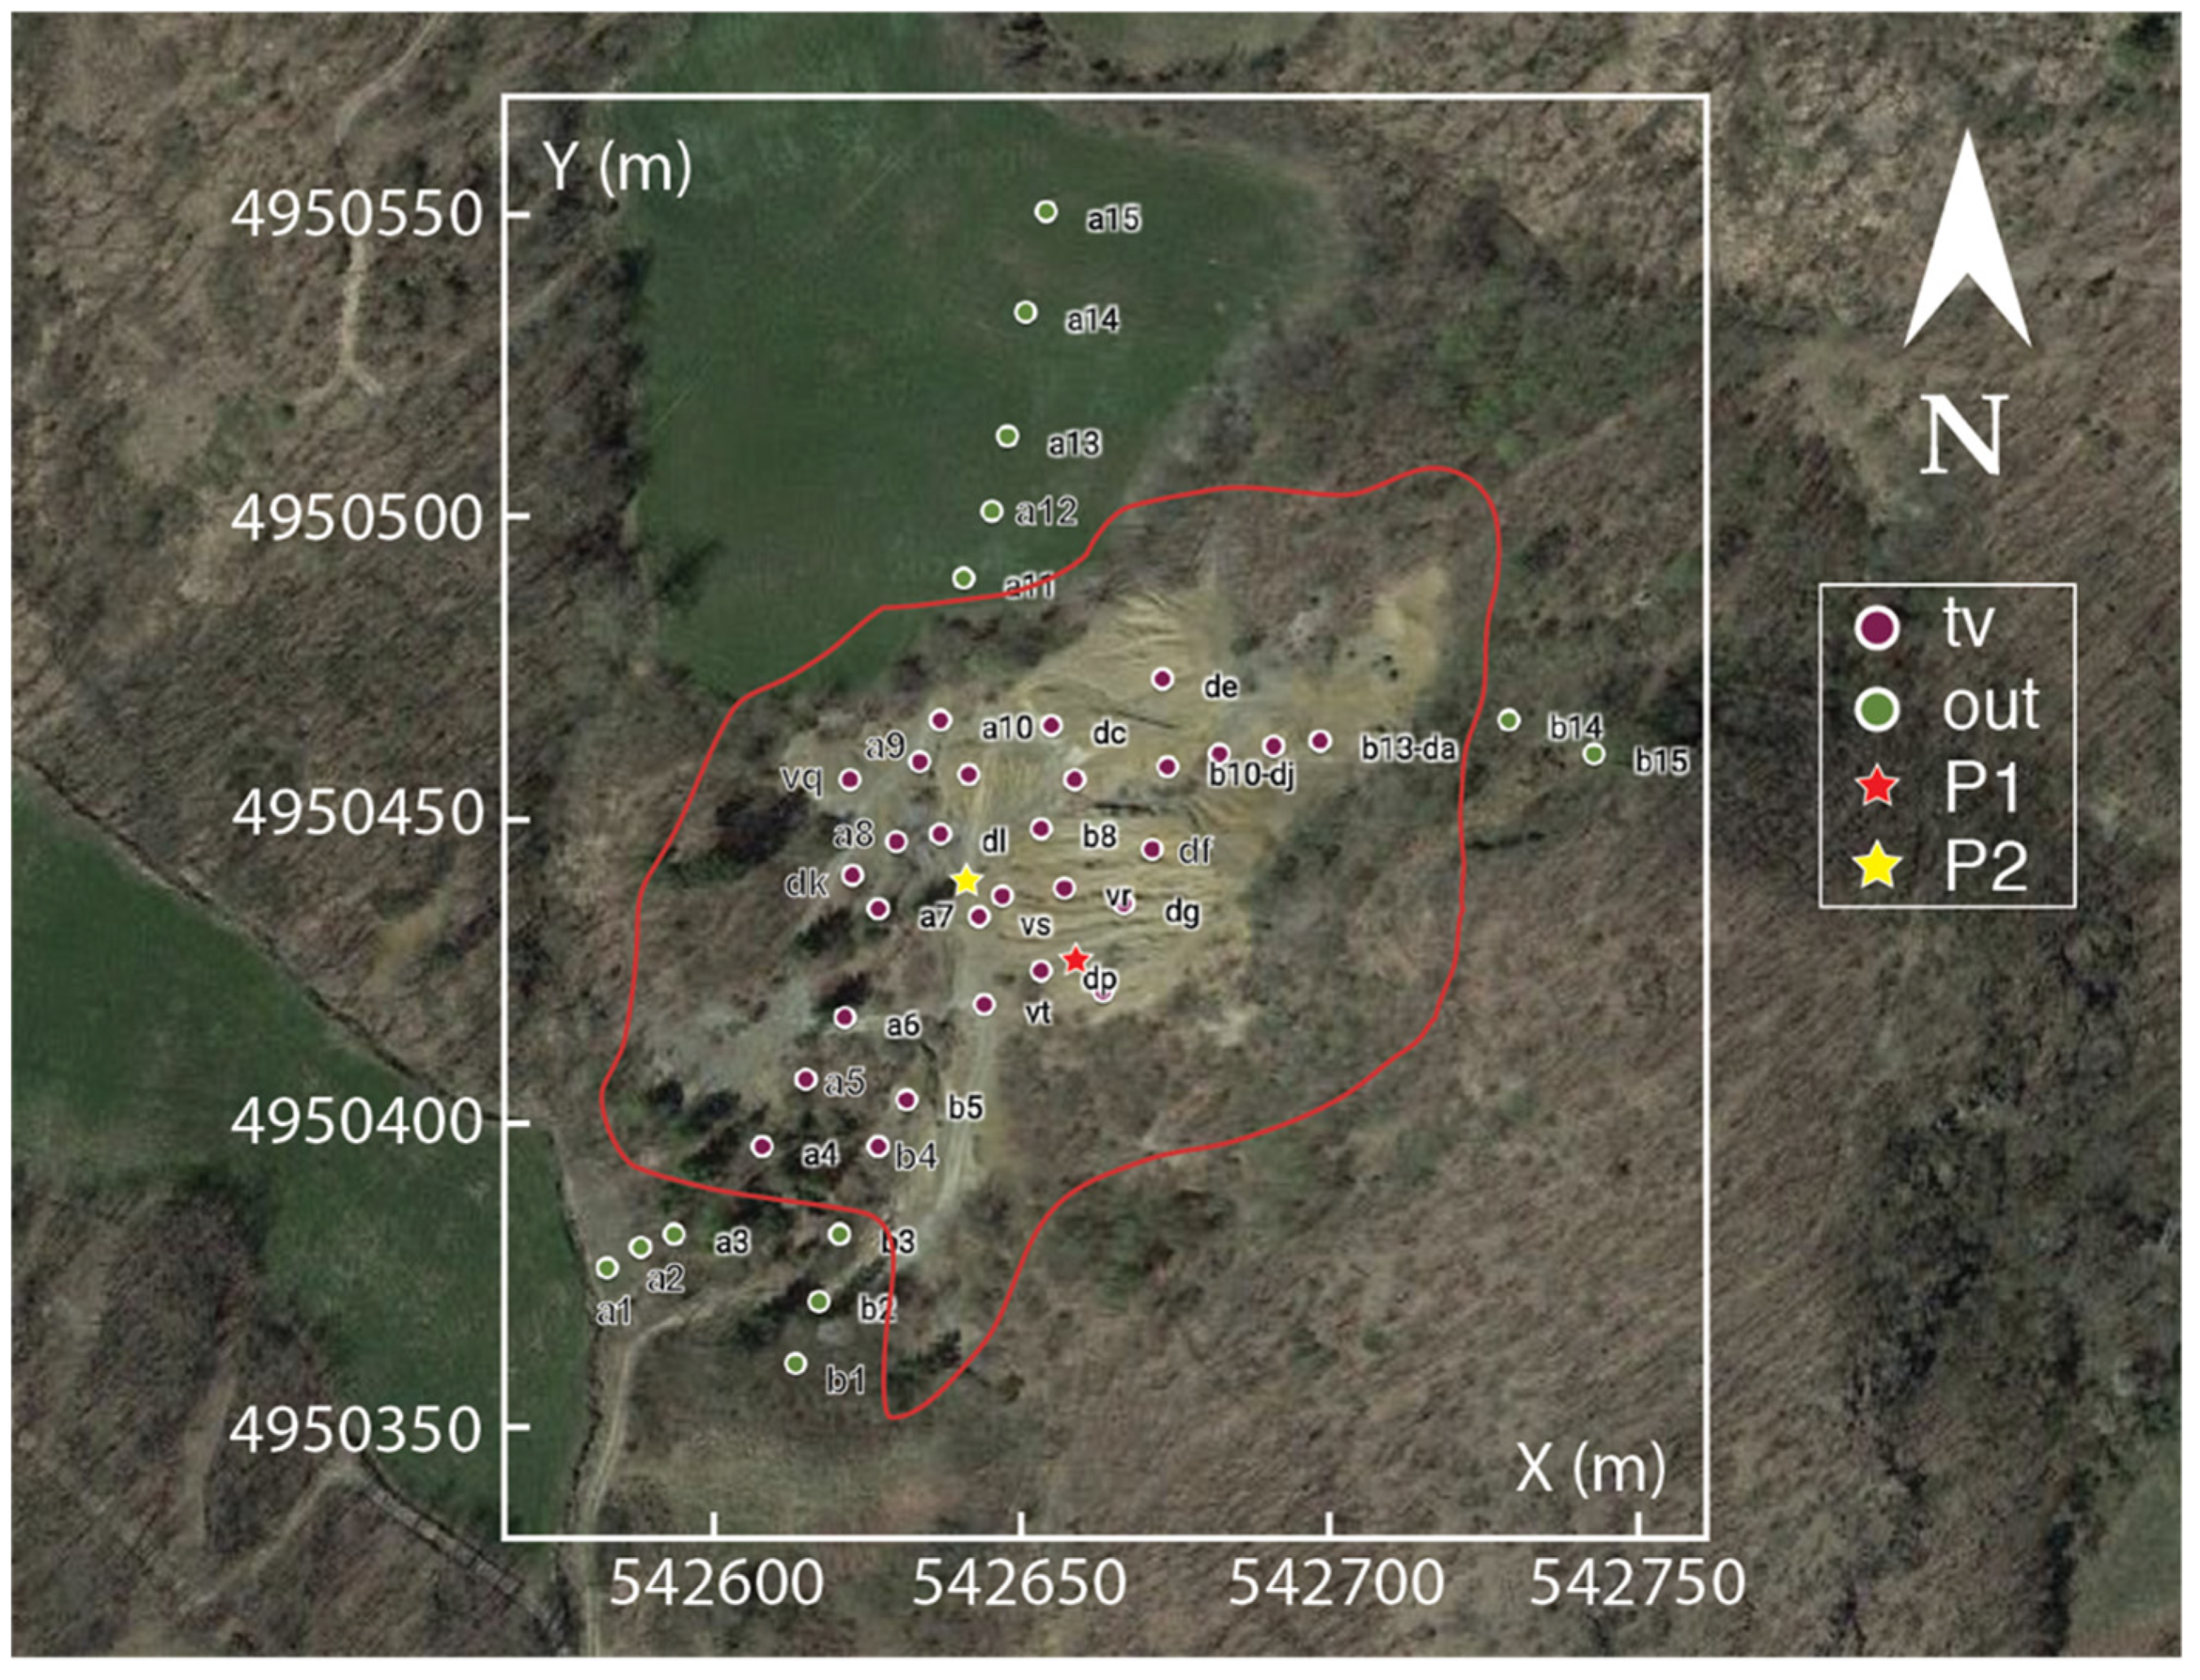
The sample set represents the result of a campaign aimed at investigating the surface (0–10 cm depth) and the subsurface (10–160 cm depths) of the Vigonzano mining waste and surrounding areas. The surface samples also include those from agricultural and uncultivated soils, as well as two samples of soils developed on the serpentinite bedrock (
Figure 3). A total of 42 surface samples were considered, 29 from the waste dump and 13 samples from the adjacent areas, clearly outside from the mine site. Analyses of all samples are reported in the
Supplementary File (Tables S1–S4). All samples were collected manually with a shovel, then quartered and sieved in laboratory to obtain a <2 mm fraction (fines). The fines were finally milled in an agate mortar for geochemical analyses.
Major and minor element concentrations (tables in the
Supplementary File) were acquired by X-ray fluorescence (XRF) spectrometry on pressed powder pellets using a PHILIPS PW 1480 spectrometer, following the methods of [
32,
33,
34] for matrix corrections. Details of analytical procedures and discussion on reproducibility and accuracy can be found in [
35]. The loss on ignition (LOI) was determined by weighting the sample powders in platinum crucibles after heating at 950 °C for 10 h.
3.2. Remote Sensing (RS)
One of the efficient and simplest methods of RS is band ratio, in order to enhance the spectral features, and it can be used in geological mapping and mineral exploration [
36]. Certain features can be highlighted on the basis of the spectral absorption and reflectance characteristics of rocks and minerals, generating a specific ratio for mineral and rock detection.
In the Vigonzano area, in situ samples are available (
Figure 3). As is shown in
Figure 3, the sample distribution is directional, with more density in the central part of the mining wastes. In addition, the Sentinel-2 image (sending date: 8 October 2020) was used. The Sentinel-2 mission orbit is sun-synchronous with 98.62° inclination, and the mean local solar time (MLST) at the descending node is 10:30 (a.m.). The multispectral instrument (MIS) on board Sentinel-2 ensures large swath high geometrical and spectral performance of the measurements. The MSI measures the Earth’s reflected radiance in 13 spectral bands from VNIR to SWIR [
37]. In the pre-processing step, all the Sentinel-2 bands were stacked and resampled at the 10 × 10 m spatial resolution using the nearest neighbor method. The time variable is not the target in this study, and it is considered constant. Then, several band ratios, defined for Sentinel-2 images, were calculated for data analysis (on the basis of the iron presence) such as iron oxides, ferrous iron oxides, ferric iron, and ferric oxides [
17]. The function of the chosen band ratios is to detect any iron bearing features on the surface. On the basis of the iron contents and its correlation with other selected elements, one can use the most representative band ratio (with higher correlation coefficient). The band ratios are selected on the basis of the previous studies for iron mineral detections [
17]. Because of the high density of vegetation in the area, the band ratios were used indirectly with the in situ samples.
4. Results
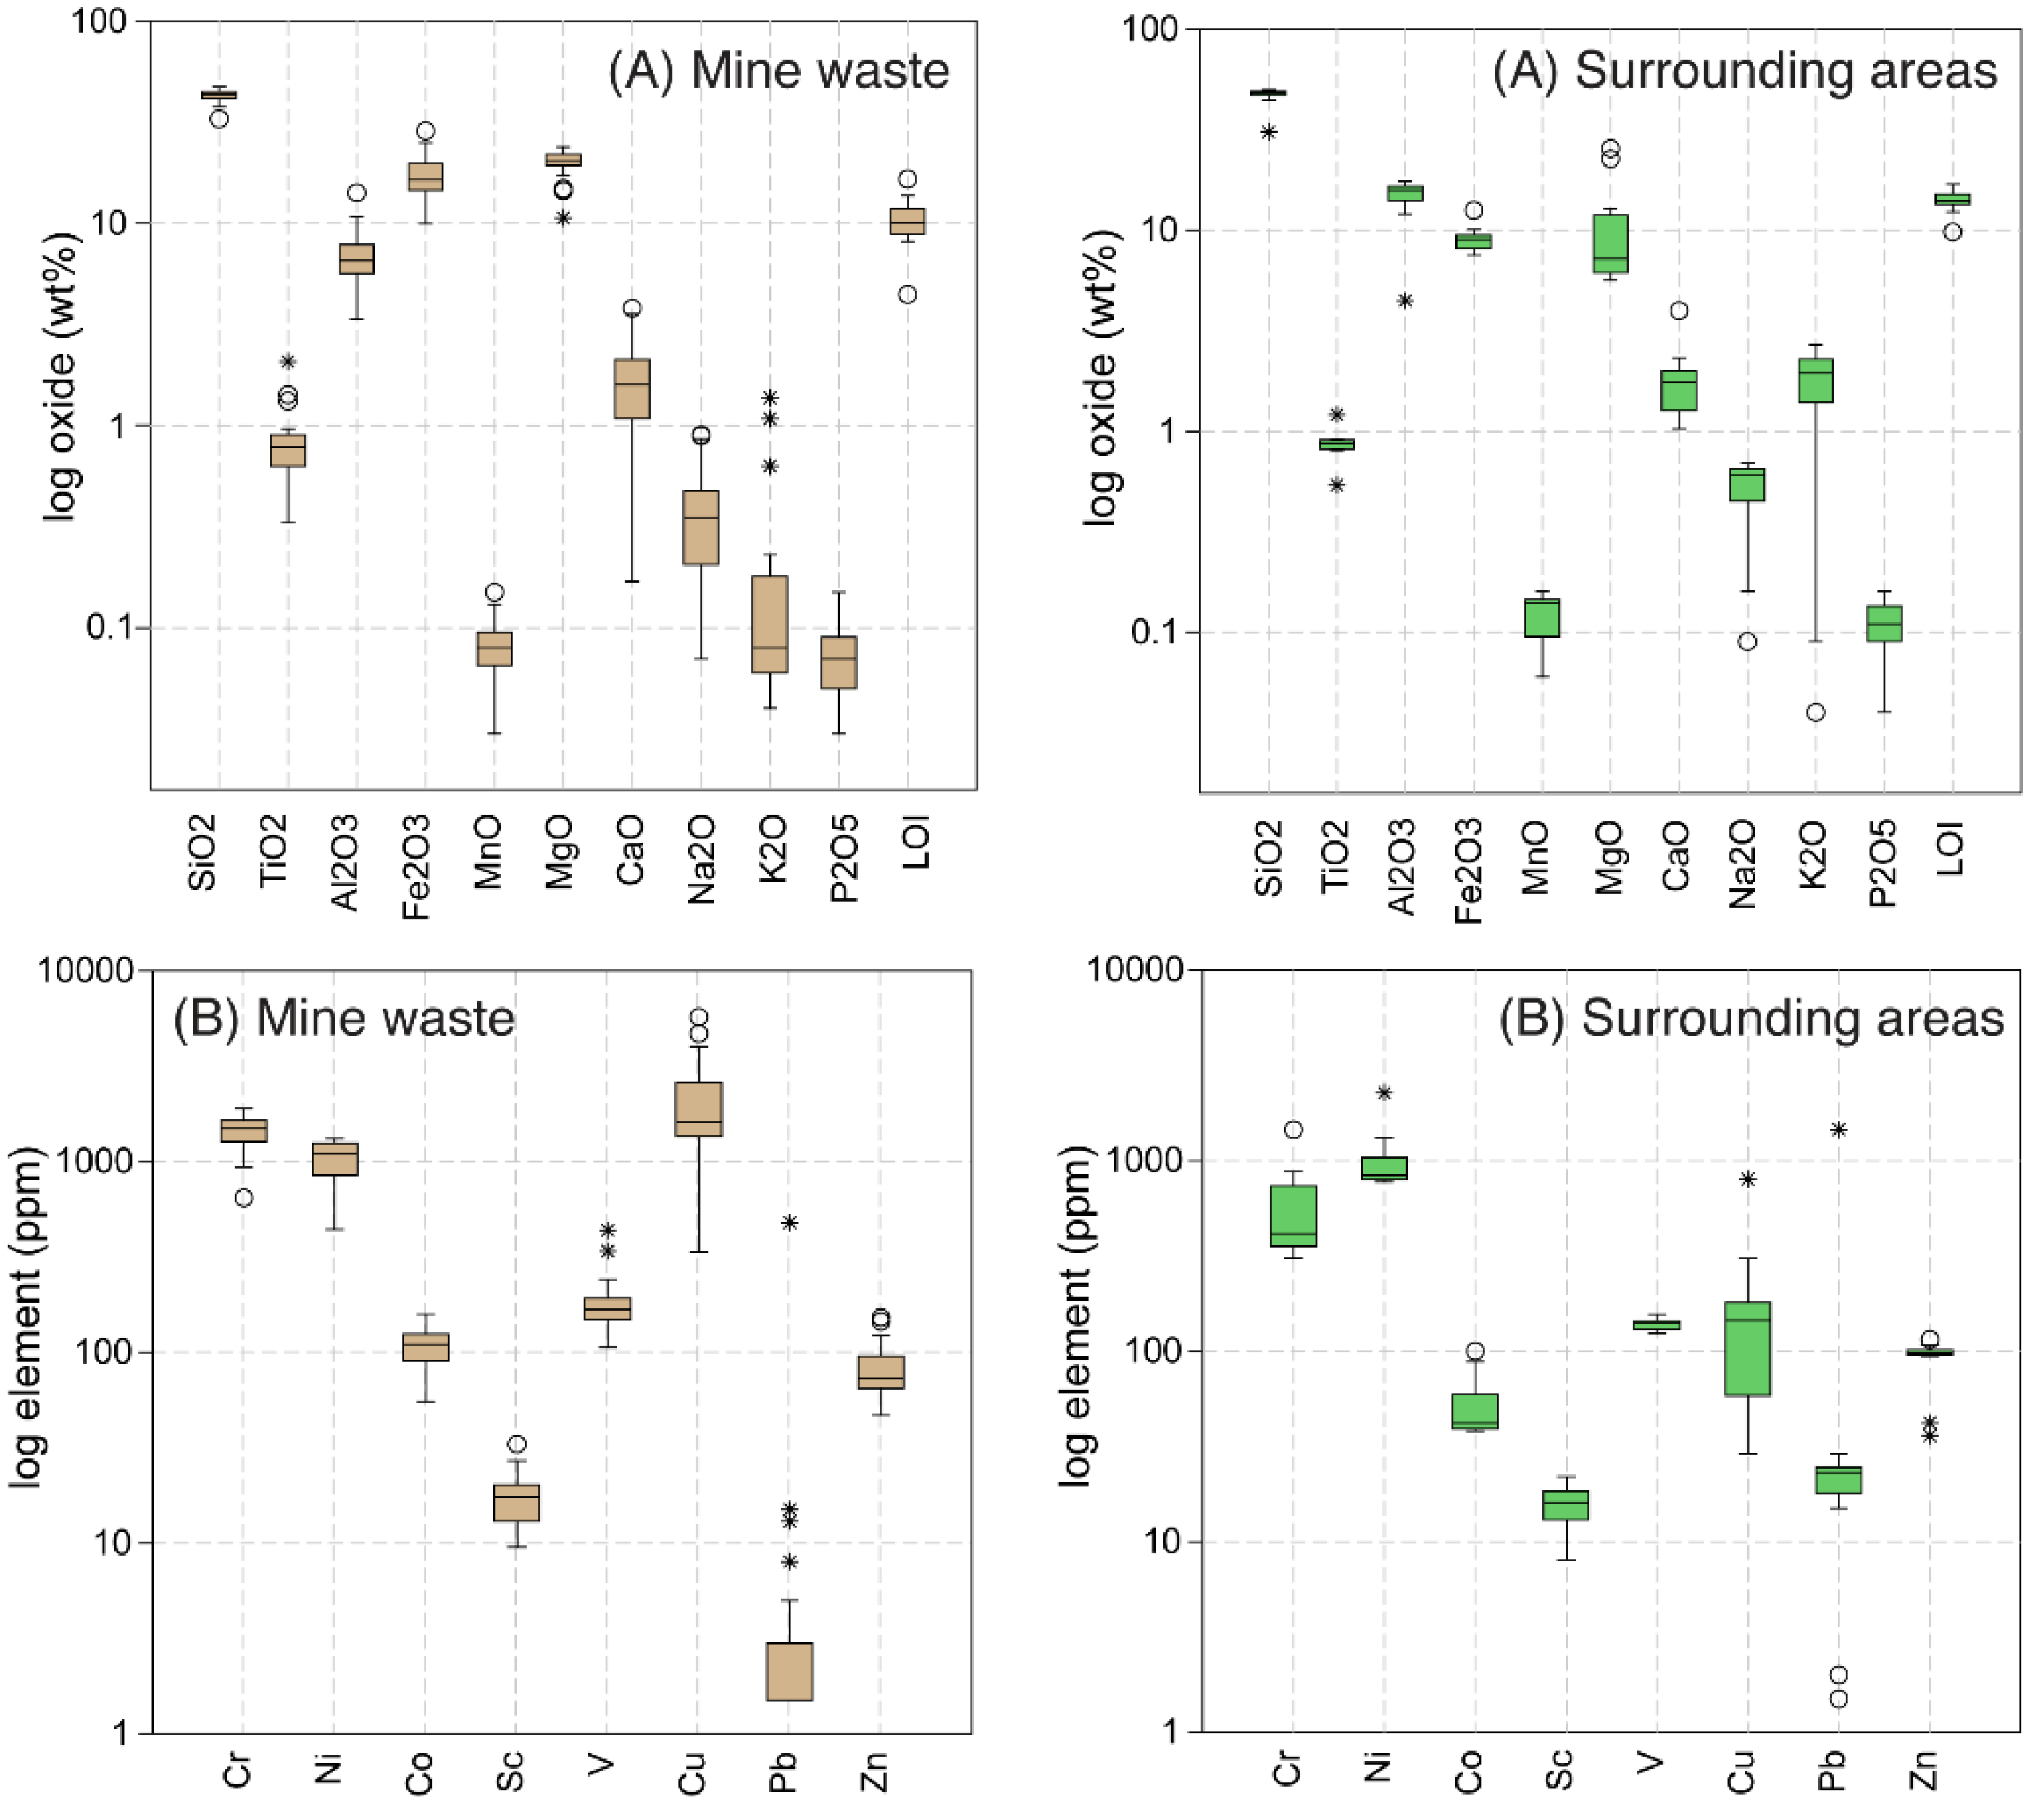
The mining waste samples were enriched in total Fe
2O
3 (min–max: 10.06–28.60 wt %; median: 16.4 wt %) and MgO (10.64–23.86 wt %; 20.2 wt %), and depleted in Al
2O
3 (3.37–14.14 wt %; 6.52 wt %) and K
2O (0.04–1.37 wt %; 0.08 wt %) compared to the adjacent topsoil from the surrounding areas (
Figure 4).
The LOI was large in both sample groups within the mining waste (4.45–16.52 wt %), in comparison with the surrounding areas (9.81–16.98 wt %). The CaO and LOI increased in the subsurface samples with depth (exceeding 20 wt % from P1), coupled with a decrease of SiO
2, Al
2O
3, and Fe
2O
3 (
Supplementary File, Figures S1 and S3). The trend shows the approaching to the local bedrock, which is the carbonated serpentinite. The subsurface samples from P2, instead, show limited variations relative to the surface samples, with the exception of Fe
2O
3, which decreased with depth, from 25.99 to 12.65 wt %.
Among other elements, the concentrations of Ni, Pb, Sc, and Zn were similar within the mining waste and the surrounding areas. Conversely, the concentrations of Cr, Co, Cu, and V were enriched in the mining waste area compared to the surrounding areas (
Figure 4). The subsurface samples from the profile P1 showed a slight increasing in Co, Cr, and Cu concentrations up to −50 cm depth (
Figure S2). At the greater depths, concentration of Co and Cu decreased, with the exception of Cr, which reached its maximum concentration (around 2500 ppm) at 160 cm depth. The Co, Cr, and Cu concentrations at the site P2 did not display variations, being more than 100 ppm, 1000 ppm, and 1750 ppm, respectively (
Figure S4).
Statistical analysis was performed to evaluate the variability of the geochemical elements. One of the sensitive elements in RS detection is iron, because of the iron absorption features at multiple bands in VNIR [
38]. Therefore, the correlation coefficient of iron with different elements was studied (
Table 1). The choice of iron was based on [
31]: the heavy metal carriers in Vigonzano are Fe-clay minerals (smectite and chlorite), thus making total Fe
2O
3 a proxy for metal occurrence. We used this knowledge on the Fe
2O
3–metals relationships in our statistical approach. Outliers were excluded for cerium data. The band ratios for the iron mineral detection were tested, and only that showed the medium–high (>0.5) correlation coefficient with the major and trace element concentrations were chosen.
To better understand the spatial variability of selected elements within the Vigonzano mining waste, we calculated experimental variograms [
22] (direct and cross-variograms). Direct experimental variograms were obtained and modelled for the two main parameters: target elements (chromium, copper, cobalt, cerium, niobium, rubidium, lanthanum, and iron) and band ratios (Band Ratio 4/2 and Band Ratio 4/11). In order to analyze the spatial correlation between band ratios and selected elements, we calculated the cross-variograms and the co-regionalization models were fitted. Therefore, the Co-Kriging estimation method [
22] could be used to map the variability of geochemical elements in Vigonzano mining wastes.
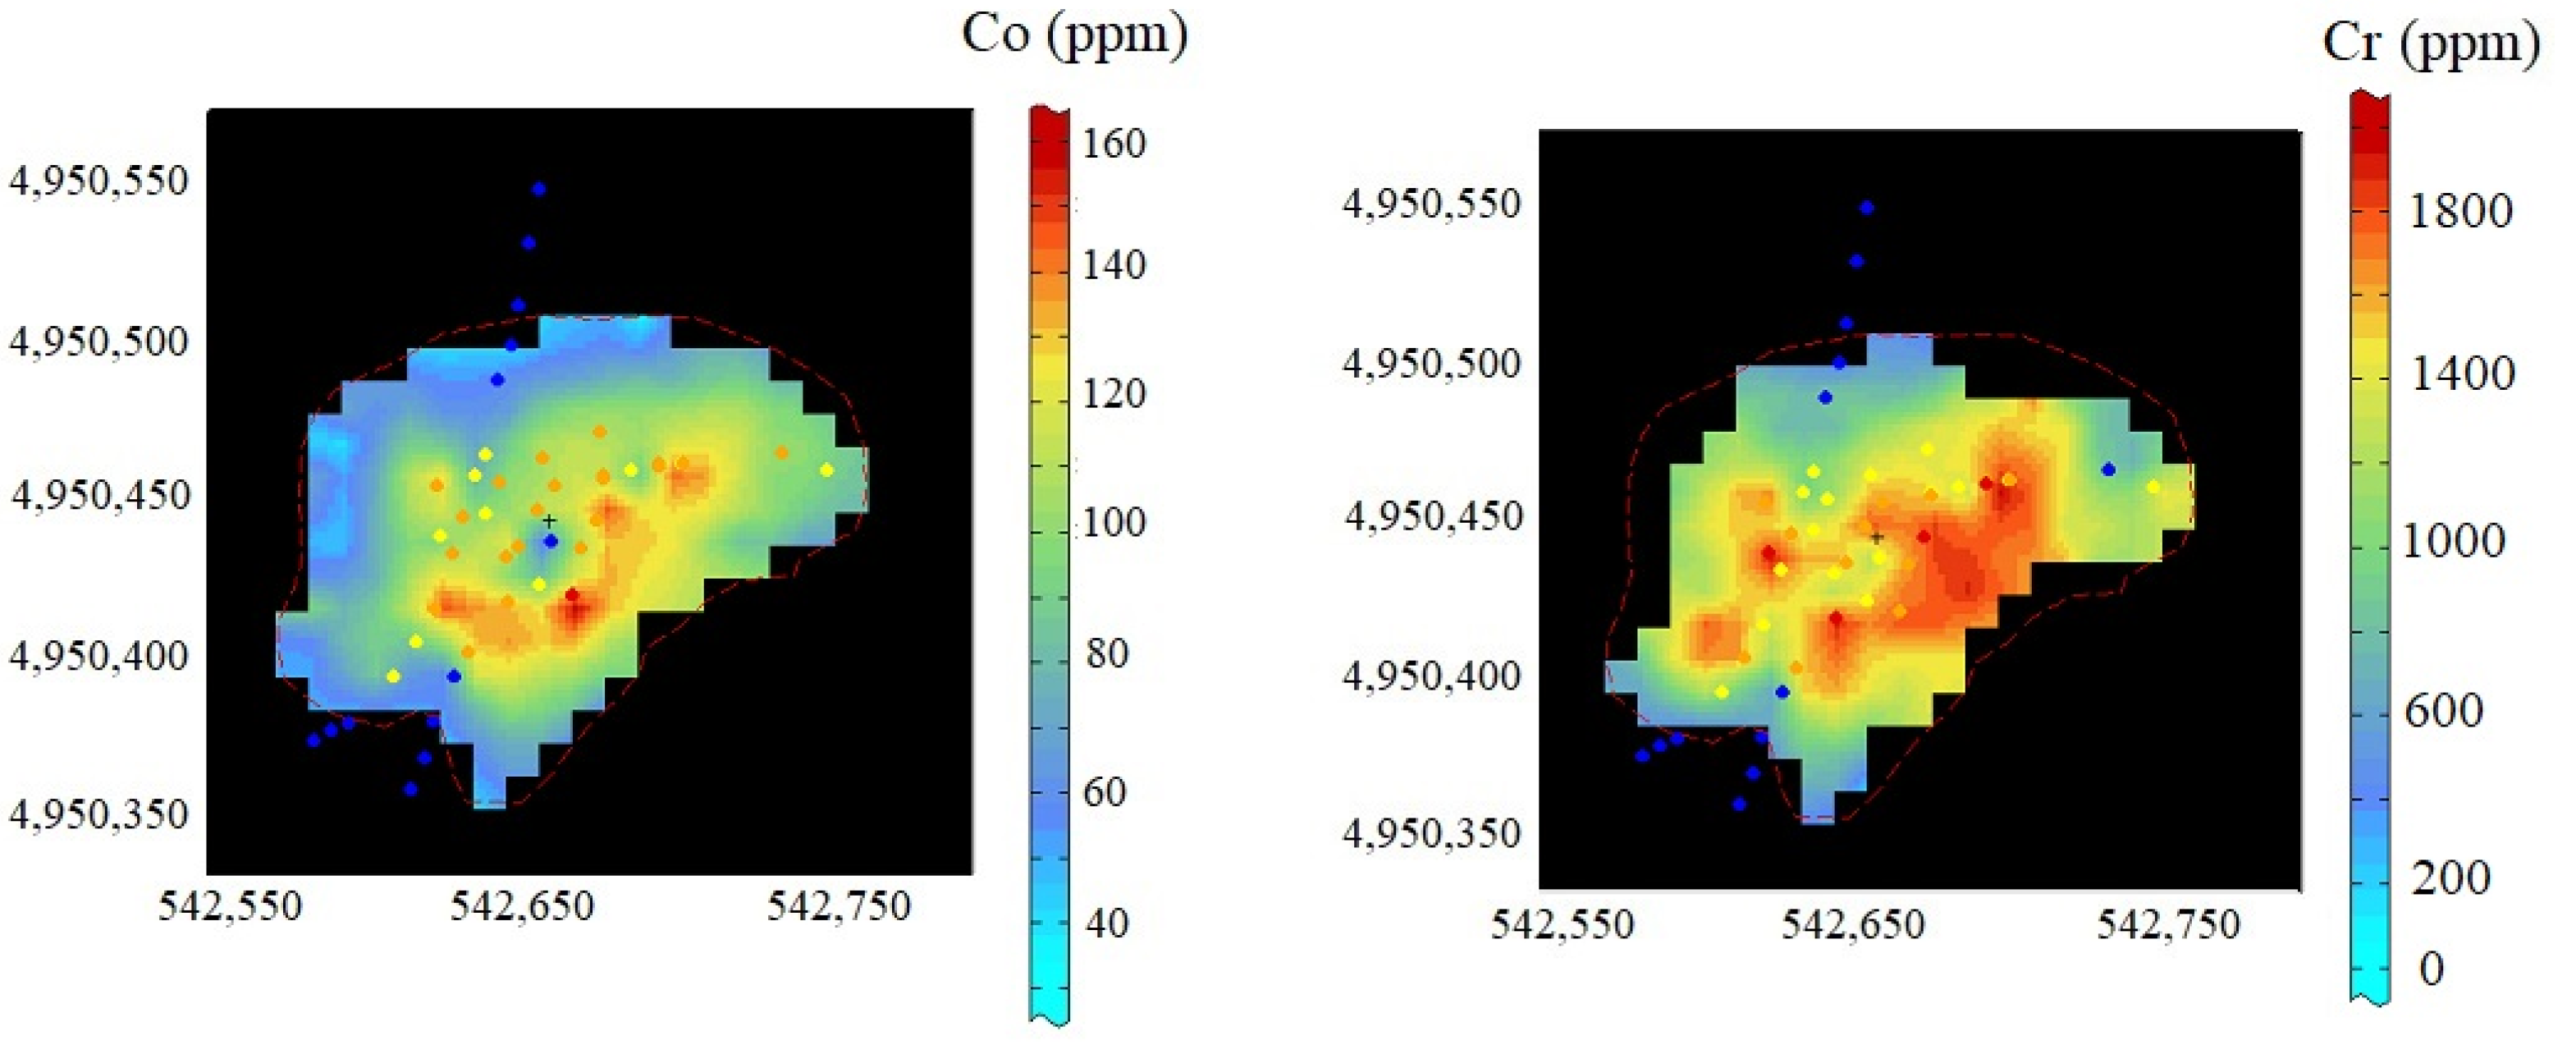
On the basis of the high correlation coefficient (≥0.6) between the element’s concentration and the band ratios (
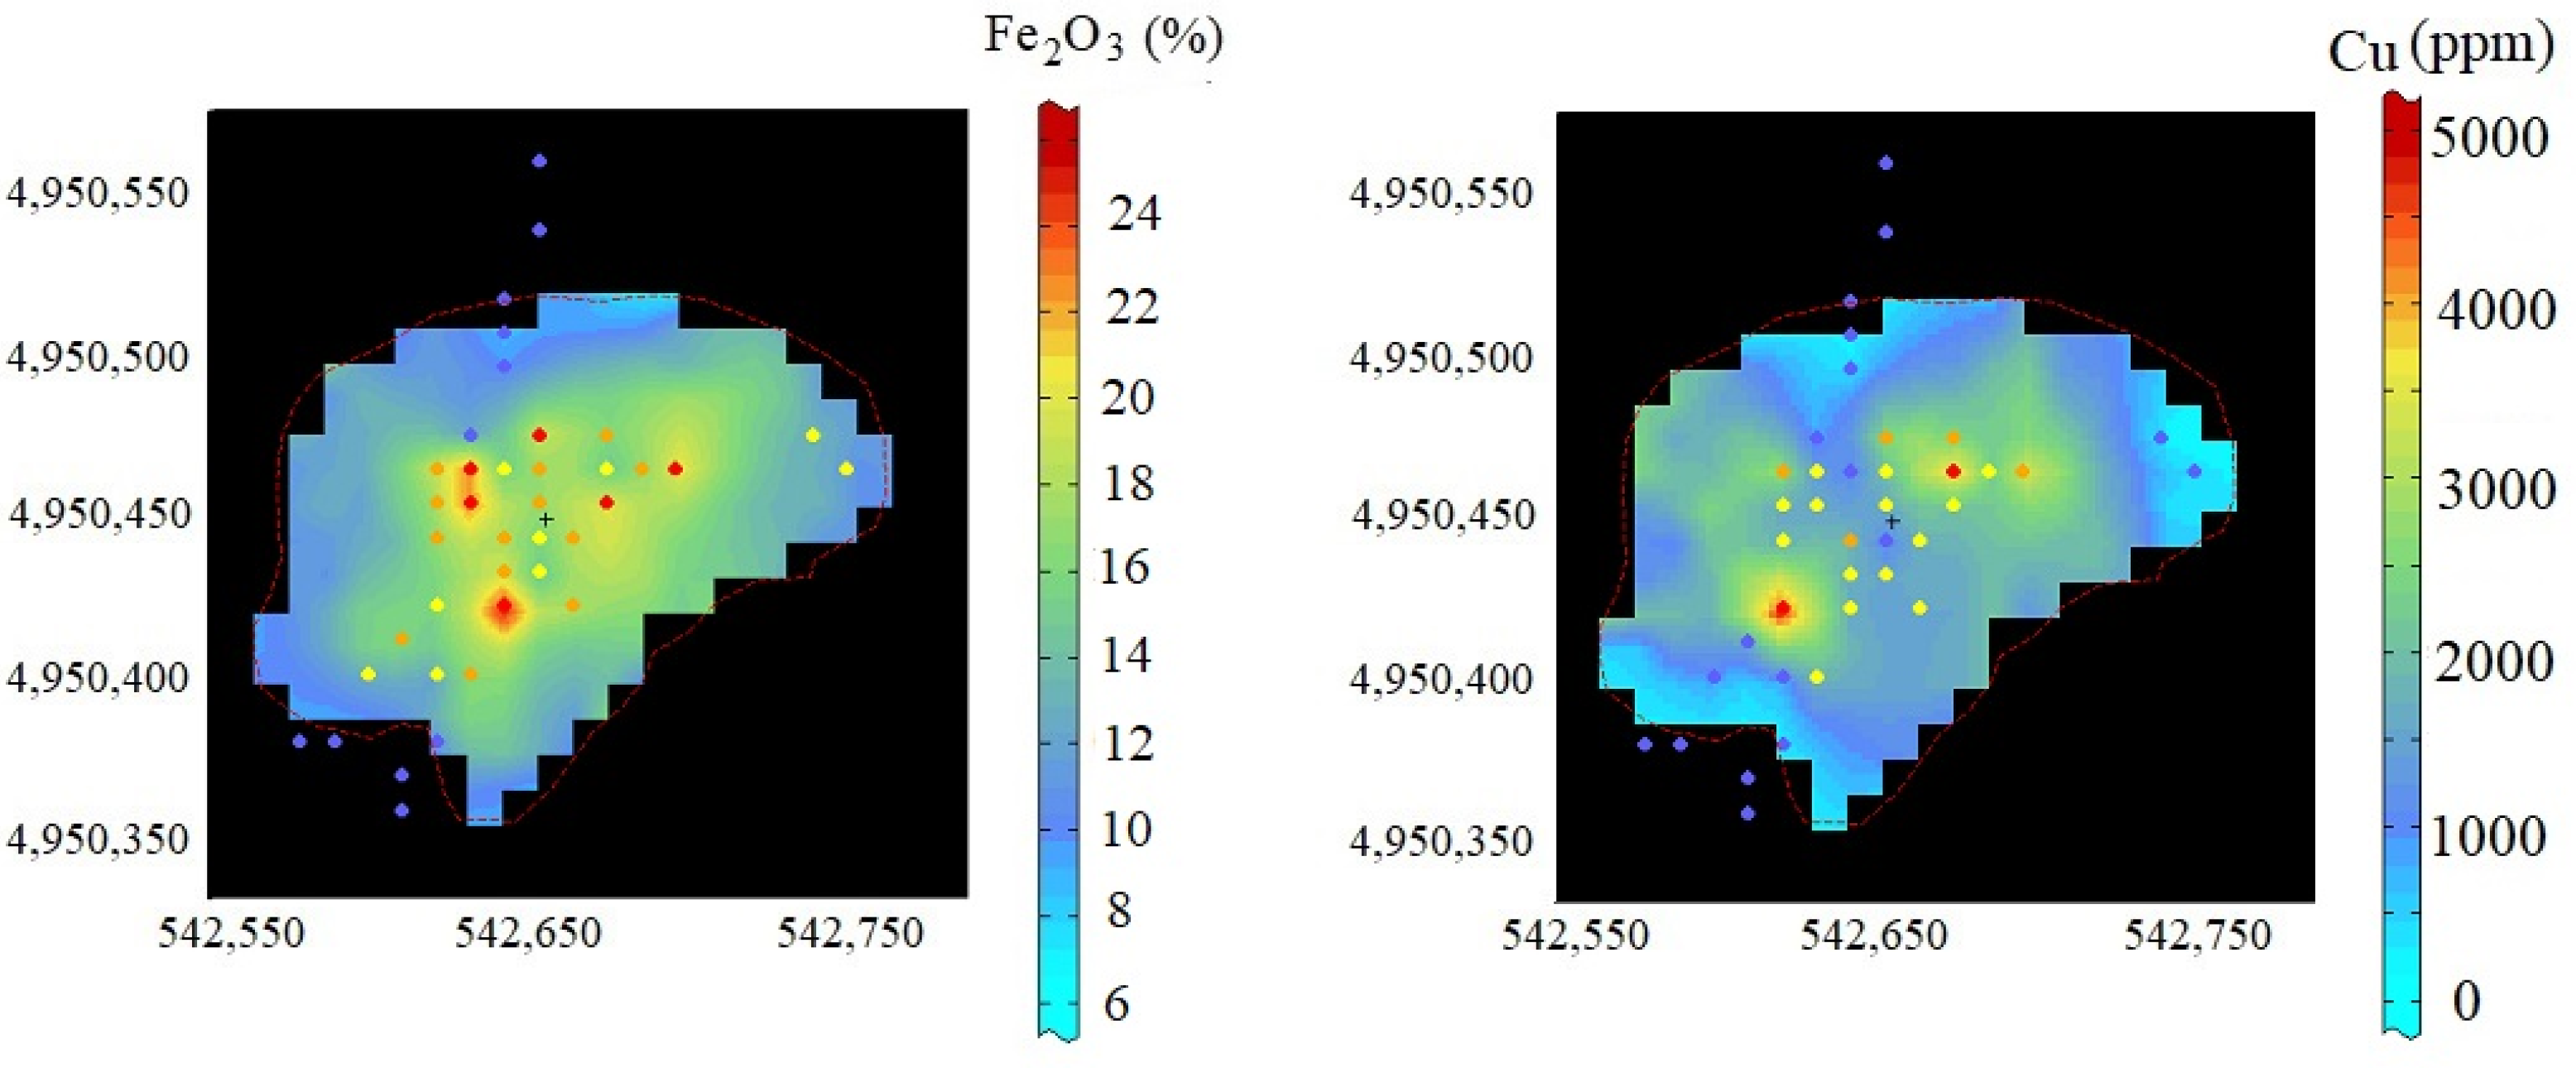
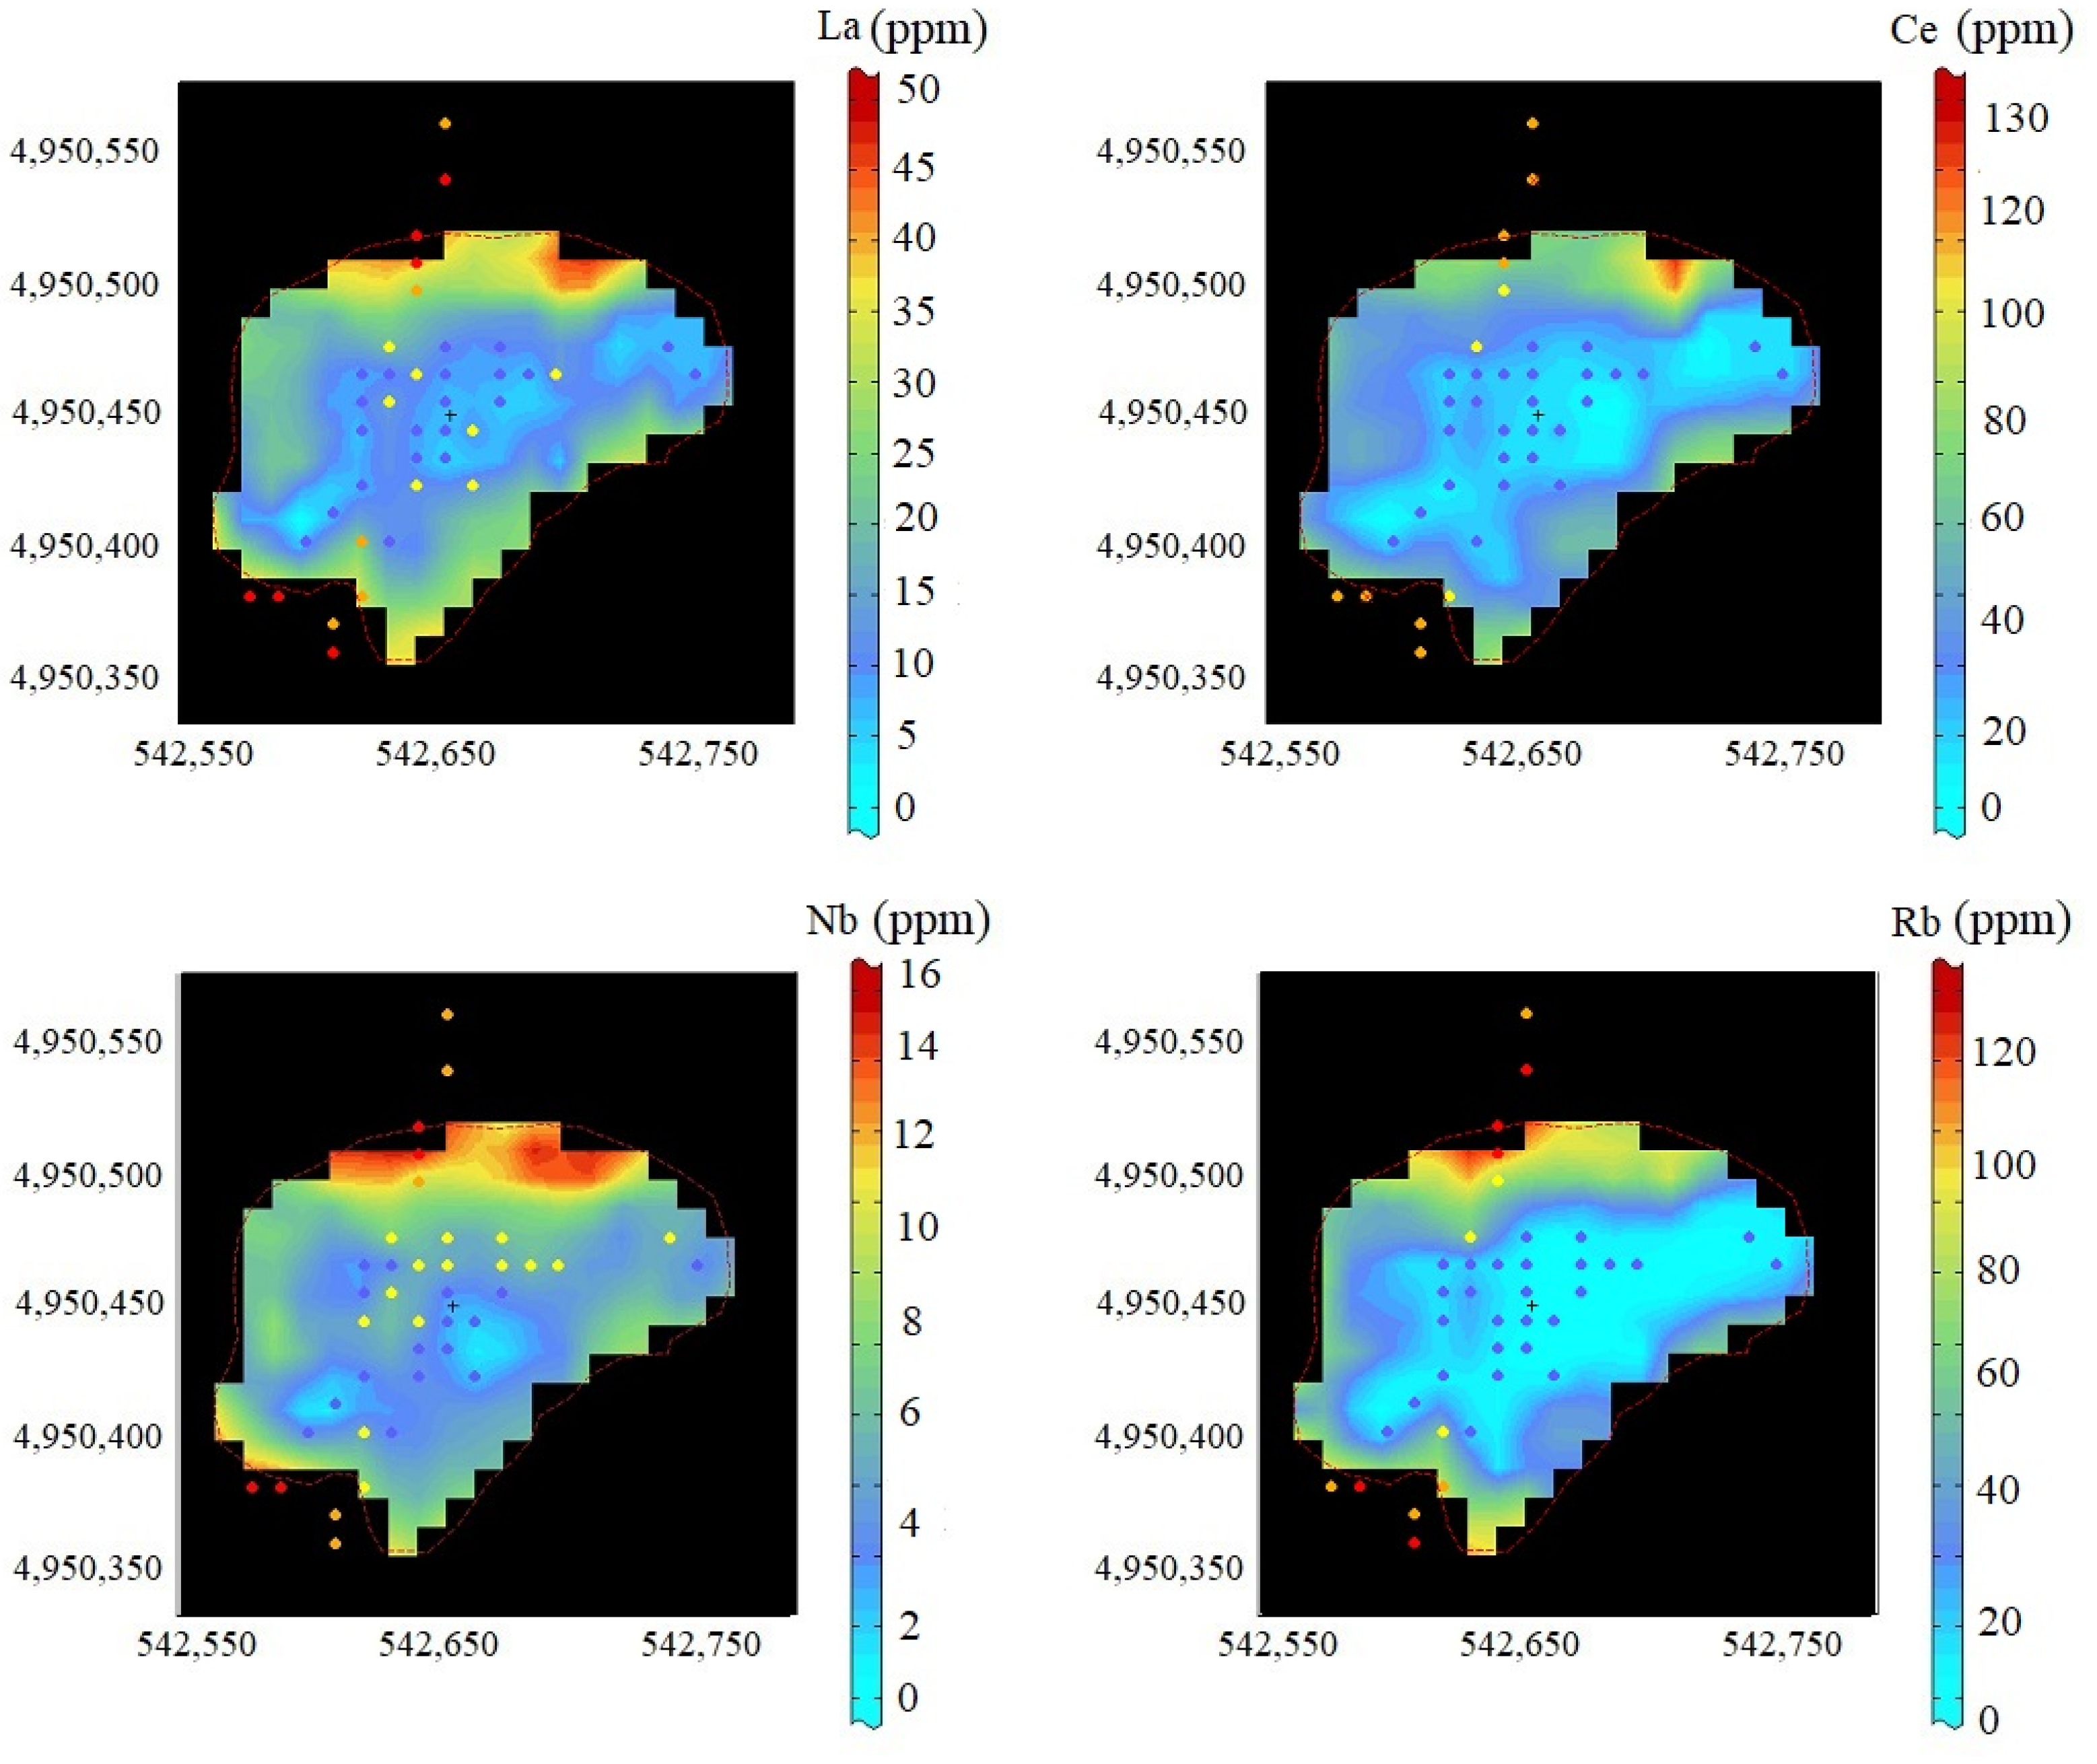
Table 1), we used the multivariate approach (Co-Kriging estimation) to map the major and trace elements (
Figure 5 and
Figure 6). Final maps have a 10 × 10 m grid, equal to the Sentinel-2 data spatial resolution.
The obtained maps for the major elements (Co, Cr, Fe2O3, and Cu) showed the higher concentration inside the mining wastes in comparison with the boundaries. For Co and Cr, similar spatial variability showed the highest concentration in the south and south-east parts of the mining wastes, while for Fe2O3 and Cu, the central parts had the highest concentration.
For trace elements (La, Ce, Nb, and Rb), the concentration was highest near the boundaries, with similar spatial pattern for the four elements. The depleted area was from the north-east into the south-west.
5. Discussion
Two databases for the selected area in Vigonzano were collected and studied. Geochemical in situ samples were taken directly from the mining wastes, and EO data were indirect data (Sentinel-2 image). At the first statistical analysis, iron showed a high correlation with the major and trace elements (such as Cr, Co, Cu, Ce, La, Rb, and Nb). In addition, since iron is an important element in RS to detect minerals, the iron band ratios were considered as auxiliary database for mapping. To map the selected elements, we needed the co-regionalization modeling to demonstrate the spatial correlations.
The co-regionalization modelling of major and trace elements was quite challenging because (1) the limited numbers of geochemical samples and (2) the selectivity and directional sampling that resulted in having more samples in the middle and less samples from the boundaries of the mining wastes, wherein the bedrock crops out. RS data provide a homogenous 10 × 10 m data grid that plays a fundamental role in mapping because of the large amount of data. The spatial correlation between RS data and in situ samples helped in the estimation of the unknown areas using the Co-Kriging estimation.
The composition maps confirmed the geochemical interpretations of iron (Fe2O3) and Cu and Cr enrichments in the Vigonzano mining wastes compared to the adjacent agricultural areas. The Fe2O3 and Cu reflected the heterogeneity of the wastes, whereas the Cr distribution was likely related to the bedrock lithological composition, i.e., serpentinized ultramafic rocks.
The element distribution showed that about 20% of the mine area (around 1000 m
2) had Cu > 2500 ppm and Cr > 1500 ppm. Results were obtained from the integration of RS and in situ samples (considering only the surface area) and assuming a bulk density of 1350 kg/m
3 [
39]. Therefore, a minimum grade of 0.3% for Cu and 0.2% for Cr was obtained for one meter depth. For comparison with the main source of global copper, the Cu grade in porphyry deposits is 0.2–1.5% [
40]. Moreover, Co as a critical element, showing the enrichment in the south-east part of the Vigonzano abandoned site, with a similar pattern as Cr. About 10% of the mining wastes area had Co > 130 ppm, with the minimum grade of 0.01%. This very low grade value is instead similar to the Co grade assessed for magmatic Ni–Cu (Co-PGE) sulfide deposits worldwide [
41]. The maps (
Figure 6) indicate the Ce, La, Rb, and Nb depletion within the Vigonzano mining waste relative to the surrounding areas. The relative enrichment of these elements in the agriculture soils was not investigated, but a working hypothesis is that the enrichment of these elements is related to the use of fertilizers.
The main limitation of this practical approach is that it relies on the surface data (surface samples and Sentinel-2 images). In general, the lack of concentration data along vertical profiles in mining waste increases the uncertainties of the grade assessments. Many challenges such as sampling along depth profiles, heterogeneity of materials, and modification of the mineralogy due to weathering remain. To achieve a comprehensive characterization of mining wastes, one requires precise and regular sampling (both for environmental and economic aspects). Our practical approach, however, highlights the suitable subregions inside the dump area where more detailed investigations, especially in 3D, should be performed.
The Vigonzano site is a small-scale abandoned mine that can be regarded as an unimportant prospect for secondary recovery of critical and other strategic raw materials. However, according to the most recent Italian catalogue on abandoned mine sites [
42], small-scale sites (with mining concessions less than 100,000 m
2) account for about 19% of the Italian legacy mines inventory. Therefore, the method applied to the Vigonzano case study could be upscaled to a nation-wide program of secondary raw material potential availability.
6. Conclusions
Mining wastes are strategically important because of the high demand for the new raw materials resources. The characterization and variability maps of compositions for the major and trace elements are the main targets to evaluate the presence of any precious element. However, the artificial spatial variability of mining wastes, which is different from natural spatial variability of deposits, make the characterization complicated and challenging.
The surface geochemistry of the Vigonzano mining area was coupled with Sentinel-2 image from Copernicus data to study the major element detections. Band ratios related to iron oxides and ferrous iron oxides were used to find a meaningful correlation with the element’s concentrations. On the basis of the high correlation coefficients between band ratios and some of the major and trace elements (Fe2O3, Cu, Co, Cr, Ce, La, Rb, and Nb), we obtained composition maps using Co-Kriging method. Results show important concentration within the mining wastes for Fe2O3, Cu, Co, and Cr and depletion for Ce, La, Rb, and Nb compared to the surrounding agricultural soils. The grade estimation for interesting metals such as Co, Cr, and Cu resulted in similar values to worldwide low-grade ore deposits.
The results confirmed the essential advantage of combining remote sensing and in-situ samples in mapping the major and trace elements. This low-cost approach based on publicly available EO data is an interesting tool for decision makers to assess critical raw material resources and to design projects to remove heavy metal contaminants from abandoned mine sites.
Supplementary Materials
The following supporting information can be downloaded at:
www.mdpi.com/article/10.3390/app12041928/s1, Figure S1. Chemical (major elements) stratigraphy of profile P1. Figure S2. Co–Cr–Cu stratigraphy of profile P1. Figure S3. Chemical (major elements) stratigraphy of profile P2. Figure S4. Co–Cr–Cu stratigraphy of profile P2. Tables S1–S4: Major (wt %) and trace element (ppm) bulk composition of samples. All calculations were conducted using ISATIS software, license of Bologna University.
Author Contributions
Conceptualization, S.K. and R.B.; methodology, S.K. and E.D.; software, S.K.; validation, S.K. and R.B.; formal analysis, S.K. and R.B.; investigation, S.K. and R.B.; resources, R.B.; data curation, E.D.; writing—original draft preparation, S.K. and R.B.; writing—review and editing, S.K., R.B. and E.D.; visualization, S.K. and R.B.; supervision, R.B.; project administration, R.B.; funding acquisition, R.B. All authors have read and agreed to the published version of the manuscript.
Funding
This research was funded by EIT Raw Materials, project no. 18259, “BioLeach: Innovative Bio-treatment of RM.” and by by the RawMatCop Programme (2018–2021), funded by the European Commission and EIT RawMaterials, grant agreement number “271/G/Gro/COPE/”.
Institutional Review Board Statement
Not applicable.
Informed Consent Statement
Not applicable.
Data Availability Statement
Not applicable.
Acknowledgments
We would like to thank the Associate Editors Gianluca Bianchini and Claudio Natali and four anonymous reviewers for helpful comments that improved the manuscript.
Conflicts of Interest
The authors declare no conflict of interest.
References
- Mancini, L.; Eslava, N.A.; Traverso, M.; Mathieux, F. Assessing impacts of responsible sourcing initiatives for cobalt: Insights from a case study. Resour. Pol. 2021, 71, 102015. [Google Scholar] [CrossRef]
- Blengini, G.A.; Latunussa, C.E.; Eynard, U.; de Matos, C.T.; Wittmer, D.; Georgitzikis, K.; Pavel, C.; Carrarra, S.; Mancini, L.; Unguru, M.; et al. Study on the EU’s List of Critical Raw Materials, European Commission ed.; European Comission: Brussels, Belgium, 2020. [Google Scholar]
- EUROSTAT. Available online: https://ec.europa.eu/eurostat/statistics-explained/index.php?title=Waste_statistics (accessed on 20 August 2021).
- Žibret, G.; Lemiere, B.; Mendez, A.-M.; Cormio, C.; Sinnett, D.; Cleall, P.; Szabó, K.; Carvalho, M.T. National Mineral Waste Databases as an Information Source for Assessing Material Recovery Potential from Mine Waste, Tailings and Metallurgical Waste. Minerals 2020, 10, 446. [Google Scholar] [CrossRef]
- Blengini, G.A.; Mathieux, F.; Mancini, L.; Nyber, M.; Viegas, H.M. Recovery of Critical and Other Raw Materials from Mining Waste and Landfills: State of Play on Existing Practices, EUR29744EN; Salminen, J., Garbarino, E., Orveillon, G., Saveyn, H., Aquilino, V.M., González, T.L., Polonio, F.G., Horckmans, L., D’Hugues, P., Balomenos, E., et al., Eds.; Publications Office of the European Union: Luxembourg, 2019; ISBN 978-92-76-08568-3. [Google Scholar]
- Wagner, M.; Bide, T.; Cassard, D.; Huisman, J.; Leroy, P.; Bavec, Š.; Söderman, M.L.; Løvik, A.N.; Wäger, P.; Emmerich, J.; et al. Optimising Quality of Informationin Raw Materials Data Collection across Europe (ORAMA); Technical Final Report & Recommendations: Brussels, Belgium, 15 November 2019. [Google Scholar]
- Castillo, S.; de la Rosa, J.D.; de la Campa, A.M.S.; González-Castanedo, Y.; Fernández-Caliani, J.C.; Gonzalez, I. Contribution of mine wastes to atmospheric metal deposition in the surrounding area of an abandoned heavily polluted mining district (Rio Tinto Mines, Spain). Sci. Total Environ. 2013, 449, 363–372. [Google Scholar] [CrossRef]
- Alcolea, A.; Fernández-López, C.; Vázquez, M.; Caparrós, A.; Ibarra, I.; García, C.; Zarroca, M.; Rodríguez, R. An assessment of the influence of sulfidic mine wastes on rainwater quality in a semiarid climate (SE Spain). Atmos. Environ. 2015, 107, 85–94. [Google Scholar] [CrossRef]
- Swayze, G.A.; Smith, K.S.; Clarck, R.N.; Sutley, S.J.; Pearson, R.M.; Vance, J.S.; Hageman, P.K.; Briggs, P.H.; Meier, A.L.; Singleton, M.J.; et al. Using Imaging Spectroscopy to Map Acidic Mine Waste. Environ. Sci. Technol. 2000, 34, 47–54. [Google Scholar] [CrossRef]
- Ádám, J.; Bánvölgyi, G.; Dura, G.; Grenerczy, G.; Gubek, N.; Gutper, I.; Simon, G.; Szegfalvi, Z.; Székács, A.; Szépvölgyi, J.; et al. Causes and Lessons from the Red Mud Disaster, Greens/European Free Alliance Parliamentary Group in the European Parliament and LMP—Politics Can be Different; The Kolontár Report: Budapest, Hungary, 2011; pp. 1–156. [Google Scholar]
- EESI. Easy Guide to Mining Waste Characterisation, Online Resource. 2020. Available online: www.eesigroup.com/insights/easy-guide-to-mining-waste-characterisation/ (accessed on 8 February 2022).
- Kuhn, K.; Meima, J.A. Characterization and Economic Potential of Historic Tailings from Gravity Separation: Implications from a Mine Waste Dump (Pb-Ag) in the Harz Mountains Mining District, Germany. Minerals 2019, 9, 303. [Google Scholar] [CrossRef] [Green Version]
- Kasmaee, S.; Tinti, F.; Bruno, R. Characterization of metal grades in a stockpile of an iron mine (Case study—Choghart iron mine, Iran). Rud. Geol. Naft. Zb. 2018, 33, 51–59. [Google Scholar] [CrossRef] [Green Version]
- Mars, J.C.; Crowley, J.K. Mapping mine wastes and analyzing areas affected by selenium-rich water runoff in southeast Idaho using AVIRIS imagery and digital elevation data. Remote Sens. Environ. 2003, 84, 422–436. [Google Scholar] [CrossRef]
- Buzzi, J.; Riaza, A.; García-Meléndez, E.; Weide, S.; Bachmann, M. Mapping Changes in a Recovering Mine Site with Hyperspectral Airborne HyMap Imagery (Sotiel, SW Spain). Minerals 2014, 4, 313–329. [Google Scholar] [CrossRef] [Green Version]
- European Space Agency Website. Available online: https://www.esa.int/ESA (accessed on 10 August 2021).
- Van der Werff, H.; Van der Meer, F. Sentinel-2A MSI and Landsat 8 OLI Provide Data Continuity for Geological Remote Sensing. Remote Sens. 2016, 8, 883. [Google Scholar] [CrossRef] [Green Version]
- Kasmaeeyazdi, S.; Abdolmaleki, M.; Ibrahim, E.; Jiang, J.; Marzan, I.; Rodriguez, I.B. Copernicus data to boost raw material source management: Illustrations from the RawMatCop programme. Recourses Policy 2021, 74, 102384. [Google Scholar] [CrossRef]
- Matheron, G. The intrinsic random functions and their applications. Adv. Appl. Probab. 1973, 5, 439–468. [Google Scholar] [CrossRef] [Green Version]
- Bruno, R.; Kasmaeeyazdi, S.; Tinti, F.; Mandanici, E.; Balomenos, E. Spatial Component Analysis to Improve Mineral Estimation Using Sentinel-2 Band Ratio: Application to a Greek Bauxite Residue. Minerals 2021, 11, 549. [Google Scholar] [CrossRef]
- Kasmaeeyazdi, S.; Braga, R.; Tinti, F.; Mandanici, E. Mapping Bauxite Mining Residues Using Remote Sensing Techniques. Mater. Proc. 2021, 5, 91. [Google Scholar] [CrossRef]
- Wackernagel, H. Multivariate Geostatistics, 3rd ed.; Springer: Berlin/Heidelberg, Germany, 2003. [Google Scholar]
- Molli, G.; Brogi, A.; Caggianelli, A.; Capezzuoli, E.; Liotta, D.; Spina, A.; Zibra, I. Upper Carboniferous-Permian tectonics in Central Mediterranean: An updated revision. In Proceedings of the EGU General Assembly 2020, Online, 4–8 May 2020. EGU2020-2341. [Google Scholar] [CrossRef]
- Zaccarini, F.; Garuti, G. Mineralogy and composition of VMS deposits of northern Apennine ophiolites, Italy: Evidence for the influence of country rock type on ore composition. Min. Petr. 2008, 94, 61. [Google Scholar] [CrossRef]
- Maggi, R.; Pearce, M. Mid fourth-millennium copper mining in Liguria, north-west Italy: The earliest known copper mines in Western Europe. Antiquity 2015, 79, 303. [Google Scholar] [CrossRef]
- Garuti, G.; Bartoli, O.; Scacchetti, M.; Zaccarini, F. Geological setting and structural styles of Volcanic Massive Sulfide deposits in the northern Apennines (Italy): Evidence for seafloor and sub-seafloor hydrothermal activity in unconventional ophiolites of the Mesozoic Tethys. Bol. Soc. Geol. Mex. 2008, 60, 121–145. [Google Scholar] [CrossRef]
- Kiss, G.; Bendő, Z.; Garuti, G.; Zaccarini, F.; Király, E.; Molnár, F. Reconstruction of Hydrothermal Processes in the Cyprus Type Fe-Cu-Zn Deposits of the Italian Northern Apennines: Results of Combined Fluid Inclusion Microthermometry, SEM-CL Imaging and Trace Element Analyses by LA-ICP-MS. Minerals 2021, 11, 165. [Google Scholar] [CrossRef]
- Garuti, G.; Alfonso, P.; Zaccarini, F.; Proenza, J.A. Sulfur-isotope variations in sulphide minerals from massive sulphide deposits of the Northern Apennine ophiolites: Inorganic and biogenic constraints. Ofioliti 2009, 34, 43–62. [Google Scholar]
- Scicli, A. Attività Estrattive e Risorse Minerarie della Regione Emilia-Romagna; Pacini Editore: Modena, Italy, 1972; pp. 1–728. [Google Scholar]
- Bertolani, M. Ricerche sulle rocce prasinitiche e anfi bolitiche e sul giacimento metallifero di Vigonzano (Appennino piacentino). Atti Soc. Nat. Mat. Modena 1952, 89, 3–31. [Google Scholar]
- Dinelli, E.; Tateo, F. Sheet silicates as effective carriers of heavy metals in the ophiolitic mine area of Vigonzano (northern Italy). Min. Mag. 2001, 65, 121–132. [Google Scholar] [CrossRef]
- Franzini, M.; Leoni, L. A full matrix correction in X-ray fluorescence analysis. Atti Soc. Toscana Sci. Nat. Mem. A 1972, 79, 7–22. [Google Scholar]
- Franzini, M.; Leoni, L.; Saitta, M. Enhancement effects in X-ray fluorescence analysis of rocks. X-ray Spectrom. 1976, 5, 208–211. [Google Scholar] [CrossRef]
- Leoni, L.; Menichini, M.; Saitta, M. Determination of S, Cl and F in silicate rocks by X-ray fluorescence analyses. X-Ray Spectrom. 1982, 11, 156–158. [Google Scholar] [CrossRef]
- Dinelli, E.; Cortecci, G.; Lucchini, F. Geochemical characterization of sulphide waste rock piles from mining workings in northern Apennines, Emilia province, Italy. Mineral. Petrogr. Acta 1996, 39, 109–123. [Google Scholar]
- Yamaguchi, Y.; Fujisada, H.; Tsu, H.; Sato IWatanabe, H.; Kato, M.; Kudoh, M.; Kahle, A.B.; Pniel, M. ASTER early image evaluation. Adv. Space Res. 2001, 28, 69–76. [Google Scholar] [CrossRef]
- SENTINEL-2, ESA’s Optical High-Resolution Mission for GMES Operational Services (ESA), SP-1322/2 (March 2012). Available online: https://www.esa.int/About_Us/ESA_Publications/ESA_SP-1322_2_Sentinel_2/ (accessed on 15 October 2021).
- Van der Werff, H.; Van der Meer, F. Sentinel-2 for Mapping Iron Absorption Feature Parameters. Remote Sens. 2015, 7, 12635–12653. [Google Scholar] [CrossRef] [Green Version]
- DeLong, C.; Skousen, J.; Pena-Yewtukhiw, E. Bulk Density of Rocky Mine Soils in Forestry Reclamation. Soil Sci. Soc. Am. J. 2012, 76, 1810–1815. [Google Scholar] [CrossRef] [Green Version]
- Dilles, J.H.; John, D.A. Porphyry and Epithermal Mineral Deposits. In Encyclopedia of Geology, 2nd ed.; Alderton, D., Scott, A.E., Eds.; Academic Press: Cambridge, MA, USA, 2021; pp. 847–866. ISBN 9780081029091. [Google Scholar] [CrossRef]
- Petavratzi, E.; Gunn, G.; Kresse, C. Commodity review: Cobalt. Br. Geol. Surv. 2019. [Google Scholar]
- I Siti Minerari Italiani (1870–2006). 2006. Available online: https://www.isprambiente.gov.it/files/miniere/i-siti-minerari-italiani-1870-2006.pdf (accessed on 8 February 2022).
| Publisher’s Note: MDPI stays neutral with regard to jurisdictional claims in published maps and institutional affiliations. |
© 2022 by the authors. Licensee MDPI, Basel, Switzerland. This article is an open access article distributed under the terms and conditions of the Creative Commons Attribution (CC BY) license (https://creativecommons.org/licenses/by/4.0/).


