Article

Nitrate and Dissolved Organic Carbon Release in Sandy Soils at Different Liquid/Solid Ratios Amended with Graphene and Classical Soil Improvers

by
Luigi Alessandrino
1,
Nicolò Colombani
2,*,
Vassilis George Aschonitis
3 and
Micòl Mastrocicco
1
1
DiSTABiF—Department of Environmental, Biological and Pharmaceutical Sciences and Technologies, Campania University “Luigi Vanvitelli”, Via Vivaldi 43, 81100 Caserta, Italy
2
SIMAU—Department of Materials, Environmental Sciences and Urban Planning, Marche Polytechnic University, Via Brecce Bianche 12, 60131 Ancona, Italy
3
Institute of Soil and Water Resources, Hellenic Agricultural Organization “Demeter”, Thermi, 57001 Thessaloniki, Greece
*
Author to whom correspondence should be addressed.
Appl. Sci. 2022, 12(12), 6220; https://doi.org/10.3390/app12126220
Submission received: 29 May 2022 / Revised: 16 June 2022 / Accepted: 17 June 2022 / Published: 18 June 2022

Abstract

:
This study emphasizes the importance of employing parallel batch tests with different liquid/solid (L/S) ratios to assess their dissolution mechanisms. Changes in physicochemical parameters (electrical conductivity, pH, and oxidation-reduction potential), as well as the sorption/desorption of dissolved organic carbon (DOC) and nitrate (NO3) due to graphene addition in a calcareous sandy soil (CS) and in a siliciclastic riverine sandy soil (SS) were assessed via batch experiments at different L/S ratios. Graphene’s production is growing at a great pace, so it’s important to test methods to reuse graphene wastes. The results of soil batch experiments mixed with graphene were compared with classical soil improvers (compost, biochar, and zeolites). The batches were performed using the saturation soil extraction method with deionized water as a proxy of rainwater. The contact time was 48 h. At the end of the experiment, water samples were collected to be analyzed for NO3, DOC, DIC, Ca, and Mg. Graphene did not alter the physiochemical parameters of both soils. Moreover, its addition did not trigger any NO3 increase respect to control and to other improvers. Biochar increased EC and pH beyond recommended limits for most crops’ growth in both soils. As expected, compost addition produced the highest NO3 release.

1. Introduction

Graphene is an engineered carbonaceous material (ECM) with many promising characteristics, such as good electrical and thermal conductivity, resistance, elasticity, and good adsorption capacity [1,2,3]. As a result of this, it is used in countless fields of application such as medicine [4,5], electrical and chemical engineering [6,7], and in some eco-friendly application (e.g., as nematicide) [8]. In recent years its production grew enormously, so production scraps and graphene-based wastes have increased too [9,10].
For this reason, it is important to test methods to reuse graphene wastes, with the aim to include graphene into the circular economy loop [11]. In this light, graphene was recently tested as a soil improver to increase water retention and to reduce nutrient leaching due to its high specific surface area, low bulk density, low release of nitrogen (N) compounds, and nil release of heavy metals [12].
Nitrate (NO3) is one of the most common inorganic groundwater contaminants due to fertilization practices that increase crop production worldwide [13]. So, it is important to test if ECM, such as graphene, could release or adsorb NO3 since the overapplication of N compounds can trigger the degradation of groundwater quality, which is strictly connected with the increase of human health risk [14].
Laboratory leaching experiments, such as batch tests, are indispensable tools to understand the potential release of contaminants on the soil-groundwater pathway [15]. Schuwirth and Hofmann [16] summarized the four most common leaching batch experiments: German DEV S4 test, saturation soil extraction (SSE), ammonia nitrate extraction (ANE), and pH static test. They concluded that for a study focused on groundwater impact assessment, the best test is the SSE since the use of deionized water and the absence of constant agitation makes it closer to the real conditions of the soil-groundwater system.
The crucial point of a batch experiment is the choice of the liquid/solid (L/S) ratio. There is currently no standardization of the L/S ratio for batch leaching experiments in groundwater risk assessment. In most literature studies the L/S ratio values vary between 2 and 10 [17,18,19]. Parallel batch tests can be used to determine a potential contaminant release in a soil-water system [20]. The release of chemical species, indeed, can be closely linked to the L/S ratio that can influence the solubility of a chemical species and its ability to pass in the liquid phase [21]. Therefore, it is important to perform multiple batch extraction tests on new materials that will be applied to the soil to estimate the total amount of contaminant that can be extracted from a given material [22]. It is essential to perform series of batches with different L/S since the different batch set-up could change the results and their interpretation. Indeed, multiple batches with different L/S ratios can provide useful information on the behavior of some materials under different moisture conditions, as usually happen in the field. For example, it is possible to gain insights about the conditions of maximum and minimum release of nutrients and/or contaminants. This is very important in studies focused on the release of nutrients in agricultural landscapes or in risk assessment studies tackling the potential release of contaminants.
In this study, multiple leaching batch tests with different L/S ratios were carried out to assess the potential release of NO3 from graphene’s application in two different soils: a calcareous sandy soil (CS) and a siliciclastic riverine sandy soil (SS). The results of graphene batch tests were compared with the ones on classical improvers (compost, biochar, and zeolites). The aim of the study was twofold: (i) to evaluate the leaching of NO3 in two different sandy soils after the application of compost, zeolites, biochar, and graphene in controlled laboratory conditions; and (ii) to replicate the same experiment at different L/S ratios to assess NO3 release from each improver as a function of the L/S ratio. It is important to note that this study carries out an innovative procedure for batch experiments. Most of the literature studies such experiments have been conducted using only one L/S. Instead, performing batch experiments with different L/S ratios fosters a better understanding of the interaction among solid and liquid phases [20].

2. Materials and Methods

2.1. Soils and Improvers Characteristics

The CS soil had a grain size distribution from medium to coarse and a high carbonates content while the SS soil had a grain size from medium to fine and a low carbonates content (Table 1). The grain size distribution was determined via wet and dry sieving and the carbonate content was determined via Chittick gasometric apparatus. Soils were not sterilized to minimize the alteration of their characteristics.
The soil improvers, Biochar, Compost, Zeolites, and Graphene, were purchased from commercial manufacturers and their composition, as described in their technical sheet, is reported in Table 2.

2.2. Batch Experiments

Batch leaching experiments were carried out doing parallel batch tests with different L/S ratios, as proposed by Sakankura et al. [20], to better understand the desorption dynamics of the soil-water system. Batch tests were performed using the SSE method described by Schuwirth and Hofmann [16], with the use of deionized water as a rainwater proxy (EC 15 ± 2 μS/cm, pH 6.84 ± 0.01, ORP 154 ± 11 mV). The contact time was set to 48 h. Each batch was replicated with four different L/S ratios (1, 2, 5, and 10) and for each configuration three replicas were made. Each experiment was performed in HDPE containers with rectangular base (3.9 × 4.5 cm) and height of 8.5 cm, closed by a double stopper to isolate the content. Batches were stored under temperature-controlled condition (25 ± 0.5 °C) in the dark to avoid algal proliferation. After preparation, the batches were shaken, mixed, and left stand unstirred, since a strong artificial shaking might cause the change of leaching behavior due to the abrasion of particles, the destruction of aggregates, and the mobilization of colloids [23].
Batches were monitored with a HANNA Instruments multiparametric probe (HI98194) to record pH, electrical conductivity (EC), and oxidation-reduction potential (ORP) after 1, 12, 24, and 48 h. At the end of the experiment, water samples were collected and filtered with a 0.45 µm polypropylene filter to analyze dissolved organic carbon (DOC) and NO3 via a Pharmacia Biotech Ultrospec 2000 UV/VIS spectrophotometer following the procedure of Cook et al. [24]. Ca and Mg were analyzed with an ICP-OES (PerkinElmer, Waltham, USA) after acidification of the samples with ultrapure 1 M nitric acid and filtering on 0.45 μm. Dissolved inorganic carbon (DIC) was determined by back-titration method using pH 3.5 as end point [25].
One-way analysis of variance (ANOVA), computed with STATGRAPHICS v.18, was applied to calculate significant differences between treatments and between L/S ratios for the same treatment.

2.3. Graphene’s NO3 Sorption Isotherm

The graphene’s NO3 sorption isotherm experiments were performed by batch adsorption experiments and were carried out by mixing 0.5 g of graphene and 100 mL of water at four different NO3 concentrations: 1 mg/L, 10 mg/L, 50 mg/L, and 100 mg/L. A NO3 ion stock solution (100 mg/L) was prepared, and the other solutions were obtained by subsequent dilution of the stock solution. The mixture was agitated in a thermostatic shaker at a speed of 250 rpm at 25 °C. The adsorption experiment was conducted for the optimization of experimental conditions such as contact time, initial NO3 concentration, and adsorbent dose. All experiments were carried out at room temperature (25 °C). NO3 concentrations at the end of each test were analyzed with a Pharmacia Biotech Ultrospec 2000 UV/VIS spectrophotometer following the procedure of Cook et al. [24].

3. Results and Discussions

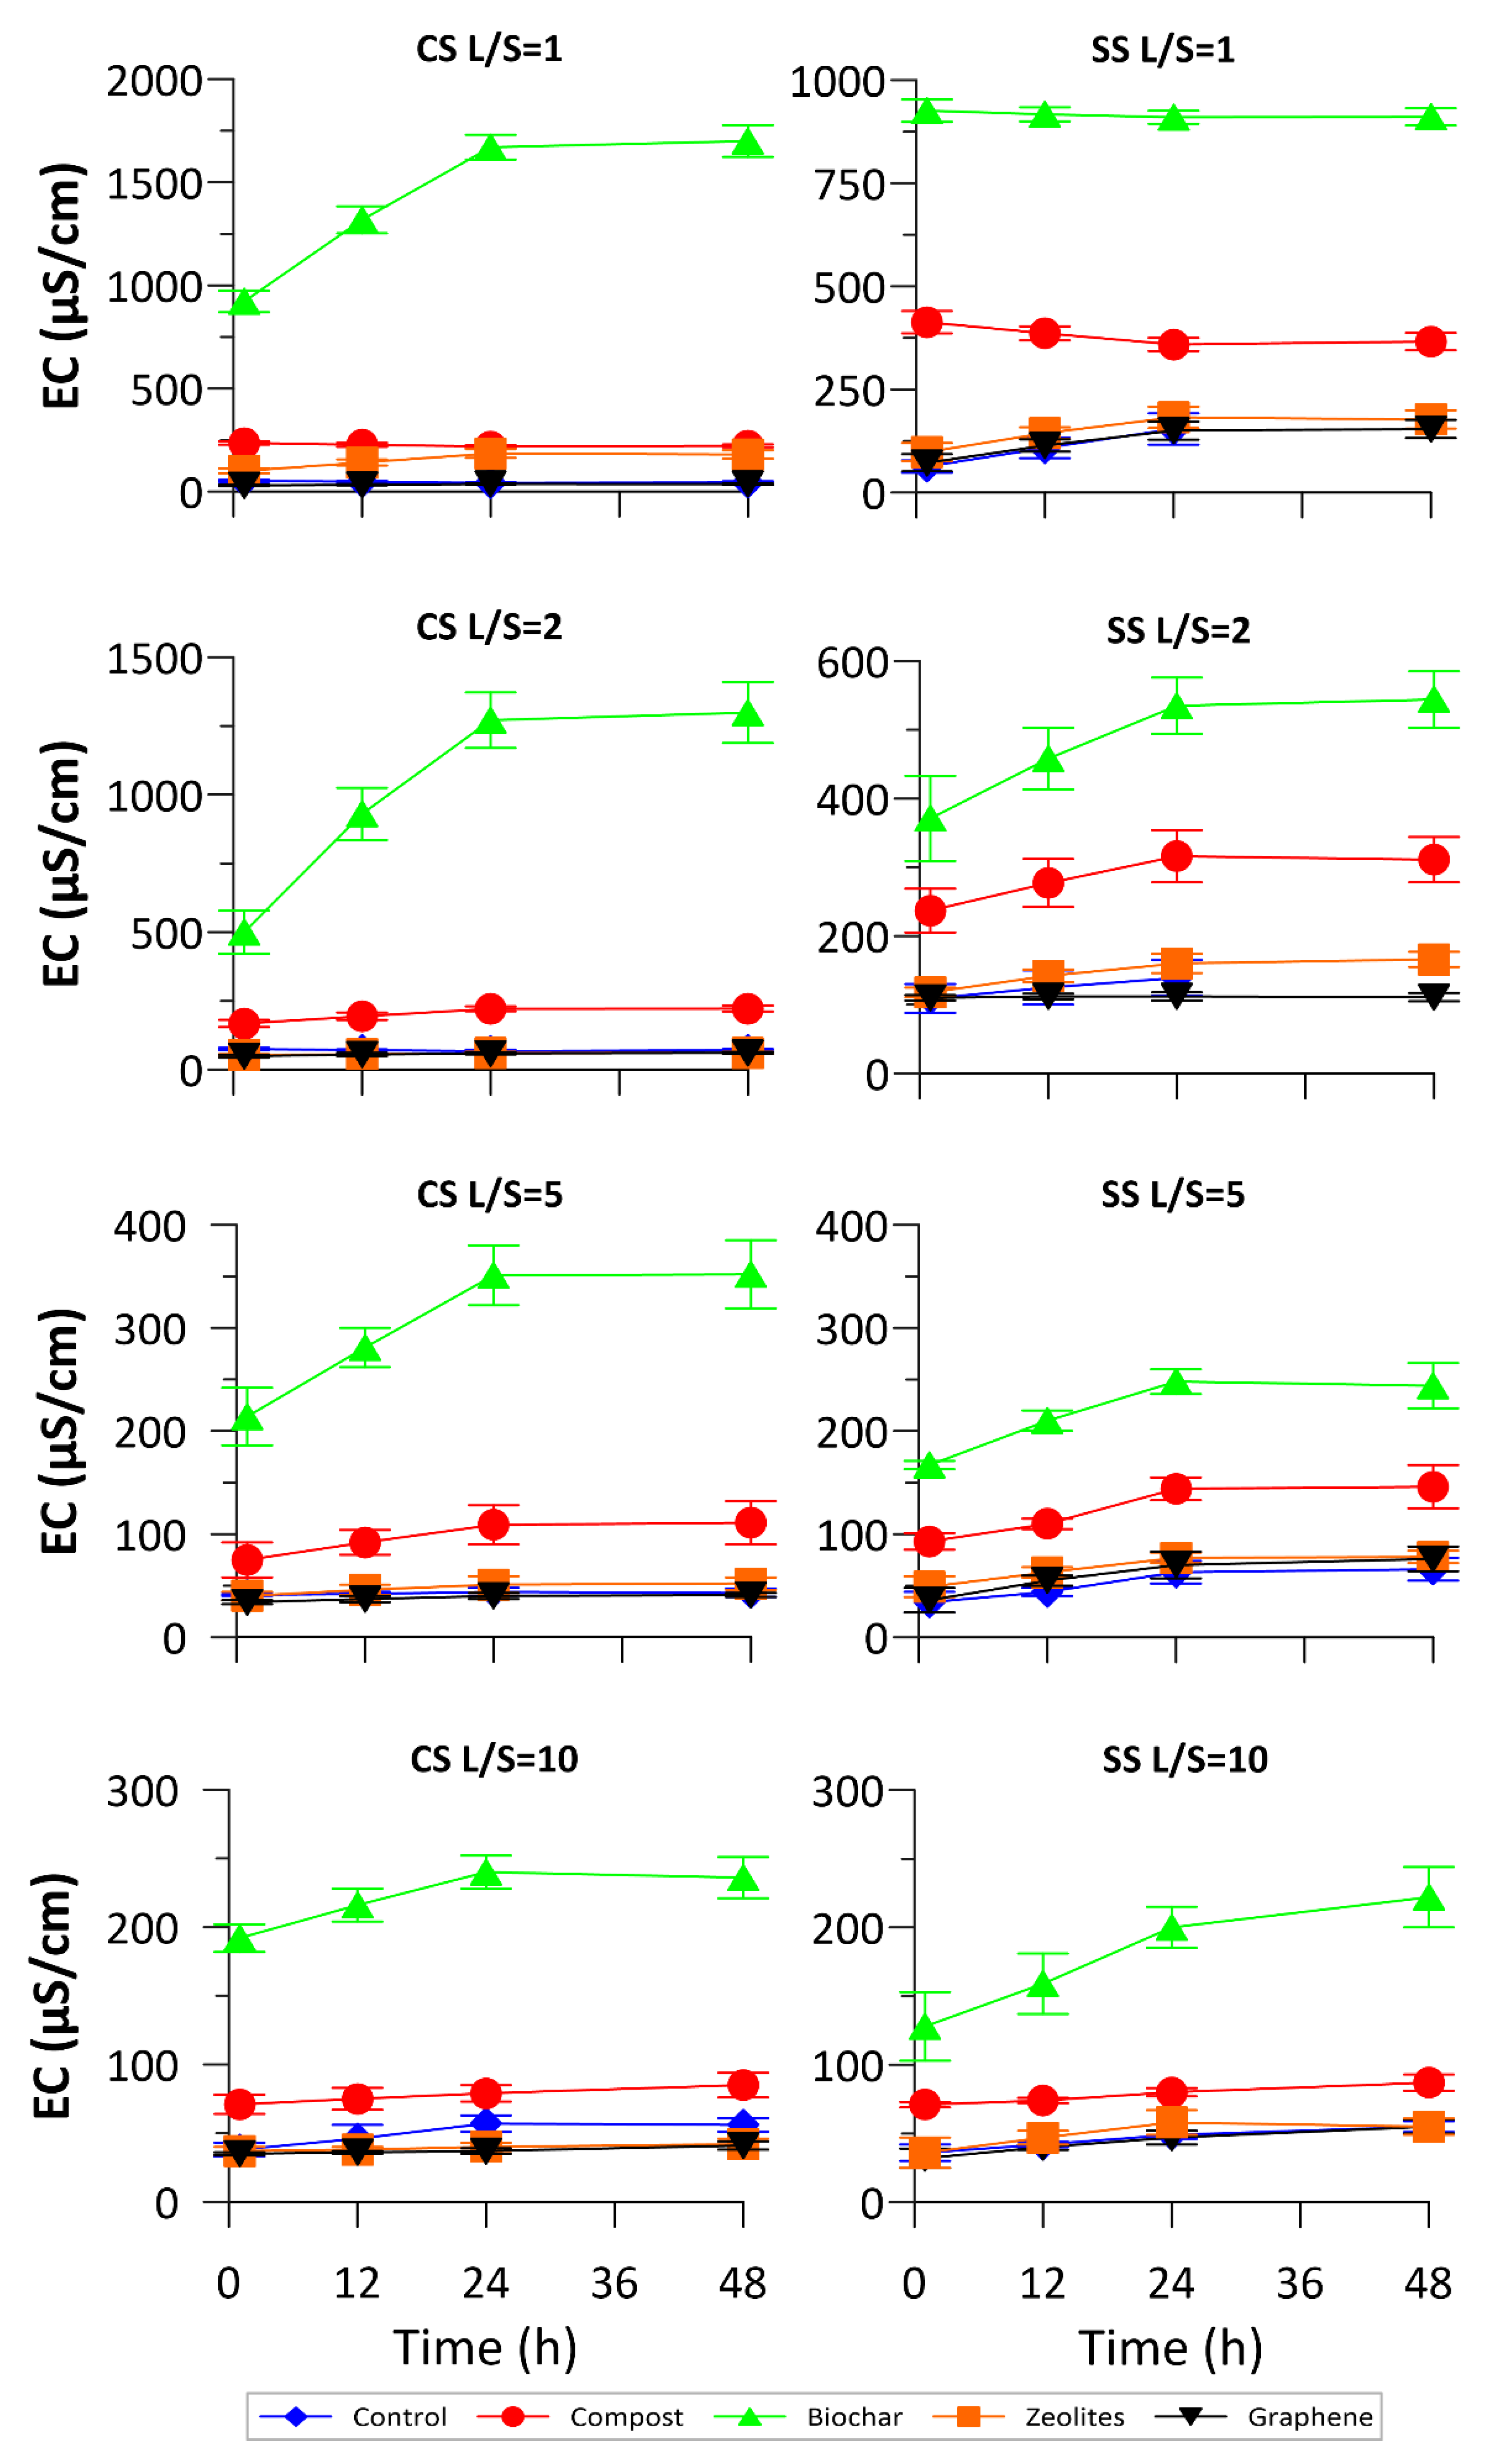
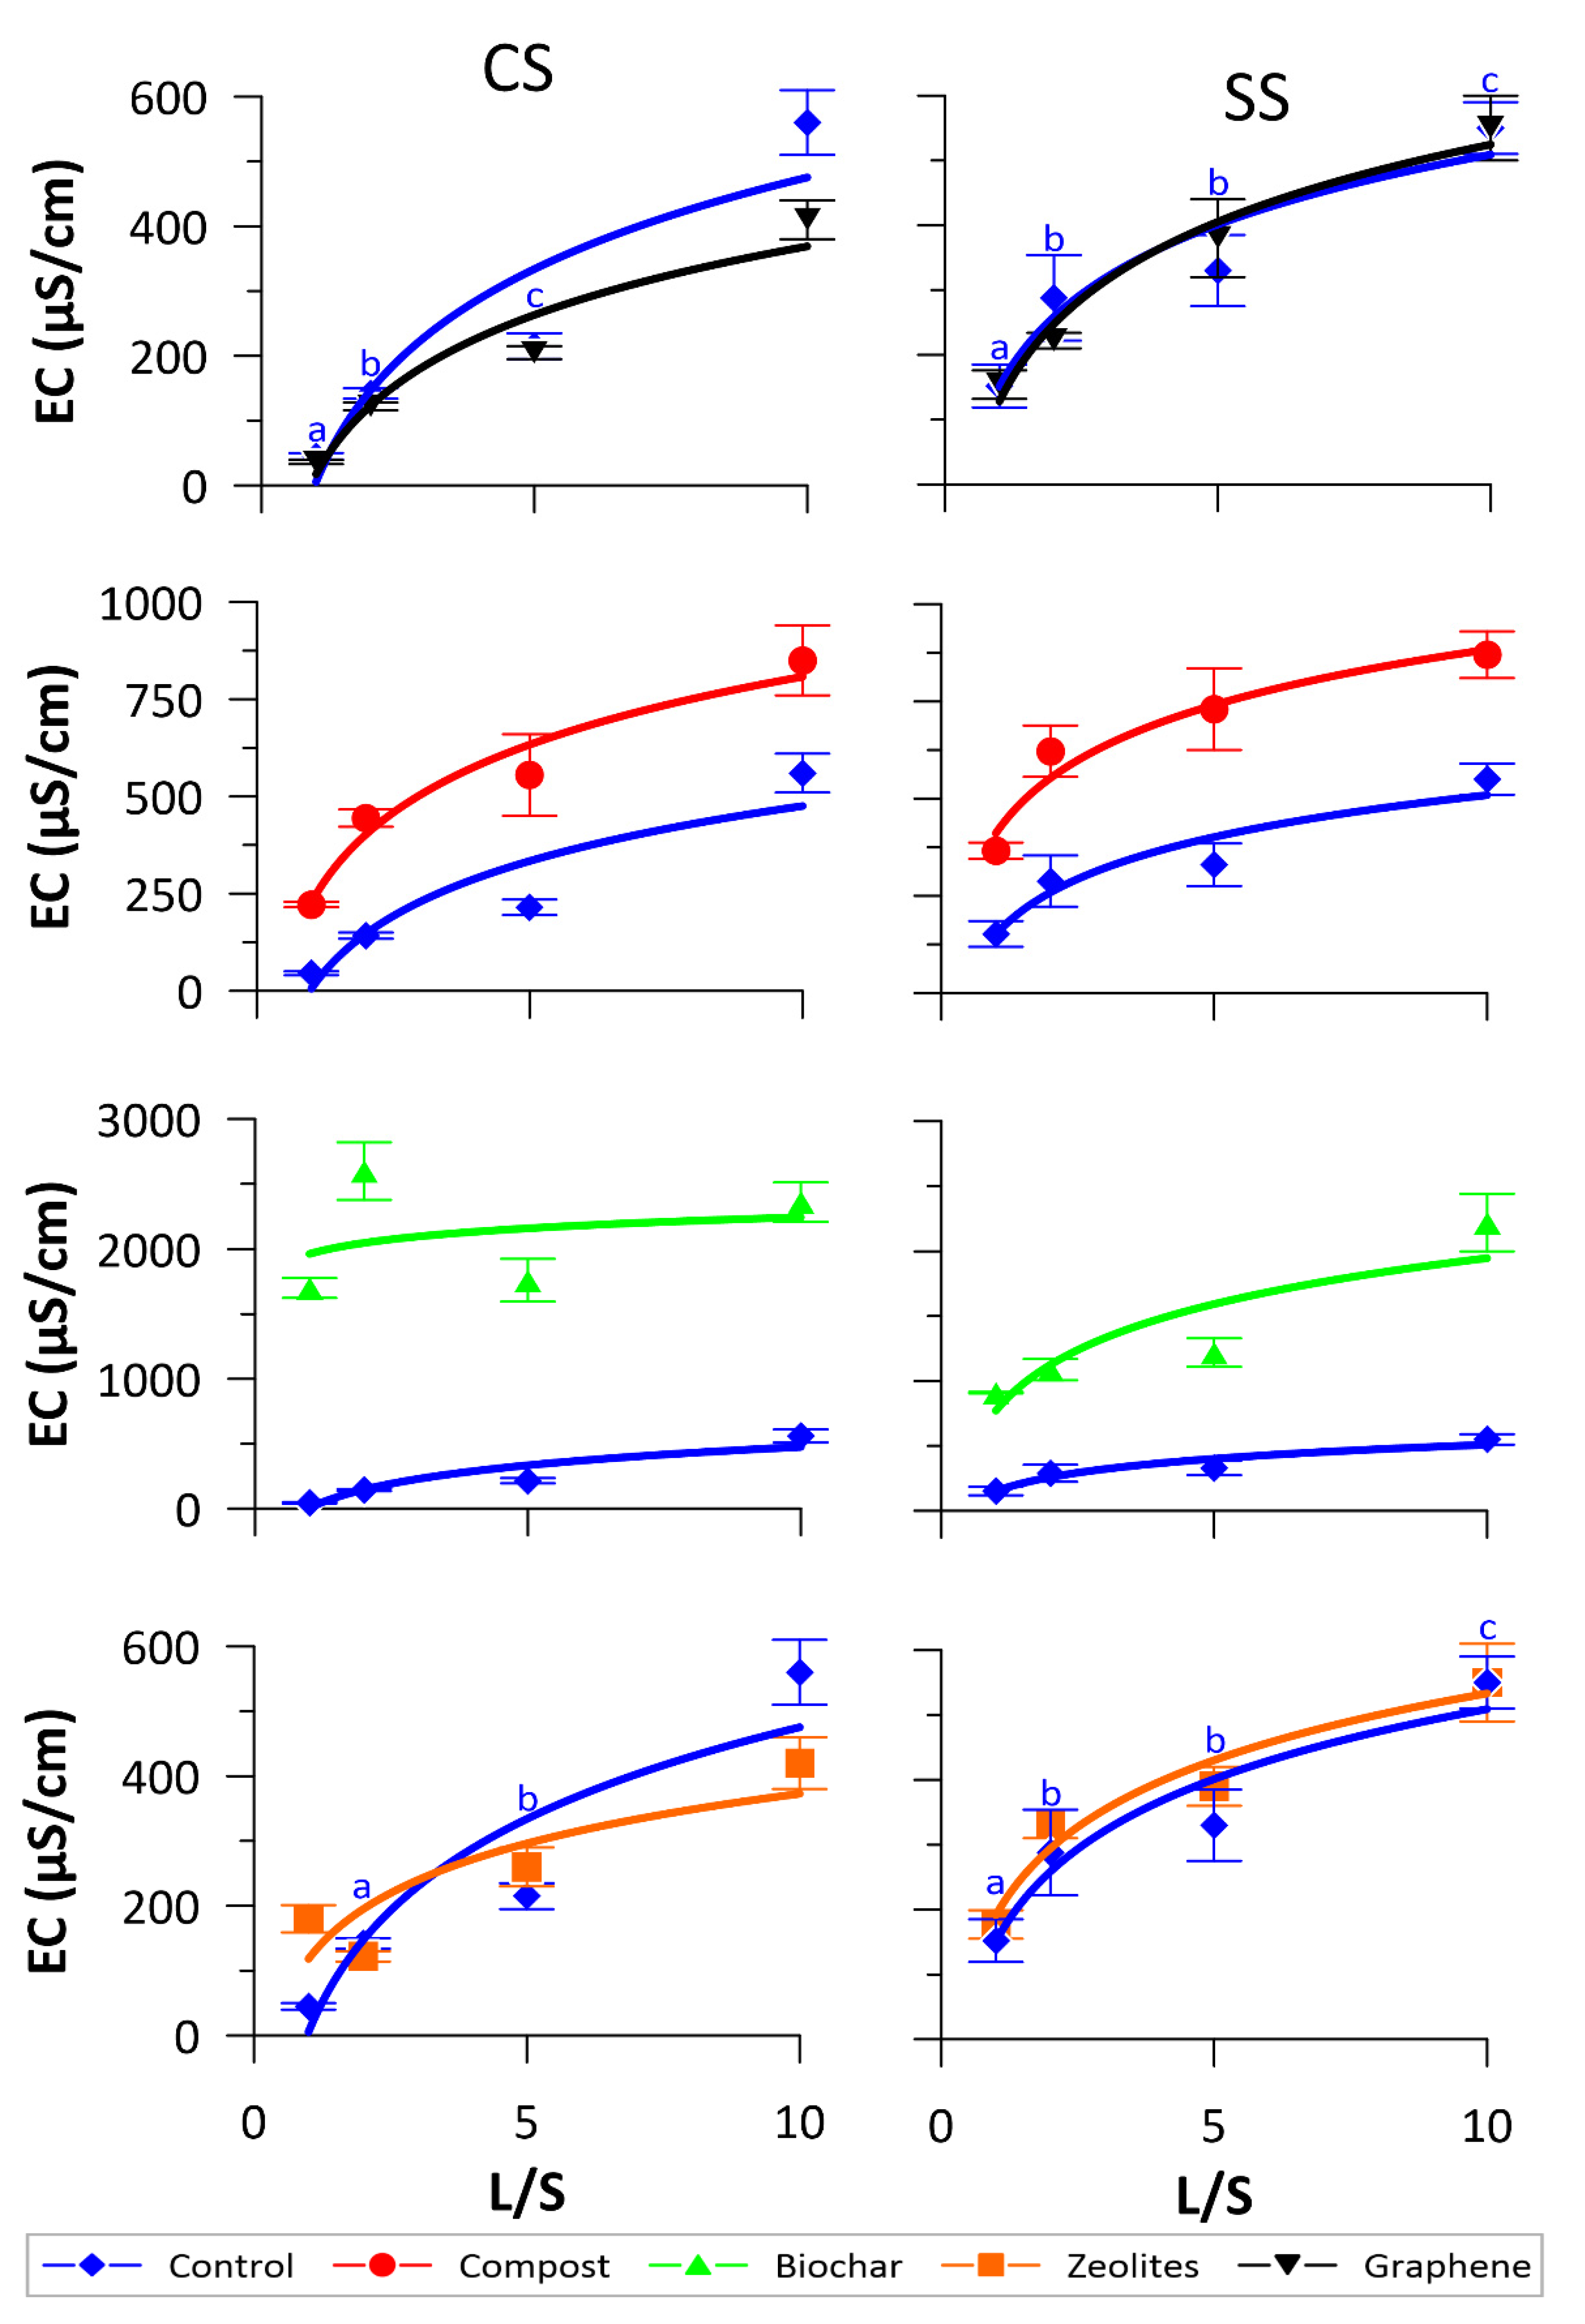
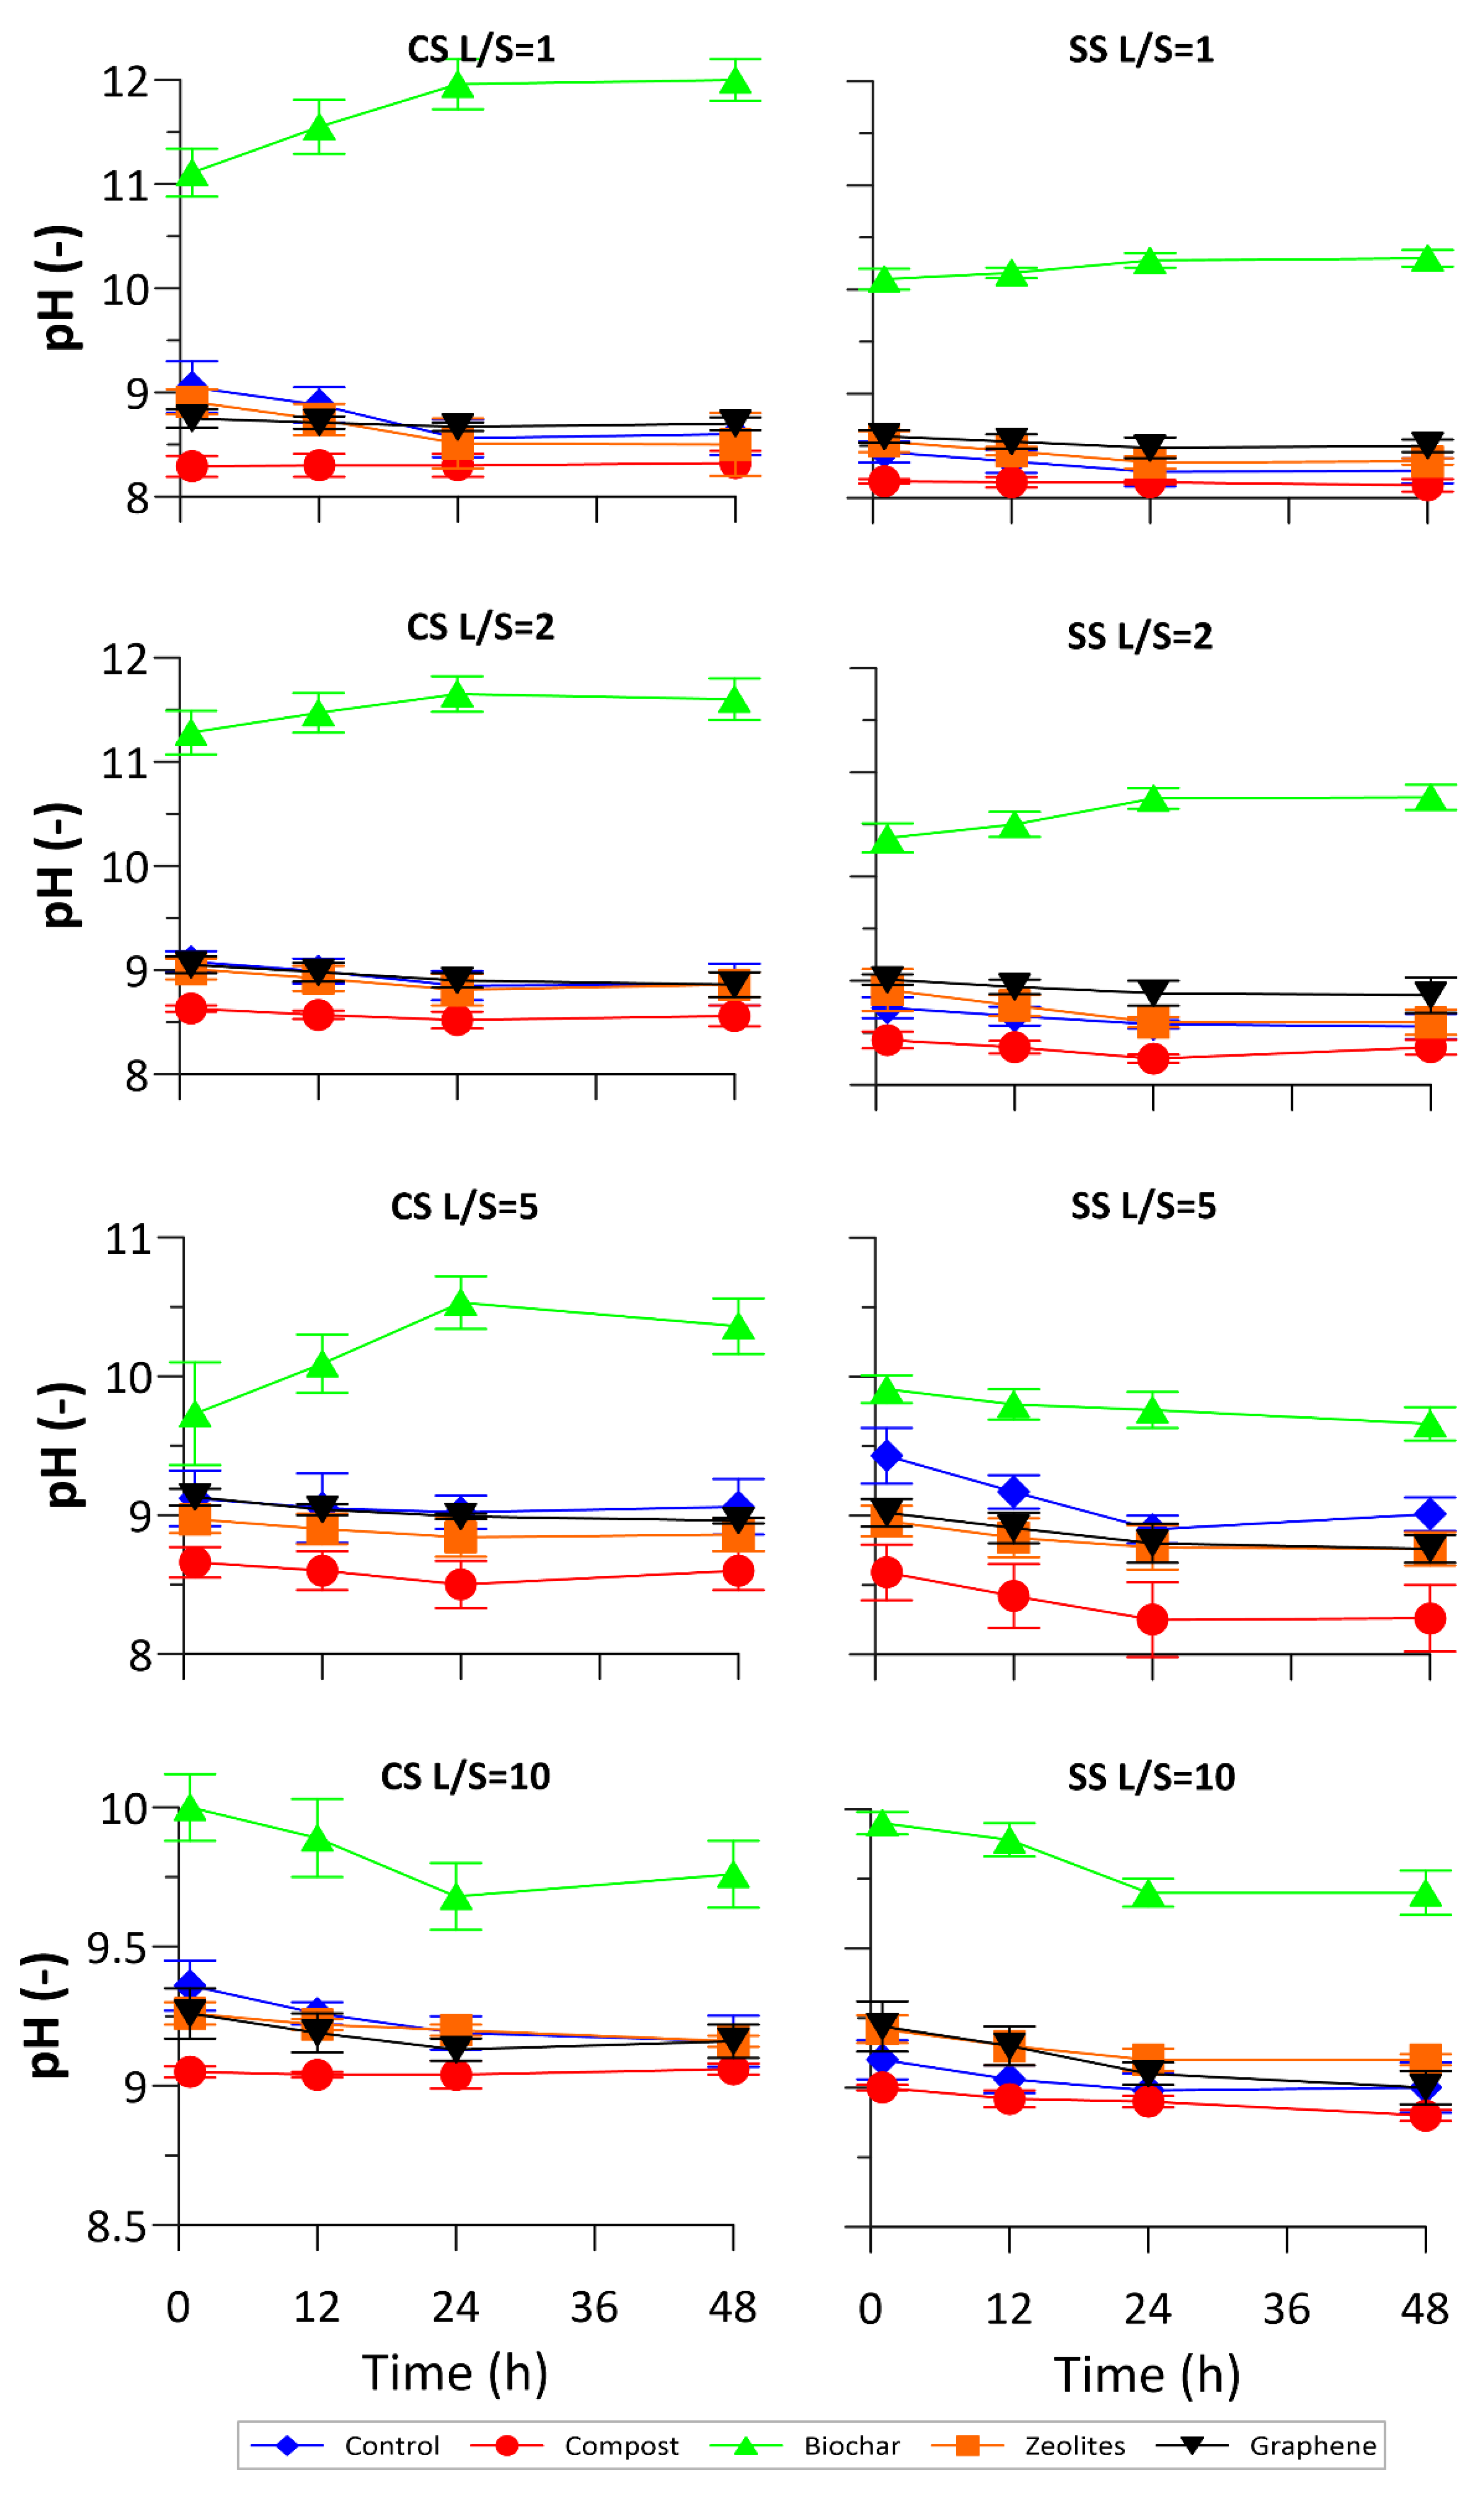
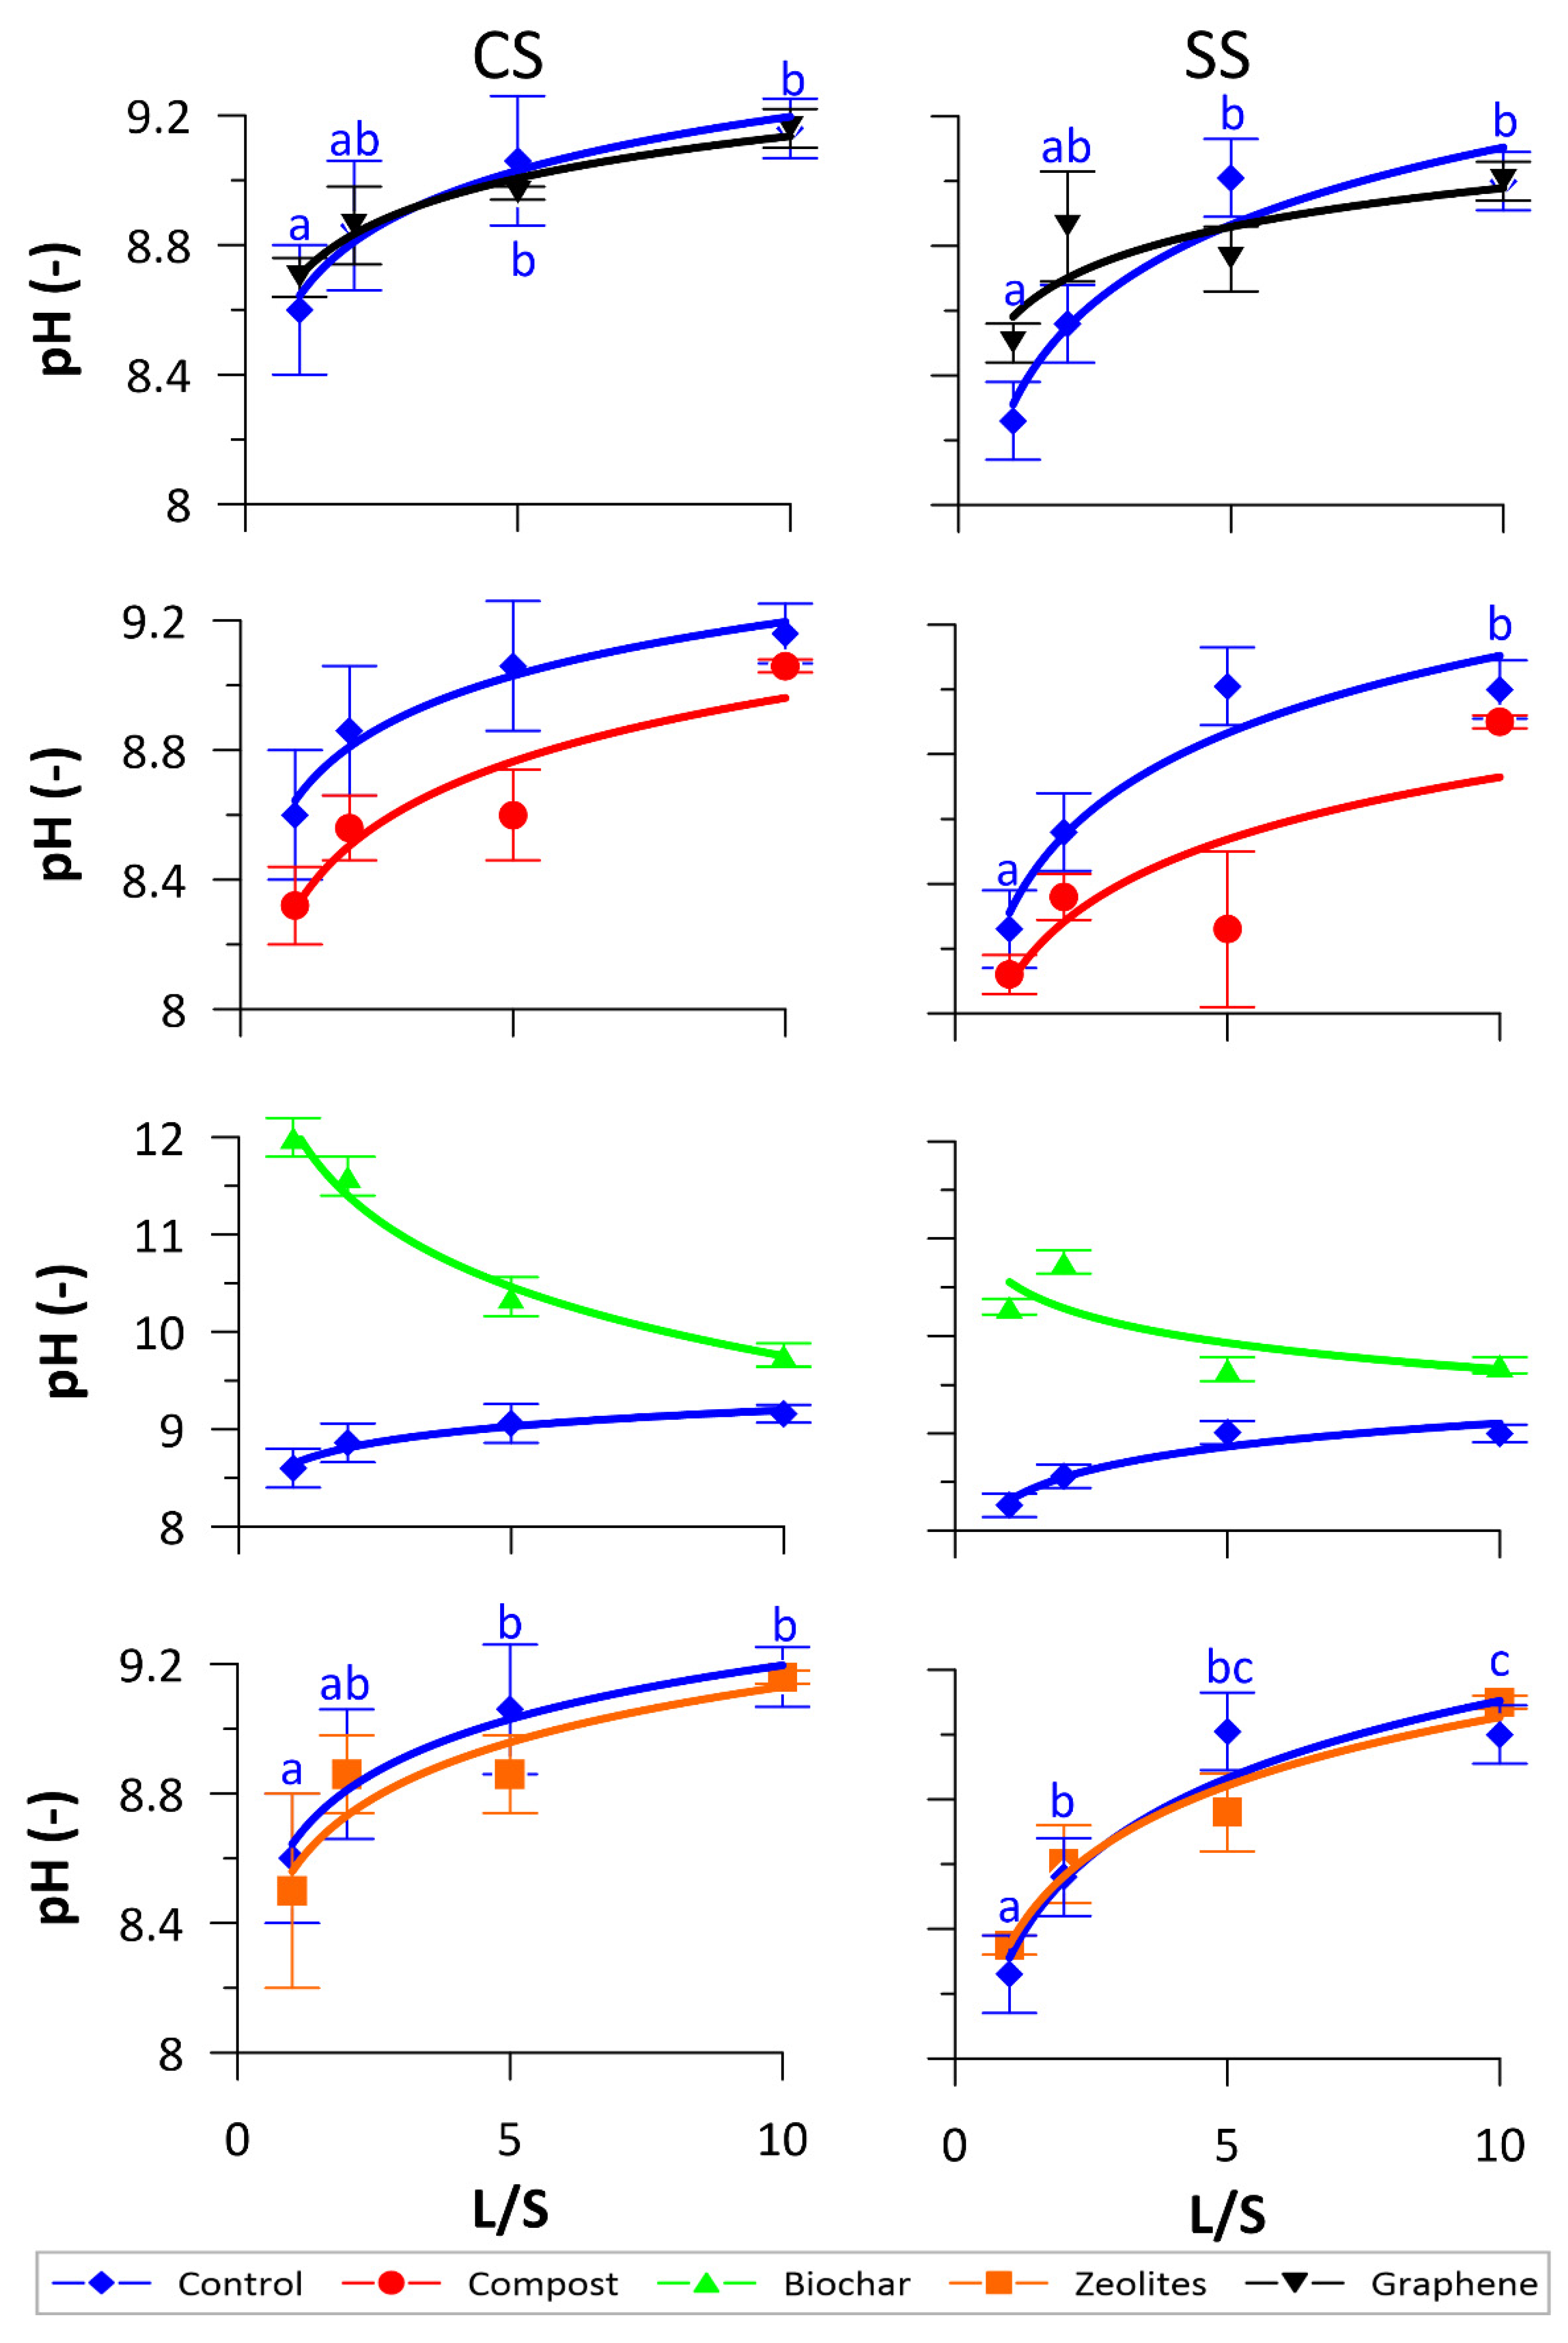
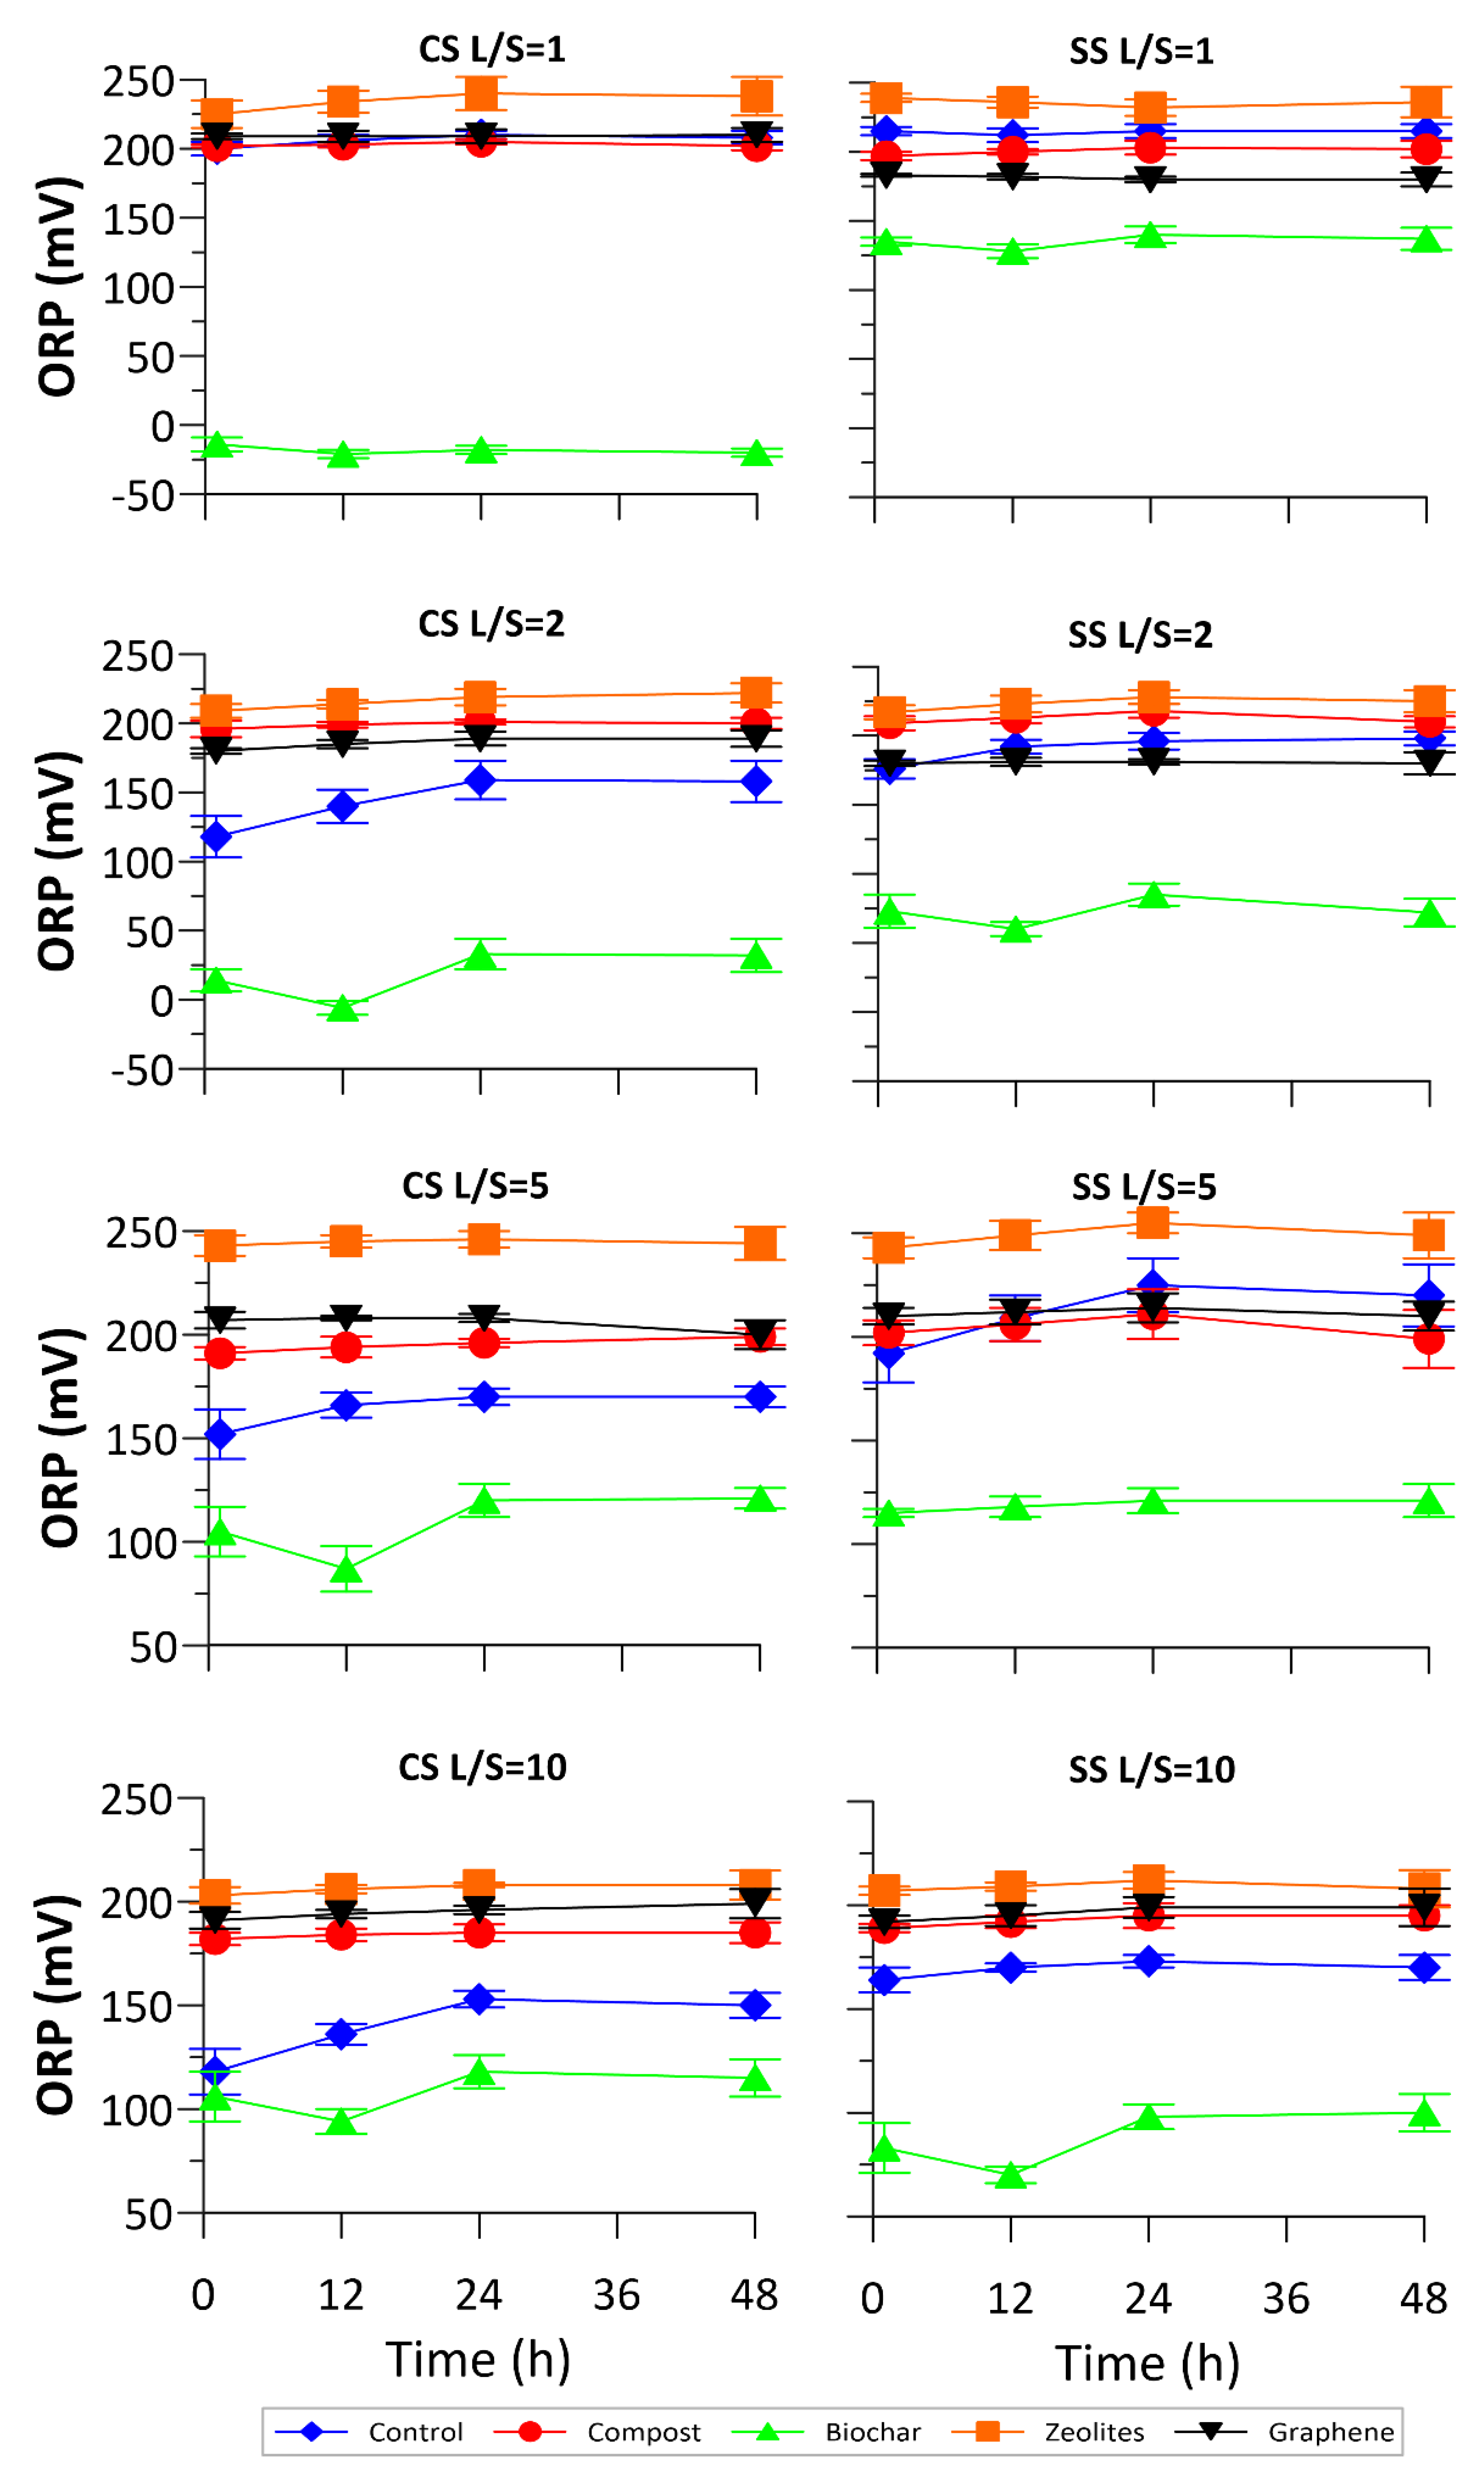
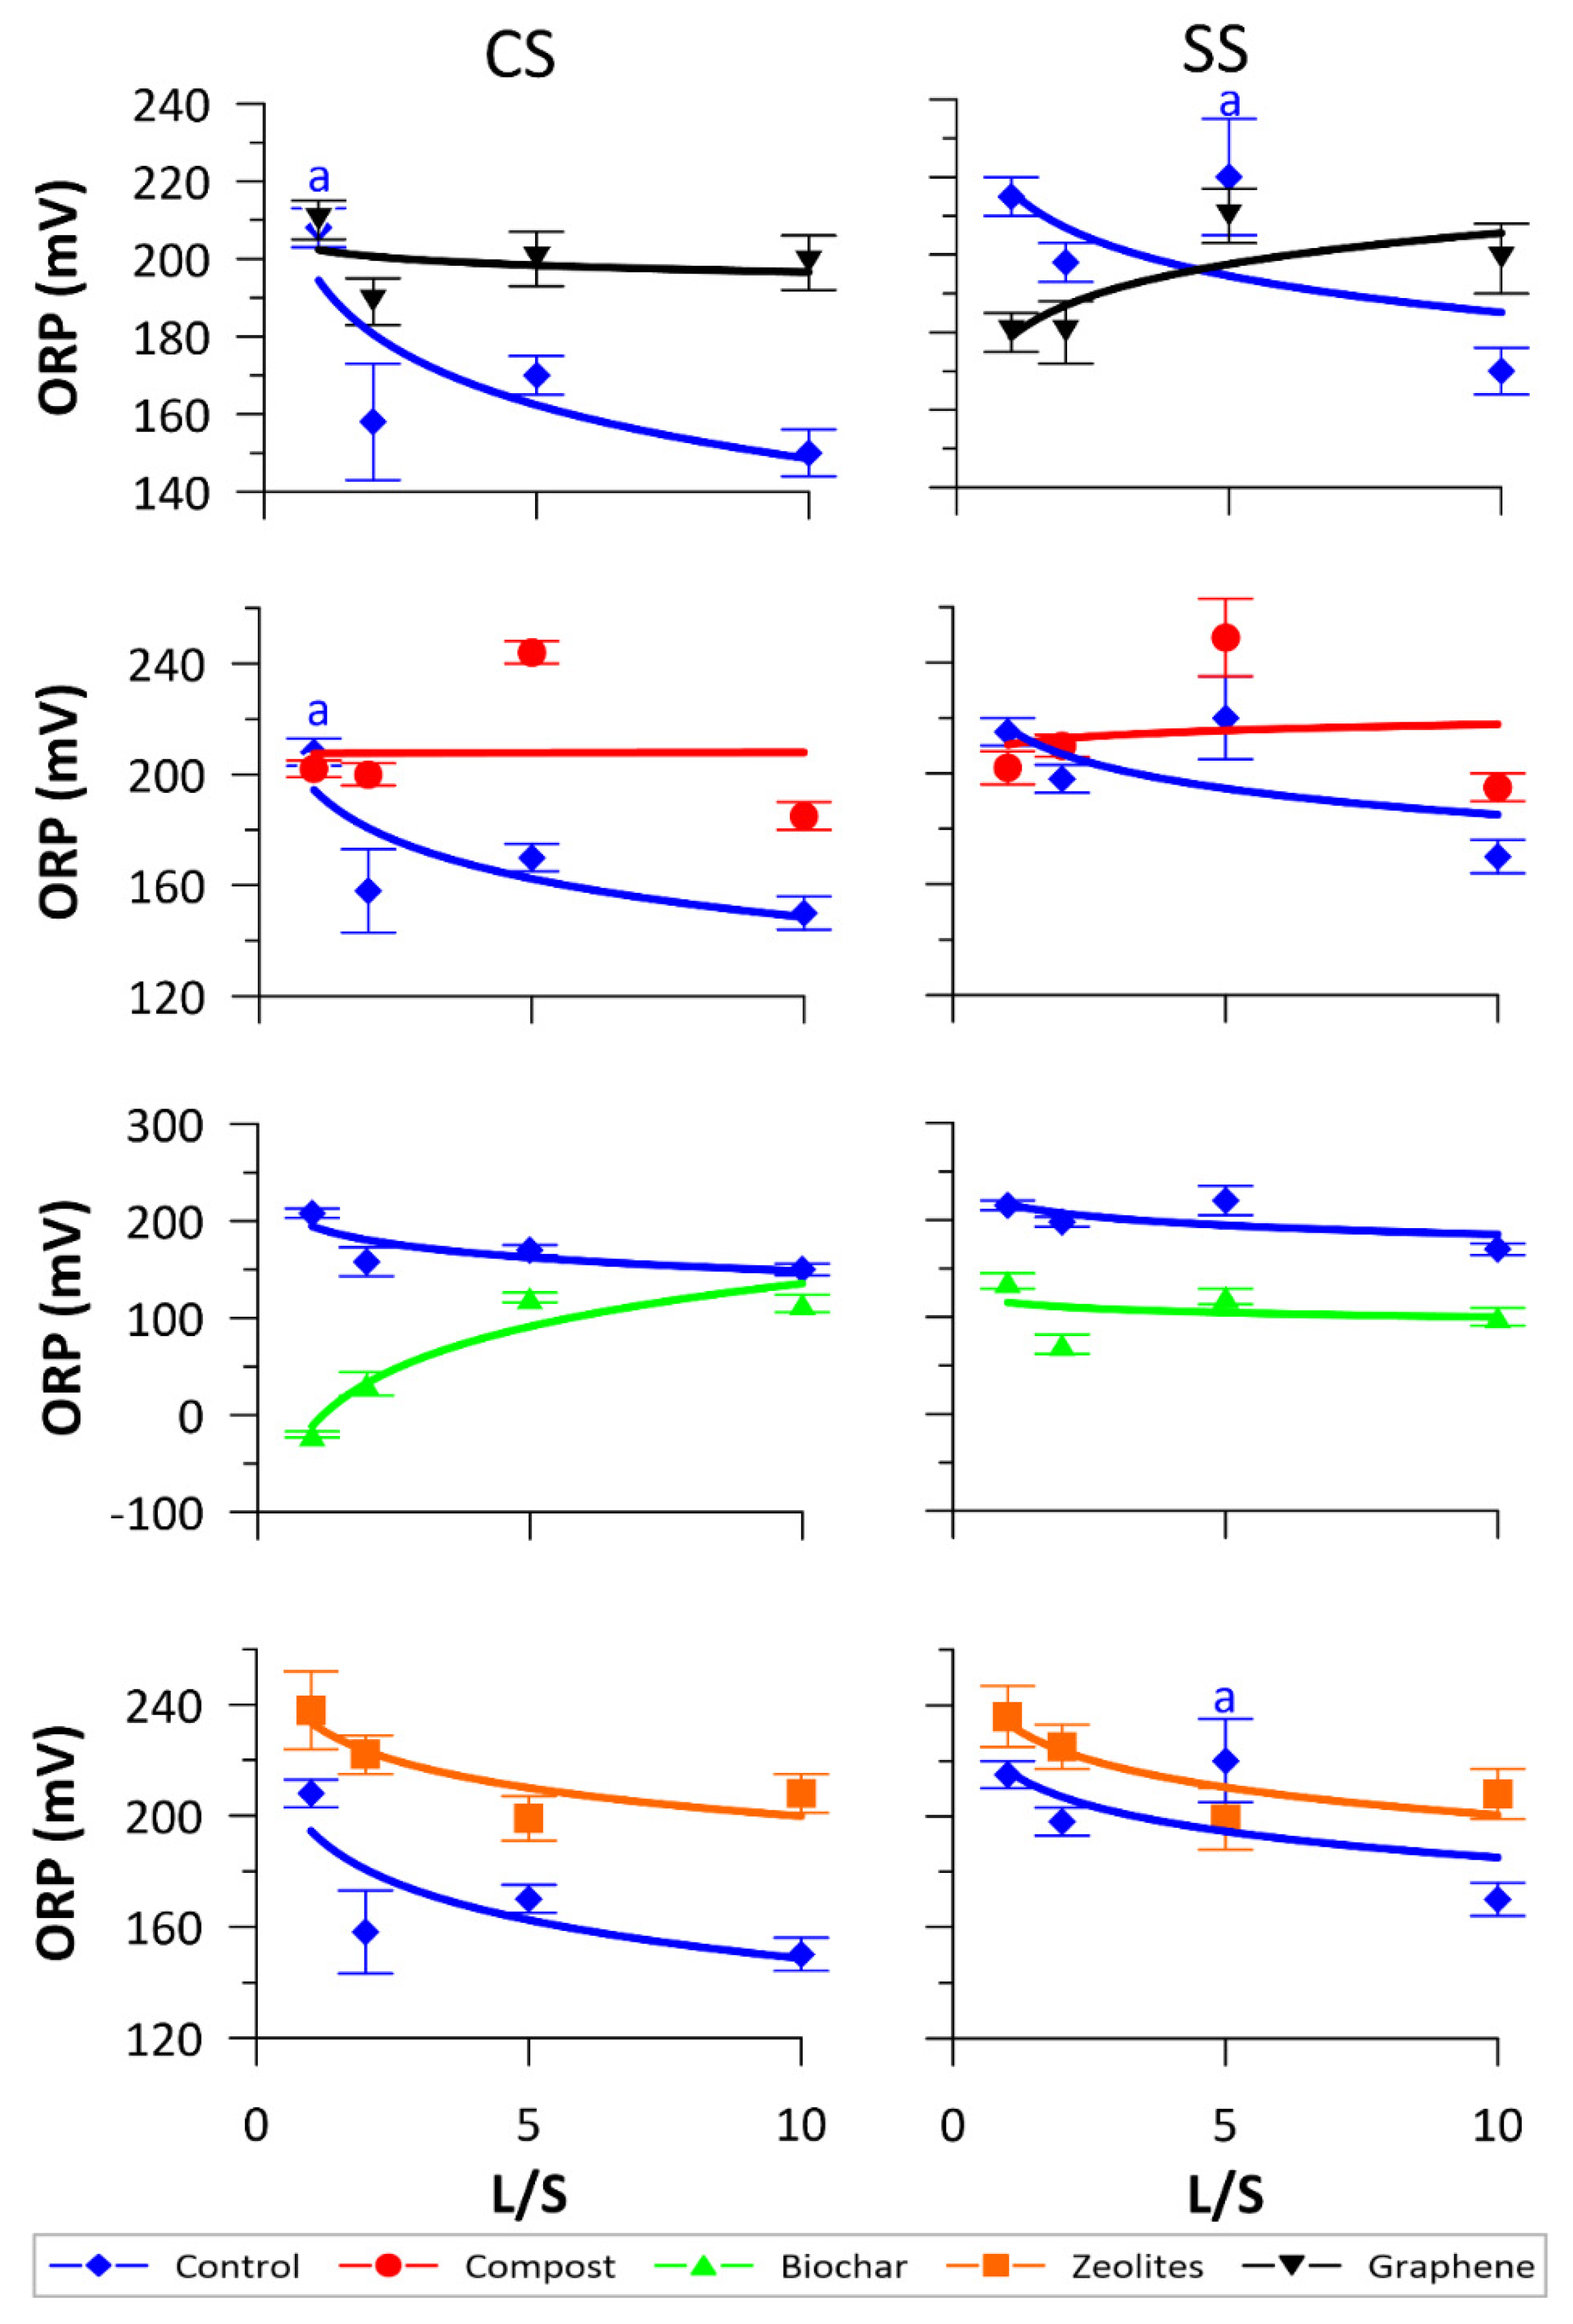
3.1. Physical-Chemical Monitoring
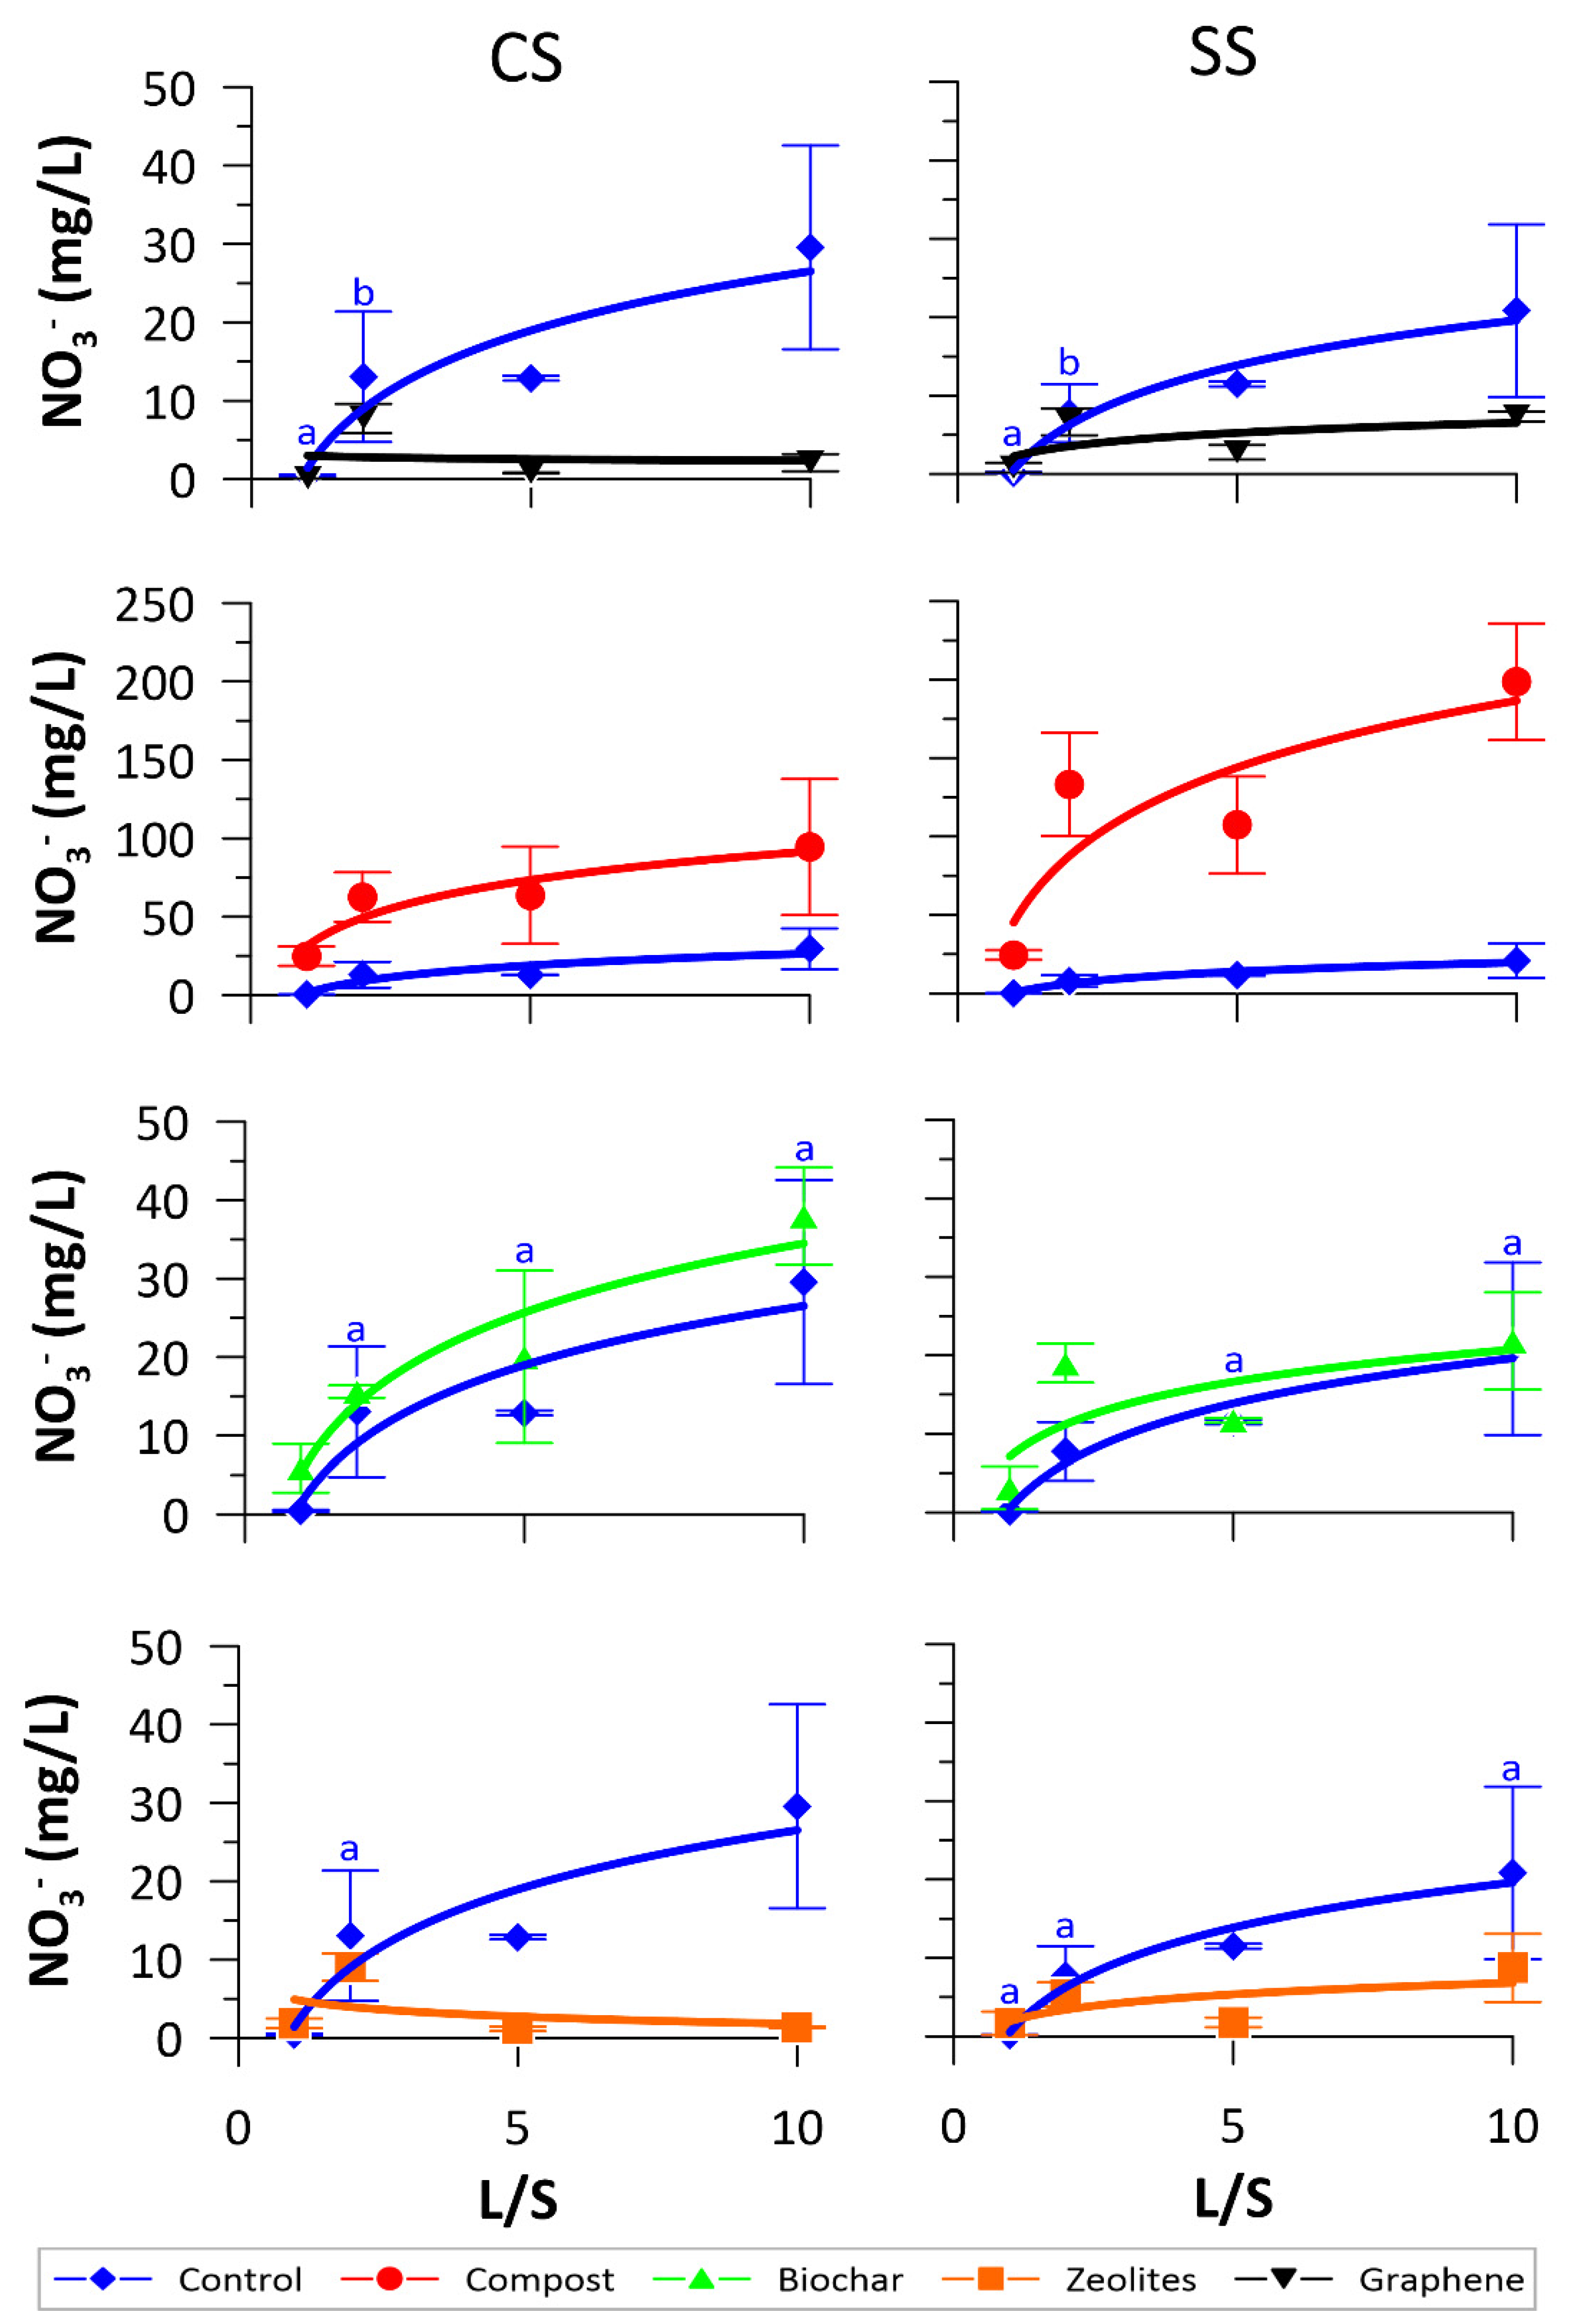
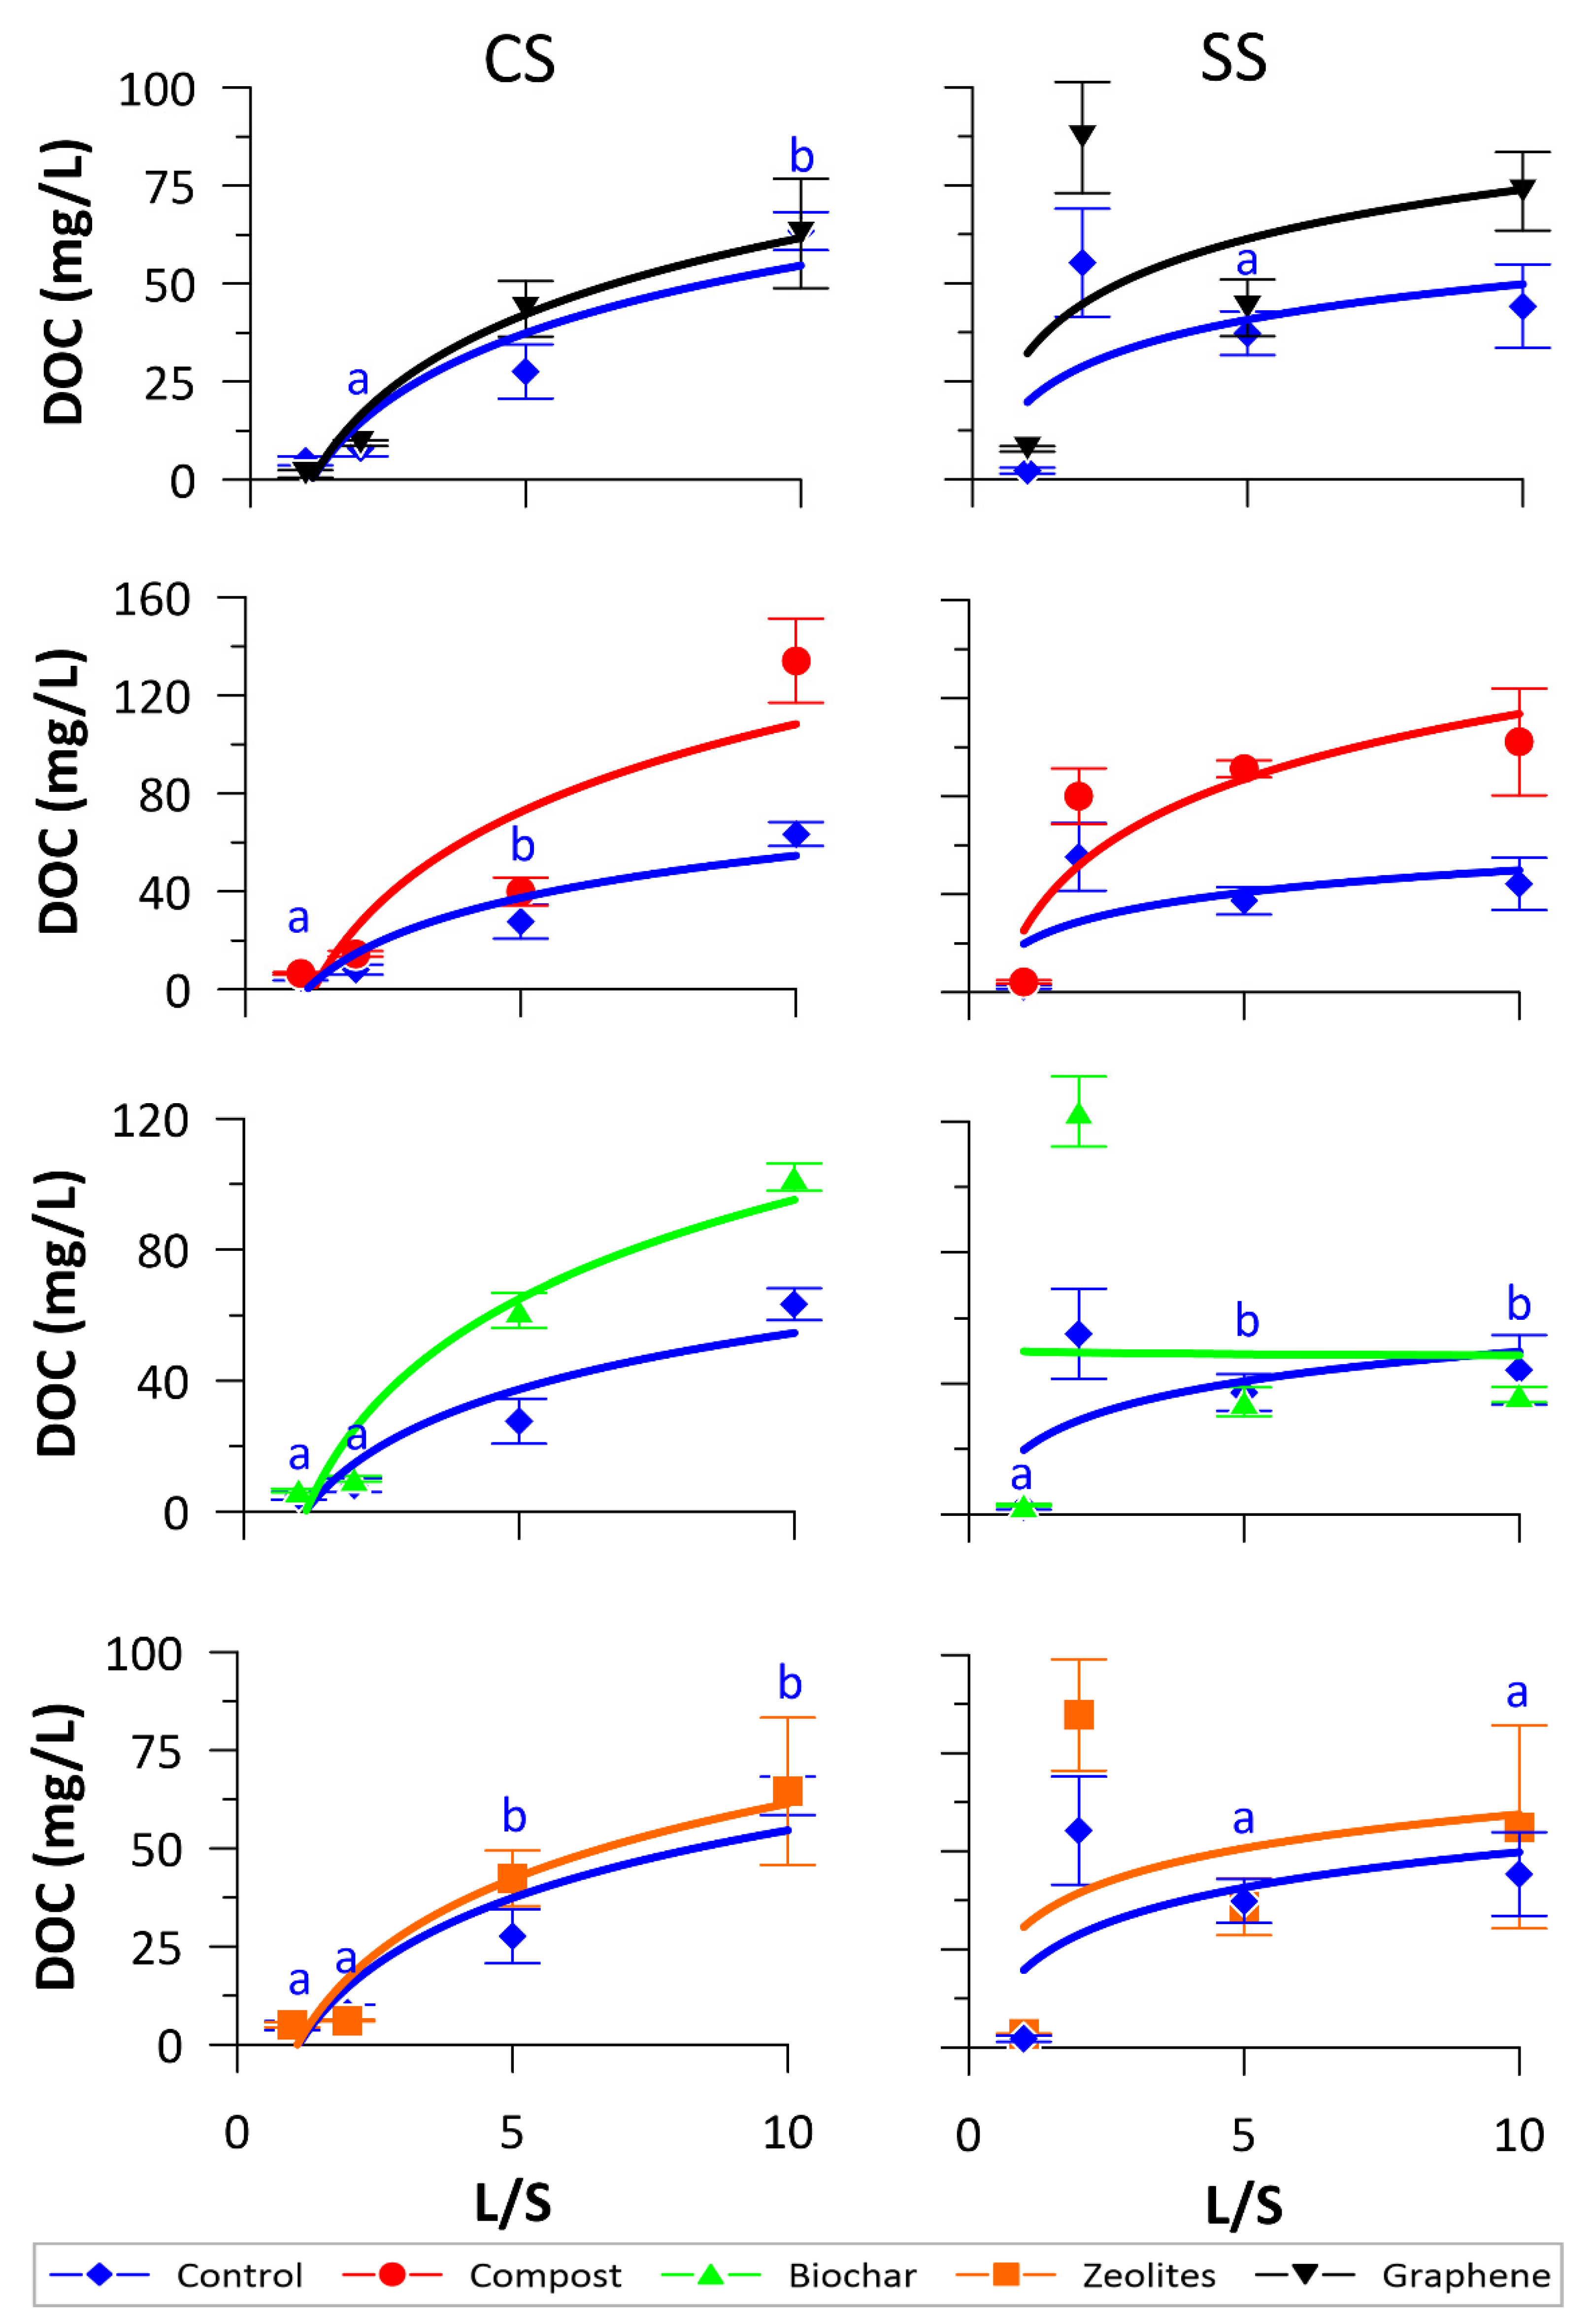
Figure 1 shows the results of the EC monitoring in the batches with CS and SS soils for all of the L/S ratios. In all experiments EC reached asymptotical equilibrium values at the end of the monitoring period (48 h). All of the soluble salts passed in the water phase in a relatively small amount of time, which is typical of sandy materials characterized by large pore throats [26,27]. Graphene showed lower values of EC for almost every treatment and L/S ratio. This was possibly due to the capability of Graphene to incorporate solute complexes and large dissolved ions within its honeycomb lattice [28]. Graphene’s EC values were very close to Control and to Zeolites’ EC values for L/S = 5, and L/S = 10. Biochar showed the highest value of EC for all L/S ratios, according to Kookana et al. [29] and Alessandrino et al. [12], mainly due to the dissolution of carbonates formed during the combustion process.
Figure 2 shows the results of EC variations in response to the increasing L/S ratios. To directly compare the results with L/S = 1, the EC values measured in the batches with L/S > 1 were multiplied by factor 2, 5, and 10, respectively. It can be noticed that EC logarithmically increased in the CS and SS Control, reaching an asymptotic value of 500 µS/cm at L/S 10. This occurred since the larger amount of liquid phase respect to solid phase allowed a complete dissolution of precipitated salts, witnessing an availability control mechanism [16]. Biochar and Compost batches released more ions in solution respect to the Control since they release soluble nutrients such as N, P, and K [12], as witnessed by their statistically different values from the Control for all L/S ratios. This was not the case for Graphene and Zeolites CS batches at L/S = 5 and L/S = 10, which were statistically different from the Control only for CS L/S = 10. EC lowering respect to the Control was likely due to ions and complexes incorporation and sorption onto Zeolites nanotubes [30] and due to sorption and lattice incorporation for Graphene [28]. In general, EC values increased with the increase of L/S ratios, meaning that the dissolution in batches was dependent on L/S ratio. Therefore, if the aim of the experiment is to delineate the maximum amount of soluble salts released, a high L/S ratio must be employed. Additionally, SS characteristics were completely different than CS characteristics (Table 1), but the effect of the L/S ratio used was similar for both soils. This implies that the effect of L/S ratio is independent on the type of solid matrix for sandy soils.
Figure 3 shows the results of pH monitoring in the batches with CS and SS soils for all L/S ratios. As for EC, the pH reached asymptotical equilibrium values at the end of the monitoring period. pH values in CS batches were generally higher than in SS ones, Due to their higher content of carbonates. Graphene showed pH values similar to Control and Zeolites ones, lower than Biochar and higher than Compost for both soils at all L/S ratios. This means that Graphene addition did not result in natural soil pH changes. Compost showed the lowest values of pH for all L/S ratios due to the release of Fulvic and Humic acids [31] in both CS and SS soils. Biochar showed the highest values of pH for all L/S ratios reaching the maximum value (12) in L/S = 1 for CS batches and in L/S = 2 for SS batches (10.8). Those elevated pH values can trigger the conversion of ammonium (NH4+) into ammonia (NH3) [32] with the consequent release of greenhouse gasses [33]. Furthermore this could impact the agricultural yield for many crops removing NH4+ from the soil and preventing plants from using it [34]. In CS batches Biochar showed a different trend from the other soil improvers and the Control, except for L/S = 10. In fact, for L/S = 1, L/S = 2, and L/S = 5, Biochar pH tended to increase during the monitoring period, while the other improvers showed equilibrium or a slight decrease. In SS Biochar batches showed two different trends. For L/S = 1 and L/S = 2 pH increased at the beginning of the monitoring period, while it decreased for the other L/S ratios. This was imputable to CaCO3 precipitation, which is optimal in a pH range of 8.5–10 [35] and the following reaction can occur:
Ca 2 + + HCO 3   CaCO 3 +   H +
with the consequent release of protons triggering the pH lowering [36]. For L/S = 1, L/S = 2, and L/S = 5 in CS batches and for L/S = 1 and L/S = 2 in SS batches, Biochar pH values were out of the optimal pH range for CaCO3 precipitation. Biochar pH values were also affected by L/S ratios, indeed they tended to decrease with the increase of L/S ratios.
Figure 4 shows the effect of different L/S ratios on pH. In the Control, pH increased starting from 8.5 for CS and 8.2 for SS, to reach an asymptotic value of 9.2. In Graphene and Zeolites batches no appreciable differences from the Control could be noted, with no statistically relevant differences among CS, SS, and Control. In the Compost batches a decrease of 0.2 pH points was induced by the acidic conditions of the Compost (Table 1), with statistically relevant differences respect to Control for all L/S ratios except for SS L/S = 1 and L/S = 10. In the Biochar batches, pH tended to converge towards the Control’s pH at increasing L/S ratios, starting at pH near 12 in the CS batches, probably since Biochar induced carbonates dissolution, in agreement with Alessandrino et al. [12]. In both Biochar CS and SS statistically different means respect to Control were present, while for Zeolites no relevant differences were present, indicating that Zeolites addition did not influence pH.
Figure 5 shows the results of ORP monitoring in the CS and SS batches for all L/S ratios. Zeolites revealed the highest values of ORP, while Biochar showed the lowest values for all L/S ratios and for both soils. Biochar did not show a clear trend with ORP values showing an initial decrease and a subsequent increase, in agreement with Alessandrino et al. [12]. This effect was imputable to the dissolution of organic compounds from Biochar thus providing electron donors that determined the ORP fluctuations [37]. In all treatments and for all L/S ratios ORP for Graphene and Compost batches were quite similar and close to those of the Control. The CS Graphene batches showed ORP values higher than the Control ones. Conversely, the SS Graphene batches showed ORP values slightly lower than the Control ones, apart from L/S = 10. For all L/S ratios, except for Biochar, the addition of the soil improvers stabilized ORP, which rapidly reached equilibrium values. Graphene, Compost, and Zeolites ORP values were not affected by the change of L/S ratios, with values close to 200–250 mV. Biochar ORP values were, instead, affected by the change of L/S ratios. The increase of L/S ratios increased ORP values that tended towards Control values.
Figure 6 shows the effect of different L/S ratios on ORP. In the Control, ORP decreased due to the dilution effect, departing from ORP values of approximately 210 mV for CS and 220 for SS, to reach an asymptotic value around 150 mV and 170 mV, respectively. In Graphene’s batches ORP values were less affected by the influence of the liquid phase and tended to remain more stable than the Control ones. Both CS and SS batches showed statistically different means respect to Control except for CS L/S = 1 and for SS L/S = 5. This was probably due to the antioxidant properties of this material [38]. In Compost batches, ORP values were not affected by the change in L/S ratios remaining substantially close to 200 mV for both soils except for L/S = 5, with statistically different means respect to Control except for CS L/S = 1. Biochar batches showed lower values of ORP than the Control in both soils, with statistically different means respect to Control. This was due to the effect of aromatic compounds on Biochar surfaces that provided a source of electron donors that could create a reducing environment [37]. In Zeolites batches ORP mimicked the trend of the Control for both CS and SS batches, with ORP values slightly higher than the Control, with statistically different means respect to Control except for SS L/S = 5.

3.2. NO3 and DOC Release

The results of the NO3 and DOC concentrations monitoring suggested that Graphene performed well in comparison with the other soil improvers, despite the fact that Graphene was applied with a lower amount respect to the other improvers. CS batches showed higher release of NO3. This was due to the higher pH that corresponds to a higher number of negative charges on the surface of the solid phase, which increases the solubility of the cations [39]. In the Graphene batches NO3 concentration in water was significatively lower than in the Control for both CS and SS soils (Figure 7), with statistically different means respect to Control except for CS and SS L/S = 1 and L/S = 2. This suggested that possible adsorption reactions might occur, as already found by Ghadiri et al. [3] and Alessandrino et al. [12]. In addition, it has been recently highlighted that Graphene can enhance denitrification performance [40], significantly reducing the concentration of NO3 in the liquid phase. Based on the results obtained by the sorption isotherm experiments (data in Supplementary Materials), the NO3 decrease in Graphene’s batches was likely due to denitrification. This is due to the fact that the percentage of adsorption, especially in the solution with 10 mg/L of NO3, was almost negligible (≈0.2% of NO3 adsorbed). Compost batches showed significative higher values of NO3 concentration in water for both CS and SS soils, above the admissible limit of 50 mg/L [41] for all L/S ratios, with statistically different means respect to Control. This was due to organic N mineralization which produced a large amount of NO3 that was brought into solution approaching an asymptotic value of approximately 100 mg/L for CS batches and 200 mg/L for SS ones. For instance, the inorganic N reported by the manufacturer was 270 mg/kg, which was similar to the asymptotical value for the SS batches, meaning that nearly all of the inorganic N was brought into solution. In CS batches, NO3 was probably denitrified by the excess of labile organic substrates available in the Compost. Indeed, the manufacturer reported 29.4% of humified organic matter. Biochar batches showed a slight but unsignificant increase of NO3 in CS batches respect to the Control (except for L/S = 1), while no differences in comparison to the Control was recorded in SS batches (except for L/S = 1 and L/S = 2). This highlights no release, no sorption, and no degradation of NO3 in all Biochar batches. Zeolites batches showed significative lower NO3 concentration in water than in the Control for CS L/S = 5 and L/S = 10 and for SS L/S = 5, since the clinopliolite has a moderately good NO3 adsorption capacity at neutral and basic pH [30].
The DOC concentrations were similar among CS and SS batches (Figure 8). Graphene batches showed a slight increase of DOC in CS compared to the Control, but statistically relevant only for L/S = 1 and L/S = 5; while a significative increase of DOC respect to the Control was recorded in SS for all L/S ratios except for L/S = 5. The higher DOC in SS was probably due to the low amount of carbonates in this soil (Table 1), which often promote complexation and flocculation of organic substances [42]. Compost batches showed a significant increase of DOC both in CS and SS soils except for CS L/S = 5, due to the dissolution of humic and fulvic acids. Biochar batches showed a significative increase of DOC in CS at L/S = 5 and L/S = 10; while it showed significant differences in SS respect to the Control only for L/S = 2. Zeolites showed a slightly but not significant increase of DOC both in CS and SS, except for SS L/S = 1 and L/S = 2, which were affected by limited exchange among solid and liquid phases.
The increase of DOC carried on by the application of the soil improvers represented a very important result. Especially in a scenario where the rise of global temperatures leads to a greater degradation of soil organic matter [43]. In addition, Bungau et al. [44] pointed out that the application of nanomaterials to soils corresponds to an increase in soil organic matter and microbial activity, this could lead to potential positive and negative impacts on the agricultural fields [45]. So, it is essential to investigate how the application of a new nanomaterial can impact the environment.
In general, there are two different leaching control mechanism: (i) the release of a chemical species can be controlled by its availability; or (ii) the release can be controlled by the solubility of the chemical species and/or by sorption-desorption processes [16]. NO3 salts have elevated solubility, indeed NO3 release in all of the batches was controlled by NO3 availability since its concentration is strongly dependent on the L/S ratio. In fact, an increase in L/S ratio corresponds to a decrease in NO3 concentration for both CS and SS soils (Table 3) [16]. The only exception is the high concentration of NO3 for L/S = 2 compared to L/S = 1. This was possibly due to the fact that in L/S = 1 the solid-liquid contact was not optimal and NO3 cannot be easily transferred into the liquid phase. Despite the fact that there were no significant differences between NO3 concentration in L/S = 5 and L/S = 10 for all batches, the values in batches with L/S = 10 were always smaller than the ones for L/S = 5, highlighting that NO3 release was controlled by its availability and not by its solubility [16]. As regards DOC, its solubility also depends on the nature of the organic carbon contained in the different soil improvers. In fact, for example, it is possible to notice large differences of DOC among CS and SS Biochar batches. This is due to the very refractory nature of the biochar organic carbon, which gives it a low solubility and a great sensitivity even to small pH changes (pH in CS is higher than in SS due to CaCO3 dissolution) [42]. When the leaching process is limited by the solubility of the chemical species, the L/S ratio has no influence on the concentration. But in field conditions is rather common to find a mix of solubility and availability control mechanisms [16]. In general, DOC concentrations tend to increase with the increase of the L/S ratio for all of the batches, or as in the case of graphene there are no statistically significant differences in DOC values for the different L/S ratios. Likewise, the other soil improvers show non-significant differences for some L/S ratios in DOC concentrations. This means that DOC release was controlled by a mix between solubility and availability for Compost, Zeolites, and Biochar, since the increase of the liquid phase led to an increase in DOC solubility [15]. Conversely, in Graphene’s batches DOC release was limited only by its solubility, since there are no statistical differences in DOC concentration between the different L/S ratios.

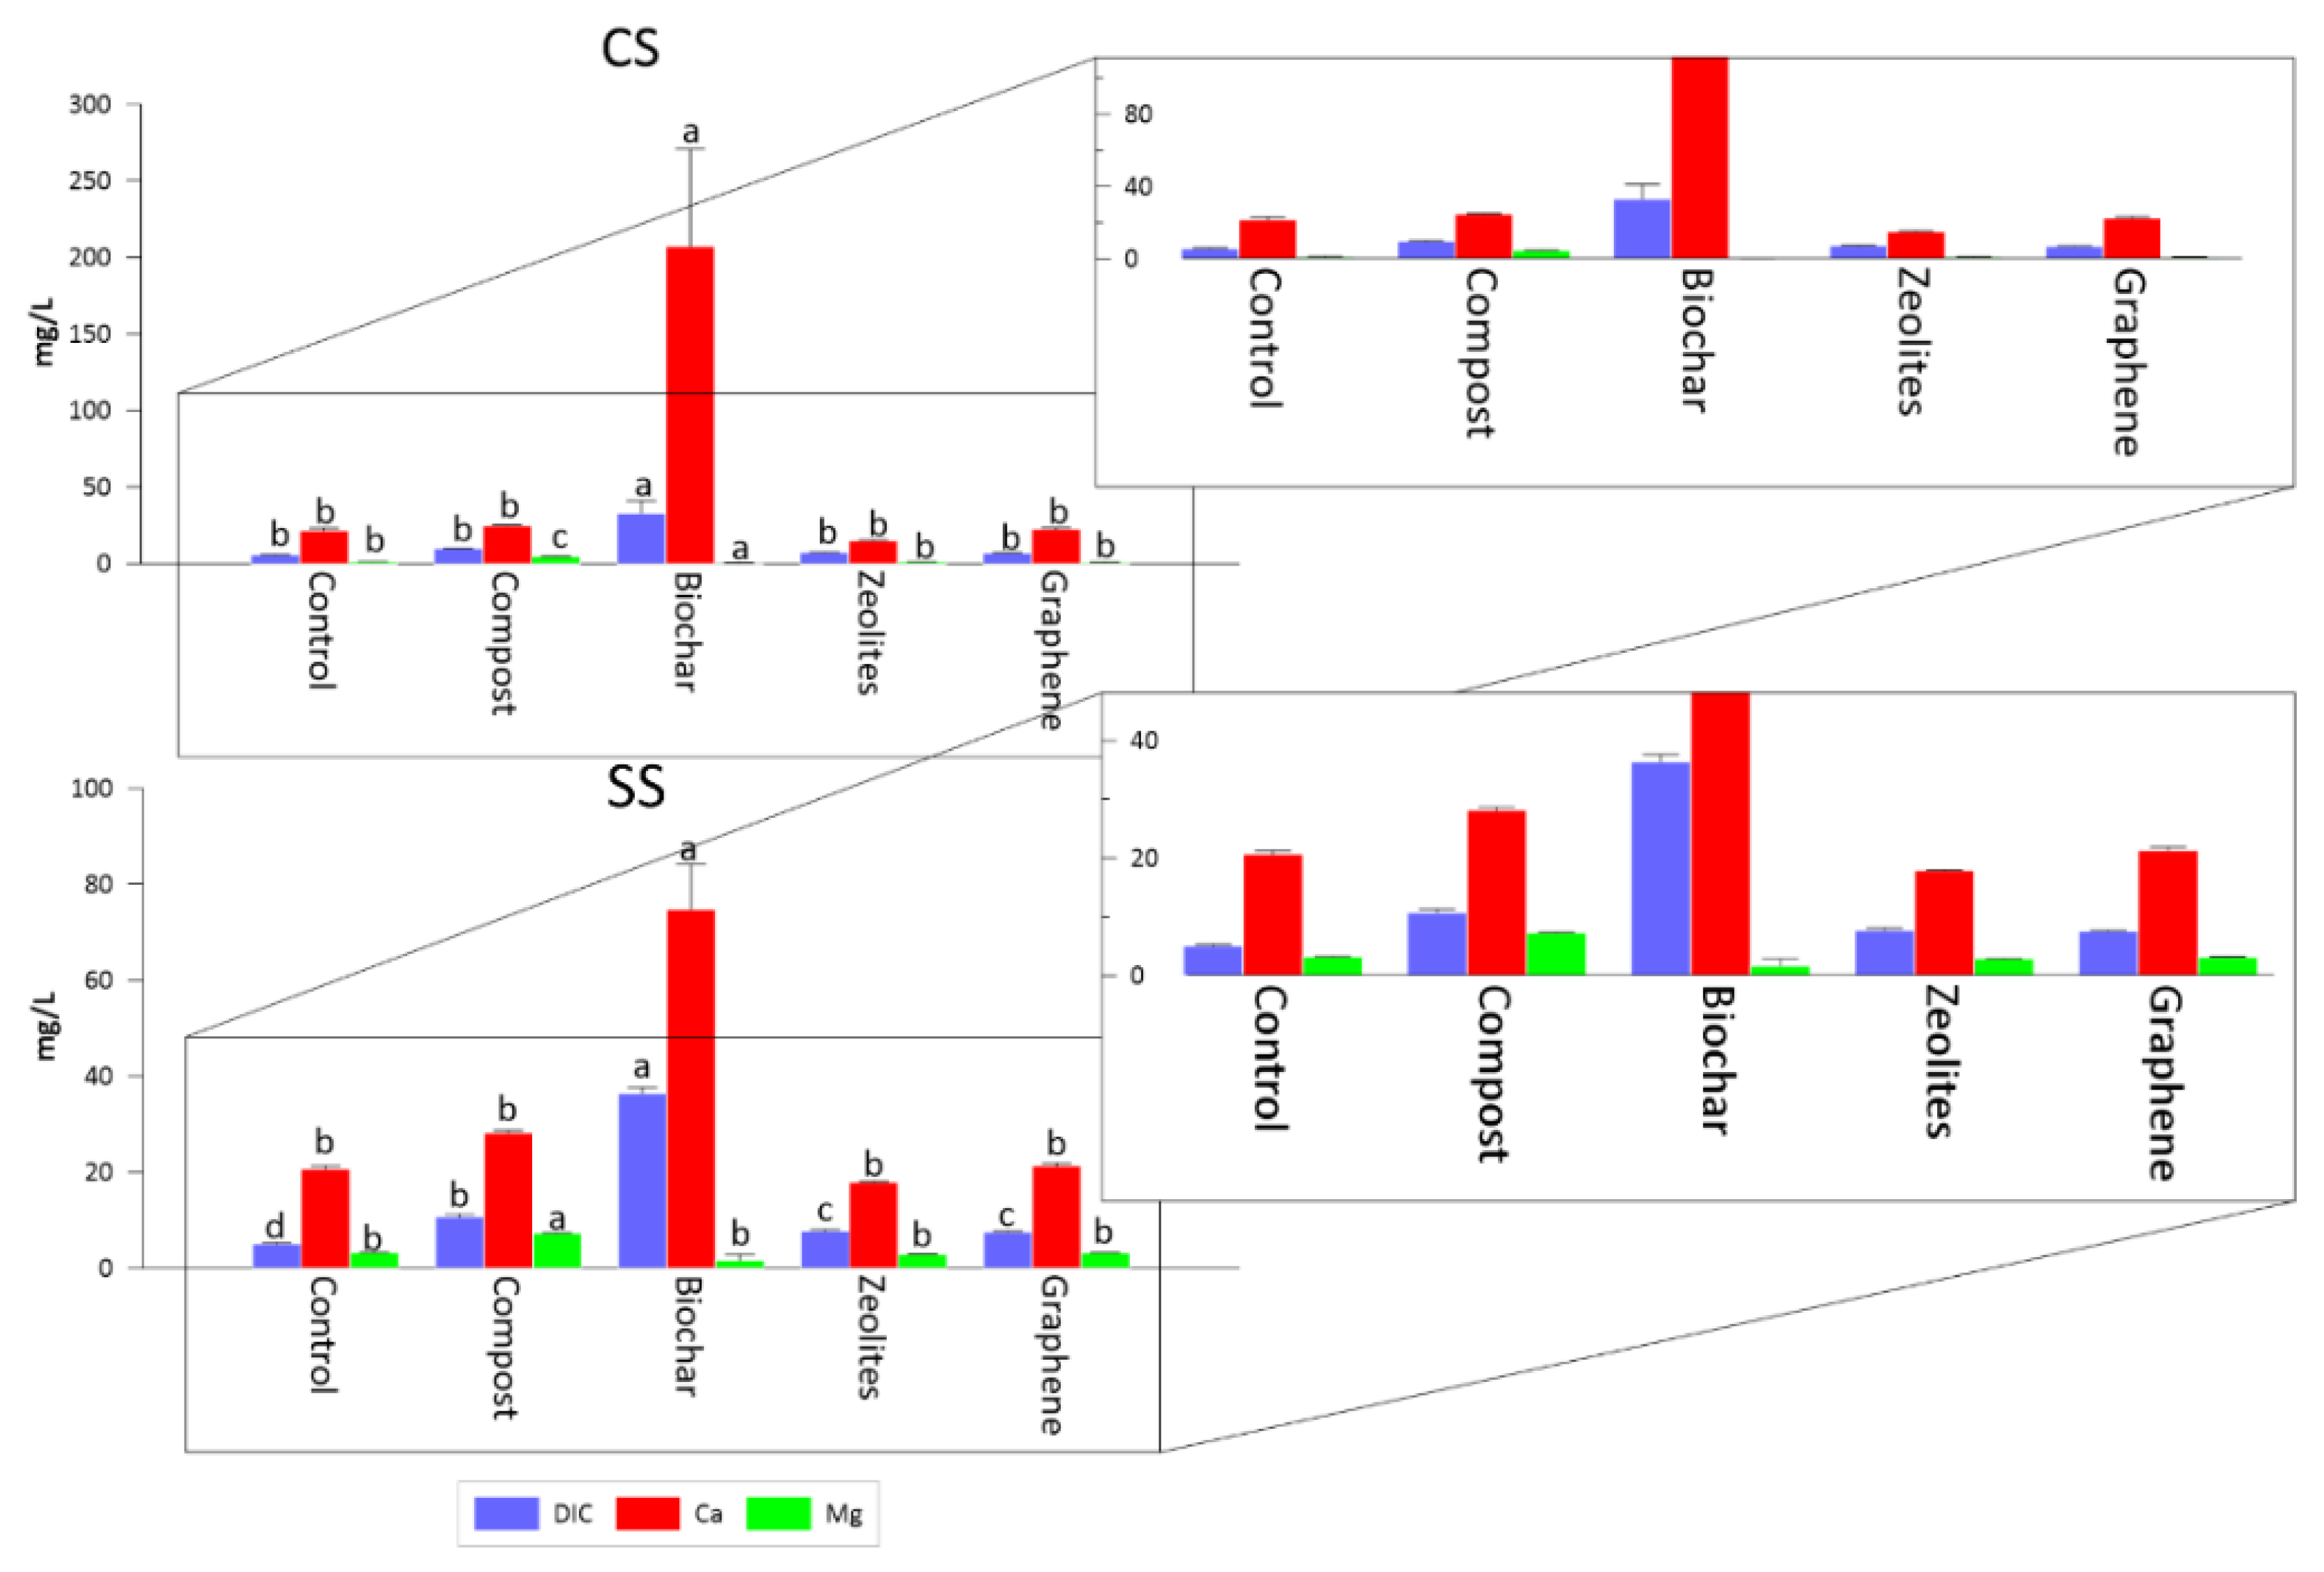
3.3. DIC, Ca and Mg in L/S = 5 Batches

DIC, Ca, and Mg were analyzed in batches with L/S = 5. Figure 9 shows DIC, Ca and Mg concentrations at the end of the monitoring period. Biochar showed the highest value of DIC, with statistical differences in comparison to the control for both CS and SS soils. The elevated DIC concentration in Biochar batches was closely connected to the dissolution of carbonates and also explained the high initial pH values of these batches. Biochar also showed the largest values of Ca for both soils. The concentration of Ca in the Biochar CS batch (207.0 mg/L) was larger than the one in the Biochar SS batch (74.8 mg/L). This large difference could explain the gap of DOC concentrations between these two treatments [46]. This behavior was maintained even in Compost batches. Indeed, the Compost SS batches showed Ca concentrations higher than the Compost CS batches and, accordingly, Compost SS batches showed DOC concentrations higher than the Compost CS batches. With respect to Mg, the Compost SS batches showed an increase with significative statistical differences respect to the Control.

4. Conclusions

In this study, the release of NO3 and DOC from Graphene was investigated in comparison with classical soil improvers (Biochar, Compost, and Zeolites) in two different soils, performing multiple batch experiments with different L/S ratios. Graphene addition did not alter the physiochemical parameters of both soils (CS and SS) and its addition did not trigger any NO3 increase respect to Control and to other improvers, possibly stimulating denitrification. Biochar increased EC and pH beyond recommended limits for most crops’ growth for both soils, but the effect was mitigated by the increase of L/S ratios. Compost addition produced the highest NO3 release, although generally below groundwater quality threshold limits. Graphene helped to decrease NO3 concentrations in batches with L/S = 5 and L/S = 10 in both soils. This study emphasizes the importance of employing parallel batch tests with different L/S ratios to study the dissolution mechanisms. In fact, statistical differences between NO3 and DOC released for the different L/S ratios used were recognized. Moreover, NO3 and DOC concentrations were not strictly linked to dilution effects. The significance of this study lies in going beyond a simple experimental set-up with a single L/S ratio in order to provide a sound understanding of NO3 and DOC release from the different L/S mixtures. In this way, it was possible to highlight the close relationship among the results and the choice of the L/S ratio. Furthermore, performing the experiments on two different sandy soils (CS and SS) allowed to demonstrate that the effect of the L/S ratio is also manifested (thou with different magnitude) on soils different mineralogical compositions. Field studies remain the most suitable method to understand the real behavior of new materials in the environment. Laboratory investigations such as the one here presented are informative and cost-effective tools to better design field experiments.

Supplementary Materials

The following supporting information can be downloaded at: www.mdpi.com/article/10.3390/app12126220/s1. Table S1: Isotherm NO3 graphene.

Author Contributions

Conceptualization, L.A. and N.C.; methodology, L.A. and N.C.; software L.A. and N.C.; validation, M.M. and V.G.A.; formal analysis, L.A.; investigation, L.A. and N.C.; data curation, L.A. and N.C.; writing—original draft preparation, L.A. and N.C.; writing—review and editing, M.M. and V.G.A. All authors have read and agreed to the published version of the manuscript.

Funding

The research activities of L.A. were part of the Environment, Design and Innovation Ph.D. Program funded by the V:ALERE Program (VAnviteLli pEr la RicErca) of the University of Campania “Luigi Vanvitelli”.

Institutional Review Board Statement

Not applicable.

Informed Consent Statement

Not applicable.

Data Availability Statement

The authors declare that the materials are available.

Conflicts of Interest

The authors declare no conflict of interest.

References

  1. Geim, A.K.; Novoselov, K.S. The Rise of Graphene. Nat. Mater. 2007, 6, 183–191. [Google Scholar] [CrossRef] [PubMed]
  2. Ambrosi, A.; Chua, C.K.; Latiff, N.M.; Loo, A.H.; Wong, C.H.A.; Eng, A.Y.S.; Bonanni, A.; Pumera, M. Graphene and Its Electrochemistry—An Update. Chem. Soc. Rev. 2016, 45, 2458–2493. [Google Scholar] [CrossRef] [PubMed] [Green Version]
  3. Ghadiri, S.K.; Nasseri, S.; Nabizadeh, R.; Khoobi, M.; Nazmara, S.; Mahvi, A.H. Adsorption of Nitrate onto Anionic Bio-Graphene Nanosheet from Aqueous Solutions: Isotherm and Kinetic Study. J. Mol. Liq. 2017, 242, 1111–1117. [Google Scholar] [CrossRef]
  4. Feng, L.; Liu, Z. Graphene in Biomedicine: Opportunities and Challenges. Nanomedicine 2011, 6, 317–324. [Google Scholar] [CrossRef] [PubMed]
  5. Song, S.; Shen, H.; Wang, Y.; Chu, X.; Xie, J.; Zhou, N.; Shen, J. Biomedical Application of Graphene: From Drug Delivery, Tumor Therapy, to Theranostics. Colloids Surf. B Biointerfaces 2020, 185, 110596. [Google Scholar] [CrossRef]
  6. Kusmartsev, F.V.; Wu, W.M.; Pierpoint, M.P.; Yung, K.C. Application of Graphene Within Optoelectronic Devices and Transistors. In Applied Spectroscopy and the Science of Nanomaterials; Misra, P., Ed.; Springer Singapore: Singapore, 2015; pp. 191–221. ISBN 978-981-287-242-5. [Google Scholar]
  7. Mortazavi, V.; Moosavi, A.; Nouri-Borujerdi, A. Enhancing Water Desalination in Graphene-Based Membranes via an Oscillating Electric Field. Desalination 2020, 495, 114672. [Google Scholar] [CrossRef]
  8. Gareeb, R.Y.; Elnouby, M.; Hasan, M.A.; Ticu, S.; Popa, A.R.; Bungău, S.G.; Hafez, E.E. New Trend for Using the Reduced Graphene Oxide as Effective and Eco-Friendly Nematicide. Mater. Plast. 2019, 56, 59–64. [Google Scholar] [CrossRef]
  9. Randviir, E.P.; Brownson, D.A.C.; Banks, C.E. A Decade of Graphene Research: Production, Applications and Outlook. Mater. Today 2014, 17, 426–432. [Google Scholar] [CrossRef]
  10. Costa, G.M.; da Hussain, C.M. Ethical, Legal, Social and Economics Issues of Graphene. Compr. Anal. Chem. 2020, 91, 263–279. [Google Scholar] [CrossRef]
  11. Korhonen, J.; Honkasalo, A.; Seppälä, J. Circular Economy: The Concept and Its Limitations. Ecol. Econ. 2018, 143, 37–46. [Google Scholar] [CrossRef]
  12. Alessandrino, L.; Colombani, N.; Eusebi, A.L.; Aschonitis, V.; Mastrocicco, M. Testing Graphene versus Classical Soil Improvers in a Sandy Calcisol. Catena 2022, 208, 105754. [Google Scholar] [CrossRef]
  13. Lord, E.I.; Anthony, S.G.; Goodlass, G. Agricultural Nitrogen Balance and Water Quality in the UK. Soil Use Manag. 2002, 18, 363–369. [Google Scholar] [CrossRef]
  14. Schröder, J.J.; Scholefield, D.; Cabral, F.; Hofman, G. The Effects of Nutrient Losses from Agriculture on Ground and Surface Water Quality: The Position of Science in Developing Indicators for Regulation. Environ. Sci. Pol. 2004, 7, 15–23. [Google Scholar] [CrossRef]
  15. Delay, M.; Lager, T.; Schulz, H.D.; Frimmel, F.H. Comparison of Leaching Tests to Determine and Quantify the Release of Inorganic Contaminants in Demolition Waste. Waste Manag. 2007, 27, 248–255. [Google Scholar] [CrossRef] [PubMed]
  16. Schuwirth, N.; Hofmann, T. Comparability of and Alternatives to Leaching Tests for the Assessment of the Emission of Inorganic Soil Contamination (11 Pp). J. Soils Sediments 2006, 6, 102–112. [Google Scholar] [CrossRef]
  17. Celis, R.; Real, M.; Hermosín, M.C.; Cornejo, J. Sorption and Leaching Behaviour of Polar Aromatic Acids in Agricultural Soils by Batch and Column Leaching Tests. Eur. J. Soil Sci. 2005, 56, 287–297. [Google Scholar] [CrossRef]
  18. Tabelin, C.B.; Veerawattananun, S.; Ito, M.; Hiroyoshi, N.; Igarashi, T. Pyrite Oxidation in the Presence of Hematite and Alumina: I. Batch Leaching Experiments and Kinetic Modeling Calculations. Sci. Total Environ. 2017, 580, 687–698. [Google Scholar] [CrossRef]
  19. Di Giuseppe, D.; Faccini, B.; Mastrocicco, M.; Colombani, N.; Coltorti, M. Reclamation influence and background geochemistry of neutral saline soils in the Po River Delta Plain (Northern Italy). Environ. Earth Sci. 2014, 72, 2457–2473. [Google Scholar] [CrossRef]
  20. Sakanakura, H.; Ito, K.; Tang, J.; Nakagawa, M.; Ishimori, H. Determining Adsorption Parameters of Potentially Contaminant-Releasing Materials Using Batch Tests with Differing Liquid-Solid Ratios. Materials 2021, 14, 2534. [Google Scholar] [CrossRef]
  21. Sahuquillo, A.; Rigol, A.; Rauret, G. Overview of the Use of Leaching/Extraction Tests for Risk Assessment of Trace Metals in Contaminated Soils and Sediments. TrAC Trends Anal. Chem. 2003, 22, 152–159. [Google Scholar] [CrossRef]
  22. Iden, S.C.; Durner, W. Multiple Batch Extraction Test to Estimate Contaminant Release Parameters Using a Bayesian Approach. J. Contam. Hydrol. 2008, 95, 168–182. [Google Scholar] [CrossRef] [PubMed]
  23. Grathwohl, P.; Susset, B. Comparison of Percolation to Batch and Sequential Leaching Tests: Theory and Data. Waste Manag. 2009, 29, 2681–2688. [Google Scholar] [CrossRef] [PubMed]
  24. Cook, S.; Peacock, M.; Evans, C.D.; Page, S.E.; Whelan, M.J.; Gauci, V.; Kho, L.K. Quantifying Tropical Peatland Dissolved Organic Carbon (DOC) Using UV-Visible Spectroscopy. Water Res. 2017, 115, 229–235. [Google Scholar] [CrossRef] [PubMed] [Green Version]
  25. Chen, Y.; Zhang, L.; Xu, C.; Vaidyanathan, S. Dissolved Inorganic Carbon Speciation in Aquatic Environments and Its Application to Monitor Algal Carbon Uptake. Sci. Total Environ. 2016, 541, 1282–1295. [Google Scholar] [CrossRef] [PubMed]
  26. Bendz, D.; Tüchsen, P.L.; Christensen, T.H. The Dissolution Kinetics of Major Elements in Municipal Solid Waste Incineration Bottom Ash Particles. J. Contam. Hydrol. 2007, 94, 178–194. [Google Scholar] [CrossRef]
  27. Mastrocicco, M.; Colombani, N.; Palpacelli, S. Fertilizers Mobilization in Alluvial Aquifer: Laboratory Experiments. Environ. Earth Sci. 2009, 56, 1371–1381. [Google Scholar] [CrossRef]
  28. Boretti, A.; Al-Zubaidy, S.; Vaclavikova, M.; Al-Abri, M.; Castelletto, S.; Mikhalovsky, S. Outlook for Graphene-Based Desalination Membranes. NPJ Clean Water 2018, 1, 5. [Google Scholar] [CrossRef]
  29. Kookana, R.S.; Sarmah, A.K.; Van Zwieten, L.; Krull, E.; Singh, B. Biochar Application to Soil. Agronomic and Environmental Benefits and Unintended Consequences. Adv. Agron. 2011, 112, 103–143. [Google Scholar] [CrossRef]
  30. Ramesh, K.; Reddy, D.D. Chapter Four—Zeolites and Their Potential Uses in Agriculture. In Advances in Agronomy; Sparks, D.L., Ed.; Academic Press: Cambridge, MA, USA, 2011; Volume 113, pp. 219–241. [Google Scholar]
  31. Chefetz, B.; Hatcher, P.G.; Hadar, Y.; Chen, Y. Chemical and Biological Characterization of Organic Matter during Composting of Municipal Solid Waste. J. Environ. Qual. 1996, 25, 776–785. [Google Scholar] [CrossRef]
  32. Booth, M.S.; Stark, J.M.; Rastetter, E. Controls on Nitrogen Cycling in Terrestrial Ecosystems: A Synthetic Analysis of Literature Data. Ecol. Monogr. 2005, 75, 139–157. [Google Scholar] [CrossRef] [Green Version]
  33. Novak, S.M.; Fiorelli, J.L. Greenhouse Gases and Ammonia Emissions from Organic Mixed Crop-Dairy Systems: A Critical Review of Mitigation Options. Agron. Sustain. Dev. 2010, 30, 215–236. [Google Scholar] [CrossRef] [Green Version]
  34. Sharma, B.R.; Minhas, P.S. Strategies for Managing Saline/Alkali Waters for Sustainable Agricultural Production in South Asia. Agric. Water Manag. 2005, 78, 136–151. [Google Scholar] [CrossRef]
  35. Hu, Y.-B.; Wolf-Gladrow, D.A.; Dieckmann, G.S.; Völker, C.; Nehrke, G. A Laboratory Study of Ikaite (CaCO3·6H2O) Precipitation as a Function of PH, Salinity, Temperature and Phosphate Concentration. Mar. Chem. 2014, 162, 10–18. [Google Scholar] [CrossRef] [Green Version]
  36. Morse, J.W.; Gledhill, D.K.; Millero, F.J. CaCo3 Precipitation Kinetics in Waters from the Great Bahama Bank:: Implications for the Relationship between Bank Hydrochemistry and Whitings. Geochim. Cosmochim. Acta 2003, 67, 2819–2826. [Google Scholar] [CrossRef]
  37. Joseph, S.D.; Camps-Arbestain, M.; Lin, Y.; Munroe, P.; Chia, C.H.; Hook, J.; Van Zwieten, L.; Kimber, S.; Cowie, A.; Singh, B.P.; et al. An Investigation into the Reactions of Biochar in Soil. Soil Res. 2010, 48, 501–515. [Google Scholar] [CrossRef]
  38. Qiu, Y.; Wang, Z.; Owens, A.C.E.; Kulaots, I.; Chen, Y.; Kane, A.B.; Hurt, R.H. Antioxidant Chemistry of Graphene-Based Materials and Its Role in Oxidation Protection Technology. Nanoscale 2014, 6, 11744–11755. [Google Scholar] [CrossRef] [Green Version]
  39. Sharpley, A.N. Effect of Soil PH on Cation and Anion Solubility. Commun. Soil Sci. Plant Anal. 1991, 22, 827–841. [Google Scholar] [CrossRef]
  40. Jiang, M.; Feng, L.; Zheng, X.; Chen, Y. Bio-Denitrification Performance Enhanced by Graphene-Facilitated Iron Acquisition. Water Res. 2020, 180, 115916. [Google Scholar] [CrossRef]
  41. World Health Organization. Guidelines for Drinking-Water Quality [Electronic Resource]: Incorporating 1st and 2nd Addenda, Vol.1, Recommendations. 2008. Available online: https://apps.who.int/iris/handle/10665/204411 (accessed on 1 March 2022).
  42. Hernandez-Soriano, M.C.; Kerré, B.; Kopittke, P.M.; Horemans, B.; Smolders, E. Biochar Affects Carbon Composition and Stability in Soil: A Combined Spectroscopy-Microscopy Study. Sci. Rep. 2016, 6, 25127. [Google Scholar] [CrossRef]
  43. Cotrufo, M.F.; Wallenstein, M.D.; Boot, C.M.; Denef, K.; Paul, E. The Microbial Efficiency-Matrix Stabilization (MEMS) Framework Integrates Plant Litter Decomposition with Soil Organic Matter Stabilization: Do Labile Plant Inputs Form Stable Soil Organic Matter? Glob. Chang. Biol. 2013, 19, 988–995. [Google Scholar] [CrossRef] [Green Version]
  44. Bungau, S.; Behl, T.; Aleya, L.; Bourgeade, P.; Aloui-Sossé, B.; Purza, A.L.; Abid, A.; Samuel, A.D. Expatiating the Impact of Anthropogenic Aspects and Climatic Factors on Long-Term Soil Monitoring and Management. Environ. Sci. Pollut. Res. 2021, 28, 30528–30550. [Google Scholar] [CrossRef] [PubMed]
  45. Behl, T.; Kaur, I.; Sehgal, A.; Singh, S.; Sharma, N.; Bhatia, S.; Al-Harrasi, A.; Bungau, S. The Dichotomy of Nanotechnology as the Cutting Edge of Agriculture: Nano-Farming as an Asset versus Nanotoxicity. Chemosphere 2022, 288, 132533. [Google Scholar] [CrossRef] [PubMed]
  46. Rowley, M.C.; Grand, S.; Verrecchia, É.P. Calcium-Mediated Stabilisation of Soil Organic Carbon. Biogeochemistry 2018, 137, 27–49. [Google Scholar] [CrossRef] [Green Version]
Figure 1. EC trends in SSE batches experiments with CS (left panels) and SS (right panels) for different L/S ratios. Error bars denote standard deviation calculated on three replicas.
Applsci 12 06220 g001
Figure 2. EC values variation in SSE batches with CS (left panels) and SS (right panels) soils versus L/S ratios at the end of the monitoring period. Error bars denote standard deviation calculated on three replicates, while lines are the best fit natural logarithmic curves. Different letters indicate statistically different means at 0.05 confidence.
Applsci 12 06220 g002
Figure 3. pH values variation in SSE batches experiments with CS (left panels) and SS (right panels) for different L/S ratios. Error bars denoted standard deviation calculated on three replicas. Different letters indicate statistically different means at 0.05 confidence.
Applsci 12 06220 g003
Figure 4. pH in SSE batches with CS (left panels) and SS (right panels) soils versus L/S ratios values at the end of the monitoring period. Error bars denote standard deviation calculated on three replicates, while lines are the best fit natural logarithmic curves. Different letters indicate statistically different means at 0.05 confidence.
Applsci 12 06220 g004
Figure 5. ORP values variations in SSE batches experiments with CS (left panels) and SS (right panels) for different L/S ratios. Error bars denoted standard deviation calculated on three replicas.
Applsci 12 06220 g005
Figure 6. ORP values in SSE batches CS (left panels) and SS (right panels) soils versus L/S ratios values at the end of the monitoring period. Error bars denote standard deviation calculated on three replicates, while lines are the best fit natural logarithmic curves. Different letters indicate statistically different means at 0.05 confidence.
Applsci 12 06220 g006
Figure 7. NO3 concentrations in SSE batches with CS (left panels) and SS (right panels) soils versus L/S ratios values at the end of the monitoring period. Error bars denote standard deviations calculated on three replicates, while lines are best fit natural logarithmic curves. Different letters indicate statistically different means at 0.05 confidence.
Applsci 12 06220 g007
Figure 8. DOC concentration in SSE batches CS (left panels) and SS (right panels) soils versus L/S ratios values at the end of the monitoring period. Error bars denote standard deviations calculated on three replicates, while lines are best fit natural logarithmic curves. Different letters indicate statistically different means at 0.05 confidence.
Applsci 12 06220 g008
Figure 9. DIC, Ca and Mg concentrations in SSE batches with CS (upper panels) and SS (lower panels) soils at L/S = 5 at the end of the monitoring period. Error bars denote standard deviations calculated on three replicates, while different letters indicate significative statistical differences.
Applsci 12 06220 g009
Table 1. Grain size distribution, carbonates content expressed in percentage over dry weight, and pH for the CS and SS soils, and for the four improvers. Standard deviation from triplicate samples is also reported.
SandSiltClayCarbonatespH
CS96.8 ± 2.42.5 ± 1.60.7 ± 1.487.9 ± 4.27.8 ± 0.2
SS96.9 ± 0.22.7 ± 0.10.4 ± 0.25.3 ± 0.68.1 ± 0.2
Compost90.6 ± 2.08.8 ± 1.00.5 ± 0.10.2 ± 0.036.7 ± 0.1
Biochar80.6 ± 5.54.9 ± 1.714.3 ± 4.62.1 ± 0.69.9 ± 0.1
Zeolites3.2 ± 0.37.7 ± 3.489.2 ± 3.20.1 ± 0.028.1 ± 0.1
Graphene0.0 ± 0.00.0 ± 0.0100.0 ± 0.00.0 ± 0.07.1 ± 0.1
Table 2. Type of soil improvers used in this study and their percentage in the batch experiments (as dry weight).
CompostZeolitesBiocharGraphene
TypeCow manure vermicompost Clinoptilolite 67.5% Mordenite 32.5%Wood gasification biocharGR006050
Manufacturer LTDG®SBM LIFE
SCIENCE®
BioDea®Directa Plus®
Mix (% d.w.)1.80.94.50.015
Table 3. Statistical comparison between the mean (±standard deviation) of raw data values (not multiplied by the L/S ratios factor) for NO3 and DOC at different L/S ratios for each improver for both soils.
NO3
L/S ratios (CS) ControlCompostBiocharZeolitesGraphene
10.45 ± 0.12a24.83 ± 6.2a5.87 ± 1.1a1.86 ± 0.62b0.1 ± 0.01a
26.52 ± 4.15b31.24 ± 7.9b7.79 ± 0.39b4.52 ± 0.87c3.86 ± 0.93
52.57 ± 0.06ab12.73 ± 6.2c4.00 ± 2.2a0.23 ± 0.06a0.15 ± 0.01a
102.95 ± 1.3ab9.44 ± 4.34c3.79 ± 0.62a0.13 ± 0.01a0.21 ± 0.11a
F ratio4.1597.9272.79643.3146.917
p value0.0470.0090.109<0.001<0.001
L/S ratios (SS)ControlCompostBiocharZeolitesGraphene
10.17 ± 0.06a24.5 ± 3.1a3.14 ± 2.72a0.66 ± 1.48ab0.82 ± 0.62a
23.88 ± 1.86b66.56 ± 16.5b9.49 ± 1.24b2.66 ± 0.76c3.33 ± 0.86b
52.29 ± 0.06ab21.46 ± 6.2a2.33 ± 0.06a0.35 ± 0.12b0.55 ± 0.18a
102.08 ± 1.1ab19.86 ± 3.72a2.18 ± 0.62a0.87 ± 0.43ab0.73 ± 0.06a
F ratio5.89818.03115.6864.07917.479
p value0.02<0.0010.0010.05<0.001
DOC
L/S ratios (CS)ControlCompostBiocharZeolitesGraphene
14.85 ± 1.15a6.5 ± 0.55a6.46 ± 0.58a5.06 ± 0.63a1.5 ± 0.92b
24.04 ± 1.04a7.29 ± 0.56a4.99 ± 0.42b3.06 ± 0.1a4.67 ± 0.36a
55.52 ± 1.37a7.99 ± 1.13a12.3 ± 1.07c8.47 ± 1.41b8.71 ± 1.41c
106.34 ± 0.48a13.41 ± 1.7b10.21 ± 0.41d6.45 ± 1.87ab6.28 ± 1.39a
F ratio2.51424.34472.02411.22822.209
p value0.132<0.001<0.0010.003<0.001
L/S ratios (SS)ControlCompostBiocharZeolitesGraphene
12.23 ± 0.76a4.16 ± 0.74b2.86 ± 0.32a3.48 ± 0.09a7.76 ± 0.7a
23.48 ± 1.29a8.07 ± 0.62a2.13 ± 0.31b6.54 ± 1.35a5.18 ± 0.35a
57.46 ± 1.11b18.23 ± 0.69c6.89 ± 0.88c7.16 ± 1.44a8.75 ± 1.44a
104.41 ± 1.06a10.21 ± 2.17a3.66 ± 0.23ab5.61 ± 2.58a7.34 ± 1.01a
F ratio12.82568.51250.992.9177.335
p value0.002<0.001<0.0010.10.011
The ANOVA metrics (F-ratio and p-value). For p-value < 0.05, there is a statistically significant difference between the means. Multiple range tests to determine which means are significantly different from which others for each parameter, based on different treatments. Different letters indicate statistically different means at 0.05 confidence.
Publisher’s Note: MDPI stays neutral with regard to jurisdictional claims in published maps and institutional affiliations.

