Article

A Deep Learning Approach to Analyze Airline Customer Propensities: The Case of South Korea

1
Big Data Using Research Center, Sookmyung Women’s University, Seoul 04310, Korea
2
Department of Airline Services & Tourism, Seoyeong University, Gwangju 61268, Korea
3
Department of Software Convergence, Sookmyung Women’s University, Seoul 04310, Korea
4
Department of IT Engineering, Sookmyung Women’s University, Seoul 04310, Korea
*
Authors to whom correspondence should be addressed.
Appl. Sci. 2022, 12(4), 1916; https://doi.org/10.3390/app12041916
Submission received: 17 November 2021 / Revised: 1 February 2022 / Accepted: 7 February 2022 / Published: 12 February 2022

Abstract

:
In the airline industry, customer satisfaction occurs when passengers’ expectations are met through the airline experience. Considering that airline service quality is the main factor in obtaining new and retaining existing customers, airline companies are applying various approaches to improve the quality of the physical and social servicescapes. It is common to use data analysis techniques for analyzing customer propensity in marketing. However, their application to the airline industry has traditionally focused solely on surveys; hence, there is a lack of attention paid to deep learning techniques based on survey results. This study has two purposes. The first purpose is to find the relationship between various factors influencing customer churn risk and satisfaction by analyzing the airline customer data. For this, we applied deep learning techniques to the survey data collected from the users who have used mostly Korean airplanes. To the best of our knowledge, this is the one of the few attempts at applying deep learning to analyze airline customer propensities. The second purpose is to analyze the influence of the social servicescape, including the viewpoints of the cabin crew and passengers using aircraft, on airline customer propensities. The experimental results demonstrated that the proposed method of considering human services increased the accuracy of predictive models by up to 10% and 9% in predicting customer churn risk and satisfaction, respectively.

1. Introduction

Customer satisfaction is a customer evaluation process for product performance by comparing the results of actual experiences and expectations for the product. It is a metric obtained from complex factors such as service, price, and quality. Customer satisfaction can raise loyalty when repurchasing, reduce price elasticity, protect customers from competitors, lower future failure and transaction costs, and increase reputation by reducing the cost of attracting new customers [1]. In the airline industry, customer satisfaction occurs when passengers’ expectations are met through the airline experience. Customer satisfaction in the airline industry can have a positive effect on brand experience, trust, and loyalty, including attachment and preferential recommendations [2,3]. However, due to the pandemic caused by COVID-19 and intense competition among airlines, many airline companies are struggling to attract new customers [4,5]. Considering that airline service quality is the main factor in obtaining new and retaining existing customers, airline companies are using various approaches to improve the quality of the physical and social servicescapes.
Existing studies [6,7,8,9,10,11,12,13] investigated the various factors of airline servicescape influencing customer churn risk and satisfaction in the airline industry, such as in-flight meal and beverage, in-flight entertainment and prices. There were also several studies [14,15,16] that examined the influence of physical and social servicescapes on airline customer propensities. However, while most of the studies that dealt with airline servicescapes so far have limited the human service to only the cabin crew, the ultimate purpose of this study is to connect airline customer propensities with brand loyalty by extending the human service to the viewpoint of passengers. Moreover, most existing studies only use traditional statistical methods, such as frequency, factor, and regression analyses, to analyze airline customer data. Therefore, there is a limitation in that the derived results are limited to the linear relationship, which makes it difficult to visually identify the magnitude of various factors affecting each other in airline customer data. To improve upon this problem, in this paper, we propose finding the relationship between various factors influencing customer churn risk and satisfaction by analyzing the airline customer data using machine learning and deep learning models.
Machine learning and deep learning-based data analysis enables us to discover hidden correlations and valuable insights from complex multi-dimensional data [17]. Research that utilizes machine learning and deep learning is now widespread in various fields. In particular, machine learning-based methods are actively used for customer analysis and marketing, such as forecasting customer purchase in the travel industry [18], predicting customer churn risk in the telecommunication and banking industries [19,20], and improving sales and marketing efficiency [21]. Furthermore, machine learning models have been applied to the fields of transportation for predicting car accidents [22], agriculture industry for predicting demand and the price of products [23], healthcare and smart home for detecting falls [24], smart manufacturing applications for predicting tool wear [25], entertainment industry for correcting postures of piano players [26], and many others. A few studies applied machine learning to analyze airline customer propensities. For example, Nicolini and Salini [27] used a well-known machine learning model, decision tree, to determine the essential factors in the evaluation of customer satisfaction in British Airways. Garcia et al. [28] used a combination of k-Nearest Neighbor (kNN) and ensemble regression models to predict airline customer satisfaction. Bellizzi et al. [29] employed Classification and Regression Trees (CART) to analyze highly educated people’s satisfaction with airlines’ services. Compared to these studies, our work not only finds various relationships between factors influencing airline customer propensities but also includes the comparison of the performance of different machine learning and deep learning approaches. Moreover, to the best of our knowledge, this is the one of the few attempts at applying deep learning to analyze airline customer propensities. Specifically, we make the following contributions in this paper:
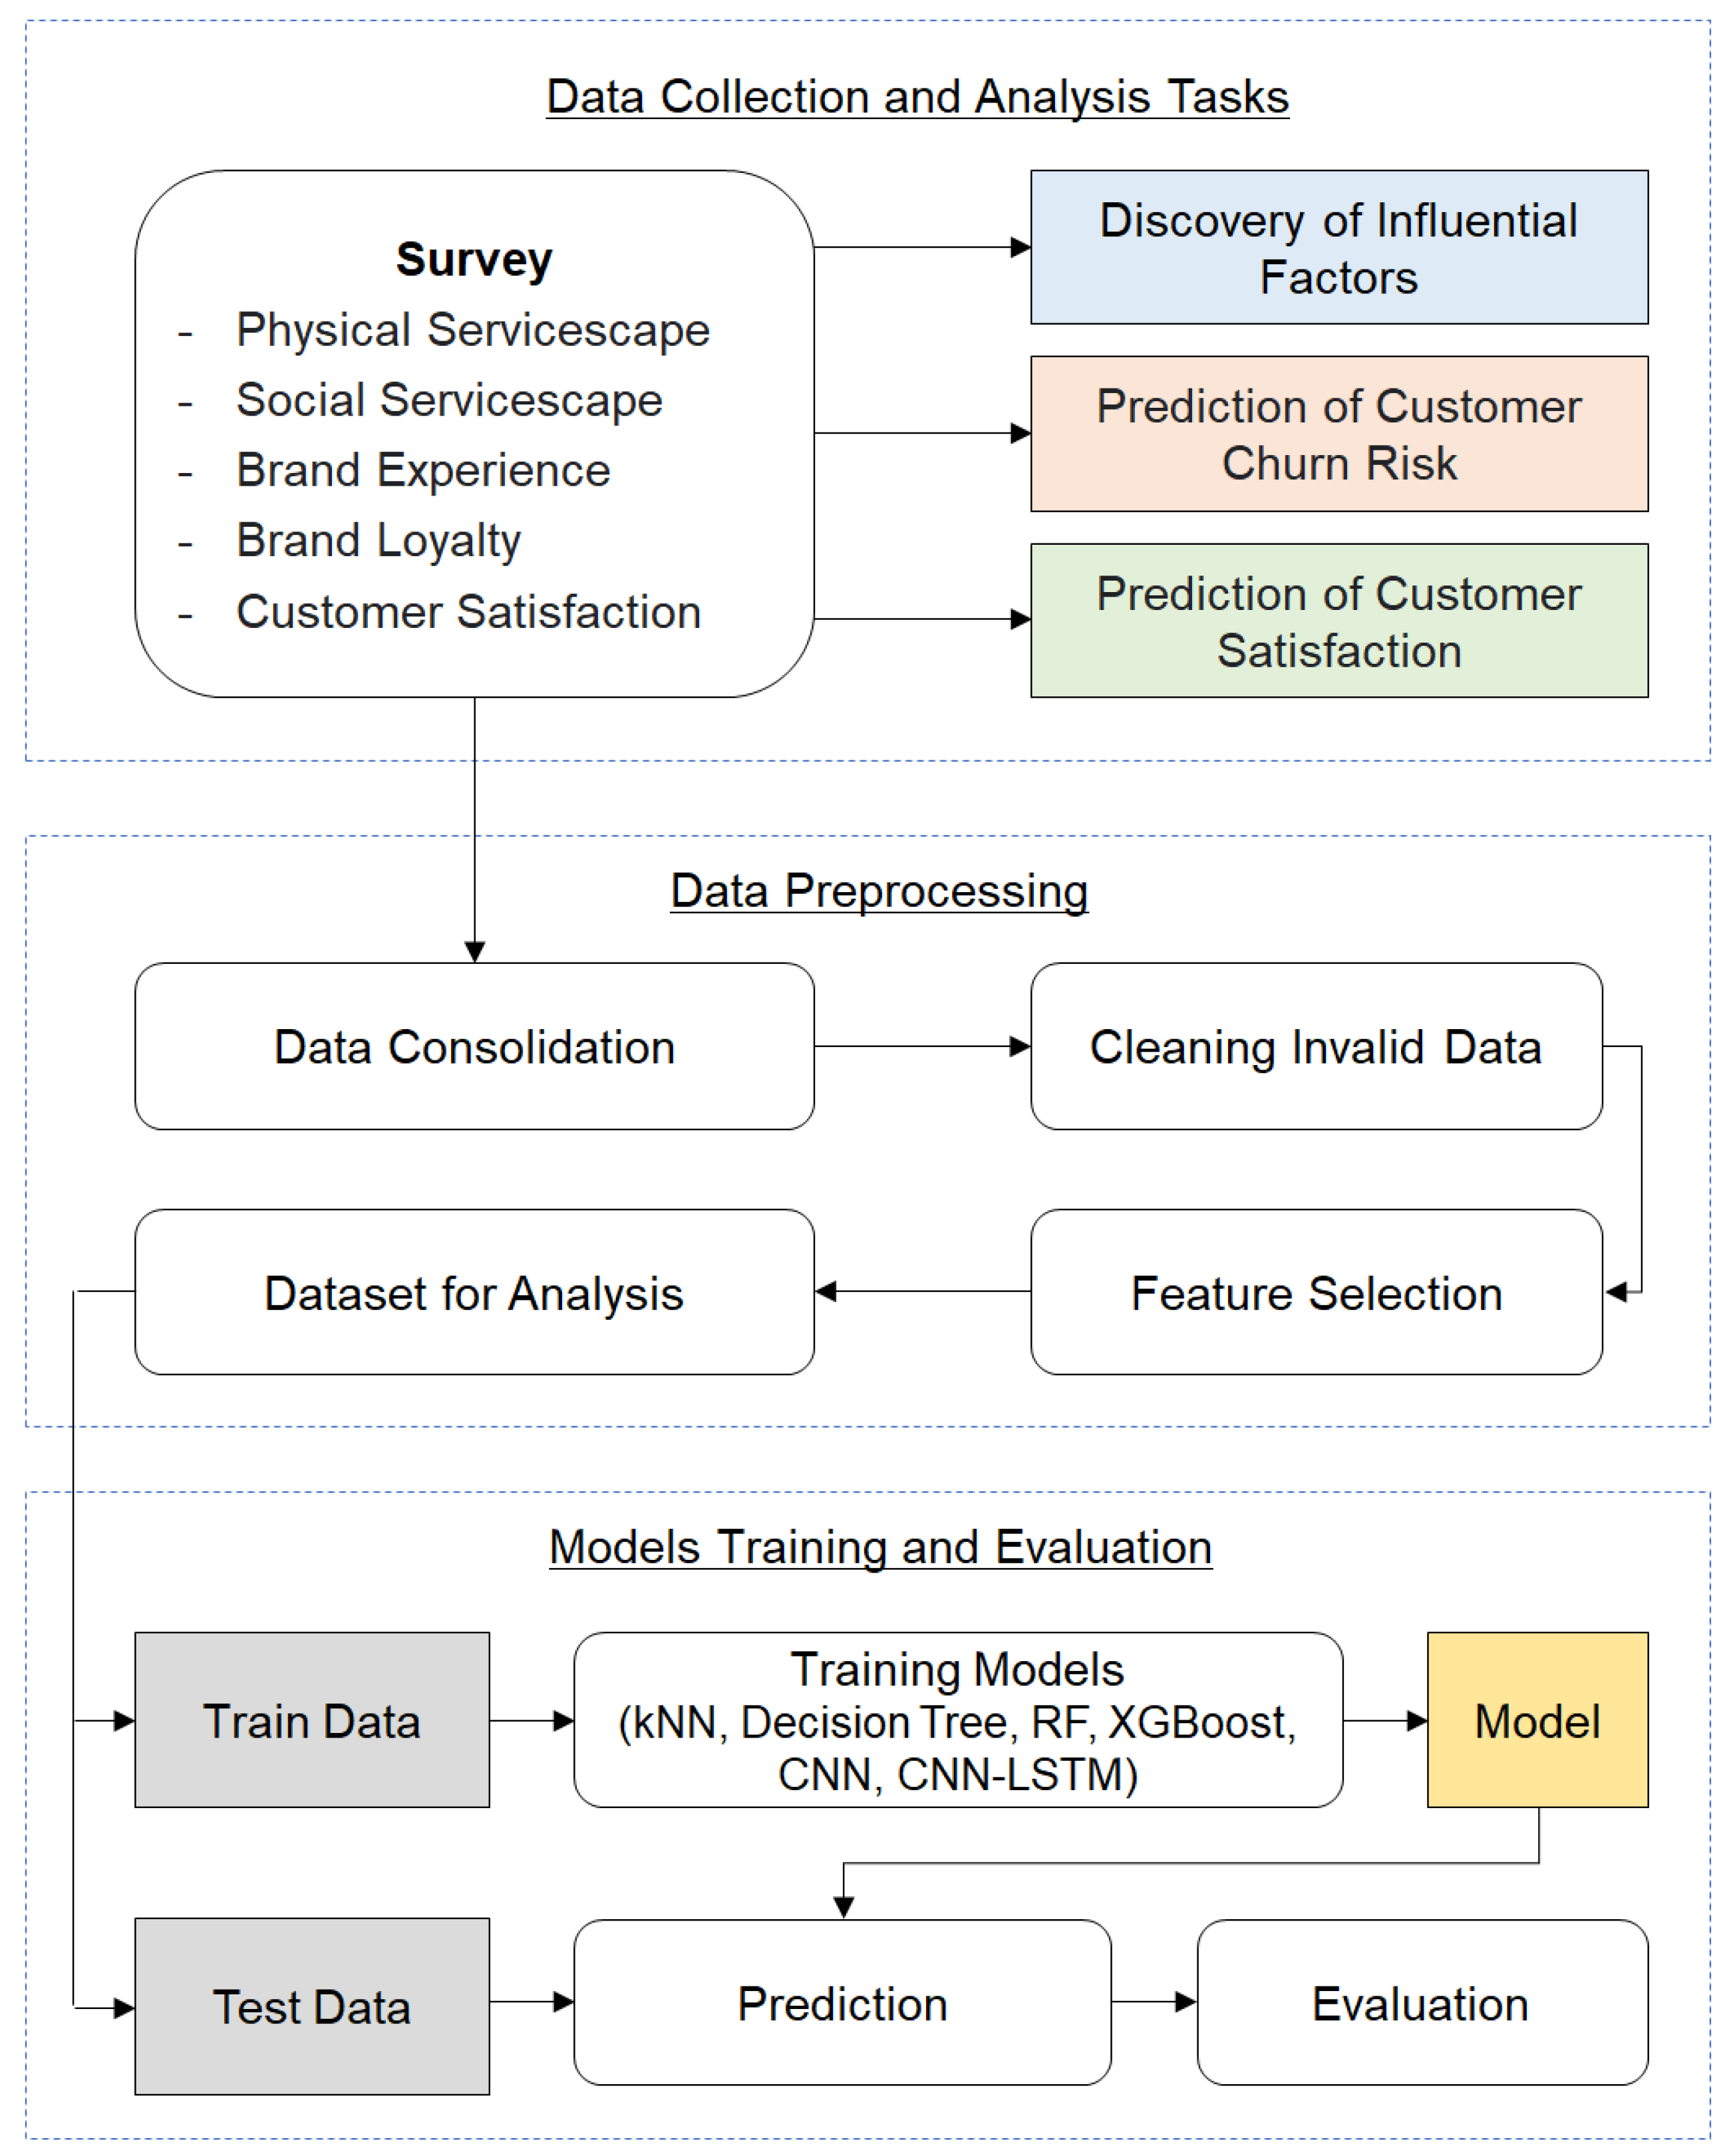
  • First, we collected data from users who have used airplanes at least once within the last five years. The users responded to the 50 questions related to the physical and social environments of the airlines, brand experience and loyalty, and customer satisfaction. We then performed preprocessing to obtain the final dataset that was used as a training dataset in our predictive models. The preprocessing procedure contains the following steps: (1) consolidating the dataset, (2) cleaning invalid data, and (3) feature selection.
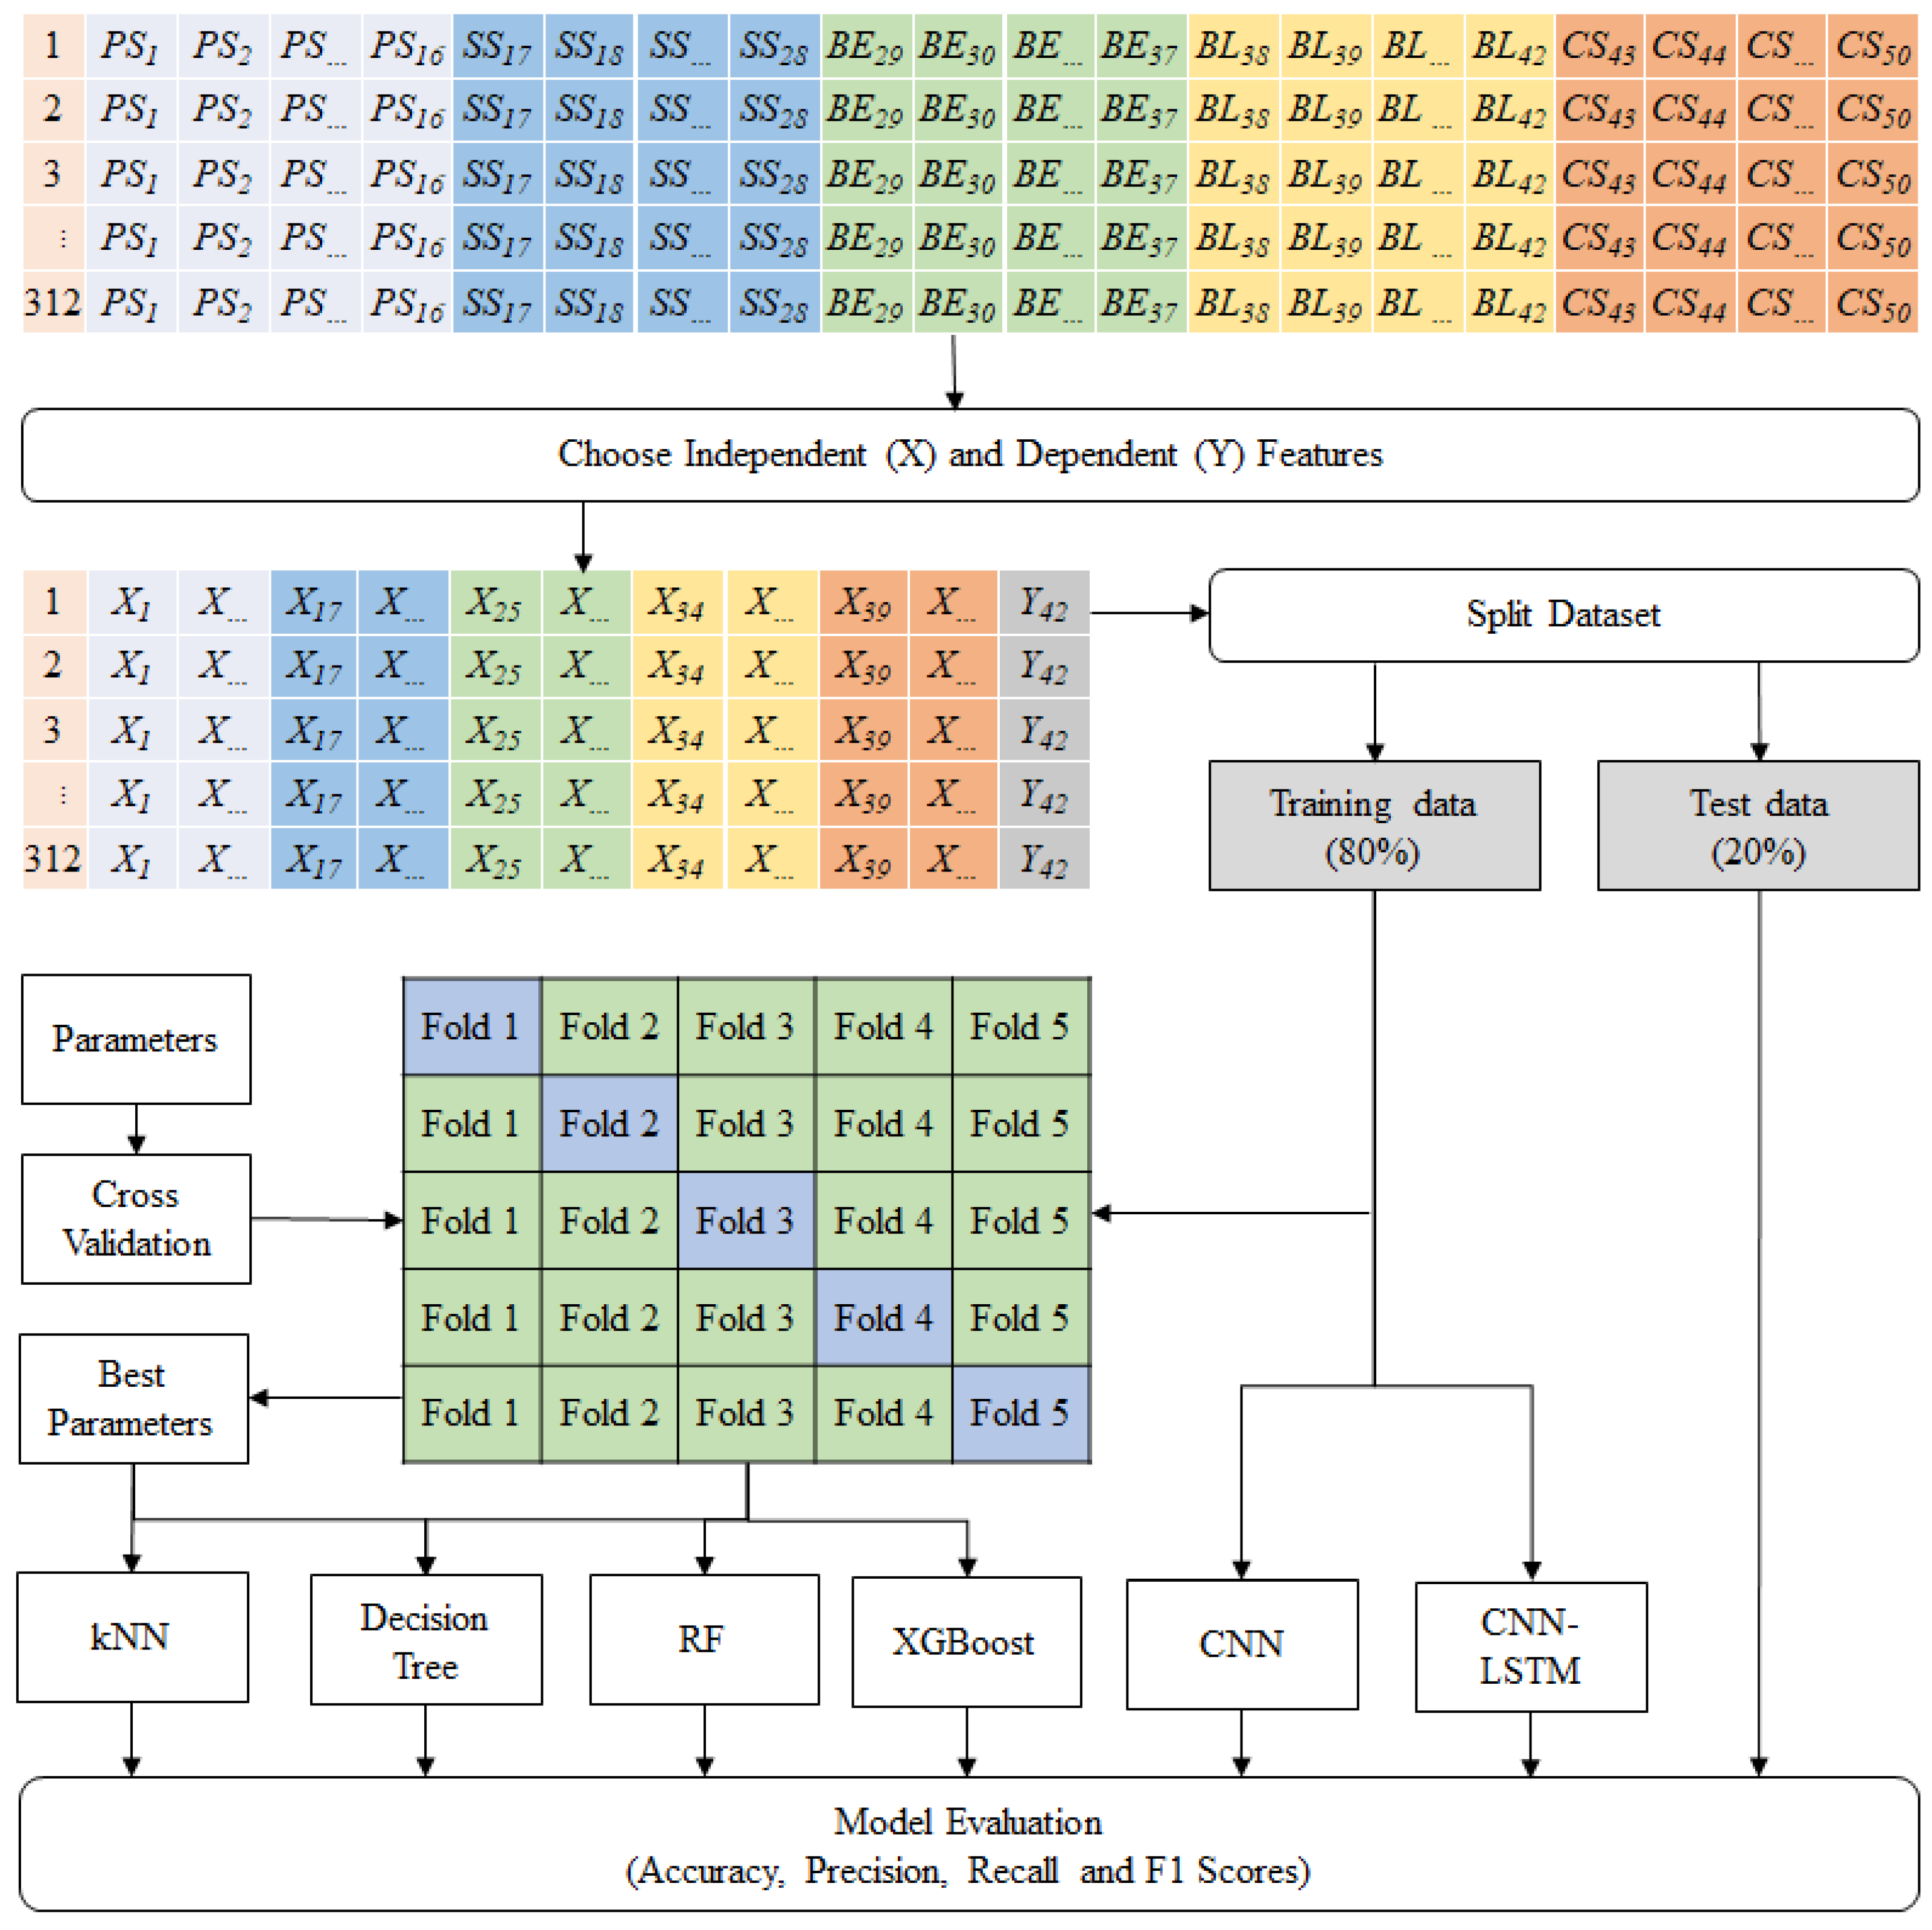
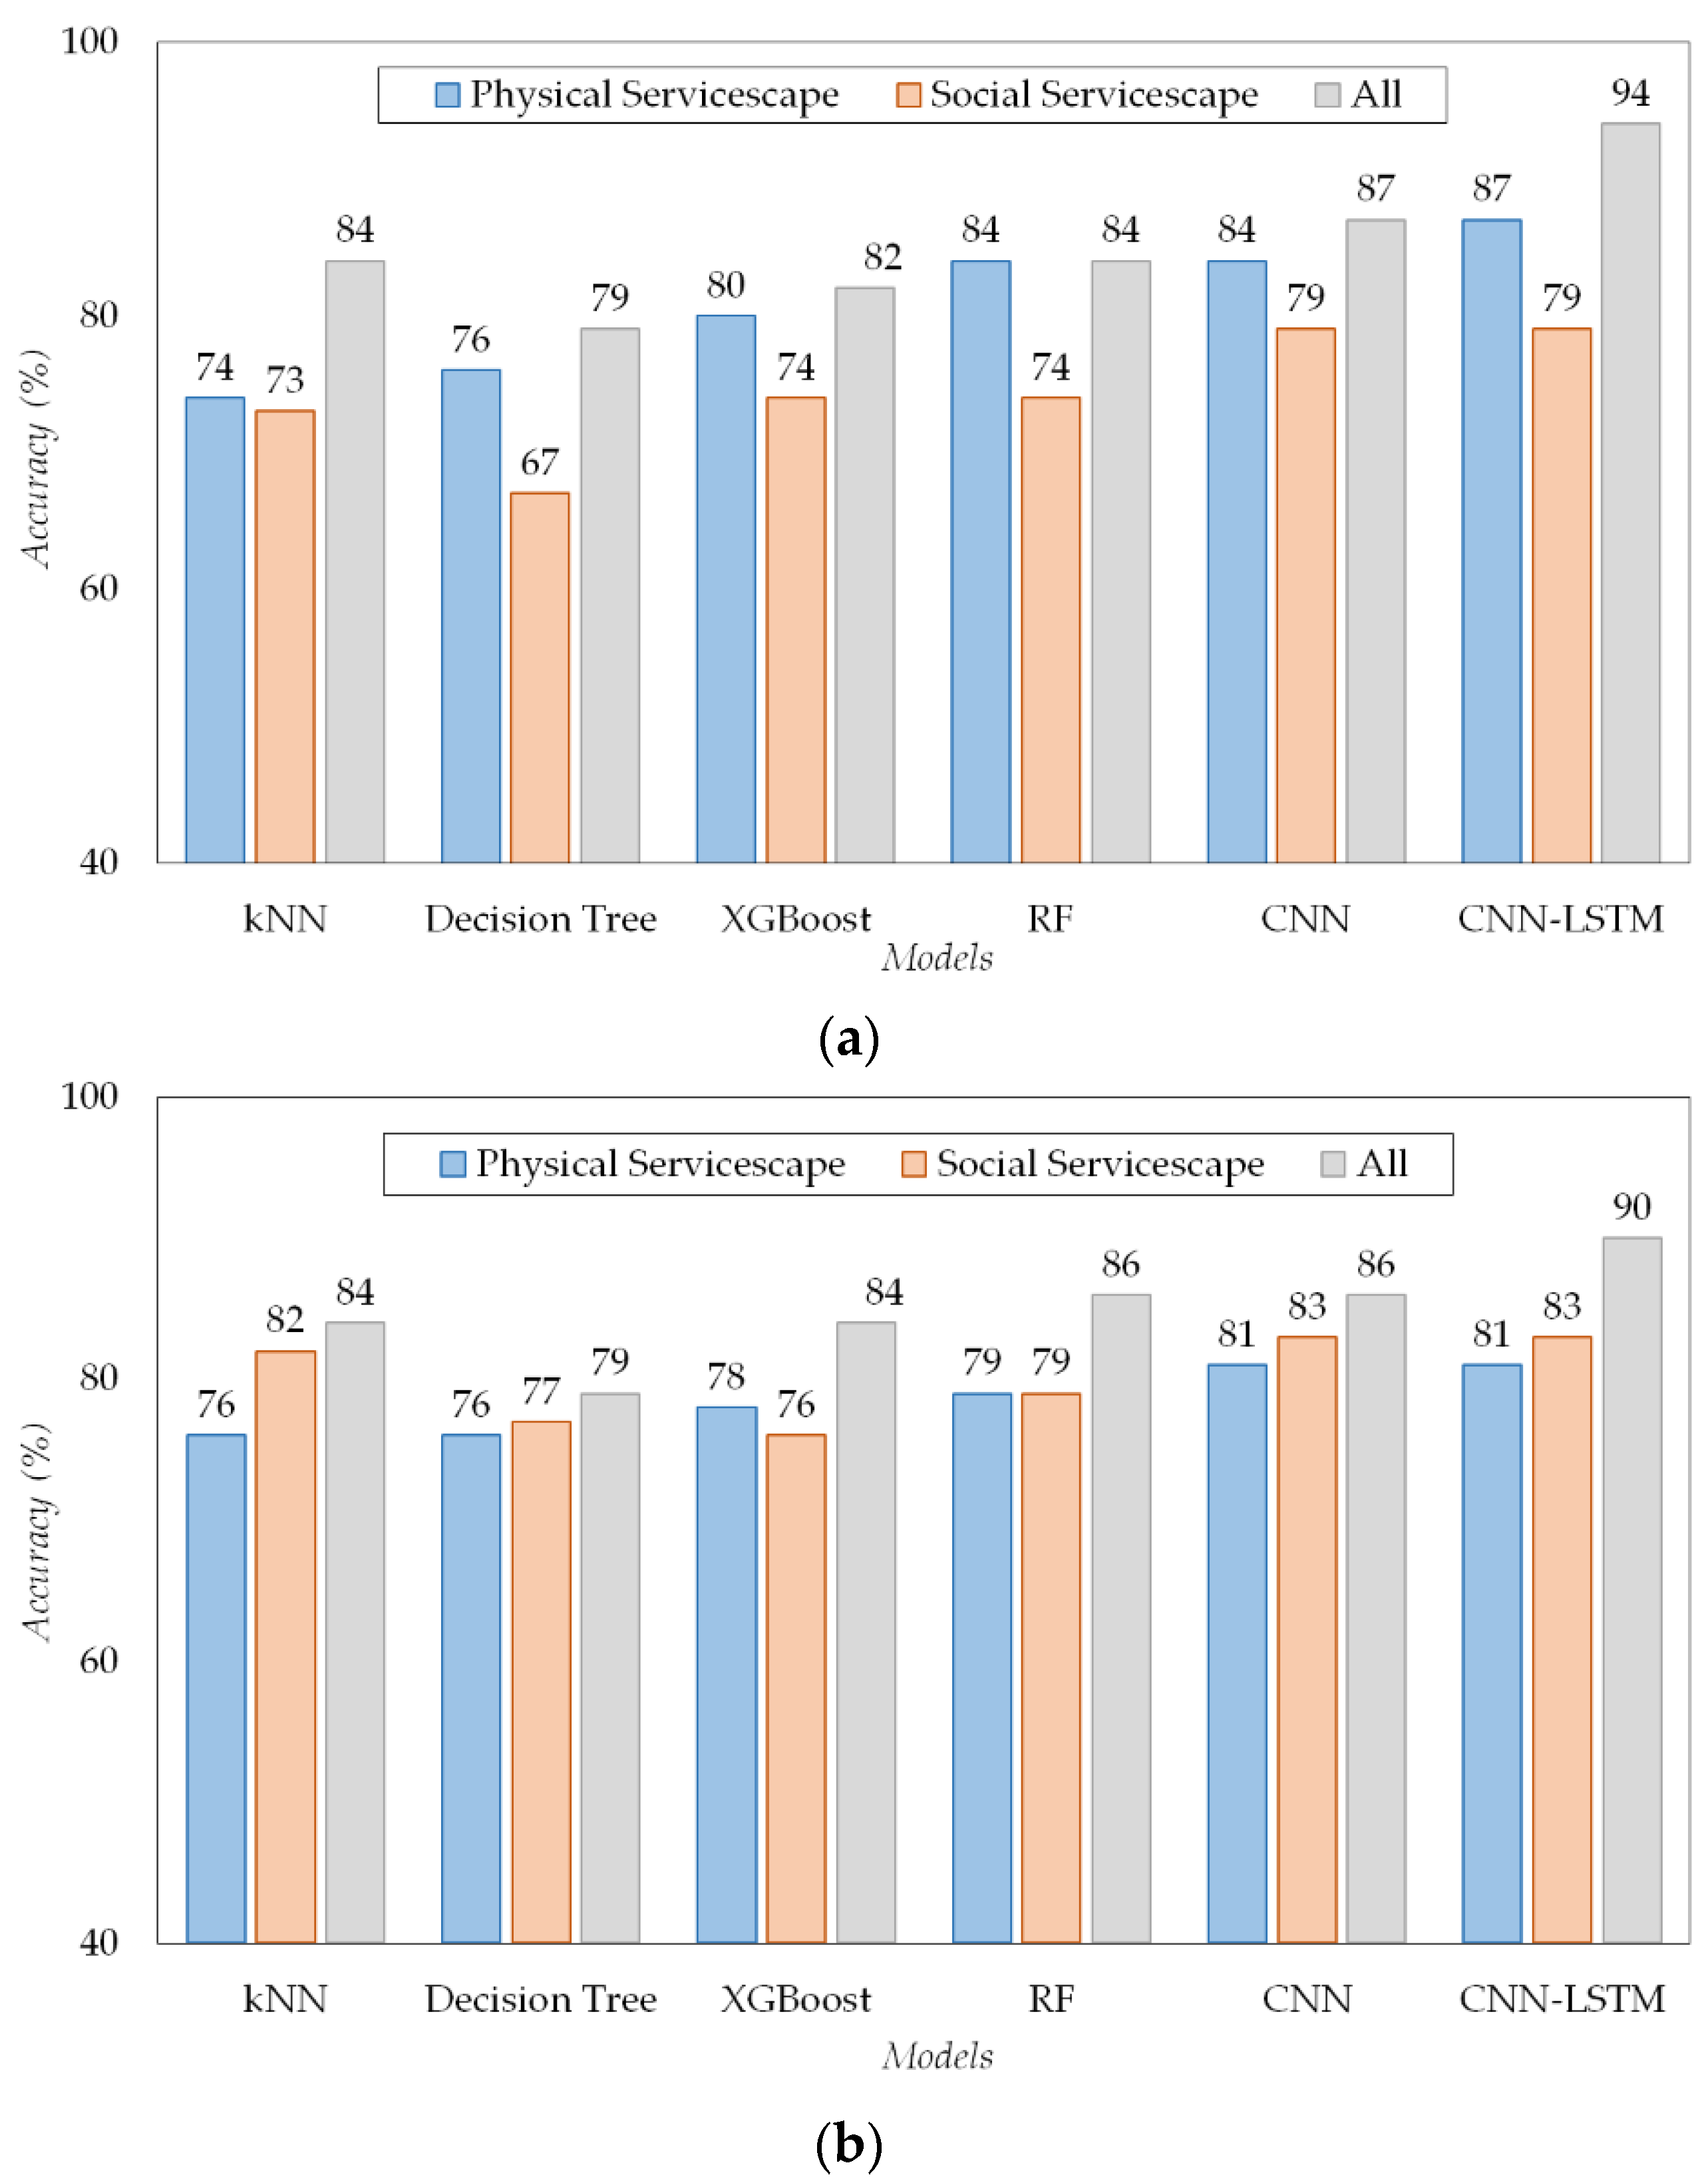
  • Second, we evaluated the performance of various machine learning and deep learning models for predicting customer churn risk and satisfaction from airline customer data. For this study, we selected well-known machine learning models, such as kNN and decision tree, ensemble learning models, such as Random Forest (RF) and Extreme Gradient Boosting (XGBoost), and deep learning models, such as Convolutional Neural Networks (CNN) and CNN Long Short-Term Memory Networks (CNN-LSTM). The experiment results revealed that deep learning models are more accurate at predicting customer churn risk and satisfaction.
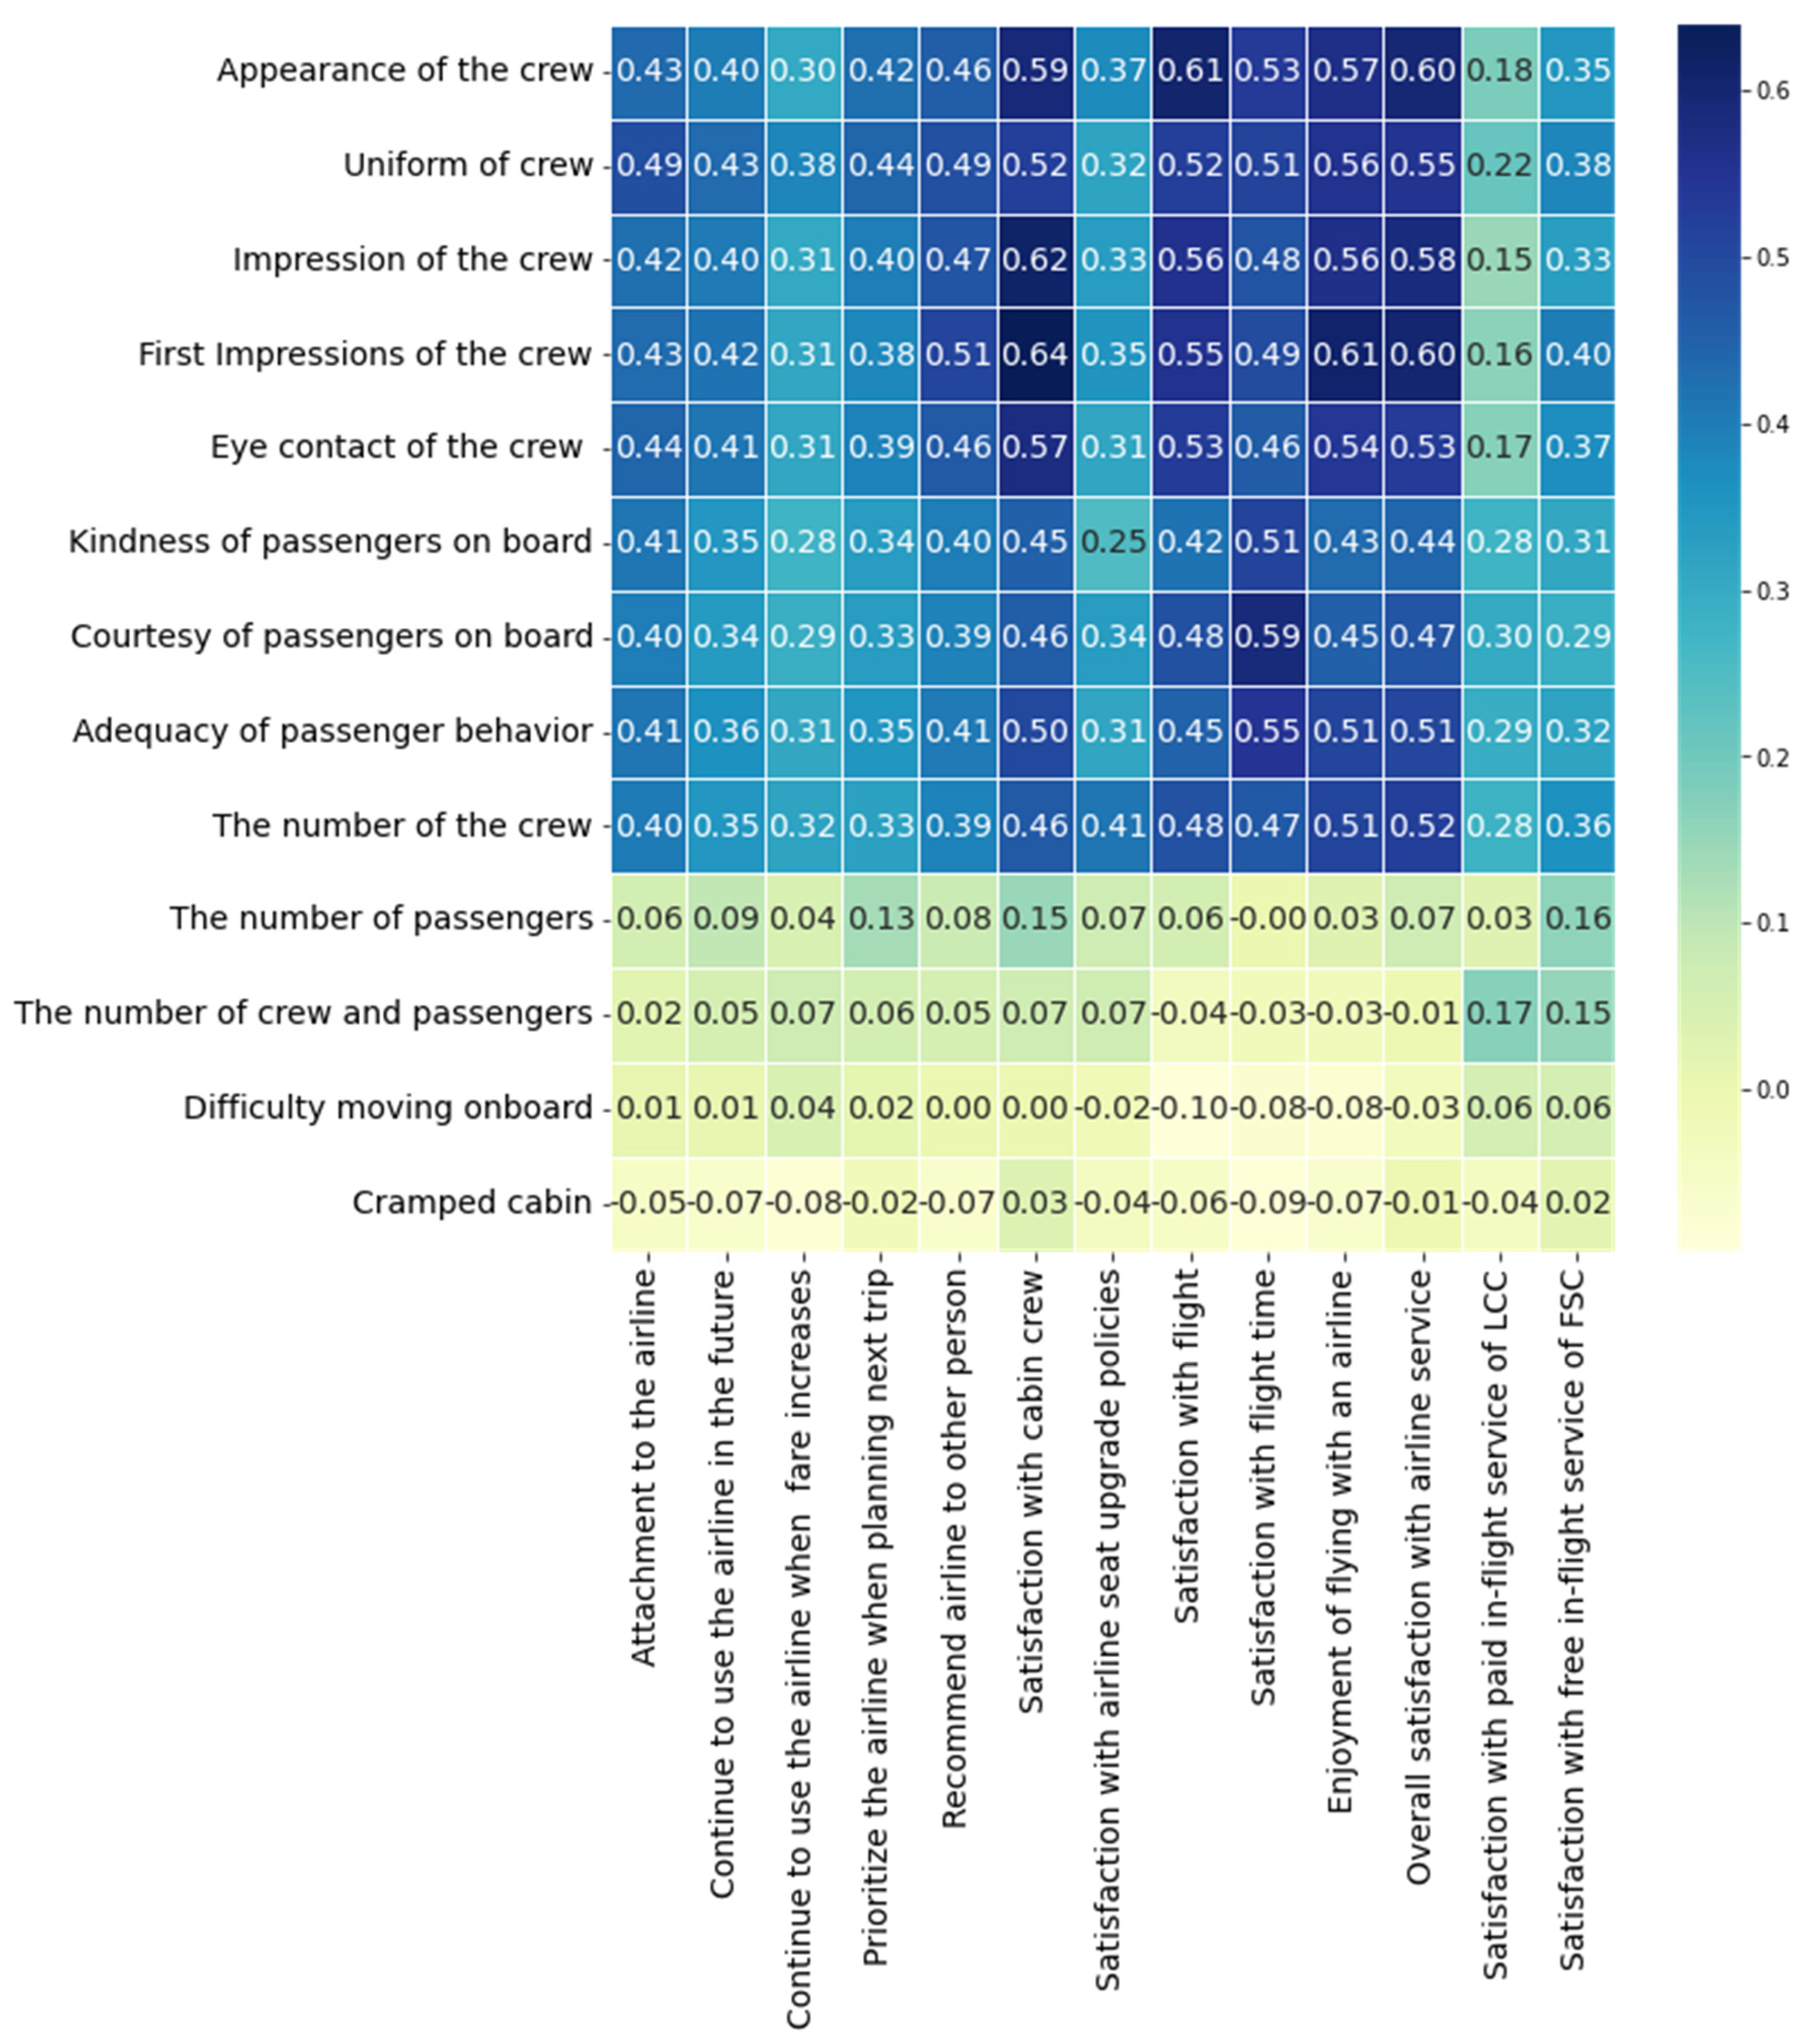
  • Third, we demonstrate that considering the social servicescape in addition to the physical servicescape can significantly increase the model accuracy in predicting the customer churn risk and satisfaction. For this, we consider human services, which constitute the social servicescape, including the viewpoints of the cabin crew and passengers using aircraft. The experimental results demonstrated that the proposed method increased the accuracy of models by up to 10% and 9% in predicting customer churn risk and satisfaction, respectively.
The remaining of the paper is organized as follows: Section 2 reviews the literature related to the airline customer propensities. Section 3 describes the materials and methods used in this study. Section 4 presents the experimental results. Section 5 discusses our findings and concludes the paper.

2. Literature Review

There were various studies that investigated the factors of the airline servicescape influencing customer propensities in the airline industry. In this section, we discuss these studies in detail.
The customer churn risk and satisfaction greatly depend on in-flight services as these are the most direct airline service to customers [6]. Several studies tried to investigate factors of in-flight services that influence customer satisfaction. For example, An and Noh [6] investigated the effect of in-flight service quality, such as in-flight meal and beverage, on customer satisfaction and loyalty. The authors analyzed the passenger data from prestige and economy classes using various statistical tools, such as frequency analysis, reliability and factor analysis, and regression analysis. The results suggest that the quality factors are different according to the customer seat class. In particular, the food presentation style and food quality were essential for the satisfaction of prestige class passengers. A similar study was conducted by Hana et al. [7], who investigated the impact of in-flight meal and beverage quality on customer re-flying intentions. Specifically, the authors used the structural and invariance models to analyze the survey data collected from 302 airline passengers. The findings of this study suggest that the high quality of in-flight meals and beverages can increase customers’ perceptions of price reasonableness and airline image, which are essential factors in determining customer satisfaction and re-flying intention. Park et al. [8] investigated the relationship between several in-flight service factors and customer satisfaction and dissatisfaction. To this end, the authors analyzed the customer data from online reviews based on the Tobit model. The result of the analysis showed that while factors such as cleanliness, food and beverages, and in-flight entertainment have a positive impact on customer satisfaction, check-in and boarding often lead to customer dissatisfaction. Recall from Section 1 that airline service quality is the main factor in obtaining new and retaining existing customers. Therefore, airline companies are using various approaches to improve the quality of physical and social servicescapes. For example, Hwang et al. [9] investigated whether in-flight casinos services will have an impact on customer satisfaction. For this, the authors used multiple-choice experimental techniques to analyze the dataset of casino visitors in South Korea. The experiment results reveal that the diversity of in-flight casino games and a comfortable internal environment could increase brand prestige and lead to customer satisfaction.
Recently, low-cost carriers (LCC) emerged as a business model that significantly affected the airline industry. Considering that LCC minimize a range of onboard services, many studies investigated customer satisfaction in LCC. For example, Chun [10] identified the attributes considered when customers chose to use low-cost carriers and analyzed the attributes having a significant impact on customer satisfaction and return intention. The authors used a SERVQUAL model, factor analysis, reliability analysis, and multi-regression to analyze airline customer data. The experimental results showed that personal services had the most significant impact on overall satisfaction, followed by fares, information provision, and flight services. Due to the pandemic and travel restrictions caused by COVID-19, many airline companies are struggling to attract new customers [4,5]. Hassan and Salem [11] examined the impact of service quality of LCC on customer satisfaction and loyalty during the COVID-19 pandemic. For this study, the authors used a series of statistical modeling techniques, such as a modified SERVQUAL scale, structural equation modeling and regression, to obtain and analyze 299 airline passengers in Saudi Arabian LCC. This study reveals that although LCC minimize a range of onboard services, it is still necessary to improve service quality measures by effectively handling dissatisfied passengers and responding to passengers’ complaints in a timely manner. Shen and Yahya [12] analyzed the impact of service quality and price on LCC from Southeast Asia’s perspective. Unlike other approaches, the authors used the AIRQUAL model with the partial least squares structural equation modeling (PLS-SEM) [30,31] approach to analyze the survey data of 200 passengers. The results of data analysis demonstrate that there is a positive effect of service quality and price on customer satisfaction and loyalty, whereas service quality is more influential than price to determine customer satisfaction. Han et al. [13] compared the impact of various factors in both LCC and FSC of South Korea. Specifically, the authors investigated the core-product, service-encounter quality, brand attitude, image, trust, and love in deciding between LCC and FSC. The authors employed confirmatory factor analysis and structural equation modeling to analyze 345 airline passengers. The results suggest that there is a significant correlation between the studied factors. Particularly, brand attitude, trust, and love were essential in determining the customer intention in selecting between LCC and FSC.
The airline’s physical and social servicescapes are essential factors to understand customer satisfaction. There were several studies that investigated the relationship between the airline servicescape and customer churn risk and satisfaction. For example, Sung and Park [14] analyzed the impacts of the social servicescape on service quality and customer satisfaction. Specifically, the authors used communication by flight attendants as the main factor. For this, the authors used a structural equation model and correlation to analyze airline customer data. The results showed that verbal and non-verbal communication by flight attendants (especially those who worked at overseas airlines) had significant impacts on customer satisfaction and reuse intention. On the other hand, Yu and Hyun [15] used several statistical measurements, including regression and path analysis models, to determine how the behavior of foreign flight attendants can have an impact on the home country’s curiosity and image. The study results suggested that empathy was the essential factor when delivering a service to airline passengers. NG and Henderson [16] investigated the impact of both physical and social servicescapes on in-flight experience. Specifically, the authors statistically verified the influential relationships between in-flight experience and several physical and social servicescape factors, such as in-flight meal and beverage, flight attendants, in-flight entertainment, seat comfort, and legroom. The results of statistical analysis revealed that while seat comfort and legroom were the essential factors in determining the in-flight experience, in-flight entertainment was found to be the least essential. Park and Ryu [32] examined the effect of the physical and social servicescapes on airport visitor behavioral intentions at Incheon International Airport. The authors collected data from 283 airport visitors. The results of structural equation modeling demonstrated that only physical servicescape affected cognitive and affective satisfaction, which are the main factors in determining the airport image. A similar study was conducted by Taheri et al. [33], who analyzed the influence of the physical and social servicescapes of the airport on traveler dissatisfaction and misbehavior. The authors utilized partial least squares (PLS) and multi-group analysis (MGA) methods to analyze a total of 591 traveler data. The result of data analysis revealed that the airport layout might have a negative impact on traveler dissatisfaction and misbehavior. In addition, the results of the study also suggested that the behavior of fellow travelers affected the behavior of other travelers.
Most existing studies on airline customer data analysis discussed so far only used various statistical methods to determine customer satisfaction and loyalty. Therefore, there is a limitation in that the derived results are limited to the following linear format: factor A has an effect of value C on factor B. This linear relationship makes it difficult to visually identify the magnitude of various factors affecting each other in airline customer data. To improve upon these problems, we propose analyzing the airline customer data using various machine learning and deep learning models. There were several studies that applied machine learning to analyze airline customer data. For example, Nicolini and Salini [27] used a well-known machine learning model, decision trees, to determine the essential factors in the evaluation of customer satisfaction in British Airways. Garcia et al. [28] used a combination of kNN and ensemble regression models to predict airline customer satisfaction. Bellizzi et al. [29] employed CART for analyzing highly educated people’s satisfaction with airlines’ services. Hayadi et al. [34] applied various machine learning classification models, such as kNN, Logistic Regression (LG), Gaussian Naïve Bayes (GNB), decision trees, and RF, to determine airline customer satisfaction. A similar study was conducted by Hwang et al. [35], who applied machine learning to predict the next customer of airline services. Gao et al. [36] used machine learning to determine the nonlinear and interaction effects of several factors to understand airline travel satisfaction.
We have the following differences compared with the studies that applied machine learning to analyze airline customer data. First, while most of the studies that dealt with airline servicescapes so far have limited human service to only the cabin crew, the ultimate purpose of this study is to connect airline customer propensities with customer churn risk and satisfaction by extending the human service to the viewpoint of passengers. Second, we applied deep learning to find the relationship between various factors in the airline customer data. To the best of our knowledge, this is the one of the few attempts at applying deep learning to analyze airline customer propensities. Third, compared to some of the studies (particularly [27,28,29]), our work not only finds various relationships between factors influencing airline customer propensities but also includes the comparison of the performance of different machine learning and deep learning approaches.

3. Materials and Methods

This section describes the materials and methods used in this study. Specifically, we first describe the overall flow of the proposed methodology. We then explain the collected data and data preprocessing procedures. Lastly, we introduce machine learning and deep learning models used for the experiments and elaborate on how we evaluated the accuracy of the model.

3.1. Overview

Figure 1 shows the overall flow of the proposed methodology. It consists of three parts: data collection, data preprocessing, modeling training and evaluation steps. First, we collected survey data from the users who have used airplanes at least once within the last five years. This study aims to discover factors influencing airline customer propensities and predict the customer churn risk and satisfaction using the collected data. Second, we performed data preprocessing. Specifically, we removed data from responders who did not complete their survey properly. We then performed the feature selection using Pearson’s correlation. Lastly, we applied various machine learning and deep learning models to determine the best model to predict airline customer propensities. We will describe each part of the proposed methodology in detail in the following subsections.

3.2. Data Collection

For data collection, we conducted a survey of the effect of airline servicescape on customer churn risk and satisfaction. A total of 340 Korean adults, who have used airplanes at least once within the last five years, responded to the 50 questions related to the physical and social environment of the airlines, brand experience, brand loyalty, and customer satisfaction. Due to the decrease in air travel caused by COVID-19 pandemic, the specific time range required for empirical research was limited to customers who boarded an aircraft from 1 January 2016 to 28 February 2021. We conducted the survey for 24 days, from 8 March to 31 March 2021, and used a self-filling questionnaire through Google Docs. For the survey, we considered various characteristics of responders, including gender, age, occupation, number of airlines used within the last five years, frequently used airlines, seat class used for air travel, flight time required for air travel, and purpose of flight. To avoid biases in data analysis, we removed data from 28 responders who did not complete their survey properly. Table 1 shows the details of responders’ characteristics. From the table, we can make initial observations. For example, we can observe that responders frequently take Korean Air and Asiana Airlines over other foreign airlines. We can also observe that despite the higher prices, responders prefer FSC (i.e., Korean Air and Asiana Airlines) over LCC (i.e., Jeju Air, Jin Air, T’way Airlines, Air Busan, or Air Seoul).
We divided the survey questions into five categories to make it easier for responders to differentiate them. Specifically, we used 16 factors for the physical servicescape category (e.g., airplane design and cabin environment), 12 factors for the social servicescape category (e.g., cabin crew, number of passengers on board and their behaviors), nine factors for the brand experience category (e.g., feelings regarding the airline and in-flight meals, and hospitality of cabin crew), five factors for the brand loyalty category (e.g., attachment to the airline, intention to continue to use, and airline recommendation) and eight factors for the customer satisfaction category (e.g., satisfaction with cabin crew, flight, and overall service). The score for each factor was measured as 1, 2, 3, 4, and 5, which represent “very bad”, “somewhat bad”, “neutral”, “somewhat good” and “very good”, respectively. Table A1 shows a summary of all factors. The table also shows a statistical summary (i.e., mean and standard deviation values) of factors, which enables us to make further observations. For example, we can observe that passengers are generally satisfied with the cabin crew of air carriers of South Korea. We can also observe that most of the passengers feel that there is a lack of diversity of in-flight games and readings.

3.3. Feature Selection

Feature selection is a process of removing the features that do not contribute to predictive modeling. It is frequently used to avoid biases in the data analysis process. In this paper, we used Pearson’s correlation to determine the feature set that will be used for data analysis. Pearson’s correlation examines the linear relationship between two variables [37]. Here, if the correlation value between two variables is close to −1, then these variables have a negative relationship. On the other hand, if the correlation value between two variables is close to 1, then these variables have a positive relationship. If the correlation value is 0, then there is no relationship. Equation (1) shows Pearson’s correlation [23]. In the equation, r represents the correlation, and n represents the number of total values. In addition, x and y represent two values that are being examined for correlation.
r = n ( x y ) ( x ) ( y ) [ n x 2 ( x ) 2 ] [ n y 2 ( y ) 2 ]  
Figure 2, Figure 3 and Figure 4 demonstrate the correlation matrix between the physical servicescape, social servicescape, brand experience, and customer churn risk and customer satisfaction, respectively. From these figures, we can make several important observations. For example, Figure 2 reveals that the cleanliness of cabin seats (0.54), aisles (0.58), meal tableware (0.55), and in-flight toilets (0.45) are highly correlated with customer satisfaction. On the other hand, we can observe that diversity in in-flight entertainment items, such as in-flight music (0.31), movies (0.33), games (0.28), and readings (0.36), are less correlated with customer satisfaction. As for customer churn risk (i.e., “Continue to use the airline in the future” factor), we can see that it has a generally similar trend with customer satisfaction. That is, in-flight entertainment items, such as in-flight music (0.38), movies (0.36), games (0.33), and readings (0.32), are less correlated with customer churn risk. On the other hand, airline exterior (0.48), color and design (0.47), and cabin interior (0.45) have a higher correlation with customer churn risk. For the physical servicescape, we considered features with a correlation score above 0.4 as significant. Thus, we excluded diversity in in-flight entertainment factors (i.e., movies, music, games, and readings) from the analysis of customer churn risk and satisfaction.
Recall from Section 1 that, in this paper, we consider human services, which constitute the social servicescape, including the viewpoints of the cabin crew and passengers who use aircraft. The correlation matrix depicted in Figure 3 generally proves our hypothesis of including the viewpoints of the cabin crew and passengers. Specifically, from the correlation matrix, we can observe that appearance (0.6), uniform (0.55), first impression (0.6), and overall impression (0.58) of the cabin crew are highly correlated with customer satisfaction. We can also see that the factors that represent passenger behavior onboard (i.e., kindness, courtesy, and adequacy of passenger behavior) are also essential for customer satisfaction. On the other hand, the correlation matrix reveals that the number of passengers (0.07), the number of crew and passengers (−0.01), difficulty moving on board (−0.03), and cramped cabin (−0.01) factors have less or no correlation with customer satisfaction. We can also observe a similar trend for customer churn risk. That is, while factors related to the cabin crew and passenger behavior have a higher correlation with customer churn risk, factors related to the cramped cabin have less or no correlation. For the social servicescape, we considered features with a correlation score above 0.3 as significant. Thus, we excluded factors related to the cramped cabin (i.e., the number of passengers, the number of crew and passengers, difficulty moving on board, and cramped cabin) from the analysis of customer churn risk and satisfaction.
The correlation matrix in Figure 4 shows that there is a generally positive relationship between all brand experience factors and customer churn risk and satisfaction. Specifically, we can observe that the following factors, such as the psychological comfort associated with the airline, the convenience of the airline cabin, and the hospitality of the cabin crew, are highly correlated with both customer churn risk and satisfaction factors. On the other hand, satisfaction with in-flight meals is less correlated compared with other factors. For brand experience, we considered features with a correlation score above 0.4 as significant, meaning that all factors are selected for the data analysis.

3.4. Competing Methods

Once the feature selection process is completed, we prepare the dataset for model training. For this study, we selected well-known machine learning models, such as kNN and decision tree, ensemble learning models, such as RF and XGBoost, and deep learning models, such as CNN and CNN-LSTM. We selected these models based on their performance in terms of prediction accuracy and processing speed. This section describes each model in detail.
kNN is a well-known model for the classification of data points. It first calculates the distances between the current point and other points. Based on the calculated distances, kNN makes classification decisions by checking the closest k number of points [38]. Although the kNN model is relatively simple compared with other models, it is sensitive to the value of k. In Section 4.2, we will demonstrate how to choose the optimal k based on the cross-validation technique. The decision tree is another well-known model that classifies the data points using a tree structure. It initially starts with a root node that connects the next decision node or terminal node based on certain conditions. Here, a root or decision node represents an input feature, and a terminal node represents an output label. The decision tree is widely used in many applications (e.g., banking applications for loan default prediction) due to its speed and easy-to-understand structure. However, the decision tree suffers from several disadvantages that, in certain cases, may lead to a complex tree structure and overfitting and underfitting problems. The ensemble learning models can overcome the disadvantages of classification models (i.e., overfitting and underfitting, noise handling, and low accuracy). There are mainly two kinds of ensemble learning models: bagging and boosting. The models, which use the bagging technique, train several models parallelly and output average of the result from each model. A representative model that uses the bagging technique is RF. On the other hand, the models, which use the boosting technique, train several models sequentially and improve the next model by the error of the previous model. A representative model that uses the boosting technique is XGBoost [39,40].
CNN is a deep learning model most commonly applied to analyze computer vision tasks such as image and video. However, CNN is also used in classification or regression tasks with tabular data [41]. The structure of the CNN model includes a convolution layer, pooling layer, flatten (i.e., fully connected) layer, and one more dense layer. Here, the convolution layer creates a feature matrix and filters them to compute the input of the next pooling layer. The pooling layer is used to reduce feature dimensions to save processing time. Next, the flatten layer transforms the multi-dimensional output to a one-dimensional input of the next layer. Finally, the dense layer returns the corresponding label of the input. Recently, there have been several applications (e.g., [42]) that have used a combination of CNN and LSTM to improve the accuracy of the data classification task. Likewise, we used the CNN-LSTM model to improve the prediction accuracy of customer churn risk and satisfaction. The main feature of the CNN-LSTM model is that it modifies the underlying structure of CNN by preserving its features. Specifically, the flatten layer in CNN is used to convert data dimensions into one dimension. Instead of converting the data dimensions, we replaced it with an LSTM layer. The LSTM layer computes the correlation between features, and thus, it can return a more meaningful output.

3.5. Evaluation Metrics

To measure the results of the predictive models, we used the classification report, which is frequently used to analyze the quality of models. Specifically, the classification report evaluates a classification quality on a per-class based on the number of true and false predictions using accuracy, precision, recall, and F1 score. Accuracy is the overall accuracy of the model. The precision represents the percentage of correct class predictions the model makes from predicted classes. The recall represents the percentage of correct class predictions the model makes from actual classes. The F1 score is the weighted average of precision and recall [43]. The accuracy, precision, recall, and F1 score are calculated using Equations (2) to (5), respectively. Here, TP (True Positive): when both actual and predicted values are true, TN (True Negative): when both actual and predicted values are false, FP (False Positive): when an actual value is false, and the predicted value is true, and FN (False Negative): when an actual value is true, and the predicted value is false.
p r e c i s i o n = T P T P + F P  
r e c a l l = T P T P + F N
F 1   s c o r e = 2 r e c a l l p r e c i s i o n r e c a l l + p r e c i s i o n
a c c u r a c y = T P + T N T P + T N + F P + F N

4. Results

This section presents experimental results. Specifically, we first describe the experimental environment. We then explain how we trained the models and selected the best parameters. Lastly, we present the results of the experiments.

4.1. Experimental Environment

We used a machine with the following configuration: Intel (R) Core (TM) i7-7700K 4.20 GHz CPU (8 CPUs), an NVIDIA GeForce GTX 1070 GPU, and 32 GB of memory. We installed Windows 10 64 bit by Microsoft for our machine. All experiments were performed using the Python programming language (Version 3.9.9). Specifically, we used the Scikit-learn library (Version 1.0.1) [44] to implement kNN, decision tree and RT models, xgboost library (Version 1.5.1) to implement the XGBoost model, and TensorFlow (Version 2.7.0) to implement CNN and CNN-LSTM models.

4.2. Model Training

Figure 5 illustrates the overall flow of model training. We can divide the model training process into the following steps: data collection, feature selection, splitting dataset, cross-validation, model training, and evaluation. We used the result of the survey as our dataset, which contains 312 data samples in 50 dimensions. Based on correlation scores, we selected 42 features for the final training dataset. After that, the final training dataset was split into training (80%) and test data (20%) and trained using machine learning and deep learning models. To find the optimal hyperparameters of machine learning models, we use cross-validation techniques. The cross-validation technique enables us to select the optimal hyperparameters from a set of options. Lastly, to evaluate and compare the classification models, we used four types of evaluation metrics (i.e., accuracy, precision, recall, and F1 score) explained in Section 3.5.
The performance of machine learning models is sensitive to hyperparameter values. Therefore, it is necessary to determine hyperparameters to build an efficient model with high accuracy. The cross-validation technique used in this paper consists of the following steps: (1) choose several possible values for each hyperparameter; (2) split the training dataset into n number of parts, each part is split into training and testing data again; and (3) a model learns each dataset with all combination of hyperparameters and find the best hyperparameters. In the case of deep learning methods, we found the optimal hyperparameters by training the models with several combinations and selecting the best one. Table 2 and Table 3 show the selected hyperparameters of machine learning and deep learning methods, respectively.

4.3. Experimental Results

Figure 6a,b show the accuracy of different models for predicting customer churn risk and customer satisfaction, respectively. In both graphs, the x-axis represents models, and the y-axis represents the accuracy (in percentage) calculated by Equation (2). The results of precision, recall, F1 scores and accuracy for each model are given in Table 4.
There are two goals of this experiment. The first goal is to determine the most accurate machine learning and deep learning models for the prediction of airline customer propensities. From Figure 6, we can observe that among machine learning models, the RF model achieves the highest accuracy of 84% and 86% in predicting customer churn risk and satisfaction, respectively. Considering that the RF model is constructed in an ensemble manner, it can overcome the overfitting and underfitting issues of other machine learning models studied in this paper. From Figure 6, we can also observe that deep learning models outperform machine learning models in most cases. Specifically, the CNN-LSTM model achieves the highest accuracy of 94% and 90% in predicting customer churn risk and customer satisfaction, respectively. This occurs because the deep learning models generally learn high-level features from the data incrementally, enabling us to automatically discover essential features for classification. Among deep learning models, CNN-LSTM outperforms the conventional CNN model by 7% and 4% in terms of accuracy in predicting customer churn risk and satisfaction, respectively. Recall from Section 3.4 that the main feature of the CNN-LSTM model is that it modifies the underlying structure of the conventional CNN model by preserving its features. Specifically, the flatten layer in CNN model is used to convert data dimensions into one dimension. Instead of converting the data dimensions, we replaced it with an LSTM layer. The LSTM layer automatically computes the correlation between features, and thus, it can return a more accurate output. This experiment proved our first hypothesis that deep learning models are generally more accurate in predicting airline customer propensities compared with machine learning models.
The second goal is to investigate the influence of different airline servicescapes on the accuracy of machine learning and deep learning models. From Figure 6, we can observe that considering social servicescape in addition to physical servicescape improves the prediction accuracy of most models. Specifically, among deep learning models, the CNN-LSTM model achieved the most significant improvement of prediction accuracy (i.e., from 87% to 94% in predicting customer churn risk and from 81% to 90% in predicting customer satisfaction) when considering both physical and social servicescapes. Among machine learning models, the prediction accuracy of the kNN model jumped significantly from 74% to 84% in predicting customer churn risk and from 76% to 84% in predicting customer satisfaction when considering both physical and social servicescapes. This experiment proved our second hypothesis that considering social servicescape factors in addition to physical servicescape factors can significantly increase the prediction accuracy of airline customer propensities.

5. Conclusions and Discussion

In this paper, we have proposed a deep learning approach to analyze airline customer propensities in South Korea. For this, we have first collected data from the users who have used airplanes at least once within the last five years. We then applied several preprocessing techniques to consolidate the collected data, clean invalid data, and select essential features. Lastly, we have evaluated the performance of various machine learning and deep learning models for predicting customer churn risk and satisfaction from airline customer data. Specifically, we selected well-known machine learning models, such as kNN and decision tree, ensemble learning models, such as RF and XGBoost, and deep learning models, such as CNN and CNN-LSTM.
There are several implications of this study. From the theoretical perspective, unlike existing work, our work not only found various relationships between factors influencing airline customer propensities but also included the comparison of the performance of different machine learning and deep learning approaches. We demonstrated through experiments that deep learning models could predict the customer churn risk and satisfaction with accuracy values of 94% and 90%, respectively. Specifically, the deep learning model, CNN-LSTM, outperformed the machine learning models by approximately 11% and 7% on average (in terms of accuracy) in predicting customer churn risk and customer satisfaction, respectively. The experiment results proved our hypothesis that deep learning models are generally more accurate in predicting airline customer propensities compared with machine learning models. The high accuracy of deep learning models and their flexibility in handling a large amount of diverse data indicate that we can apply the proposed methodology to analyze customer prosperities in various fields. For example, we can use the proposed methodology in the banking sphere to analyze the customer satisfaction with the service provider, or we can also explore the customer retention strategies in the telecommunication industry and customer churn risks in various e-commerce applications.
From a practical perspective, while most of these studies that dealt with airline servicescapes have limited human services to only the cabin crew, we have connected airline customer propensities with brand loyalty by extending the human service to the viewpoint of passengers. In order to understand the effect of the physical and social servicescapes of the airline customer propensities, we analyze the relationship with the aircraft cabin and passenger viewpoints. Specifically, we proved through experiments that considering social servicescape factors in addition to physical servicescape factors can increase the accuracy of deep learning models by approximately 6% on average and machine learning models by 5% on average in predicting the customer churn risk and customer satisfaction. On the other hand, by analyzing this relationship, we can obtain meaningful insights related to the cabin crew and passengers and all factors that directly or indirectly affect service experience. From the data analysis in this paper, we could also observe several findings. For example, we observed that the survey participants indicated that they frequently take Korean Air and Asiana Airlines over other foreign airlines. This is explainable as these are the two largest airlines in South Korea. We could also observe that despite the higher prices, more survey participants preferred FSC over LCC. This is also explainable as most survey participants took medium and long-distance flights, whereas FSC would be more comfortable to travel due to plenty of legroom in the cabin and in-flight meal. On the other hand, the result of the correlation matrix also revealed that in-flight entertainment items, such as in-flight music, movies, games, and readings, are less correlated with customer churn risk and customer satisfaction than other factors. This is explainable as in-flight entertainment items are more important for business class than economic class customers. However, among surveyed participants, only 1.4% were from business class.
The service providers (e.g., airline industry managers) may benefit the most from the results of this study. Specifically, the results of this study indicate that the quality of airline servicescape is an essential factor in understanding the customer churn risk and satisfaction. Considering the recent struggles of the airline industry caused by COVID-19 pandemics, the service providers will be able to take the necessary steps to improve the quality of airline servicescape. For example, the correlation matrix also revealed that although social servicescape factors are essential to improve the prediction accuracy of customer churn risk and satisfaction, not all factors are equally important. Specifically, we demonstrated that there is less or no relationship between complexity inside the cabin and customer churn risk and customer satisfaction.
There are several limitations of this work that should be addressed in the future. First, we conducted the survey and collected data that contains only airlines in South Korea. In future research, we plan to explore various international airlines with different corporate cultures to improve result generalizability. Second, we only considered a limited number of factors, such as the physical and social environment of the airlines, brand experience and loyalty, and customer satisfaction. However, customer churn risk and satisfaction may also be affected by other factors (e.g., marketing and management factors). Thus, in the future, we plan to conduct a more extensive survey that takes into account various factors related to marketing and management that could enable us to understand the customer satisfaction from business perspective. Third, we demonstrated the potential of deep learning models in predicting customer churn risk and satisfaction on a limited amount of data. Considering that machine learning and deep learning models perform well with a large amount of data, future research is suggested to involve more participants from different backgrounds for the extension of the proposed methodology. Despite its limitations, this study enhances the existing literature on customer prosperity analysis in the airline industry and can be regarded as a starting point to reveal useful insights and hidden correlations in airline customer data using deep learning models.

Author Contributions

S.-H.P. designed the algorithm and developed the proposed algorithm and writing of the paper. M.-Y.K. and Y.-H.P. shared their expertise with regard to the overall review of this paper and supervised the entire process. Y.-J.K. supported development of algorithm. All authors have read and agreed to the published version of the manuscript.

Funding

This research was supported by the Basic Science Research Program through the National Research Foundation of Korea (NRF) funded by the Ministry of Education, Science and Technology [NRF-2021R1C1C2004282].

Institutional Review Board Statement

Not applicable.

Informed Consent Statement

Not applicable.

Data Availability Statement

Not applicable.

Conflicts of Interest

The authors declare no conflict of interest.

Appendix A

Table A1. Details of factors and their statistical summary.
First Level FactorsSecond Level Factors MeanSD
Physical Servicescape1. Airplane exterior3.7601.027
2. Airplane color and design3.6601.038
3. Design of in-flight service items3.6310.998
4. Cabin interior3.6541.014
5. Cabin colors3.9040.915
6. In-flight air3.7051.063
7. In-flight humidity and temperature3.6631.083
8. Cabin lighting3.9490.865
9. Cleanliness of cabin seats3.8970.965
10. Cleanliness of cabin aisles4.0260.905
11. Cleanliness of meal tableware4.1890.816
12. Cleanliness of in-flight toilets3.9230.961
13. Diversity of in-flight music3.1511.101
14. Diversity of in-flight movies 3.2151.156
15. Diversity of in-flight games 2.8941.171
16. Diversity of in-flight readings2.9041.218
Social Servicescape1. Appearance of the cabin crew4.3850.772
2. Uniform of cabin crew4.1090.934
3. First impressions of cabin crew 4.2980.831
4. Overall Impression of cabin crew4.3620.801
5. Eye contact between the crew and passengers4.3080.798
6. Kindness of passengers on board3.9040.901
7. Courtesy of passengers on board3.9040.942
8. Adequacy of passenger behavior3.8940.880
9. Adequacy of the number of cabin crew on-board3.8400.944
10. Complexity felt due to the number of passengers in the cabin3.5961.052
11. Complexity felt due to the number of passengers & crew in the cabin3.1631.125
12. Difficulty moving on board3.2531.064
Brand Experience1. Positiveness associated with airline mark4.0030.966
2. Psychological comfort associated with airline 4.0320.873
3. Convenience of the airline cabin3.9170.940
4. Enjoyment of using in-flight facilities3.5611.017
5. Attractiveness of airline cabin3.7850.968
6. Satisfaction with in-flight meals3.7880.967
7. Hospitality of cabin crew4.0830.873
8. Communication with cabin crew4.2720.788
9. Language spoken by cabin crew4.1510.832
Brand Loyalty1. Attachment to the airline3.9680.916
2. Continue to use the airline in the future3.8780.986
3. Continue to use the airline when the fare increases3.1311.195
4. Prioritize the airline when planning next trip3.9260.933
5. Recommend airline to other person3.8720.969
Customer Satisfaction 1. Satisfaction with cabin crew4.3140.783
2. Satisfaction with airline seat upgrade policies3.9420.946
3. Satistfaction with flight4.2310.783
4. Satisfaction with flight time4.0540.844
5. Enjoyment of flying with an airline4.2280.841
6. Overall satisfaction with airline service4.2240.781
7. Satisfaction with paid in-flight service of low-cost carriers (LCC)3.2181.205
8. Satisfaction with free in-flight service of full service carriers (FSC)4.1150.898

References

  1. Zeithaml, V.A.; Binter, M.J. Service Marketing; The McGraw-Hill Companies: New York, NY, USA, 1996. [Google Scholar]
  2. Agnihotri, R.; Dingus, R.; Hu, M.Y.; Krush, M.T. Social Media: Influencing Customer Satisfaction in B2B Sales. Ind. Mark. Manag. 2016, 53, 172–180. [Google Scholar] [CrossRef]
  3. Kei, C.M. A Study of Customer Satisfaction in Airlines. Int. J. Trade Econ. Financ. 2019, 10, 144–148. [Google Scholar] [CrossRef] [Green Version]
  4. Sun, X.; Wandelt, S.; Zheng, C.; Zhang, A. COVID-19 pandemic and air transportation: Successfully navigating the paper hurricane. J. Air Transp. Manag. 2021, 94, 102062. [Google Scholar] [CrossRef] [PubMed]
  5. Yimga, J. The airline on-time performance impacts of the COVID-19 pandemic. Transp. Res. Interdiscip. Perspect. 2021, 10, 100386. [Google Scholar] [CrossRef] [PubMed]
  6. An, M.S.; Noh, Y.W. Airline customer satisfaction and loyalty: Impact of in-flight service quality. Serv. Bus. 2009, 3, 293–307. [Google Scholar] [CrossRef]
  7. Hana, H.; Leeb, K.-S.; Chuac, B.-L.; Leed, S.; Kim, W. Role of airline food quality, price reasonableness, image, satisfaction, and attachment in building re-flying intention. Int. J. Hosp. Manag. 2019, 80, 91–100. [Google Scholar] [CrossRef]
  8. Park, S.; Lee, J.-S.; Nicolau, J.L. Understanding the dynamics of the quality of airline service attributes: Satisfiers and dissatisfiers. Tour. Manag. 2020, 81, 104163. [Google Scholar] [CrossRef]
  9. Hwang, J.; Lyu, S.O.; Cho, S.-B. In-Flight Casinos, Is It Really a Nonsensical Idea? An Exploratory Approach Using Different Choice Experiments. Sustainability 2019, 11, 3038. [Google Scholar] [CrossRef] [Green Version]
  10. Chun, C.S. Traveler’s Perceptions of Low—Cost Carrier Selection Attributes and Satisfaction. J. Tour. Enhanc. 2015, 3, 103–111. [Google Scholar]
  11. Hassan, T.H.; Salem, A.E. Impact of Service Quality of Low-Cost Carriers on Airline Image and Consumers’ Satisfaction and Loyalty during the COVID-19 Outbreak. Int. J. Environ. Res. Public Health 2022, 19, 83. [Google Scholar] [CrossRef]
  12. Shen, C.; Yahya, Y. The impact of service quality and price on passengers’ loyalty towards low-cost airlines: The Southeast Asia perspective. J. Air Transp. Manag. 2021, 91, 101966. [Google Scholar] [CrossRef]
  13. Han, H.; Yu, J.; Chua, B.-L.; Lee, S.; Kim, W. Impact of core-product and service-encounter quality, attitude, image, trust and love on repurchase: Full-service vs low-cost carriers in South Korea. Int. J. Contemp. Hosp. Manag. 2019, 31, 1588–1608. [Google Scholar] [CrossRef]
  14. Sung, Y.-L.; Park, H.-Y. The Effect of Communication of Service Employee on Customer Satisfaction, and Reuse Intention. J. Econ. Mark. Manag. 2021, 9, 21–31. [Google Scholar]
  15. Yu, M.; Hyun, S.S. The Impact of Foreign Flight Attendants’ Service Quality on Behavioral Intention Toward Their Home Country—Applied SERVPERF Model. Sustainability 2019, 11, 4136. [Google Scholar] [CrossRef] [Green Version]
  16. Ng, C.; Henderson, I.L. Conceptualising In-Flight Experience: An air Traveller Perspective. ASEAN J. Hosp. Tour. 2021, 19, 291–304. [Google Scholar] [CrossRef]
  17. Krishnan, C.G.; Robinson, Y.H.; Chilamkurti, N. Machine Learning Techniques for Speech Recognition using the Magnitude. J. Multimed. Inf. Syst. 2020, 7, 33–40. [Google Scholar] [CrossRef]
  18. Chen, S.X.; Wang, X.K.; Zhang, H.Z.; Wang, J.Q. Customer purchase prediction from the perspective of imbalanced data: A machine learning framework based on factorization machine. Expert Syst. Appl. 2021, 173, 114756. [Google Scholar] [CrossRef]
  19. Al-Mashraie, M.; Chung, S.H.; Jeon, H.W. Customer switching behavior analysis in the telecommunication industry via push-pull-mooring framework: A machine learning approach. Comput. Ind. Eng. 2020, 144, 106476. [Google Scholar] [CrossRef]
  20. Shukla, A. Application of Machine Learning and Statistics in Banking Customer Churn Prediction. In Proceedings of the 8th International Conference on Smart Computing and Communications, Kochi, Kerala, India, 6 September 2021; pp. 37–41. [Google Scholar]
  21. Xu, Z.; Zhu, G.; Metawa, N.; Zhou, Q. Machine learning based customer meta-combination brand equity analysis for marketing behavior evaluation. Inf. Process. Manag. 2020, 59, 102800. [Google Scholar] [CrossRef]
  22. Mohanta, B.K.; Jena, D.; Mohapatra, N.; Ramasubbareddy, S.; Rawal, B.S. Machine learning based accident prediction in secure IoT enable transportation system. J. Intell. Fuzzy Syst. 2022, 42, 713–725. [Google Scholar] [CrossRef]
  23. Chuluunaikhan, T.; Ryu, G.A.; Yoo, K.H.; Rah, H.C.; Nasridinov, A. Incorporating Deep Learning and News Topic Modeling for Forecasting Pork Prices: The case of South Korea. Agriculture 2020, 10, 513. [Google Scholar] [CrossRef]
  24. Thakur, N.; Han, C.Y. A Study of Fall Detection in Assisted Living: Identifying and Improving the Optimal Machine Learning Method. J. Sens. Actuator Netw. 2021, 10, 39. [Google Scholar] [CrossRef]
  25. Xie, R.; Wu, D. Optimal transport-based transfer learning for smart manufacturing: Tool wear prediction using out-of-domain data. Manuf. Lett. 2021, 29, 104–107. [Google Scholar] [CrossRef]
  26. Park, S.-H.; Park, Y.-H. Audio-Visual Tensor Fusion Network for Piano Player Posture Classification. Appl. Sci. 2020, 10, 6857. [Google Scholar] [CrossRef]
  27. Nicolini, G.; Salini, S. Customer Satisfaction in the Airline Industry: The Case of British Airways. Qual. Reliab. Eng. Int. 2006, 22, 581–589. [Google Scholar] [CrossRef]
  28. Garcia, V. Predicting Airline Customer Satisfaction using k-nn Ensemble Regression Models. Res. Comput. Sci. 2019, 148, 205–215. [Google Scholar] [CrossRef]
  29. Bellizzi, M.; Eboli, L.G.; Mazzulla, G.; Postorino, M.N. Classification trees for analysing highly educated people satisfaction with airlines’ services. Transp. Policy 2022, 116, 199–211. [Google Scholar] [CrossRef]
  30. Hair, J.F.; Hult, G.T.M.; Ringle, C.M.; Sarstedt, M. A Primer on Partial Least Squares Structural Equation Modeling (PLS-SEM), 2nd ed.; Sage: Thousand Oaks, CA, USA, 2017. [Google Scholar]
  31. Hair, J.F.; Sarstedt, M.; Ringle, C.M.; Gudergan, S.P. Advanced Issues in Partial Least Squares Structural Equation Modeling (PLS-SEM); Sage: Thousand Oaks, CA, USA, 2018. [Google Scholar]
  32. Park, J.W.; Ryu, Y.K. Investigating the Effects of Airport Servicescape on Airport Users’ Behavioral Intentions: A Case Study of Incheon International Airport Terminal 2 (T2). Sustainability 2019, 11, 4171. [Google Scholar] [CrossRef] [Green Version]
  33. Taheri, B.; Olya, H.; Ali, F.; Gannon, M.J. Understanding the Influence of Airport Servicescape on Traveler Dissatisfaction and Misbehavior. J. Travel Res. 2020, 59, 1008–1028. [Google Scholar] [CrossRef]
  34. Hayadi, B.H.; Kim, J.M.; Hulliyah, K.; Sukmana, H.T. Predicting Airline Passenger Satisfaction with Classification Algorithms. Int. J. Inform. Inf. Syst. 2021, 4, 82–94. [Google Scholar]
  35. Hwang, S.; Kim, J.; Park, E.; Kwon, S.J. Who will be your next customer: A machine learning approach to customer return visits in airline services. J. Bus. Res. 2020, 121, 121–126. [Google Scholar] [CrossRef]
  36. Gao, K.; Yang, Y.; Qu, X. Examining nonlinear and interaction effects of multiple determinants on airline travel satisfaction. Transp. Res. Part D Transp. Environ. 2021, 97, 102957. [Google Scholar] [CrossRef]
  37. Deng, J.; Deng, Y.; Cheong, K.H. Combining conflicting evidence based on Pearson correlation coefficient and weighted graph. Int. J. Intell. Syst. 2021, 36, 7443–7460. [Google Scholar] [CrossRef]
  38. Gou, J.; Qiu, W.; Yi, Z.; Shen, X.; Zhan, Y.; Ou, W. Locality constrained representation-based K-nearest neighbor classification. Knowl. Based Syst. 2019, 167, 38–52. [Google Scholar] [CrossRef]
  39. Berhane, T.M.; Lane, C.R.; Wu, Q.; Autrey, B.C.; Anenkhonov, O.A.; Chepinoga, V.V.; Liu, H. Decision-Tree, Rule-Based, and Random Forest Classification of High-Resolution Multispectral Imagery for Wetland Mapping and Inventory. Remote Sens. 2018, 10, 580. [Google Scholar] [CrossRef] [Green Version]
  40. Bhattacharya, S.; Maddikunta, P.K.R.; Kaluri, R.; Singh, S.; Gadekallu, T.R.; Alazab, M.; Tariq, U. A Novel PCA-Firefly Based XGBoost Classification Model for Intrusion Detection in Networks Using GPU. Electronics 2020, 9, 219. [Google Scholar] [CrossRef] [Green Version]
  41. Phan, H.; Andreotti, F.; Cooray, N.; Chén, O.Y.; Vos, M.D. Joint Classification and Prediction CNN Framework for Automatic Sleep Stage Classification. IEEE. Trans. Biomed. 2019, 66, 1285–1296. [Google Scholar] [CrossRef]
  42. Chen, C.; Hua, Z.; Zhang, R.; Liu, G.; Wen, W. Automated arrhythmia classification based on a combination network of CNN and LSTM. Biomed. Signal Process. Control 2020, 57, 101819. [Google Scholar] [CrossRef]
  43. AlZoman, R.M.; Alenazi, M.J. A Comparative Study of Traffic Classification Techniques for Smart City Networks. Sensors 2021, 21, 4677. [Google Scholar] [CrossRef]
  44. Pedregosa, F.; Varoquaux, G.; Gramfort, A.; Michel, V.; Thirion, B.; Grisel, O.; Blondel, M.; Prettenhofer, P.; Weiss, R.; Dubourg, V.; et al. Scikit-learn: Machine learning in Python. J. Mach. Learn. Res. 2011, 12, 2825–2830. [Google Scholar]
Figure 1. Overall flow of the proposed methodology.
Applsci 12 01916 g001
Figure 2. Correlation matrix between physical servicescape factors and customer churn risk and customer satisfaction factors.
Applsci 12 01916 g002
Figure 3. Correlation matrix between social servicescape factors and customer churn risk and customer satisfaction factors.
Applsci 12 01916 g003
Figure 4. Correlation matrix between brand experience factors and customer churn risk and customer satisfaction factors.
Applsci 12 01916 g004
Figure 5. The overall flow of model training process.
Applsci 12 01916 g005
Figure 6. Accuracy (%) of different models in predicting (a) customer churn risk and (b) customer satisfaction.
Applsci 12 01916 g006
Table 1. Summary of responders’ characteristics.
VariablesCategoriesn%
GenderMale10333.0
Female20565.7
Age10 s216.7
20 s8226.3
30 s4715.0
40 s11235.9
Over 50 s4915.7
OccupationPublic officials faculty and staff3912.5
Proffesional office worker8226.3
Student8326.6
Service job278.7
Other6019.2
Self-employment216.7
Number of airlines used within the last 5 years1319.9
2–38527.2
4–56520.8
Over 613041.6
Frequently used airlinesT’way Airlines165.1
Asiana Airlines7122.7
Korean Air15248.7
Jeju Air206.4
Foreign Airlines216.7
Jin Air237.3
Air Busan/Air Seoul72.2
Seat class used for air travelEconomy Class26986.2
Business Class3812.1
First Class41.3
Flight time required for air travelMedium distance (4–7 h)12439.7
Long distance (more than 8 h)7624.3
Short distance (1–3 h)11135.5
Purpose of flightVisiting relatives61.9
Business289
Other144.5
Academic/Educational Purpose216.7
Travel24377.9
Table 2. Hyperparameters of machine learning models.
ModelsParametersDescriptionOptionsSelected
kNNn_neighborsNumber of neighbors3, 5, 73
Decision Treemax_depth Maximum depth in tree4, 8, 164
RFmax_depthMaximum depth in each tree4, 8, 164
n_estimatorsNumber of trees in the forest100, 200, 300, 500, 1000100
XGBoostmax_depthMaximum depth in each tree4, 8, 164
n_estimatorsNumber of trees in the forest100, 200, 300, 500, 1000100
Table 3. Hyperparameters of deep learning models.
ModelsOptimizerLossEpochsBatch Size
CNNADAMCategorical Cross Entry1505
CNN-LSTMADAMCategorical Cross Entry1505
Table 4. Precision, recall, F1 score and accuracy of different models.
ModelsPrediction GoalPrecision (%)Recall (%)F1 Score (%)Accuracy (%)
kNNCustomer Churn Risk85848484
Customer Satisfaction84848484
Decision TreeCustomer Churn Risk79797979
Customer Satisfaction80797979
XGBoostCustomer Churn Risk82838282
Customer Satisfaction84848484
RFCustomer Churn Risk85848484
Customer Satisfaction86868586
CNNCustomer Churn Risk88878787
Customer Satisfaction88868586
CNN-LSTMCustomer Churn Risk94949394
Customer Satisfaction92909090
Publisher’s Note: MDPI stays neutral with regard to jurisdictional claims in published maps and institutional affiliations.

