Featured Application
Industry case study from the automotive industry and five development projects.
Abstract
Requirement changes and cascading effects of change propagation are major sources of inefficiencies in product development and increase the risk of project failure. Proactive change management of requirement changes yields the potential to handle such changes efficiently. A systematic approach is required for proactive change management to assess and reduce the risk of a requirement change with appropriate effort in industrial application. Within the paper at hand, a novel method for Proactive Management of Requirement Changes (ProMaRC) is presented. It is developed in close collaboration with industry experts and evaluated based on workshops, pilot users’ feedback, three industrial case studies from the automotive industry and five development projects from research. To limit the application effort, an automated approach for dependency analysis based on the machine learning technique BERT and semi-automated assessment of change likelihood and impact using a modified PageRank algorithm is developed. Applying the method, the risks of requirement changes are assessed systematically and reduced by means of proactive change measures. Evaluation shows high performance of dependency analysis and confirms the applicability and usefulness of the method. This contribution opens up the research space of proactive risk management for requirement changes which is currently almost unexploited. It enables more efficient product development.
1. Introduction
Studies from different development contexts show the high amount of requirements changes [1,2,3,4]. Half of all system requirements are assumed to have a high likelihood of change [5], which is why requirement changes are given priority over additions or solutions, especially in the early phases of development [3]. As an example, the empirical study of a six-year project for the development of an aircraft turbine by the Rolls-Royce company can be cited: In a set of 700 system requirements, more than 1000 adjustments of requirements were documented (addition, change or deletion), of which the majority were requirement changes [3]. The actual extent of the requirement changes is assumed to be even greater, since undocumented requirement changes that do not go through the formal change process are not considered in change statistics.
Every change to a requirement leads to cost increases and additional time required for development. Besides the initial effort, changes to requirements can have an effect on dependent requirements (change propagation). Due to logical or physical dependencies, requirements form a complex network [6]. Therefore, a single requirement change often leads to a series of subsequent requirement changes [7,8,9].
The following example from the development of an LED headlight for BMW [10] illustrates such change propagation: The requirement of the maximum temperature of the LED substrate is critical for the headlight performance. It was initially set at 120 °C. In the course of the development, the maximum temperature was reduced to 90 °C. To reduce the temperature of the LED substrate while maintaining the performance of the headlamp, more LEDs, but with lower energy consumption, had to be considered. This, in turn, required changes of the building-space requirements. So the initial requirement change resulted in interdisciplinary requirement changes for energy demand, number of LEDs, and building-space due to propagation effects.
Efficiently managing such requirement changes is a key challenge in the development of complex systems [2,3,5,11]. However, requirement changes in development practice have been handled reactively, unsystematically, and based on subjective expert assessments so far [12,13,14]. For many years, studies have shown that inefficient management of requirement changes is a major cause of missing the specified project goals (quality, cost, and time) [1,4,15,16,17,18].
Despite these findings, industrial practice lacks tools that go beyond the reactive management of change requests and support a systematic data-based approach to proactive management of requirement changes. Proactive management means forward planning and directed actions to influence the evolution of the change event and frontloading decision situations [19]. It requires the identification and handling of potential requirement changes in the phase before the change need has been captured in a formal change request [20]. Neither commercial software products supporting requirements engineering, such as the market leaders IBM Doors, Sparx Enterprise Architect, or Siemens Polarion [21], offer functionalities for proactive management, nor does sufficient research exist on the proactive management of requirement changes [2,5,13]. Instead, the focus is on reactive management of formally recorded change requests. This is focused on effective decision making and efficient change implementation, but does not enable prevention and frontloading measures. Thereby the action space is limited.
Proactive management of requirement changes can open up this action space and reduce the negative effects by considering the phase before a formal change request (cf. Figure 1). Major action strategies are change prevention [20] and frontloading in order to reduce the change impact [22,23].
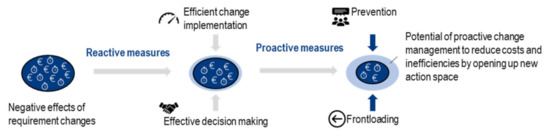
Figure 1.
Potential of proactive requirement change management to reduce negative change effects.
The aim of this research is to unlock the potential of proactive change management for requirement changes in industrial practice. To do so, a support to assess the change risk, comprising change likelihood and impact, as well as a systematic approach to select proactive measures is needed.
On the methodical level, areas of relevance are change management and risk management in product development. Change management approaches [24,25] and guidelines (for instance [26]) support the decision making on change requests and a systematic change implementation, but lack a consideration of pre-change stages decisive for proactive management [14]. Approaches for risk management in product development focus on such pre-change stages, but remain generic for development risks in general [6,27,28] or focus on other risks than requirement changes [29]. Therefore, a support is missing to open up requirement change management approaches towards pre-change stages and gives context specific support for proactive requirement change management.
Looking at the detailed level, areas of relevance for change risk assessment and proactive management are engineering change management (ECM) and requirements change management (RCM). ECM originates from a mechanical engineering background with primary focus on component changes [30], whereas RCM is dominated by approaches on software engineering [31]. Existing approaches are structured by their contribution towards the following three dimensions: requirement change likelihood and change impact (both compose the change risk [32]) as well as proactive measures to manage the change risk. Within each dimension, the approaches are differentiated regarding (1) availability of requirement information to ensure applicability in early development stages and (2) applicability for extensive interdisciplinary requirement sets, especially looking on application effort and usability for interdisciplinary requirements. Those two aspects represent major constraints of the intended application context: early stages of developing complex technical systems [14].
The assessment of requirement change likelihood needs to include change triggers that initiate a change (for instance, volatile customer needs) as well as propagation effects within the requirement network. Initial changes are triggered by factors outside the requirement set (exogenous change likelihood), whereas propagation effects occur between requirements and only occur after an initial change (endogenous change likelihood) [14].
While approaches such as [5,6,9,23,33] assess propagation effects, initial change triggers are not taken into account. Propagation analysis is carried out manually or automatically. Approaches with automated analysis enable application on extensive requirement sets with reasonable effort, but lack the availability of requirement information in context of requirement changes [23] or differentiation of requirement dependencies by propagation behavior (for instance, by dependency type [5,33]) to ensure accuracy of results. Through use of expert evaluation, the required information is available for manual approaches such as [6,9] to the extent of the present system understanding. System understanding includes evaluation of propagation behavior. The disadvantage of manual approaches lies in the application effort. Since an evaluation of each requirement pair is required for dependency analysis, manual approaches become impractical for extensive requirement sets [5].
Requirement change impact assessment is influenced by the direct impact of the initial requirement change as well as subsequent impacts from change propagation. A consideration of both is required to assess the collective change impact. This is only carried out by [34], but this approach requires a large database with pairwise requirement analysis to perform Monte Carlo Simulation. Although the analysis itself is automated, creation of the database is equally effortful as manual likelihood assessment and therefore not suitable for extensive requirement sets. Additionally, the assessment of the direct change impact is unaided and based on expert assessment, which implies subjectivity of results and further application effort. The change prediction method (CPM) is well established in ECM and builds the basis for several other approaches. The CPM itself is focused on propagation effects between components and solely relies on manual expert assessment [9]. Advances to reduce subjectivity of assessment and include requirements such as [8] increase the accuracy of the results and suitability for requirement change management, but still lack applicability for extensive requirement sets. This issue is addressed by automated approaches based on dependency models [5,10,35,36,37] or historical change data [23]. For those approaches, the availability of required information is limited, since dependency models of requirements are missing in the early stages or need to be created by experts. Additionally, there are no sufficient databases on historical requirement changes that contain information on change propagation and impact [14].
Proactive Measures to manage the requirements’ change risk are introduced by risk management literature in the first place. They can be structured by category (avoidance, transfer, reduction and acceptance [27]) and aim to reduce the likelihood or impact of a potential requirement change. Existing approaches provide methods for individual elaboration of appropriate measures (for example, creativity techniques such as brainstorming [38] or Six Sigma DMAIC cycle [28]) or list generic risk measures (for instance [27,39,40]). Neither a support to select appropriate measure based on the present requirement risk characteristics nor an overview of context specific risk measures for requirement changes are given.
The lack of research in proactive management of requirement changes also becomes visible in established requirements engineering software products such as IBM DOORS or Siemens Polarion Requirements. Existing functionality enables modeling requirement dependencies and track changes manually (traceability). They do not support automated dependency detection besides inconsistency analysis, capturing of change risk data or the selection of proactive measures. Looking at Microsoft Office, which is often used for requirements engineering in small and medium-sized enterprises [21], the deficit is even more severe, since it does not support dependency analysis and change risk assessment at all.
Overall, there is a lack of research in the following areas:
- −
- Methods for holistic assessment of requirement change likelihood (exogenous and endogenous) and change impact (direct and subsequent).
- −
- Approaches to reduce the application effort of risk assessment without relying on datasets, which are unavailable in the context of proactive requirement change management (especially for dependency analysis).
- −
- Support to select proactive measures based on the requirement change risk.
On that account, the contribution at hand aims to answer the following two research questions (RQ):
- −
- RQ 1: How can the change risk of requirements be assessed in the early stages of developing complex technical systems?
- −
- RQ 1.1: How can requirement dependencies be identified and differentiated by change propagation behavior?
- −
- RQ 1.2: How can the endogenous and exogenous change likelihood of a requirement be assessed?
- −
- RQ 1.3: How can the collective change impact be assessed?
- −
- RQ 2: How can the selection of proactive measures for requirement changes be supported?
The article is structured as follows: Section 2 presents the research design. The method for proactive change management of requirements and the according software prototype are explained in Section 3. In Section 4, evaluation of the method is carried out. Finally, the results are discussed in Section 5 and an outlook is given.
2. Materials and Methods
The research approach to develop a method for the proactive management of requirement changes is based on the research process for applied science according to ULRICH [41]. The process was selected, because it is suggested especially for research questions requiring industry feedback parallel to all research steps. Thereby it ensures practical relevance of the solution. This is a difference to other methodologies (for instance [42,43,44,45]), which give flexibility to do so, but do not encourage integration of industry to such extent. Additionally, ULRICH’s approach provides a flow logic which is suitable for bounded research projects (e.g., PhD projects), whereas other methodologies better suit extensive endeavors. ULRICH defines a flow logic without explicit support for the implementation of the individual steps. For this reason, elements of the Design Research Methodology (DRM) according to BLESSING and CHAKRABARTI [46] were used as a supplement. The DRM offers comprehensive support for the conceptual design and implementation of research phases and is structurally compatible with ULRICH’s flow logic. In contrast to other methodologies, the DRM focuses on exploring new solution approaches to support design research in the technical area, so that frameworks and conventions of the given context of this research were considered. Specifically, the evaluation concept was used: support evaluation in parallel to the development, followed by an applicability and success evaluation after the development.
To continuously integrate needs from industrial practice, a cyclical procedure consisting of a preliminary and a main study was chosen. All procedural steps are performed twice in both the preliminary study and the main study. In the preliminary study, an initial solution approach was developed and applied in three industry case study projects. The findings from the first cycle were published previously (for details, see [14]). The results were used to specify the research objective, deepen the understanding of the application context, elicit requirements for the method and validate solution approaches at an early stage. In the main study which is described in the contribution at hand, a targeted optimization of the method was carried out on this basis. Within the cycles, iterations were carried out as needed in order to take new findings into account.
The initial steps were to select and structure problems relevant to practice, investigate the context of the method to be developed, identify and evaluate solution approaches and define the research gap. Since no solution approaches have been established in industrial practice so far, the identification of relevant research approaches was carried out by means of literature analysis. Starting with the evaluation of literature studies, the findings were updated and enriched by means of a systematic literature analysis in the databases Google Scholar, Scopus, Library of the Design Society and Science Direct. Delimitation matrices were used as tools for evaluating and comparing the approaches as well as to highlight the research gaps (cf. Appendix A).
Based on the research gap, requirements for the method were defined (Section 3.1). Requirements for the method are called success criteria from now on, to prevent misunderstanding with the system requirements as subject for a newly developed method and research questions. The validity of success criteria was ensured by a combination of literature review and requirements elicitation with industry users. In the literature analysis, the success criteria of existing solution approaches were evaluated and checked for validity regarding the method to be developed. For the elicitation of requirements from a practical perspective, three workshops with industry experts from an internationally leading engineering service provider were conducted:
- Requirement elicitation (3 h, 8 participants: head of department, project leader, team leader, process owner, requirements engineer, developer and subject matter expert).
- Detailing and prioritization of requirements (2 h, 8 participants: see above).
- Definition of use cases and check for completeness of requirements (2 h, 2 participants: requirements engineer and process owner).
Finally, the results were consolidated and 15 success criteria for the method were specified.
The development of the method for Proactive Management of Requirement Changes (ProMaRC) (Section 3.2, Section 3.3 and Section 3.4) is focused on the fulfillment of success criteria by regularly subjecting the solution elements to internal feasibility studies and test applications by industry users. For internal feasibility studies, in-house training and test data were generated. The dataset consisted of manually generated development data of an intelligent articulated robot arm (145 requirements and a dependency matrix with 21.025 entries; created based on the open-source project “BCN3D Moveo”) and data from four student development projects on power tools such as a cordless screwdriver or laser range finder (each about 20 requirements and the corresponding dependency matrix). After internal testing, expert feedback for each solution element was gathered. To enable testing, a software prototype was implemented. The test applications of software prototype functions, monthly exchange meetings and 8 workshops with three industry experts (each 2 h, 3 participants: head of department, requirements engineer and process owner) were used to gather feedback from practitioners. The result of this step was the fully developed method that has already been tested for functionality.
The final evaluation of the method was conducted in the application context (development of a complex technical system) to evaluate applicability and success as well as to identify remaining potential for improvement (Section 4). Applicability includes the examination whether the intended effect is achieved. Success goes beyond this and investigates whether the intended effect contributes to an increased efficiency in the development according to the expectations. For this purpose, the method was used in an industry case study (engine control unit for thermo management with 63 requirements and corresponding dependency matrix). Data from the development project were used to quantitatively evaluate the success criteria to ensure usability and quality of results. The degree of fulfillment of the remaining success criteria was determined with four industrial pilot users. Besides the two case studies mentioned before, pilot application of the method was carried out for two additional industrial projects (redesign of engine control unit and platform for engineering data). Feedback is gathered in eleven workshops (cf. Appendix B; workshops are labelled W1…W11) as well as using questionnaires and conducting interviews. The research methodology is displayed in Figure 2.
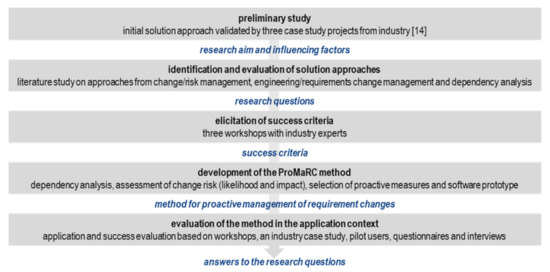
Figure 2.
Research methodology.
3. Method for Proactive Management of Requirement Changes
Within this Section, the ProMaRC method is introduced. First, the success criteria to guide development and evaluation of the method are defined (cf. Section 3.1). Second, the ProMaRC method is explained in detail. It consists of the two major steps, change risk assessment (cf. Section 3.2) and selection of proactive measures (cf. Section 3.3). Lastly, the software prototype to support application of the method is presented (cf. Section 3.4).
3.1. Success Criteria for the Method
Success criteria are defined to direct the development of the method and enable its evaluation. To ensure validity of criteria, insights from preliminary research project (c.f. Section 2) as well as literature findings [2,13,23,30] are used as a basis. As part of the preliminary study, an initial version of ProMaRC was implemented as a software prototype and used in three industrial case study development projects. Feedback was gathered using a questionnaire and interviews with industry practitioners. For this research, an initial list of success criteria was derived from the findings and discussed in two workshops with eight industry experts (head of department, two project leaders, team leader, process owner, subject matter expert, requirements engineer and a developer) from a leading engineering service provider. The first workshop was focused on completeness [W1] and second workshop on priority and refinement [W2]. As a result, a list of 14 success criteria is defined (cf. Table 1).

Table 1.
Success criteria (SC).
3.2. Change Risk Assessment
Change risk assessment builds the core of ProMaRC. It follows a three-step approach: requirement dependency analysis, change impact assessment and change likelihood assessment. Whereas the steps impact assessment and likelihood assessment are required for risk determination, the dependency analysis is added as a separate step due to its importance. It builds the basis for both follow-up assessments and has a strong influence on application effort and accuracy of results.
3.2.1. Requirement Dependency Analysis
To find the most promising approach for requirement dependency analysis, different alternatives are tested.
First, a manual approach was used as part of the preliminary study. A key disadvantage of manual approaches is an exponential growth of application effort per requirement due to pairwise analysis procedure. This makes them unsuitable for requirement sets with about 30 requirements or more. To solve this issue, requirements were assigned to categories (for instance, main features [47]), for which generic dependencies are identified beforehand. Although the exponential growth is removed, evaluation with industry experts still includes criticism of application effort for assignment of each requirement to a category. The generalization of this approach led to a reduced accuracy of results [14].
The second approach tested was based on an ontology. As proposed by [48], requirements are assigned to ontology elements, which are defined and connected by experts in advance. Assignment can be carried out manually or automatically, for example by means of machine learning. Manual assignment has equal disadvantages as the first approach. Automated assignment solves the disadvantage and seemed promising. However, discussion with industry experts indicated, that the experts’ insufficient system understanding in early development stages limits the completeness and accuracy of the ontology itself. To identify a different approach, a literature study was conducted on potential solution classes [49].
Considering previous findings, a natural language processing approach based on machine learning techniques for dependency analysis was selected as a third approach to be tested. This enables a fully automated dependency analysis without expert knowledge needed. Since semantic similarity analysis (for instance [10]) might miss dependencies (for instance, synonyms or physical effects) and is not able to differentiate dependency types (indicator for propagation behavior), an approach for content-based dependency analysis is used. Bidirectional Encoder Representations from Transformers (BERT) learns from contextual relationships of words within text corpuses and enables such content-based analysis as well as a differentiation of dependency types [50]. To assess performance of BERT, it was compared with the following approaches commonly used as performance benchmarks: Multinomial Logistic Regression (MLR) and Support Vector Machine (SVM) as well as Recurrent Neural Network (RNN).
As a database for comparison, the case study data from intelligent articulated robot arm was used (80/20 training to validation set). Criteria for comparison are Precision, Recall, F1-Score and the Receiver Operating Characteristic Area Under the Curve (ROC_AUC). Precision (positive predictive value) near 1 indicate reliable models. Recall (true positive rate) close to 1 indicate the recognition of relevant elements. The F1-Score is the harmonic mean of precision and recall. It measures the extent to which the classes are distributed in a balanced manner and indicates accuracy of the model. ROC_AUC measures performance of a classifier and observes the relationship between true positive rate and false positive rate. This metric is often used to evaluate unbalanced data. Values close to 1 are considered reliable [51].
To ensure significance of the results, comparison criteria needed to be viewed macro averaged (equal weight on all classes). This is necessary since the dataset is unbalanced and has a major class (“none”) and several minor classes (dependency types such as “requires”). Using random oversampling and class weighted as standard data augmentation approaches, BERT outperforms the other models (cf. Table 2).
Table 2.
Comparison of the results for detecting requirement dependencies (random oversampling).
Precision, Recall and F1 values of BERT are good in terms of a multi-class classification problem and ROC_AUC is close to the optimum. Therefore, BERT is used for dependency analysis (cf. Figure 3). Before dependency analysis itself can be conducted, data preprocessing is required to transform requirement data into the required form (vectors). Then, classification of requirement dependencies is implemented by means of a BERT model. The model is based on a generic pretrained model and fine-tuned for the intended task. As a last step, the dependency data are transformed into common data formats (for instance, csv files) for further usage.
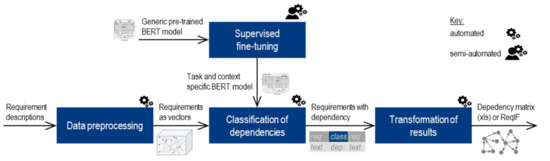
Figure 3.
Overview of the steps for requirement dependency analysis.
Pre-Training and Context-Specific Fine-Tuning
In order to train encoder-decoder models such as BERT, two different types of training are needed: pre-training and context specific fine-tuning. Pre-training is carried out with large amounts of textual data (for instance, from Wikipedia and book corpora). The aim is to train the model to identify contextual related text data [52]. Pre-trained models are generic and can be used from open source databases (in this case hugging [53]).
After pre-training, the model is fine-tuned to the individual task and context. For dependency analysis, a classification layer is put on top of the transformer output, to enable BERT to determine predefined (dependency) classes. Fine-tuning is carried out in a supervised manner with labelled text dataset (case study data on intelligent articulated robot arm). The same as for comparison, requirement data were artificially enhanced using random selection and weighted by classes for data augmentation to compensate imbalances in the dataset. After fine-tuning, a task and context specific BERT model is usable for dependency analysis.
Data Preprocessing
To transform requirement data into a suitable data format for dependency analysis, data preprocessing is required. Input data (textual requirement descriptions) need to be cleaned and transformed into a mathematical representation (vectors). First, requirements are formed into an ongoing text of two input requirements (text field) added by a dummy label (label field). The dummy labels will later be changed into a dependency type. Then, requirement text is tokenized—splitting the sentence into single words and categorizing them (stop word vs. content word). To do so, the BERT tokenizer was used [54]. Finally, the text data can be transformed into a vector representation and used as input for the BERT model.
Classification of Dependencies
To identify dependencies, the preprocessed input data are analyzed with fine-tuned BERT model. Its task is to determine the estimated dependency type between two requirements. To indicate the propagation behavior, the dependency types “refines”, “refined by”, “requires” and “required” are significant [55]. For this reason, these four types are classified. Classification is carried out fully automated. The result is a dataset of the requirement text and their estimated dependency type.
Transformation of Results
For further usage of dependency information, the output of the BERT model needs to be transformed into a suitable data format—such as xls or ReqIF. The most suitable data format is dependent from the intended use. In this case, a list of the requirements and their classified dependency type is created in xls data format, which can be used for impact assessment and change management.
3.2.2. Requirement Change Impact Assessment
For requirement change impact assessment, the influencing factors need to be differentiated (cf. Figure 4). The starting point is an initial change request from an exogenous change initiator (for instance, a customer). Implementing this change leads to an impact directly associated with changing the affected requirement (local change impact), but also sends out subsequent change impulses to other requirements (consecutive change effects). Those exist due to requirement dependencies and need to be implemented to ensure consistency and validity of the requirement set. Usually, changes caused by consecutive effects are referred to as change propagation [5,7,9]. By adding up the local change impact of all requirements on a propagation path, the collective change impact of the initial change request can be assessed [55].
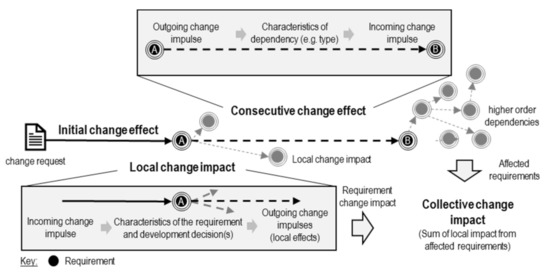
Figure 4.
Basic elements of change impact analysis [55].
To assess the collective change impact, the consecutive effects are determined first (cf. Figure 5). This is implemented automatically based on the results from the dependency analysis. Dependencies are weighted by their type to indicate propagation behavior and requirements are weighted by priority to indicate local change impact. As a second step, the weighted requirement network is analyzed by means of a modified PageRank algorithm to identify critical requirements. Those are selected and evaluated regarding collective change impact manually by experts as a last step. In the following, the three steps to assess the change impact are explained in detail.
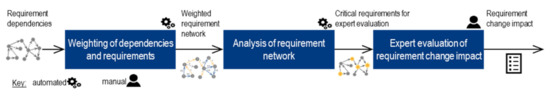
Figure 5.
Overview of the steps for assessment of requirement change impact.
Weighting of Dependencies and Requirements
The weighting of dependencies and requirements is carried out in two steps. First, the dependencies are weighted to estimate the consecutive effects of a change in requirements. Then, the requirements are weighted based on the expected local effects.
The evaluation of the consecutive effects of a requirement change is based on the propagation behavior of a certain requirement dependency. The existence of a dependency is a prerequisite and determines whether a requirement can be affected by the original change. The type of dependency indicates the propagation behavior between two requirements. In order to identify dependencies which can lead to a change propagation, dependency types from existing reference models [56,57,58] are considered. Three categories are derived: mandatory propagation, possible propagation and no propagation are classified.
The differentiation is based on previous studies on propagation behavior by dependency type [59,60]. Since those were made in the context of software development, the validity for interdisciplinary systems was checked based on a requirement set of an example system (drone). Starting with the assumption that all dependencies have mandatory propagation behavior, this assumption tried to be falsified for each dependency type by finding exemplary constellations without mandatory propagation. This was repeated for not mandatory propagation. The results were consistent with the findings from software development, so that the following categorization of dependency types was used to evaluate the consecutive effects of a requirement change:
- Mandatory propagation behavior: requires, is required by and is refined by
- Not mandatory propagation behavior: positive/negative correlation
- No propagation behavior: refines, cost and value
The weighting of the dependency types of a category is based on the propagation likelihood. For the category mandatory propagation this is 100% (weighting = 1) and for the category no propagation this is 0% (weighting = 0). The weighting of the category not mandatory propagation can be determined context specifically depending on risk affinity or static data on the propagation likelihood. As an example, a weighting of 0.5 is used.
The categorization of the dependencies according to propagation behavior is used to weight the edges in the requirement network and thus to enable a statement about the consecutive effects (cf. Figure 6). Compared to existing approaches with binary differentiation regarding the existence of a dependency, the differentiation of the dependency types allows a more precise evaluation. The result of this step is weighted edges in the requirement network as an indicator for consecutive effects of a requirement change.
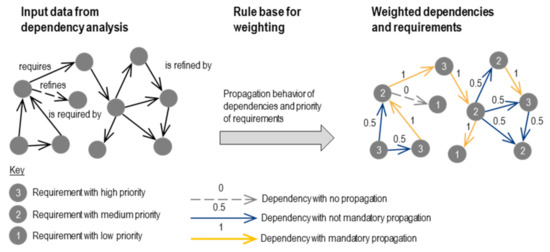
Figure 6.
Weighting of dependencies (edges) and requirements (nodes) within the requirement network.
Using the weighted edges (dependencies) in the requirement network, propagation paths can be identified and the requirements lying on them can be examined with regard to local change effects. Predictions about the local effects are used to weight the nodes in the requirement network (cf. Figure 6). The requirement priority was selected as an indicator for the local effects of a requirement change. The priority allows one to conclude the significance for project success and has two advantages: high availability in the requirements data and ability to be evaluated automatically. The alternative is a manual rating by experts. Presumably this leads to higher accuracy but causes high application effort, since every requirement need to be rated individually. Within the preliminary study, manual rating was judged by users to be too time-consuming for industrial practice. Therefore, the requirement priority is used.
Depending on the company-specific prioritization scheme, weighting factors can be defined. Since many prioritization schemes follow a threefold structure (for instance, enthusiasm characteristic, performance characteristic and basic characteristic) [61], a differentiation into high (weighting = 3), medium (weighting = 2) and low priority (weighting = 1) is used as an example. The result of this step is weighted nodes in the requirement network as an indicator for local effects of a change.
Analysis of Requirement Network
The weighted requirement network is evaluated automatically regarding expected change impact. Critical requirements are selected. Evaluation of the requirement network is based on the PageRank algorithm [55] (based on [62,63]). Context-specific adaptation of the original PageRank algorithm is required to account for the weighting of dependencies and requirement as well as the direction of dependencies. For impact analysis, only the outgoing dependencies of a requirement are relevant, since only such dependencies can be used for change propagation.
The basic PageRank function is the efficient analysis of dependencies in big networks. The aim is to determine a ranking as a statement about the connectivity of an element within the network. The original functionality of the PageRank algorithm according to Brin and Page [64] is an iterative adjustment of the connectivity value of an element based on outgoing and incoming dependencies. The iterative calculation is terminated as soon as the connectivity values are stable. The computational logic of the PageRank algorithm was developed to determine a ranking of results for web search engines [64] and is highly efficient in analyzing a large number of network elements while considering higher order dependencies. Thus, the algorithm solves the problem of existing solution approaches, which have an exponential increase in required processing effort per network element added [63].
For the modified PageRank algorithm (cf. Equation (1)), the weighting of the dependency between two requirements and is considered in a first step. The number of incoming dependencies and outgoing dependencies of a requirement is also considered unchanged. As an initial value for the iterative adaptation, an equal weighting of the requirements is assumed , where n is the total number of requirements in the network. In addition, a damping factor [0; 1] is required to resolve infinite loops in circular dependencies. The damping factor specifies the likelihood with which random propagation occurs. In terms of content, this can be justified by the uncertainty whether all existing dependencies are detected during the dependency analysis. The more exact the results of the dependency analysis are, the smaller the difference is to . In this context, has been shown to be robust [63]. The equation for the modified page rank of a requirement is as follows:
To evaluate the impact of a requirement change, the equation must be adapted to the direction of the dependencies as well as the weighting of a requirement in a second step. The weighted Active Rank is introduced as a new characteristic value (cf. Equation (2)). In contrast to the original PageRank algorithm, the outgoing dependencies and not the incoming dependencies are meaningful for propagation. Taking this into account, and are swapped in the equation. The occurrence of local change effects (weight of a requirement) depends on the propagation likelihood (weight of a dependency). Therefore, the specific weighting of a requirement is multiplied by the specific weighting of the dependency . This results in the following equation for the weighted Active Rank of a requirement:
After the analysis, the requirements are ranked in descending order. The higher the rank, the greater the expected change impact.
The selection of critical requirements is based on the requirement’s weighted Active Rank (cf. Figure 7). Depending on the context, different approaches can be suitable. Essentially, a distinction can be made between a threshold value and a predefined number of critical requirements. When using a threshold value, all requirements are categorized as critical for which applies. is determined individually depending on the risk affinity. In the case of extensive requirement sets, methods such as the Top-10 method [Pohl and Rupp 2021, p. 118 f.] can also be used to limit the application effort, in which only the 10 requirements with the highest are categorized as critical.
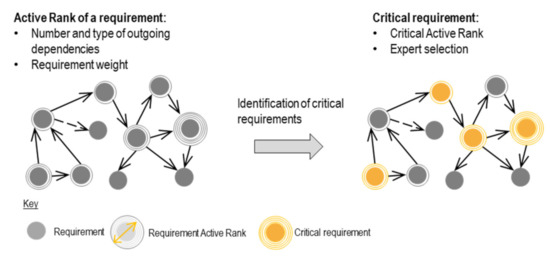
Figure 7.
Analysis of the requirement network to select critical requirements.
In addition to the selection based on the weighted Active Rank, users and subject matter experts have the option of classifying requirements as critical for individual reasons. This is useful, for example, if experience indicate a need for change with regard to a requirement or if a significant change impact is expected despite low connectivity.
Expert Evaluation of the Collective Change Impact of a Requirement
The analysis of the requirement network serves the complete evaluation of change effects of all requirements as well as the selection of critical requirements. This selection is necessary to reduce the application effort for the expert evaluation of the collective change impact to a practical level. The collective impact cannot be evaluated automatically, since a consideration of the requirement content is just as necessary as the inclusion of context-specific influencing variables (for instance, enterprise structure, contractual agreements or restrictions from the product lifecycle stage realization/production).
Both the results of the analysis of the requirement network and an additional guideline for identifying affected development activities are used for determination of the collective change impact of a requirement (cf. Figure 8). The guideline was developed based on the systems engineering process landscape [65] and includes all activities potentially affected by a change. This ensures completeness of the analysis and reduces subjectivity of assessment. Both completeness and subjectivity of assessment are shortcomings of existing methods, as users are not supported in their assessment. The guideline is structured according to four categories: architecture and design, integration and implementation, verification and validation and other. Since requirements management processes are always affected by a requirement change, this category has not been listed. Each category is assigned a superordinate question (“Does a change of this requirement affect this category?”) and detailed questions that can be used to differentiate the impact towards specific development activities (cf. Appendix C). To ensure general practicability of the guideline, it was discussed with three industry representatives [workshop W7] and judged to be complete and suitable for practical use.
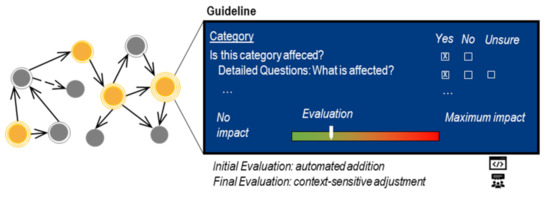
Figure 8.
Functional layout of the collective change impact assessment.
3.2.3. Requirement Change Likelihood
Requirement change likelihood is composed of the exogenous and endogenous change likelihood (cf. Figure 9). Exogenous change initiators trigger an initial requirement change. Those are not related to requirement interplay and come from outside the requirement set. Endogenous changes can only occur after an initial change was triggered and originate from the propagation effects between requirements [14].
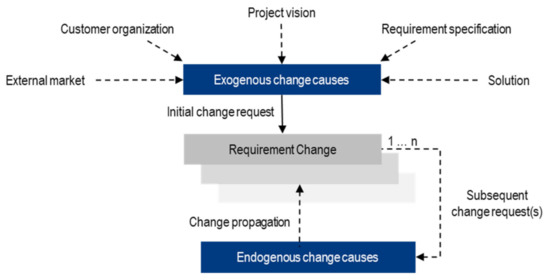
Figure 9.
Overview of exogenous and endogenous change causes [14].
To determine the requirement change likelihood, exogenous and endogenous change likelihood are calculated and merged towards the overall change likelihood (cf. Figure 10). To calculate the exogenous change likelihood, historical change data are analyzed. To ensure the validity of historical change data for the requirements set at hand, they are narrowed down to equivalent circumstances. This is implemented by the manual assignment of relevant change initiators as well as reference projects with similar characteristics. The endogenous change likelihood can be calculated based on the requirement dependencies and their propagation behavior. This step is fully automated and based on a modified PageRank algorithm. In the following, the three steps to calculate exogenous, endogenous and overall change likelihood are explained in detail.
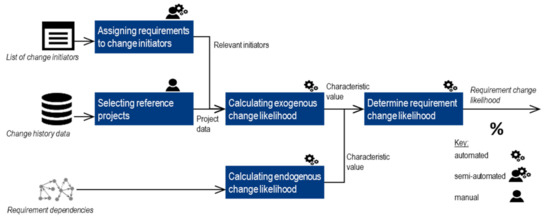
Figure 10.
Overview of steps for the assessment of requirement change likelihood.
Exogenous Change Likelihood
Exogenous changes are triggered from outside the requirement set. Therefore, it is necessary to assess how likely a change of a certain requirement will receive a change impulse by an environmental factor. At first, environmental factors need to be identified that can potentially send out a change impulse. In the following, those environmental factors are called change initiators. Second, it needs to be assessed how likely a change impulse will be sent out by a change initiator. Historical data on the number of requirement changes triggered by an initiator are seen as the best indicator for this. Still, this cannot be used to determine an absolute change likelihood, since this is influenced by many context specific factors (for instance, type of change impulse or available resolution alternatives for a change impulse). It is also not valid to forward the change likelihood from an initiator to all assigned requirements due to conditional probability. In consequence, the aim is to calculate a characteristic value for the exogenous change likelihood, which indicates, how strong a requirement is affected by exogenous change impulses.
- Assigning requirements to change initiators
The first step is to identify change initiators, where an initial change impulse addressed to a certain requirement can come from. Studies differentiate five areas of exogenous change initiators: external market, customer organization, project vision, requirement specification and solution [13,66]. In discussion with practitioners those are judged as too generic and therefore are further detailed into 13 initiators (based on [67]):
- external market: politics (such as regulations), suppliers (such as market stability) and market including further stakeholders (such as response to competitors),
- customer organization(s): customer (such as strategy) and customer organizational structure (such as reorganization or hardware/software changes),
- project vision: business case (such as cost overrun), technology (such as new opportunity) and knowledge (such as a new stakeholder),
- requirement specification (such as increased understanding): requirements engineer and project leader,
- solution (such as design improvement): software development, hardware development and production.
Based on the requirement’s source and content, relevant initiators from which a change impulse can be sent out are manually assigned to requirements by experts. To reduce the application effort, this can be carried out for sections of related requirements (e.g., requirements on a certain system component) and automatically transferred to requirements of this section.
- 2.
- Selecting reference projects
After relevant change initiators are assigned to the requirements, historical change data—number of changes differentiated by initiator—from development projects with equivalent circumstances (reference projects) are analyzed. The goal is to increase the significance of considered data for the requirements investigated. To identify reference projects, twelve project characteristics as well as a short project descriptions are captured and compared. Exemplary characteristics are degree of novelty, type of customer (new or stock customer) and complexity of the system (cf. Appendix F). Selection of project characteristics considered availability of required information at the project start and influence on change initiators. Capturing of characteristics and selection of reference projects are carried out manually by experts.
- 3.
- Calculating exogenous change likelihood
To calculate the exogenous change likelihood, historical change data from all reference projects are merged. Then, the number or changes from relevant change initiators are added up for each requirement. Divided by the overall number of changes, the exogenous change likelihood is derived (c.f. Equations (3) and (4)).
is a characteristic value for the exogenous change likelihood and does not equate an absolute likelihood. The higher the value, the higher the likelihood of a requirement change triggered by an exogenous change initiator.
Endogenous Change Likelihood
Endogenous changes are triggered by change propagation within the requirement network. Therefore, a measure based on a requirement’s connectivity in terms of change propagation is needed. Connectivity can be assessed in two alternative ways: step by step analysis of single propagation paths or holistic analysis of the requirement set. Path specific analysis can be carried out based on De Morgan’s laws [68]. It requires to determine the likelihood of a requirement change caused by propagation for each path and each requirement one by one. Although this method is accurate, it requires too much processing power for extensive requirement sets. Therefore, a holistic analysis is preferred. This can be carried out based on a the previously introduced modified PageRank algorithm in a very efficient manner, even for extensive requirement sets. In difference to the Active Rank for impact analysis (c.f. Equation (5)), which is calculated based on outgoing dependencies, a Passive Rank is needed to indicate the endogenous change likelihood. This is achieved by considering the incoming dependencies—mathematically by keeping the signs equally to the original PageRank.
To derive a likelihood distribution, the Passive Rank is normed following the random surfer principle [63,64]. Each requirement’s Passive Rank is divided by the maximum Passive Rank (cf. Equation (6)).
To relate the endogenous change likelihood to the exogenous change likelihood , the normed Passive Rank is multiplied with the quotient of endogenous changes from all changes (cf. Equations (7) and (8).
Similar to the exogenous change likelihood the is a characteristic value for the endogenous change likelihood and does not equate an absolute likelihood. The higher the value, the higher the likelihood of a requirement change triggered by change propagation.
Requirement Change Likelihood
Instead of an absolute likelihood value, the number of expected changes of a requirement is used as the key indicator for the requirement change likelihood. An absolute likelihood is limited to a statement about how likely a requirement change occurs in the course of the project. Since requirements often change multiple times, the number of expected changes is considered more helpful for decisions on proactive measures. To calculate the number of expected changes, the characteristic values for exogenous and endogenous change likelihood are used. and indicate how strong a requirement is affected by exogenous or endogenous change impulses. Their value range is as follows:
To determine the number of expected changes , the average number of changes per requirement is derived from the change history of reference projects as a first step:
is used as a baseline on which and are applied to lower or raise the number of expected changes. For this purpose, the following assumptions are made:
Assumption 1: The characteristic values for exogenous () and endogenous () change likelihood are proportional to the number of expected changes : the higher the higher . If equals the expectation value , equals .
Assumption 2: linear dependency between and the number of expected changes per requirement . According to the value of the number of expected changes of a requirement in the course of the project.
The expected number of requirement changes is considered as the requirement change likelihood. If the requirement is expected to change 1.2 times in the course of the project. If the requirement is expected to be more likely to change in the course of the project than not to change. To simplify interpretation in industrial practice, the following categories are defined (cf. Table 3).
Table 3.
Change likelihood categories.
Based on the change likelihood and impact, the overall change risk of requirements is derived. The change risk is used to select necessary and risk specific measures.
3.3. Selection of Proactive Measures
The method for selection of proactive measures is carried out in three steps (cf. Figure 11). First, the requirements are prioritized on the basis of a risk portfolio and a requirements profile with risk parameters is created. Then, each requirement is assigned an action strategy and associated proposed measures. From these, the users select the preferred proactive action and implement it as part of higher-level change management.
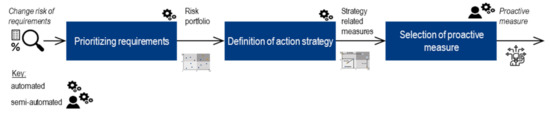
Figure 11.
Overview of steps for the selection of proactive measures.
3.3.1. Prioritizing Requirements
A risk portfolio with the dimensions likelihood of change and change impact through propagation is used to prioritize the requirements (cf. Figure 12). A risk portfolio as a prioritization technique was chosen because it is common in practice, can be easily interpreted and used for company-wide communication, and allows a relative comparison between requirements [workshop W4].
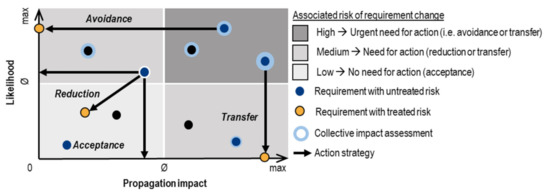
Figure 12.
Requirement change risk portfolio with action strategies (cf. [69]).
In deviation from a conventional risk portfolio, a third aspect was added: collective change impact is represented by the diameter of a requirement. The third dimension is required to represent the requirement set completely and showing all results from risk assessment at the same time. Whereas the change likelihood is determined for all requirements, collective change impact is only evaluated for critical requirements (cf. Section 3.2.2). Hence, propagation impact is used for risk portfolio dimension.
To prioritize the requirements, a threshold value is defined for each portfolio dimension. Based on the threshold values, the portfolio is divided into four quadrants, which are assigned a risk category (high, medium and low). The requirements are categorized and prioritized according to the associated quadrant. The threshold values can be adjusted depending on the risk affinity. As default, average values are used.
3.3.2. Definition of an Action Strategy
Based on the risk portfolio, an action strategy is defined for each requirement. Four action strategies are differentiated: avoidance, transfer, reduction and acceptance [27]. Proactive measures are assigned to an action strategy based on the intended effect [69]:
- Avoidance: eliminating the likelihood of occurrence (e.g., rejecting an order or change requests [12]).
- Reduction: mitigating the likelihood of occurrence or impact (e.g., securing a requirements specification with the stakeholder [39] or agreeing on effort constraints [70])
- Transfer: Sharing or transferring the change impact (e.g., insuring or contractually passing on the change costs to clients [71]).
- Acceptance: No action and no effect.
Depending on the risk category of a requirement, the action strategies are suggested.
3.3.3. Selection of Proactive Measure
As there is no previous research on context-specific proactive action measures for requirement changes so far (cf. Section 1), an overview of context-specific measures is developed (cf. Figure 13). To do so, measures from other contexts (especially change and risk management) were transferred and adapted (for instance from [23,39,40,70,71,72]). Within a workshop with industry experts (2 h; 3 participants: head of department, requirements engineer and process owner) the results were checked for suitability and enriched. Nevertheless, the overview is to be understood as a reference list for which no claim is made to completeness and which can be adapted as needed. Action strategy and target value are used for the differentiation of the measures. In addition, it is indicated whether the measures address the change risk of an individual requirement or the requirement set.
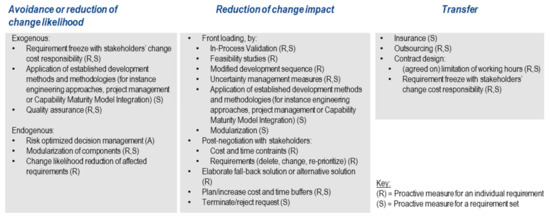
Figure 13.
Overview of proactive measures for requirement change risk management.
To support the selection of suitable measures, a recommender mechanism is implemented. It highlights and ranks all measures that are assigned to the requirement’s risk category. Their ranking is determined by how frequently it was selected in past applications. Thus, context-specific influencing factors (for instance, feasibility, cost–benefit ratio and responsibilities) are considered. Based on the proposed ranking of the measures, the selection of the proactive measure(s) to be implemented is made by the users. Selection is carried out manually, since availability and expected effect depends on the application context and cannot be adequately estimated by the recommender mechanism. Implementation and monitoring of measures is carried out as part of the superordinate change management process and not further supported by ProMaRC.
3.4. Software Prototype
ProMaRC is implemented in a software prototype using Python. The graphical user interface (GUI) is implemented via Python extension PyQT 6 [73]. The requirement dependency analysis is implemented using the Python extension huggingface/transformers for functionality regarding BERT models [53] and Scikit-learn for preprocessing requirements for classification [74]. The underlying database is the PyQT implementation of SQLite [73]. The workflow within the prototype consists of seven steps (cf. Figure 14).
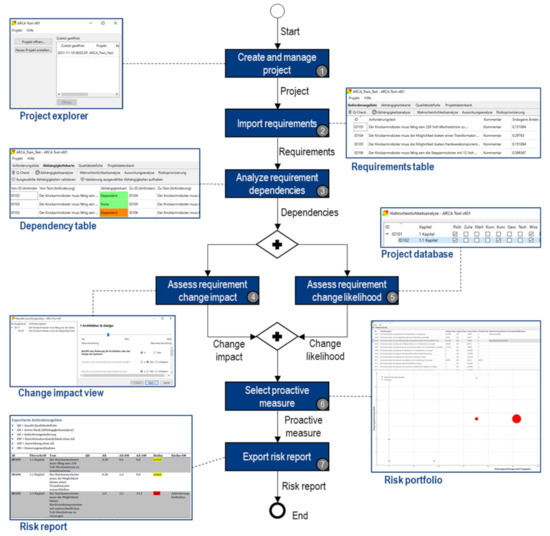
Figure 14.
Workflow within the ProMaRC tool.
Workflow: First, a development project has to be created (Step 1). A project is used as a container for a requirement list and extends it with metadata (project name and description) and project characteristics (cf. Appendix F). Using the GUI, users can switch between different views to display specific information: requirements table, dependency table, project database, impact analysis view and risk portfolio.
Second, the requirements list has to be imported for the respective project (Step 2). Entries in the requirements list initially have the attributes ID, description and type (heading or requirement—headings are frequently used in industrial practice to group requirements). Requirements and their attributes are displayed within the requirements table.
To perform the dependency analysis (cf. Section 3.2.1), a BERT model must be selected (Step 3). After the dependencies have been classified, they can be viewed in the dependency table. Dependencies consist of the attributes’ ID and descriptions of the considered requirements as well as the dependency type. In the dependency table the user has the possibility to edit detected dependency types. In addition, the dependencies can be exported to use them as ground truth data for fine-tuning BERT models. Using requirement dependencies, the Active Rank of the requirements is calculated and is assigned as an attribute to respective requirements.
As a precondition for determining the impact and likelihood of requirement changes, dependencies must be known. The order of performing change impact or change likelihood assessment is interchangeable. In the impact analysis view (cf. Section 3.2.2), the user is shown the requirements sorted by Active Rank (Step 4) to enable prioritization for manual assessment. For manual assessment of change impact, the expert guideline and the dependent requirements of the requirement under consideration are illustrated. The dependent requirements are illustrated as a tree structure for handling complexity. By expanding the requirement, the respective dependent requirements are displayed. After assessment of impact dimensions, the change impact is calculated and assigned as an attribute. The user is able to adjust the proposed change impact using a slider.
To calculate the change likelihood (cf. Section 3.2.3), reference projects must be defined first (Step 5). These are selected in the project database view. Then, the user has to select exogenous change initiators for the requirements that potentially lead to a change of a certain requirement. To reduce application effort, the user has the possibility to define the initiators per requirement or per heading (selection is inherited to all requirements assigned). Then, change likelihood is calculated. Endogenous and exogenous change likelihood as well as the expected number of changes of each requirement are assigned.
In the risk portfolio, the requirements are displayed to the user in a graph (Step 6). The Active Rank of the requirements is plotted on the abscissa and the expected number of changes per requirement on the ordinate. If collective impact analysis has been performed for a requirement represented by a circle in the graph, the diameter of the circle is scaled proportionally to the value of impact assessment. Requirements that are interconnected with many requirements have a high likelihood of change. High change impact are placed in the portfolio on the upper right side. By clicking on the requirement, the respective requirement is highlighted in a requirements table in the upper section of the risk portfolio view. The user can select a proactive measure based on the risk figures. These figures are visualized in the graph or displayed as attribute values in the requirements table. Proactive measures are proposed to the user based on the specific risk characteristics. These are change impact and expected number of requirement changes. Users can either choose between the recommended measures or between all measures. The selected proactive measure is passed as an attribute to the requirement.
Finally, the user can export the results of ProMaRC in a risk report (Step 7). This document contains a table, which includes the determined attributes for the requirements: active rank, expected number of changes, change impact and selected proactive measure.
To increase usability, additional material was provided. One the one hand, a manual was created. It contains the workflow as well as theoretical background, glossary and an overview of frequently asked questions. On the other hand, a video tutorial was recorded (45 Minutes), explaining basic functionality and usage of the software prototype.
4. Evaluation
The evaluation concept is based on the DRM and differentiates support evaluation, application evaluation and success evaluation [46]. Support evaluation investigates the fulfillment of the user needs on a conceptual and functional level parallel to development. Application evaluation is focused on applicability and usability of the method in the intended application context: the proactive management of requirement changes. Success evaluation aims to assess the usefulness of the method.
4.1. Support Evaluation
Support evaluation targets the conceptual level of the method. Accordingly, success criteria 4 to 7 are investigated. Fulfillment was evaluated by the following procedure: First, the correct functionality was checked internally, using the data from the articulated robot arm case example (cf. Figure 15). For this purpose, the methods were implemented in the software prototype (cf. Section 3.4) and the results were compared with a manual method application. Inconsistencies and false assumptions could be corrected before the integration of industrial users.
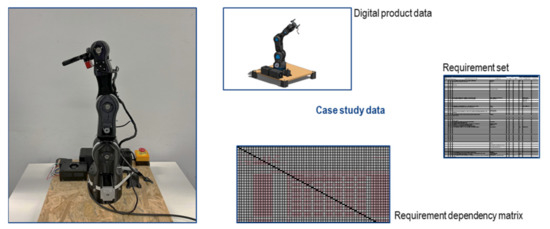
Figure 15.
Articulated robot arm with case study data.
Second, the method was presented and discussed on a conceptual level in digital workshops with industry experts (cf. Section 2). During each workshop a specific functionality was demonstrated using the software prototype. Then, the fulfillment of requirements was evaluated by the industry experts. The following four aspects were classified by the users as fulfilled, partially fulfilled or not fulfilled: acceptable application effort, availability of required information, reusability in similar product development projects and expected quality of the results (comprehensible and sufficiently accurate). If the reusability had no relevance for the method, it was neglected. In addition, unconsidered error sources and influencing factors were discussed in order to uncover previously unrecognized influence factors or errors.
The final step was testing. Industry experts used the prototype in the application context to identify necessary adaptations of the method. If adaptations were required, the validation steps were repeated. The results of the validation during development for each requirement are explained below.
This approach was used in order to receive feedback from industry experts as early as possible and align further development activities accordingly.
4.1.1. Success Criteria SC-4: Analysis of Change Propagation
Internal Functional Testing
For the internal functional test of dependency analysis, a dataset was built (case study articulated robot arm). The dataset consisted of 145 requirements and a manually created dependency matrix with 21.025 entries. The dependency type was differentiated in the dependency matrix as an indicator for propagation behavior. For testing, the dataset was divided into a test set and training set: 80% training data and 20% test data. Since no fully objective data on dependencies exist, the systematic assessment of experts involved in system development is assumed to be ground truth data quality. Therefore, the dataset was created by the developer of the articulated robot arm.
Next, the four solution classes identified in the literature review were implemented as an algorithm. These are refines, is refined by, requires and is required by. Since not all approaches are able to differentiate the dependency types, individual statistical classifiers were used to evaluate the quality of the results.
Comparing the solution classes, the dataset was analyzed with all algorithms and the performance was compared. For this purpose, the metrics precision, recall, F1 and ROC_AUC were determined (cf. Table 2).
The evaluation shows that the BERT approach produces the best results. Therefore, this approach was favored. Due to the high computational effort (for instance, compared to LSTM), the decision was made in consultation with the industry representatives [W10].
Validation Workshops with Industry Users [W8, 10 and 11]
Due to the complexity of the dependency analysis method, the validation was performed step by step in three workshops. First, the basic industrial suitability of AI-supported language processing of requirements descriptions with respect to application effort and availability of information was verified [W8]. Irrespective of the specific solution approach, the requirement of partly extensive training data for training the machine learning models as well as the lack of traceability were discussed. Both were considered acceptable.
After comparing the solution classes with respect to quality of results (cf. internal function test), BERT was selected as the most promising approach in a second workshop [W10]. As an alternative, the LSTM approach was explained, which achieves a lower performance, but causes significantly less computational effort. Here, the performance was rated as more important than the speed of the calculation by the industrial users. The quality of the results was rated as fulfilled, since both the dependencies are recognized and their type is differentiated. A result of the workshop was also that a differentiation between types with coercive propagation is not necessary if a faster calculation of the dependencies is made possible by the simplification.
In a final workshop, the learning mechanism of the dependency analysis was validated [W11]. The industrial users rated the application effort as well as the availability of the information as fulfilled and the continuous improvement of the quality of the results as positive.
Validation result: SC-4 is fulfilled.
4.1.2. Success Criteria SC-5: Analysis of Exogenous and Endogenous Change Likelihood
Internal Function Test
The method for assessing the likelihood of occurrence of a change was validated in three parts. First, the assessment of exogenous change likelihood was examined. Since the categories of change initiators were derived from existing literature approaches, only an internal functional test of the software functionalities (assignment of initiators, selection of reference projects) was performed by comparison with manual calculation. The evaluation of endogenous likelihood of change is based on the PageRank algorithm, so that only the context-specific adjustments were checked for contextual correctness. For this purpose, test datasets were analyzed and the evaluation was manually checked for plausibility: “Does the determined rank correlate with the degree of interconnectedness and the dependency direction?”. To check the correctness, the results of software analysis and manual analysis were compared.
Validation Workshop with Industry Users [W9]
During the validation workshop, the aspects of acceptable application effort and availability of information were assessed as fulfilled. The integration of historical projects as reference projects and the associated recording of the causes of change were explicitly included. The quality of the results was rated as partially fulfilled, as the traceability is not completely guaranteed. As a suggestion for improvement, an explanation in the user manual was recommended. The suggestion was implemented, so that the quality of the results is ensured.
Validation result: SC-5 is fulfilled.
4.1.3. Success Criteria SC-6: Analysis of Collective Change Impact
Internal Functional Testing
The internal functional test of the impact analysis method had three focal points: validation of the impact model, estimation of the consecutive change effects in the requirement network and estimation of the collective impact. The estimation of local effects was derived from the generic systems engineering processes, whose validity was taken as given. For this reason, no own validation of the processes was performed. The validation of the impact assessment (cf. Figure 4) was performed by two scientific publications with blind peer-review [55]. The evaluation of the consecutive change effects is based on an adapted PageRank algorithm, similar to the likelihood analysis. Here, the identical procedure was chosen to ensure the mathematical correctness of the adjustments: The results of the analysis of a test dataset were manually checked for plausibility. The final evaluation of the collective change effects is a combined representation of the local effects and consecutive effects, so that for the validation its correct functionality in the software prototype was ensured.
Validation Workshop with Industry Users [W8 and 10]
The validation with industry users took place in two workshops. In the first workshop [W8], the quality of the results was checked: sufficient accuracy and comprehensibility. Sufficient accuracy of the analysis was rated as fulfilled by the industry users. A ranking of requirements according to the expected impact in the requirement network seemed appropriate for selecting requirements for manual analysis. Analyzing traceability is hardly possible when using PageRank algorithm, due to the high computational effort required. Because of that, a path-specific analysis based on De Morgan’s laws [68] was presented as an alternative. This offers better traceability for small sets of requirements, but due to the long propagation paths this decreases sharply from the 3rd order of dependencies and for more than ten requirements. In addition, the computational effort increases exponentially with the number of requirements, resulting in long processing times. The industry users rated the advantage in traceability as insignificant compared to the longer processing time and the associated application effort. Instead, the deficit in comprehensibility was rated as tolerable for the selected solution based on PageRank, since a minimal application effort can be achieved. The availability of the required information was addressed in the second workshop [W10] and assessed as fulfilled. While the evaluation of the consecutive effects is fully automated, expert knowledge is required for the estimation of the effects. Due to the possibility to involve subject matter experts for the questionnaire as needed, this was rated as practical. In addition, the possibility to manually adjust the pre-calculated result (cf. Section 3.4) was evaluated as advantageous to ensure sufficient accuracy.
Validation result: SC-6 is fulfilled.
4.1.4. Success Criteria SC-7: Selection of Requirement Specific Proactive Measures
Internal Functional Testing
For internal functional testing of the approach for the selection of proactive measures, the focus was placed on the software functionalities since the measures and strategies itself are derived from literature. For functional testing, both the representation in the risk portfolio and the recommender mechanism were tested for consistency against a manual selection.
Validation Workshop with Industry Users [W4, 5 and 11]
The validation with industry users took place in three workshops. In the first workshop [W4], the risk portfolio was evaluated with regard to the quality of the results. Here, the comprehensibility based on the axis labeling was rated as fulfilled and sufficient accuracy (points with variable scope) as partially fulfilled. Potential for improvement was seen in the complete representation of all requirements in the portfolio, since at this time only the manually evaluated requirements were visualized.
In the second workshop [W5], the risk measures and the recommender mechanism were validated. The risk measures were presented and enriched with suggestions from the industry users or adapted in the wording. Subsequently, the sufficient accuracy was confirmed as fulfilled. Validation of the recommender mechanism was focused on application effort and availability of the required information. The application effort was evaluated as ideal, since only a selection based on suggestions has to be made. The availability of information was also rated as fulfilled, since the users can retrieve detailed information on the change risk through detailed views in the software prototype.
In the third workshop [W11], the adapted risk portfolio and the recommender mechanism were validated. In the risk portfolio, all requirements are visualized and the results of the manual analysis were highlighted using color coding. After this adjustment, the sufficient accuracy of the results was rated as fulfilled. For the recommender mechanism, comprehensibility and sufficient accuracy were evaluated. The comprehensibility was assessed as sufficient due to an explanation in the user manual. Sufficient accuracy was also considered to be given, since only a tendency is determined through the use of historical user data and experts still have the option of selecting a suitable risk measure from the complete list.
Validation result: SC-7 is fulfilled.
4.2. Application Evaluation
As an overarching method for application evaluation, testing in an industrial context with follow-up questionnaires and interviews was selected. Testing was carried out as part of the case studies by pilot users from industry (cf. Section 2). According to Ulrich [41], it is important to perform evaluation in the intended application context. Therefore, it was carried out without additional support and based on real development data. To enable pilot usage, the workshop demonstration (cf. Section 4.1) and additional information was used (user guide and demonstration video).
Pilot users were selected based on their background and experience in requirements engineering. To objectify pilot users’ assessment and reduce emotional biases, a questionnaire was used for initial evaluation. To enable in-depth feedback and evaluation aspects beyond the questionnaire scope, this was followed by semi-structured interviews (30 to 45 min) with each pilot user. If necessary, complementary research methods are used for evaluation of certain success criteria and explained in the respective section.
4.2.1. Input Success Criteria
Success Criterion SC-1: Processability of Interdisciplinary Requirements
Investigation as to whether requirements from different disciplines can be evaluated is based on the interdisciplinary requirements set of the articulated-arm robot (cf. Section 2), which also includes different specification levels. SC-1 is considered fulfilled if all steps of the workflow (cf. Section 3.4) can be carried out without restriction.
Evaluation results: The application of the method for the requirement set of the articulated-arm robot was carried out by means of the software prototype without errors. This was also confirmed by pilot users from the industry. Since the dependency analysis is data-based, the performance parameters were used to proof correct execution. Here, it was shown that due to good performance (cf. Section 3.2.1 and SC-4) a correct execution between requirements of the same and different disciplines can be assumed. The performance parameters also lead to the assumption that the analysis is carried out correctly for the analysis of requirements of different specification levels.
Validation result: SC-1 is fulfilled.
Success Criterion SC-2: Processability of High Number of Requirements
The processability of a high number of requirements is tested in two steps. First, it was determined for which step the number of requirements influences feasibility. In this case, required computing power for dependency analysis has to be tested. The other steps are performed manually or based on the PageRank, which is proven to work efficiently for large datasets [63,64]. Therefore, no limitation of the feasibility is to be expected. The increasing application effort for manual activities is evaluated separately in the context of SC-12.
In the second step, the dependency analysis was tested. For this purpose, the computation time for a pair of requirements was determined. This is the key parameter, since all requirement pairs are analyzed successively and computation time can be determined mathematically for each size of requirement sets. The validity of calculation was tested experimentally and confirmed for requirement sets with 150, 250, 500 and 1,500 requirements. The computation time for each pair of requirements was determined for two representative computing capacities: 16 GB RAM/i7 CPU (regular laptop; Lenovo ThinkPad) and 13 GB RAM/P100 GPU (high-performance cloud server; Google Colab) [75].
SC-2 is considered fulfilled if the computation time of the dependency analysis does not exceed a threshold of 5 h. The threshold was defined by asking industry experts at which runtime the feasibility is considered limited [workshop W6].
Evaluation results: The computing time for the dependency analysis is 2 s (regular laptop) or 0.001 s (high-performance cloud server) per pair of requirements. For a regular laptop, up to 95 requirements are within the time limit. Using a cloud server, up to 4,250 requests can be processed within 5 h (cf. Figure 16). Since very large request sets can only be processed if sufficient computing power is available, the success criteria is rated as partly fulfilled.
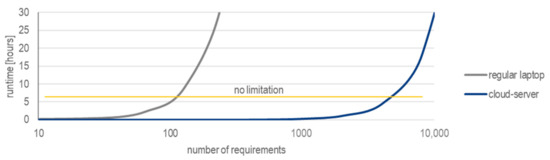
Figure 16.
Runtime of dependency analysis for different size requirement sets.
Validation result: SC-2 is partly fulfilled.
Success Criterion SC-3: Processability of Regular Form of Documentation
For investigation of processability of natural language documentation form the requirements set of the articulated robot arm is used. The requirements set is suitable as a data basis, since all requirements have a natural language description text in German. SC-3 is considered fulfilled if the requirement can be imported, processed and exported correctly.
Evaluation results: Correct functionality of import and export was manually verified by analyzing the database storage of the software prototype (import) or correct representation in the output format (.csv) (export). With regard to processing, the focus is on the dependency analysis, since the requirement description is only used for this step. Correct functioning and plausibility of the results were manually checked in the program code. The accuracy check was carried out as part of the evaluation of SC-4, which confirms the correct functionality. In all three steps, the natural language description was processed without errors. This proves that the specifications for formatting and layout of the input and output data were met.
Validation result: SC-3 is fulfilled.
4.2.2. Application Success Criteria
Success Criterion SC-8: Easy to Use
The results of the workshops for support evaluation (cf. Section 4.1) as well as the feedback from pilot users (questionnaire and interviews) are used as the basis for the evaluation. The evaluation of the method steps regarding ease of use was performed in two steps to reduce biases caused by the user interface of the software prototype [46]. For example, unavoidable weaknesses of a prototype such as missing secondary functionalities (for instance, role and rights management) can lead to user frustration and bias [46]. First, the individual method steps are evaluated and based on the experimental method Participative design [76]. For this, the respective step was demonstrated in the workshops of support evaluation (cf. Section 4.1) and asked whether it is easy to apply or whether usability adaptations are necessary. By demonstrating the method, the feedback could be actively focused on the method and the influence of the user interface and missing secondary functionalities were reduced.
Verification of the ease of use of the user interface (in terms of usability according to [77]) was carried out in the second step. For this purpose, pilot users independently apply the ProMaRC method and evaluate it based on predefined criteria (cf. Appendix D). This approach was chosen because the pilot users were not involved in the development phase and therefore were unbiased. An established questionnaire was used for the evaluation: system usability scale [78]. Compared to other standardized questionnaires (for instance, user experience questionnaire [79]), this questionnaire has the advantage that an overall evaluation can be determined and interpreted on the basis of predefined threshold values. Formulating individual questions was declined, since standardized and validated questionnaires on usability of user interfaces are available and allow low-bias evaluation as well as sound interpretation of results.
SC-8 is considered fulfilled for the method if ease of use is confirmed in the workshops and no adjustments are pending. The success criterion is considered fulfilled for the user interface if the SUS score of the user assessments is above 51 [0; 100]. For SUS score ≥ 51 the user-friendliness is considered OK [80], which is seen as threshold for a software prototype to be adequate. If both the method and user interface are completely fulfilled, SC-8 is considered fulfilled.
Evaluation result: If adaptations to the method application or software functionality were suggested from industry experts during the workshops (for instance, integration of a status display for dependency analysis), those were implemented without exceptions. The adaptations were presented and discussed again during the subsequent workshop. Since all adaptations were implemented and evaluated as satisfactory, the overall ease of use is considered to be fulfilled.
Usability of the software prototype was rated with a SUS score of 69.2 (average value), which is above the predefined threshold and close to the next usability level (“Good”) which requires a rating SUS ≥ 71. As a result, ease of use is approved for the method and user interface.
Validation result: SC-8 is fulfilled.
Success Criterion SC-9: Availability of Required Software
Availability is rated by means of the software costs. For this, licensing conditions of open-source software and product costs as well as market penetration are used in the case of commercial software. Market penetration is seen as an indicator for costs, since no procurement costs are expected for standard products already available in the company (e.g., Microsoft Office). SC-9 is considered fulfilled if there are no costs for using the method in an industrial context.
Evaluation result: The following software is required for method application: Python and Microsoft Excel. Microsoft Excel is assumed to be available for free due to high market penetration [81]. Python is an open-source product [82].
Validation result: SC-9 is fulfilled.
Success Criterion SC-10 Early Availability of Required Information
Required information for method application (input data and expert knowledge) is examined with regard to availability in the project initiation phase. The answers to question 17 (cf. Appendix D) in the survey of the pilot users (questionnaire and interviews) is used as a basis for evaluation.
All required input information is queried (data and expert knowledge). Availability in the course of development is ensured by the support evaluation (cf. Section 4.1) and is not determined separately. SC-10 is considered fulfilled if the median of user ratings for each information category is Available. This assessment assumes that the information is available within the development team and that any information perceived to be missing is due to deficits in internal communication.
Evaluation result: Pilot users’ feedback proves the availability of all required information: median for all questions is Available. Originating from role specific responsibilities, some answers indicated Unavailable information. Requirements engineers partly answered not to be able to select proactive measures, because this is part of the project leaders’ responsibility. The same concern was stated for knowing the initiator of a change, which is also part of project management. This concern is not considered an issue regarding SC-10 as the right to access this kind of information is exclusively given to project management. Another finding is that availability of data is limited. Documentation is carried out differently by development teams, based on varying preferences and specific project needs. Often, it does not include change initiators, ground truth on requirement dependencies and change impact, although standards demand for such information (for instance, Automotive SPICE requires documentation of requirement dependencies [26]). That information exists in terms of expert knowledge and needs to be elicited to apply the ProMaRC method. Since all pilot users confirmed that information is available or can be gathered within the development team, success criterion SC-10 on early availability of required information is approved.
Validation result: SC-10 is fulfilled.
Success Criterion SC-11 Generic Applicability
To evaluate generic applicability, the requirements and restrictions of the method on input data and expert knowledge are examined. The requirements are compared with guidelines and standards for the development of complex technical systems, since these are considered to be representative of the state of the art and are used in different branches. The restrictions are derived from the method. SC-11 is considered fulfilled if guidelines and standards for development practice demand that the required input data are available in accordance with the restrictions.
Evaluation result: VDI2206:2021 (Development of mechatronic and cyber-physical systems) as well as VDI 2221:2019 (Development of technical products and systems) as key guidelines for developing complex technical systems in Germany require explicit description of requirements at the beginning of a development project [83,84]. The same applies to the international systems engineering standard ISO/IEC/IEEE 15288 [85]. Since requirement descriptions are the only required input data, this can be seen as fulfilled. Necessary expert knowledge is available regardless of the project phase, so that all information demands are assessed as generically available.
As a restriction, the method is limited to natural language requirement descriptions. Regardless of the documentation practice (document based or model based; unstructured or structured), natural language text is used somehow [86], so that the restriction can be assumed to be fulfilled. There are no restrictions regarding initiators or dimensions of impacts. Any specifications regarding the form of input and output data (file format and formatting) can be adapted in the software prototype.
Validation result: SC-11 is fulfilled.
Success Criterion SC-12 Acceptable Application Effort
The answers to questions 18 to 22 (cf. Appendix D) in the survey of pilot users (questionnaire and interviews) are used as the basis for evaluation. The questions capture all activities required for application of the method and are rated based on a Likert Scale [87] from strongly disagree (−2) to strongly agree (2).
SC-12 is considered fulfilled if the average of the users’ ratings for each question is ≥ 0 (neutral). In this case, it is assumed that the majority of users accept the application effort.
Evaluation result: Pilot users’ feedback varied, but overall the results indicate improvement potentials regarding application effort (cf. Figure 17). As part of the interviews, issues were discussed. The finding was that dependency analysis is the main issue. It is the only method requiring one-time preparation effort (creation of dependency model), which is perceived as too high in case it needs to be created from scratch. Application effort for subsequent steps also do not reach scores higher than 0. For recurring preparation effort, a fully automated interface to requirements engineering software tools is missing. For application effort, the correction of requirement dependencies is criticized. Additionally, lead time of dependency analysis is an issue. Lastly, manual capturing of changes as a follow-up activity should be automated based on an interface to requirements engineering software tools. Overall, dependency analysis stands out as the source of too many application issues for different steps. Still, all pilot users agreed that it is already a major improvement in comparison to manual dependency analysis as currently implemented. Although application effort should be further reduced, using manual analysis as a benchmark, it clearly reduces application effort. As a result the application effort is partly acceptable.
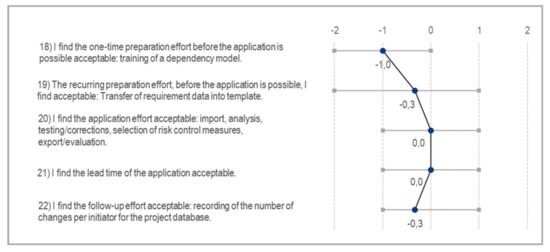
Figure 17.
Questionnaire results on area “application effort”.
Validation result: SC-12 is partly fulfilled.
4.2.3. Output Success Criteria
Success Criterion SC-13 Reusable Database
As a basis for evaluation, output data of the method and the software prototype are examined and compared with the required input data. The input data builds the core of the database and is enriched by expert knowledge from the application (for instance, evaluation of the correctness of determined dependencies). For evaluation of reusability, it is examined whether the output data generated from application are sufficient to cover all data-based input data apart from project-specific inputs (requirement data) (cf. Section 3). Other expert knowledge that is not valid for subsequent projects (for instance, impact dimensions of a specific requirement change) is not considered. SC-13 is considered fulfilled if all input data, with the exception of project-specific data (requirements), can be generated by output data from previous applications.
Evaluation result: The following input data were deemed relevant for reuse:
- Likelihood analysis: Number of changes triggered by an initiator in past projects.
- Dependency analysis: Correctness of dependencies between requirements.
- Proactive action selection: Suitability of the proposed proactive measures.
The number of changes triggered by an initiator is documented during the course of the project and stored in the project file. The change history can be evaluated by subsequent projects by means of reference project selection. This ensures reusability and no separate data needs for likelihood analysis in a subsequent project.
Manually evaluated correctness of the dependencies between requirements is automatically stored in the project database and can also be exported as a separate file. This allows one to train an improved dependency model. For the dependency analysis, just the dependency model as well as project-specific data are required, so that the requirement of reuse for the dependency analysis is fulfilled.
The suitability of the proposed proactive measures is captured by counting each selected measure for the recommender mechanism in subsequent projects. Thus, opportunity to reuse is given. Since all three relevant input data can be generated by previous projects, the reusability is rated as fulfilled.
Validation result: SC-13 is fulfilled.
Success Criterion SC-14 Sufficient Accuracy
On the one hand, performance parameters of dependency analysis in an industrial context are used as the basis for evaluation. On the other hand, a survey with pilot users (questionnaire and interviews) is conducted. The performance characteristics of the dependency analysis allow a conclusion on the accuracy of automatically generated information. Whether the follow-up steps, based on this information, allow a sufficiently accurate assessment of the risk of change in the primarily supported decision situations is determined by questions 23 to 27 (cf. Appendix D).
The queried decision situations are derived from the use cases (cf. Section 2). The evaluation is based on expert estimates, since a data-based accuracy evaluation is not possible. It would require documentation of the history of uncertainties and requirement changes (including initiator and impact) as well as selected actions over a longer period of time. This is judged to be inappropriate and expert judgment is used instead as an indicator for accuracy. SC-14 is considered fulfilled if the average of users’ ratings for each question is ≥ 0 (neutral). In this case, it is assumed that the method is sufficiently accurate under usual conditions.
Evaluation result: Performance parameters of dependency analysis are high for the articulated-arm robot case study (cf. Table 4). None as a major class has very high accuracy, but also minor class Dependent reaches high accuracy. Due to the limited extent of training data, dependency types are not distinguished by type in order to reduce the number of classes to be differentiated. Since the dataset contains a major class (None) with many entries and a minor class with few entries (Dependent), the criteria needed to be viewed macro averaged (equal weight on all classes) to be significant [75].
Table 4.
Performance of dependency analysis for the articulated-arm robot case study [75].
The application for industrial case study on engine control unit revealed the importance of a context-specific dependency model. Using a context-independent dependency model, accuracy was poor for minor classes, but increases significantly with the ratio of context-specific data for training the dependency model. Due to the high effort to create such context-specific data (cf. SC-12), pilot users suggested the gathering of required dependency data in the course of future development projects. The suggested approach was to adapted in documentation guidelines and commits developers to capture dependency data. This not just helps to create a context-specific database, but also ensures the fulfillment of common development standards (cf. SC-10).
To further investigate the influence of context-specific training data on accuracy, data from four student development projects on power tools (cf. Section 2) were used. The accuracy increased from F1 = 92% (None) and F1 = 47% (Dependent macro avg.) without context-specific data to F1 = 98% (None) and F1 = 96% (Dependent macro avg.) with context-specific data as part of the training set. In consequence, the importance of context-specific data to train the dependency model is highlighted. However, the ability to reach high accuracy of dependency analysis for different contexts is also shown [75].
As a second step, pilot users’ feedback was analyzed. Feedback indicates sufficient accuracy for all decision situations (cf. Appendix D). Most questions have an average rating close to 1 (agree). Improvement potential is given for the selection of proactive measures (average rating = 0.3). The reason is that the feature is not linked to company-specific guidelines and therefore does not exactly match company-specific selection metrics. Context-specific tailoring such as this is named as an improvement potential, but does not limit accuracy of the result itself. Based on the results from dependency analysis evaluation and pilot users’ feedback, sufficient accuracy is assumed. As part of future research, empirical studies need to confirm the accuracy of the results for risk assessment (cf. Section 4.3 and Section 5).
Validation result: SC-14 is fulfilled.
4.3. Success Evaluation
The usefulness of the ProMaRC method is determined by its contribution to increasing efficiency in product development. Since efficiency is influenced by a large number of influence factors and the effects of proactive change management cannot be measured directly, an investigation of the actual influence of ProMaRC application requires a comprehensive empirical benchmark study. This must examine the change in key performance indicators in comparison with development projects not using ProMaRC. This needs to be implemented on the basis of a sufficiently high number of development projects with comparable characteristics (e.g., degree of innovation, product context or stakeholders involved) and for different performance levels of the existing change management.
Such empirical investigation of the success is omitted in this contribution. Before conducting such extensive benchmark study, it should be evaluated first if indicators suggest sufficient usefulness of the method. As a primary indicator, expert assessments are used. Experts are able to assess whether the method addresses leverage points in industrial practice and transfer the expected effects on other contexts. To do so, expert assessments of industrial pilot users are recorded in a questionnaire after pilot application (cf. Appendix D; questions 28 to 33). Measurable success factors on the basis of which the questions are structured were derived from an influence model (cf. Appendix E). In this way, an initial estimate of the success can be made, which will have to be substantiated in subsequent benchmark studies.
Expert assessments indicate the usefulness of ProMaRC to develop complex technical systems more efficiently, by risk assessment and support in selecting appropriate proactive measures (cf. Appendix D). Within the interviews, dependency analysis was highlighted as very helpful and promising. Today, high manual effort to identify and document dependencies is a barrier to fulfill development standards (cf. SC-10) but also to reach sufficient system understanding in early development stages. Automated dependency analysis unlocks new action space such as impact analysis (as part of proactive as well as reactive change management). It also spares developers with rare competencies (for instance, requirements engineering). Feedback on the overall method indicates that integrating ProMaRC into superordinate risk and change management procedures helps to consider requirement changes in development projects more accurately and more comprehensively. To encourage the usage of ProMaRC, the software prototype needs to be connected to common requirements engineering and project management software tools and further developed beyond the prototype stage.
5. Discussion and Conclusions
For analysis of change propagation, the evaluation shows that the BERT approach produces the best results. Dependencies are detected with a high performance (F1 macro avg. 96%). Up to 4250 requirements can be processed within 5 h when using a cloud server for running the dependency analysis. The analysis of exogenous and endogenous change likelihood is assessed by experts as having an acceptable application effort and all required information is available in an industrial context. The change impact analysis is rated sufficiently accurate by industry users. Additionally, relying on expert knowledge as part of the analysis is confirmed to be practical. An improvement potential is seen in the context of training data for dependency analysis. Manually creating a sufficient database is time-consuming and new ways to generate such training data should be investigated. Overall, pilot users’ feedback shows that all method prerequisites are given in an industrial context (e.g., availability of required input-data and information), the method is easy to apply and provides a useful support.
Evaluation results may be limited due to the number of case studies and industry experts involved. To overcome these deficits, method and software prototype need to be tested and discussed in a broader context. As an initial step, the results have been introduced to fifteen industry partners and three research partners in the context of the two follow-up research projects ImPaKT and BIKINI. Exchange with experts shows high interest in the ProMaRC method and dependency analysis in particular. Experts also confirmed evaluation results in two workshops with up to 15 practitioners and ongoing exchange.
The presented ProMaRC method contributes to the demand for proactive requirement change management [2,5,6,8,14] and practice [1,4,16]. It opens up a new way to reduce the risk of project failure by means of requirements change risks assessment (RQ1) and management (RQ2) in the early development stages of complex technical systems. Additionally, it gives a framework for existing approaches of ECM [8,9,23,33,34,88,89] and RCM [5,10,13,31,48,90] to be used for proactive risk management. In the field of dependency analysis, the ProMaRC method demonstrates application potentials for transformer-based machine learning technique BERT in requirements engineering.
Future research directions are: (1) improvement of the ProMaRC method, (2) integration into the broader context (development processes and model-based systems engineering) and (3) extensive evaluation. Improvement of the ProMaRC method can be carried out in the context of dependency analysis and impact assessment. For dependency analysis, a more efficient way to create training data or train the BERT model needs to be developed. Experts are not willing to create large datasets for training manually and data augmentation techniques applied (for instance random oversampling) might lead to overfitted dependency models. Furthermore, transferability of dependency models into new development contexts (for instance, different branch or product) needs to be improved in terms of analysis performance. Transferability is key to enable broad usage in an industrial context and reduces application effort for single projects. For impact assessment, the impact evolvement (for instance sudden burst or rising [71]) can be considered to recommend more suitable proactive measures.
Integrating the ProMaRC method into the broader development context is essential for long-term embodiment of proactive change management. The method needs to be integrated into established development approaches (for instance systems engineering). Future research also needs to investigate the linkage of the ProMaRC method towards model-based systems engineering (MBSE). MBSE aims to represent the interplay of requirements, functions, logical solution elements and physical solution elements by means of models. Automated dependency analysis as well as proactive change management hold great potential to more extensively include the requirements layer into MBSE approaches (for instance, for effect chain analysis [91]).
Lastly, future research needs to continue the evaluation of the ProMaRC method. On the one hand, accuracy of likelihood and impact assessment need to be investigated based on long-term historical data. Since there are no suitable datasets available (systematically capturing propagation effects, change impact and change initiators), those need to be captured for long-term evaluation. On the other hand, long-term evaluation of method usefulness (success evaluation) needs to be carried out in benchmark studies, capturing different branches, company sizes and development methods. These development projects need to be characterized comparatively to be able to make a reliable statement about the success of the ProMaRC method. On top of that, promising application areas should be identified that are expected to benefit largely from proactive management of requirement changes. For example, complex block chain technologies, where high novelty meets a volatile environment with several stakeholders and requirement changes introduce massive cost increases and time expenditures [92].
Author Contributions
Conceptualization, C.O. and I.G.; methodology, C.O., D.P. and I.G.; software, D.P. and C.O.; validation, C.O., D.P. and I.G.; formal analysis, C.O., D.P. and I.G.; investigation, C.O.; resources, I.G.; data curation, C.O., D.P. and I.G.; writing—original draft preparation, C.O., I.G. and D.P.; writing—review and editing, I.G.; visualization, C.O. and I.G.; supervision, I.G.; project administration, I.G. and C.O.; funding acquisition, I.G. and C.O. All authors have read and agreed to the published version of the manuscript.
Funding
This research was enabled by the funding of the German Ministry for Education and Research (BMBF) in the context of the project ARCA (“Automated requirement change analysis for complex technical systems”) within the program “Software Campus” (01IS17046).
Data Availability Statement
Data sharing not applicable.
Acknowledgments
The authors acknowledge the financial support by the Federal Ministry of Education and Research of Germany.
Conflicts of Interest
The authors declare no conflict of interest.
Appendix A. Delimitation Matrices
This delimitation matrix is aggregated from previous research contributions: [14,49,55,93,94].
Table A1.
Delimitation Matrices.


Appendix B. Workshops with Industry Experts
Table A2.
Overview of workshops.
Appendix C. Guideline for Collective Impact Assessment

Figure A1.
Overview of guidelines for the assessment of change impacts.

Appendix D. Questionnaire Results
To evaluate the method as well as the software prototype, experts from the case study projects were asked to fill out the questionnaire below. Attendees were responsible for various tasks in case study projects, e.g., project coordination, conceptual design and development or production. The number of team members involved in each case study project varied, but did not exceed ten.
The first part of the questionnaire (questions 1–6) is used to create an overview of the people who participated and projects considered (cf. Section 2). Results are that participants come from the field of software engineering or industrial engineering. Roles are requirements engineer, subject matter expert, head of department and student.
The following diagrams show the results of questionnaire analysis, evaluated according to the following scale (Likert Scale):
- Strongly disagree (−2)
- Disagree (−1)
- Neither agree nor disagree / neutral (0)
- Agree (1)
- Strongly agree (2)
Diagrams show the range and mean value of the answers. Besides there are yes/no questions.

Figure A2.
Questionnaire results on area “usability”.


Figure A3.
Questionnaire results on area “availability of information”.


Figure A4.
Questionnaire results on area “application effort”.


Figure A5.
Questionnaire results on area “accuracy of results”.


Figure A6.
Questionnaire results on area “success evaluation”.

Appendix E. Impact Model for Success Evaluation

Figure A7.
Impact model (based on [46]) for success evaluation.

Appendix F. Questionnaire for Project Characteristics
Table A3.
Questionnaire for project characteristics.
References
- The Standish Group. Chaos Manifesto 2018; Standish Group: West Yarmouth, MA, USA, 2017. [Google Scholar]
- Morkos, B.; Shankar, P.; Summers, J.D. Predicting requirement change propagation, using higher order design structure matrices: An industry case study. J. Eng. Des. 2012, 23, 905–926. [Google Scholar] [CrossRef]
- Fernandes, J.; Henriques, E.; Silva, A.; Moss, M.A. Requirements change in complex technical systems: An empirical study of root causes. Res. Eng. Des. 2015, 26, 37–55. [Google Scholar] [CrossRef]
- Almefelt, L.; Berglund, F.; Nilsson, P.; Malmqvist, J. Requirements management in practice: Findings from an empirical study in the automotive industry. Res. Eng. Des. 2006, 17, 113–134. [Google Scholar] [CrossRef]
- Hein, H.; Voris, N.; Morkos, B. Predicting requirement change propagation through investigation of physical and functional domains. Res. Eng. Des. 2018, 29, 309–328. [Google Scholar] [CrossRef]
- Neumann, M. Ein Modellbasierter Ansatz zur Risikoorientierten Entwicklung Innovativer Produkte. Ph.D. Thesis, Ruhr-University Bochum, Bochum, Germany, 2016. [Google Scholar]
- Giffin, M.; de Weck, O.; Bounova, G.; Keller, R.; Eckert, C.; Clarkson, P.J. Change Propagation Analysis in Complex Technical Systems. J. Mech. Des. 2009, 131, 81001. [Google Scholar] [CrossRef]
- Koh, Y.; Caldwell, M.; Clarkson, J. A method to assess the effects of engineering change propagation. Res. Eng. Des. 2012, 23, 329–351. [Google Scholar] [CrossRef]
- Clarkson, P.J.; Simons, C.; Eckert, C. Predicting Change Propagation in Complex Design. J. Mech. Des. 2004, 126, 788–797. [Google Scholar] [CrossRef]
- Morkos, B. Computational Representation and Reasoning Support for Requirements Change Management in Complex System Design. Ph.D. Thesis, Clemson University, Clemson, SC, USA, 2012. [Google Scholar]
- Kurrle, A. Durchgängige Dokumentation von Verteilten Zielsystemen in der Produktentwicklung durch Verwendung semantischer Metainformationen am Beispiel Connected Car. Ph.D. Thesis, Karlsruher Institut for Technology, Karlsruhe, Germany, 2018. [Google Scholar]
- Song, Y.-W.; Herzog, M.; Bender, B. Understanding the Initial Requirements Definition in Early Design Phases. Proc. Int. Conf. Eng. Des. 2019, 1, 3751–3760. [Google Scholar] [CrossRef]
- Jayatilleke, S.; Lai, R. A systematic review of requirements change management. Inf. Softw. Technol. 2018, 93, 163–185. [Google Scholar] [CrossRef]
- Graessler, I.; Oleff, C.; Scholle, P. Method for Systematic Assessment of Requirement Change Risk in Industrial Practice. Appl. Sci. 2020, 10, 8697. [Google Scholar] [CrossRef]
- The Standish Group. The CHAOS Report; Standish Group: West Yarmouth, MA, USA, 1995. [Google Scholar]
- The Standish Group. Chaos Manifesto 2011; Standish Group: West Yarmouth, MA, USA, 2011. [Google Scholar]
- Lindvall, M. An Empirical Study of Requirements-Driven Impact Analysis in Object-Oriented Software Evolution. Ph.D. Thesis, Linköping University, Linköping, Sweden, 1997. [Google Scholar]
- Rodrigues da Silva, A. Quality of requirements specifications. In Proceedings of the 29th Annual ACM Symposium on Applied Computing, Gyeongju, Korea, 24–28 March 2014; Cho, Y., Ed.; ACM: New York, NY, USA, 2014; pp. 1021–1022, ISBN 9781450324694. [Google Scholar]
- Merriam-Webster.com. Dictionary. Proactive. Available online: https://www.merriam-webster.com/dictionary/proactive (accessed on 26 November 2021).
- Lindemann, U. Integriertes Änderungsmanagement, 1st ed.; Springer: Berlin/Heidelberg, Germany, 1998; ISBN 978-3540634904. [Google Scholar]
- Ebert, C. Systematisches Requirements Engineering: Anforderungen Ermitteln, Dokumentieren, Analysieren und Verwalten, 6th ed.; Springer: Berlin/Heidelberg, Germany, 2019; ISBN 9783960884545. [Google Scholar]
- Ghosh, S.; Ramaswamy, S.; Jetley, R.P. Towards Requirements Change Decision Support. In Proceedings of the 20th Asia-Pacific Software Engineering Conference (APSEC), Bangkok, Thailand, 2–5 December 2013; Muenchaisri, P., Rothermel, G., Eds.; IEEE: Piscataway, NJ, USA, 2013; pp. 148–155. [Google Scholar]
- Wickel, M.C. Änderungen Besser Managen. Ph.D. Thesis, Technical University Munich, Munich, Germany, 2017. [Google Scholar]
- Fricke, E. Der Änderungsprozess als Grundlage einer nutzerzentrierten Systementwicklung. Ph.D. Thesis, Technical University Munich, Munich, Germany, 1998. [Google Scholar]
- Jarratt, T.A.W.; Eckert, C.M.; Caldwell, N.H.M.; Clarkson, P.J. Engineering change: An overview and perspective on the literature. Res. Eng. Des. 2011, 22, 103–124. [Google Scholar] [CrossRef]
- VDA QMC Working Group 13/Automotive SIG. Automotive SPICE Process Assessment / Reference Model. 2017. Available online: http://www.automotivespice.com/ (accessed on 19 December 2021).
- Smith, P.G.; Merritt, G.M. Proactive Risk Management: Controlling Uncertainty in Product Development; Productivity Press: New York, NY, USA, 2002; ISBN 1563272652. [Google Scholar]
- Lührig, T. Risikomanagement in der Produktentwicklung der Deutschen Automobilindustrie: Von der Konzeptentwicklung bis zum Produktionsanlauf, 1st ed.; Shaker: Aachen, Germany, 2006; ISBN 3832248277. [Google Scholar]
- Grundmann, T. Ein Anwendungsorientiertes System für das Management von Produkt- und Prozessrisiken. Ph.D. Thesis, Technical University, Aachen, Germany, 2008. [Google Scholar]
- Hamraz, B.; Caldwell, N.H.M.; Clarkson, P.J. A Holistic Categorization Framework for Literature on Engineering Change Management. Syst. Engin. 2013, 16, 473–505. [Google Scholar] [CrossRef]
- Jayatilleke, S.; Lai, R.; Reed, K. A method of requirements change analysis. Requir. Eng. 2018, 23, 493–508. [Google Scholar] [CrossRef]
- Conrow, E.H. Effective Risk Management: Some Keys to Success; Aiaa: Reston, VA, USA, 2003; ISBN 1-563749-581-2. [Google Scholar]
- Kocar, V.; Akgunduz, A. ADVICE: A virtual environment for Engineering Change Management. Comput. Ind. 2010, 61, 15–28. [Google Scholar] [CrossRef]
- Gärtner, T.; Rohleder, N.; Schlick, C.M. Simulation of Product Change Effects on the Duration of Development Processes based on the DSM. In Proceedings of the 10th International DSM Conference, Stockholm, Sweden, 11–12 November 2008; pp. 199–208. [Google Scholar]
- Guodong, Y.; Yu, Y.; Xuefeng, Z.; Chi, L. Network-Based Analysis of Requirement Change in Customized Complex Product Development. Int. J. Inf. Technol. Decis. Mak. 2017, 16, 1125–1149. [Google Scholar] [CrossRef]
- Zheng, Y.; Yang, Y.; Zhang, N. A model for assessment of the impact of configuration changes in complex products. J. Intell. Manuf. 2020, 31, 501–527. [Google Scholar] [CrossRef]
- Pasqual, M.C.; de Weck, O.L. Multilayer network model for analysis and management of change propagation. Res. Eng. Des. 2012, 23, 305–328. [Google Scholar] [CrossRef]
- Engelhardt, R.A. Uncertainty Mode and Effects Analysis—Heuristische Methodik zur Analyse und Beurteilung von Unsicherheiten in Technischen Systemen des Maschinenbaus. Ph.D. Thesis, Techniche Universitat Darmstadt, Darmstadt, Germany, 2013. [Google Scholar]
- Fricke, E.; Gebhard, B.; Negele, H.; Igenbergs, E. Coping with changes: Causes, findings, and strategies. Syst. Engin. 2000, 3, 169–179. [Google Scholar] [CrossRef]
- Bender, B.; Gericke, K. Pahl/Beitz Konstruktionslehre: Methoden und Anwendung Erfolgreicher, 9th ed.; Springer Vieweg: Wiesbaden, Germany, 2019; ISBN 978-3-662-57302-0. [Google Scholar]
- Ulrich, H. Die Betriebswirtschaftslehre als anwendungsorientierte Sozialwissenschaft. In Die Führung des Betriebes: Curt Sandig zu Seinem 80. Geburtstag Gewidmet; Geist, M., Köhler, R., Eds.; Poeschel: Stuttgart, Germany, 1981; pp. 1–27. ISBN 3791003089. [Google Scholar]
- Hevner, A.; Chatterjee, S. Design Research in Information Systems: Theory and Practice; Springer Science+Business Media LLC: Boston, MA, USA, 2010; ISBN 9781441956521. [Google Scholar]
- Johannesson, P.; Perjons, E. An Introduction to Design Science; Springer International Publishing AG: New York, NY, USA, 2014; ISBN 978-3-319-10631-1. [Google Scholar]
- Eckert, C.M.; Clarkson, P.J.; Stacey, M.K. The spiral of applied research: A methodological view on integrated design research. In Proceedings of the 14th International Conference on Engineering Design, Stockholm, Sweden, 19–21 August 2003; Folkeson, A., Gralen, K., Norell, M., Sellgren, U., Eds.; Design Society: Glasgow, UK, 2003; pp. 245–255, ISBN 1-904670-00-8. [Google Scholar]
- Peffers, K.; Tuunanen, T.; Rothenberger, M.A.; Chatterjee, S. A Design Science Research Methodology for Information Systems Research. J. Manag. Inf. Syst. 2007, 24, 45–77. [Google Scholar] [CrossRef]
- Blessing, L.T.M.; Chakrabarti, A. DRM, a Design Research Methodology, 1st ed.; Springer London: London, UK, 2009; ISBN 978-1-84882-587-1. [Google Scholar]
- Gräßler, I.; Dattner, M.; Bothen, M. Main Feature List as core success criteria of organizing Requirements Elicitation. In Proceedings of the R & D Management Conference 2018, Milan, Italy, 30 June–4 July 2018; pp. 1–16. [Google Scholar]
- Felfernig, A.; Stettinger, M.; Falkner, A.; Atas, M.; Franch, X.; Palomares, C. OpenReq: Recommender Systems in Requirements Engineering. In Proceedings of the Workshop Papers of I-Know 2017: Co-Located with International Conference on Knowledge Technologies and Data-Driven Business, Graz, Austria, 11–12 October 2017; Available online: http://ase.ist.tugraz.at/ASE/wp-content/uploads/2014/01/openreq-4.pdf (accessed on 6 December 2021).
- Gräßler, I.; Preuß, D.; Oleff, C. Automatisierte Identifikation und Charakterisierung von Anforderungsabhängigkeiten—Literaturstudie zum Vergleich von Lösungsansätzen. In Design fox X-Beiträge Zum 30. DfX-Symposium; Krause, D., Paetzold, K., Wartzack, S., Eds.; TuTech Verlag: Hamburg, Germany, 2020; pp. 199–208. [Google Scholar]
- González-Carvajal, S.; Garrido-Merchán, E.C. Comparing BERT against Traditional Machine Learning Text Classification, 2020. Available online: https://arxiv.org/pdf/2005.13012 (accessed on 6 December 2021).
- Alpaydin, E. Maschinelles Lernen, 2nd ed.; De Gruyter: Berlin, Germany, 2019; ISBN 9783110617894. [Google Scholar]
- Devlin, J.; Chang, M.-W.; Lee, K.; Toutanova, K. BERT: Pre-Training of Deep Bidirectional Transformers for Language Understanding, 2019. Available online: https://arxiv.org/pdf/1810.04805v2 (accessed on 19 December 2021).
- huggingface. bert-base-cased. Available online: https://huggingface.co/bert-base-cased (accessed on 6 December 2021).
- huggingface. BERT Tokenizer. Available online: https://huggingface.co/transformers/main_classes/tokenizer.html (accessed on 6 December 2021).
- Gräßler, I.; Oleff, C.; Preuß, D. Holistic change propagation and impact analysis in requirements management. In Proceedings of the R&D Management Conference 2021, Strathclyde, UK, 6–8 July 2018. [Google Scholar]
- Dahlstedt, Å.G.; Persson, A. Requirements Interdependencies—Moulding the State of Research into a Research Agenda. In Proceedings of the Ninth International Workshop on Requirements Engineering: Foundation for Software Quality (REFSQ 2003), Klagenfurt, Austria, 16–17 June 2003; Salinesi, C., Regnell, B., Kamsties, E., Eds.; Universitätsbibliothek Essen: Essen, Germany, 2003; pp. 71–80. [Google Scholar]
- Gräßler, I.; Hentze, J. Structuring and Describing Requirements in a Flexible Mesh for Development of Smart Interdisciplinary Systems. In Proceedings of the Smart Structures and Materials 7th ECCOMAS Thematic Conference on Smart Structures and Materials, Ponta Delgada, Portugal, 3–6 June 2015; Araujo, A., Mota Soares, C.A., Eds.; Springer International Publishing: Basel, Switzerland, 2017; pp. 1622–1631. [Google Scholar]
- Pohl, K. Process-Centered Requirements Engineering; Research Studies Press: Taunton, UK, 1996; ISBN 9780863801938. [Google Scholar]
- Zhang, H.; Li, J.; Zhu, L.; Jeffery, R.; Liu, Y.; Wang, Q.; Li, M. Investigating dependencies in software requirements for change propagation analysis. Inf. Softw. Technol. 2014, 56, 40–53. [Google Scholar] [CrossRef]
- Goknil, A.; Kurtev, I.; van den Berg, K.; Spijkerman, W. Change impact analysis for requirements: A metamodeling approach. Inf. Softw. Technol. 2014, 56, 950–972. [Google Scholar] [CrossRef]
- Pohl, K.; Rupp, C. Basiswissen Requirements Engineering: Aus- und Weiterbildung nach IREB-Standard zum Certified Professional for Requirements Engineering Foundation Level, 5th ed.; dpunkt: Heidelberg, Germany, 2021; ISBN 978-3-86490-814-9. [Google Scholar]
- Xing, W.; Ghorbani, A. Weighted PageRank algorithm. In Proceedings of the Second Annual Conference on Communication Networks and Services Research, Fredericton, NB, Canada, 21 May 2004; IEEE Computer Society, Ed.; IEEE: Piscataway, NJ, USA, 2004; pp. 305–314. [Google Scholar]
- Gräßler, I.; Thiele, H.; Oleff, C.; Scholle, P.; Schulze, V. Method for Analysing Requirement Change Propagation Based on a Modified Pagerank Algorithm. In Proceedings of the Design Society: International Conference on Engineering Design, ICED, Delft, The Netherlands, 5–8 August 2019; Design Society, Ed.; Cambridge University Press: Cambridge, UK, 2019; pp. 3681–3690. [Google Scholar]
- Brin, S.; Page, L. The anatomy of a large-scale hypertextual Web search engine. Comput. Netw. ISDN Syst. 1998, 30, 107–117. [Google Scholar] [CrossRef]
- Walden, D.D.; Roedler, G.J.; Forsberg, K.; Hamelin, R.D.; Shortell, T.M. Systems Engineering Handbook: A Guide for System Life Cycle Processes and Activities, 4th ed.; Wiley: Hoboken, NJ, USA, 2015; ISBN 9781118999400. [Google Scholar]
- McGee, S.; Greer, D. Software requirements change taxonomy: Evaluation by case study. In Proceedings of the 19th IEEE International Requirements Engineering Conference (RE), Trento, Italy, 29 August–2 September 2011; IEEE: Piscataway, NJ, 2011; pp. 25–34. [Google Scholar]
- McGee, S.; Greer, D. A Software Requirements Change Source Taxonomy. In Proceedings of the Fourth International Conference on Software Engineering Advances, Porto, Portugal, 20–25 September 2009; Boness, K., Fernandes, J.M., Hall, J., Machado, R.J., Oberhauser, R., Eds.; IEEE: Piscataway, NJ, USA, 2009; pp. 51–58, ISBN 978-1-4244-4779-4. [Google Scholar]
- Kleine Büning, H. Aussagenlogik: Deduktion und Algorithmen; Springer Vieweg: Wiesbaden, Germany, 1994; ISBN 9783322848093. [Google Scholar]
- Gräßler, I.; Pottebaum, J.; Oleff, C.; Preuß, D. Handling of explicit uncertainty in requirements change management. In Proceedings of the Design Society: International Conference in Engineering Design, Gothenburg, Sweden, 16–20 August 2021; Cambridge University Press: Cambridge, UK, 2021; pp. 1687–1696. [Google Scholar]
- Diederichs, M. Risikomanagement und Risikocontrolling, 3rd ed.; Verlag Franz Vahlen: München, Germany, 2012; ISBN 9783800642229. [Google Scholar]
- Gericke, K.; Blessing, L. Enhancing Project Robustness: A Risk Management Perspective. Ph.D. Thesis, Technische Universität Berlin, Berlin, Germany, 2011. [Google Scholar]
- Dahmen, J.W. Prozeßorientiertes Risikomanagement zur Handhabung von Produktrisiken; Shaker: Aachen, Germany, 2002; ISBN 3832208356. [Google Scholar]
- Riverbank Computing. PyQt. Available online: https://riverbankcomputing.com/software/pyqt/intro (accessed on 7 December 2021).
- Pedregosa, F.; Varoquaux, G.; Gramfort, A.; Michel, V.; Thirion, B.; Grisel, O.; Blondel, M.; Prettenhofer, P.; Weiss, R.; Dubourg, V.; et al. Scikit-learn: Machine Learning in {P}ython. J. Mach. Learn. Res. 2011, 2825–2830. [Google Scholar]
- Gräßler, I.; Oleff, C.; Hieb, M.; Preuß, D. Automated requirement dependency analysis for complex technical systems: (in Review). In Proceedings of the 17th International Design Conference, Cavtat, Croatia, 23–26 May 2022; Design Society, Ed.; Cambridge University Press: Cambridge, UK, 2022. [Google Scholar]
- Sommerville, I. Software Engineering, 10th ed.; Pearson Studium: München, Germany, 2018; ISBN 9783863268350. [Google Scholar]
- International Organization for Standardization/International Electrotechnical Commission (ISO/IEC). Software-Engineering—Qualitätskriterien und Bewertung von Softwareprodukten (SQuaRE): Qualitätsmodell und Leitlinien; International Organization for Standardization/International Electrotechnical Commission (ISO/IEC): Washington, DC, USA, 2011. [Google Scholar]
- Brooke, J. SUS-A quick and dirty usability scale. Usability Eval. Ind. 1996, 189, 4–7. [Google Scholar]
- Laugwitz, B.; Held, T.; Schrepp, M. Construction and evaluation of a user experience questionnaire. In Proceedings of the 4th Symposium of the Workgroup Human-Computer Interaction and Usability Engineering of the Austrian Computer Society, USAB, Graz, Austria, 20–21 November 2008; Holzinger, A., Ed.; Springer: Berlin/Heidelberg, Germany, 2008; pp. 63–76. [Google Scholar]
- Bangor, A.; Kortum, P.; Miller, J. Determining what individual SUS scores mean: Adding an adjective rating scale. J. Usability Stud. 2009, 4, 114–123. [Google Scholar]
- presseportal.de. Meistgenutzte Office-Software von Büromitarbeitern in Unternehmen in Deutschland im Jahr 2020. Available online: https://de.statista.com/statistik/daten/studie/77226/umfrage/internetnutzer---verbreitung-von-office-software-in-deutschland/ (accessed on 26 November 2021).
- Guido van Rossum. Python license. Available online: https://docs.python.org/3/license.html (accessed on 30 November 2021).
- Virtual Desktop Infrastructure (VDI); Vanguard Energy ETF (VDE). Entwicklung Mechatronischer und Cyber-Physischer Systeme; Beuth Verlag GmbH: Düsseldorf, Germany, 2021. [Google Scholar]
- Virtual Desktop Infrastructure (VDI). Entwicklung Technischer Produkte und Systeme—Modell der Produktentwicklung; Beuth Verlag GmbH: Düsseldorf, Germany, 2019. [Google Scholar]
- ISO/IEC/IEEE. Systems and Software Engineering-System Life Cycle Processes; ISO/IEC/IEEE: Geneva, Switzerland, 2015. [Google Scholar]
- Pohl, K. Requirements Engineering: Fundamentals, Principles, and Techniques; Springer: Berlin/Heidelberg, Germany, 2010; ISBN 3642125778. [Google Scholar]
- Dunn-Rankin, P. Scaling Methods: Peter Dunn-Rankin; L. Erlbaum: Hillsdale, NJ, USA, 1983; ISBN 0898592038. [Google Scholar]
- Hamraz, B.; Caldwell, N.H.; Wynn, D.C.; Clarkson, P.J. Requirements-based development of an improved engineering change management method. J. Eng. Des. 2013, 24, 765–793. [Google Scholar] [CrossRef]
- Deubel, T.; Conrad, J.; Köhler, C.; Wanke, S.; Weber, C. Change impact and risk analysis (CIRA): Combining the CPM/PDD theory and FMEA-methodology for an improved engineering change management. In Proceedings of the Design Society, 16th International Conference on Engineering Design, Paris, France, 28–31 July 2007; Cambridge University Press: Cambridge, UK, 2007. [Google Scholar]
- Cheng, H.; Chu, X. A network-based assessment approach for change impacts on complex product. J. Intell. Manuf. 2012, 23, 1419–1431. [Google Scholar] [CrossRef]
- Gräßler, I.; Wiechel, D.; Koch, A.-S.; Preuß, D.; Oleff, C. Model-based effect chain analysis for complex systems: (in Review). In Proceedings of the 17th International Design Conference, Cavtat, Croatia, 23–26 May 2022; Design Society, Ed.; Cambridge University Press: Cambridge, UK, 2022. [Google Scholar]
- Saberi, S.; Kouhizadeh, M.; Sarkis, J.; Shen, L. Blockchain technology and its relationships to sustainable supply chain management. Int. J. Prod. Res. 2019, 57, 2117–2135. [Google Scholar] [CrossRef]
- Gräßler, I.; Scholle, P.; Hentze, J.; Oleff, C. Semi-Automatized Assessment of Requirement Interrelations. In Proceedings of the 15th International Design Conference, Dubrovnik, Croatia, 21–24 May 2018; pp. 325–334. [Google Scholar]
- Gräßler, I.; Oleff, C. Risikoorientierte Analyse und Handhabung von Anforderungsänderungen. In Design for X, Proceedings of the Beiträge zum 30. DfX-Symposium, Bamberg, Germany, 18–19 September 2019; Krause, D., Paetzold, K., Wartzack, S., Eds.; TuTech Verlag: Hamburg, Germany, 2019. [Google Scholar]


Publisher’s Note: MDPI stays neutral with regard to jurisdictional claims in published maps and institutional affiliations. |
© 2022 by the authors. Licensee MDPI, Basel, Switzerland. This article is an open access article distributed under the terms and conditions of the Creative Commons Attribution (CC BY) license (https://creativecommons.org/licenses/by/4.0/).