Abstract
Ribonucleic acid Sequencing (RNA-Seq) analysis is particularly useful for obtaining insights into differentially expressed genes. However, it is challenging because of its high-dimensional data. Such analysis is a tool with which to find underlying patterns in data, e.g., for cancer specific biomarkers. In the past, analyses were performed on RNA-Seq data pertaining to the same cancer class as positive and negative samples, i.e., without samples of other cancer types. To perform multiple cancer type classification and to find differentially expressed genes, data for multiple cancer types need to be analyzed. Several repositories offer RNA-Seq data for various cancer types. In this paper, data from the Mendeley data repository for five cancer types are analyzed. As a first step, RNA-Seq values are converted to 2D images using normalization and zero padding. In the next step, relevant features are extracted and selected using Deep Learning (DL). In the last phase, classification is performed, and eight DL algorithms are used. Results and discussion are based on four different splitting strategies and k-fold cross validation for each DL classifier. Furthermore, a comparative analysis is performed with state of the art techniques discussed in literature. The results demonstrated that classifiers performed best at 70–30 split, and that Convolutional Neural Network (CNN) achieved the best overall results. Hence, CNN is the best DL model for classification among the eight studied DL models, and is easy to implement and simple to understand.
1. Introduction
Cancer is a disease that starts with abnormal behavior and division of some cells, causing damage to other, nearby cells, resulting in a clod or tumor which, in certain cases, may cause death [1]. Early discovery and proper treatment can reduce the chances of damage to other cells. The high mortality rate from cancer [2] is motivating researchers to develop new methods for early cancer detection and classification. However, early detection is very complicated, because cancer cells are disordered. RNA-Seq analysis is extremely helpful in this regard.
RNA-Seq is a new and popular technique that is used to detect new isoforms and transcripts by providing more normalized and less noisy data for prediction and classification purposes [3,4]. The most important function of transcriptome profiling is to determine the differentially expressed genes occurring in a body or detect variations in genes at different levels [5]. Identification and quantification in one place can be made using RNA-sequencing [6]. RNA-Seq data are widely available from different databases, and are being used to classify diseases like breast invasive carcinoma (BRCA), colon adenocarcinoma (COAD), kidney chromophobe, etc. [7]. However, analyses of RNA gene expression data are quite complex because of their high dimensions, complexity, and the existence of duplications in feature values [8]. Therefore, a need for automatic feature extraction exists, which may be addressed through machine learning (ML) and deep learning algorithms [9].
Machine learning is a branch of artificial intelligence which is used to identify associations among data by finding underlying patterns using past experience and learning [10]. ML is becoming indispensable in the age of mass data, given that it is becoming increasingly difficult for humans to find trends and patterns in data to predict future outcomes. Hence, machine learning is replacing humans to identify underlying patterns in data and make predictions for the future to make proper decisions. ML extracts features itself with almost zero human intervention, and then uses these features to make predictions. ML is being implemented almost everywhere. Its typical applications are in natural language processing, forecasting, flight governance, and biology to detect sequences of proteins and RNA [11,12].
There are certain limitations of ML-based algorithms in terms of selecting promising features from biomedical images for classification. However, these limitations are being overcome by deep learning. Deep learning is an emerging field based upon some advancements in ML. It is a technique which, without considering the in-between steps of feature extraction, tries to focus on making a conclusion based on raw data. This is why it is also named “automated feature engineering” [13,14]. Deep learning is being actively used in many research areas, including bioinformatics, computation medicine, image and graphical information processing, etc. [7]. A convolutional neural network is a DL model for use with a large number of graphical images. Using weighted distribution, subsampling, and confined association techniques, CNN extracts the most relevant features and reduces the complexity of the neural network [15].
Deep learning is being implemented in many disease identification processes, and is improving machine learning performance in the field [16]. Multilayer perceptron (MLP) is a modern technology known as a feed-forward neural network used in deep learning to identify and classify different types of tumors [17,18]. A previous study lists instances in which deep learning has been used as stacked denoising autoencoders (SDAE) to transfer high dimensional noisy data to low dimensional data for the classification of breast cancer [8]. Another study proposed and implemented a new approach named convolutional neural network for coexpression (CNNC), and the task of gene relationship inference in a supervised setting was performed [19,20,21].
The differential analysis is the most significant part of RNA-Seq analyses. Conventional differential analysis methods usually match the tumor samples to the normal samples, i.e., from the same tumor type. Such a method would fail in differentiating tumor types because it lacks knowledge of other tumor types. To better understand the cause of various tumors, detailed analyses using RNA-Seq data are required [22]. For the extraction of the most relevant features, most analyses try to identify differentially expressed genes. So, it is necessary to build a method that includes knowledge of multiple tumor types in the analysis [16].
In spite of the fact that RNA-Seq data are beneficial for the detection of variations at the gene level, it is challenging to work with RNA-Seq data due to their spatial features. Eight DL approaches have been implemented in the present study for cancer classification from gene expression data. In this study, we use RNA-Seq data of five tumors. The numeric RNA-Seq values of multiple tumors are then converted to 2D images. Then most relevant features from these images are extracted and selected using DL, and then classified accordingly with eight DL models. The main objectives of our work are as follows:
- To investigate the impact of a preprocessing step on the classification accuracy.
- To examine the impact of feature engineering using DL at classification output.
- To investigate the performance of eight DL algorithms for the classification of multiple tumor types, and to make comparisons with other state of the art methods.
2. Related Work
Sterling Ramroach et al. [23] used different machine learning algorithms to classify cancer. In their study, a dataset was downloaded from an online data portal, COSMIC, for multiple cancer types. The applied machine learning models were random forest (RF), gradient boosting machine (GBM), neural networks (NN), K nearest neighbor (KNN), and support vector machine (SVM). The authors performed multiple experiments for various cancer types and primary sites. Notably, RF achieved 100% accuracy in classification and was easy to tune compared to other algorithms.
Yawen Xiao et al. [24] proposed a new deep learning-based, multimodel ensemble approach that uses five machine learning algorithms, i.e., KNN, SVM, DT’s, RF’s, and gradient boosting decision trees (GBDT). Their proposed strategy was applied to three types of cancer: LUAD, stomach adenocarcinoma (STAD), and BRCA. This strategy was implemented so that each classifier would be trained using the provided data to obtain predictions individually; these predictions are then applied to a multimodel ensemble approach using deep learning. This method provides more accurate results compared to those generated by an individual classifier to predict cancer.
Dincer Goksuluk et al. [25] presented a new range of classifiers based on Voom, named “voomNSC”, “voomNBLDA”, “voomPLDA”, as well as SVM classifiers for the classification and evaluation of RNA-Sequencing data on cervical and lung cancer, as well as aging datasets. VoomNSC is based on voom transformation with the NSC method to build more accurate and robust classifiers. VoomDLDA and voomDQDA are not sparse base, which means that they use all of the features provided in the model. In contrast, voomNSC is a sparse base classifier and uses the only subset of features in the model. The results were compared with PLDA, NBLDA, NSC, and it was found that voomNSC produced the best results.
Paul Ryvkin et al. [26] presented a novel numerical approach for CoRAL (classification of RNA by analysis of length). For this purpose, the authors took small RNA sequence datasets and sequenced them. Then, multiple preprocessing steps were performed, i.e., the dataset was passed to three trimmed adapter sequences, and a FASTQ file was generated. By matching with a reference file, reads were aligned, and results were stored in a SAM file. After this, the authors executed a mismatch rate on reads, and again, the results were added to a SAM file. After these steps, aligned matched genes were converted to a BAM file to be presented to CoRAL. CoRAL extracts important features and classifies multiple types of RNA sequences. This method not only classifies small RNA sequences, but also provides better guidance to the user.
Nour Eldeen M. Khalifa et al. [27] proposed a novel optimized deep learning approach based on binary particle swarm optimization–decision tree (BPSO—DT) and CNN. The dataset was used in their study to classify different types of cancer, i.e., kidney renal clear cell carcinoma (KIRC), BRCA, lung squamous cell carcinoma (LUSC), lung adenocarcinoma(LUAD), and uterine corpus endometrial carcinoma(UCEC). This approach comprised three phases. The first was related to feature extraction, and BPSO was used to extract relevant features. The second phase aimed to solve the problem of overfitting data to get accurate results, and as such, was called the augmentation phase. The third and last phase was the deep CNN phase, which was used the CNN architecture of connected layers to classify types of cancer based on given data. This methodology produced more accurate results than the CNN technique.
Hamid Reza Hassanzadeh et al. [28] put forward a new pipeline approach for predicting the survival chances of cancer patients. The proposed technique used graph-based semisupervised learning Laplacian support vector machines. This approach was used to predict the survival of kidney cancer (KIRC) and neuroblastoma (NB) patients. It comprised four steps. The first is preprocessing, in which data are analyzed and stored in feature metrics. The second step involves feature extraction, in which overfitting problems are removed. In the third, different models are trained. The final step is the adoption of a generalization strategy to check and give weight to each model according to its accuracy. This pipeline approach was compared to supervised SVM and produced more accurate results.
Jiande Wu et al. [29] proposed the use of different machine learning algorithms for the classification of triple-negative breast cancer from nontriple negative breast cancer. For this purpose, RNA-sequencing gene expression data were downloaded from TCGA for 110 triple-negative breast cancer samples and 992 nontriple negative samples. The applied machine learning classification models were SVM, KNN, Naïve Bayes (NB), and DT. Because of the high dimensions of the data, before classification, an extra step, named feature selection, was performed to obtain the most relevant features. The accuracies of the classification task were 90%, 87%, 85%, and 87%, respectively. It is clear from the results that SVM performed better than the other approaches.
Léon-Charles Tranchevent et al. [30] proposed a new approach for feature selection based on graphs combined with deep neural networks to anticipate the clinical outcomes of neuroblastoma patients. This approach took patient data and applied the graph-based method to extract the most relevant features. The extracted features were then used to train the DNN model. Finally, the performance of the model was recorded. Its accuracy was compared with other classifiers, namely, support vector machine and random forest, trained on the same data. The proposed methodology outperformed these classifiers in predicting patient clinical outcomes.
Joseph M. de Guia et al. [16] proposed a deep learning model using CNN. The methodology was used for the complex problem of classifying of different types of cancer. This approach was applied to RNA-Seq data. The proposed CNN comprised an input layer, where input nodes with their specific weights were fully connected to three hidden layers, and output layers were connected to the in-between, hidden layers. This methodology provided better results compared to existing classification models like GA/kNN, BaselineCNN, random forest, and support vector machine.
Adam McDermald et al. [31] proposed a machine learning-based tool named GeneQC (gene expression quality control) to estimate the reliability of expression levels in accurately fromRNA sequence datasets. The authors used 95 RNA sequencing datasets from a total of seven plant and animal species. GeneQC took three types of information as input. The first mapping reads a SAM file, the second a reference genome FASTA file, and the last a species specific annotation file. GeneQC implements two processes, i.e., feature extraction through Perl and mathematical representation of the features extracted thereby in the R package. Lastly, GeneQC classifies the category of reading alignment of every single genome.
Yawen Xiao et al. [2] presented a stacked sparse, auto-encoder using a semisupervised deep learning approach. This strategy was used to predict different types of cancers, i.e., LUAD, STAD, and BRCA. This model comprised semisupervised feature extraction techniques and supervised classification techniques to handle both labeled and unlabeled data, in order to extract more precise information for cancer predictions. The proposed methodology was compared with other state of the art machine learning classifiers like SVM, RF, NN, and auto-encoders, and was shown to provide more accurate prediction results. Other research has discussed the application of technologies such as the Internet of Things (IoT), networks, software-defined networking (SDN), and wireless sensor networks (WSN) [32,33,34,35,36,37,38,39]
Boyu Lyu et al. [22] proposed an approach converting RNA-Seq data into 2D images which were then classified by CNN. This technique was applied to 32 types of tumors for classification. The workflow was composed of preprocessing gene expression data and converting it to 2D images, before sending it to CNN. CNN was used here as a classification model. In the third step, heat maps were developed for each class, and genes that were comparable to pixels were selected with high salience in a heat map. In the final step, the pathways of the selected genes were validated. For testing and comparison purposes, SVM and RF were used; the proposed model was shown to provide better accuracy.
Brian Aevermann et al. [40] proposed the use of feature selection and the binary manifestation technique of a random forest to identify biomarkers in high throughput sequencing. For this, the authors introduced NS-Forest version 2.0 in their study. This latest version of NS-Forest is suitable for two tasks, i.e., for downward examination and identification of active cell types. In their study, a cell with a gene expression with a clustered assignment was presented to the random forest, where important features were extracted through a Gini index. Genes were further ranked to overcome negative markers. Then, a binary expression score was used to identify top-ranked genes. To determine the minimum number of features, a threshold was used based upon a decision tree and an F-Beta score to examine possible combinations of biomarkers. To examine the performance of the method, experiments were conducted on human middle temporal gyrus (MTG).
Padideh Danaee et al. [8] presented an approach based on deep learning to diagnose cancer and identify important genes for the detection of breast cancer. For this, a stacked denoising autoencoder (SDAE) was used for feature extraction from a breast cancer data set. To validate the results, three classification algorithms were applied, namely, ANN, SVM with a linear kernel, and radial basis function kernel. Autoencoders are basically feed-forward neural networks that, by using hidden layers, produce an output layer which is much closer to the input layer. Moreover, SDAE performs dimensionality reduction stack by stack on RNA-Seq data. For a performance evaluation, the authors compared their approach with principal component analysis and kernel principal component analysis (KPCA), and noted that SDAE outperformed both.
Yang Guo et al. [41] proposed a new deep learning approach named boosting cascade deep forest (BCDForest) as an alternative to deep neural networks for the classification of cancer subtypes. This methodology was implemented on three microarray data sets containing adenocarcinoma, brain, and colon cancer, as well as data sets of RNA-Seq data including BRCA, GBM, Pancancers, and LUNG. This methodology worked as an ensemble of deep forests, whereby each forest was powerful in predicting the classification results. Cascade forest attempts to identify meaningful features in raw data by training and assembling decision tree-based random forests. This output was then compared with state-of-the-art classifiers, including SVM, KNN, LR, RF, and original gcforest. The authors noted that their proposed method provided more accurate results. Table 1 provides the precise view of literature discussed above

Table 1.
Comparative Review of Literature.
3. Materials and Methods
3.1. Data Sets
The dataset includes the gene expression values of five different types of cancer, i.e., lung adenocarcinoma (LUAD), breast invasive carcinoma (BRCA), kidney renal clear cell carcinoma (KIRC), lung squamous cell carcinoma (LUSC), and uterine corpus endometrial carcinoma (UCEC) and is accessed from [42]. Brief details about these tumors are discussed below.
3.1.1. BRCA
Breast invasive carcinoma (BRCA) is the most aggressive type of cancer in women [43,44].
3.1.2. KIRC
Kidney renal clear cell carcinoma (KIRC) is the most widespread form of renal cancer (comprising 70–80% or renal cancer cases), with a high death ratio worldwide [40,45].
3.1.3. LUAD
Lung adenocarcinoma (LUAD) is a standard form of cancer. LUAD mostly comprises 40% of all lung cancer diagnoses. In most cases, it affects nonsmokers [46]. In general, LUAD is encountered accidentally; it expands more slowly than other types of lung cancer.
3.1.4. LUSC
Lung squamous cell carcinoma (LUSC) is the second most common form of lung cancer, and is common among tobacco smokers. Smoke particles in the air spread LUSC cancer, making their residence usually in the middle of the lung [47].
3.1.5. UCEC
Uterine corpus endometrial carcinoma (UCEC) is a recurrent prenatal cancer that cannot be identified in its early stages [48]. It is the most widespread type of cancer in women. It has a high death rate because of the nonavailability of information on its biomarkers for early detection and treatment [49].
There are 972 columns and 2086 rows in our dataset. Some 971 features are available with a total of 2086 samples. The last column represents the cancer categories as follows: 1 for BRCA, 2 for KIRC, 3 For LUAD, 4 for LUSC, and 5 for UCEC. The gene expression dataset used in this study is based on [42]. A detailed description of the dataset is provided in Table 2.
Table 2.
Dataset Description.
3.2. Preprocessing
A number of steps are required to convert gene expression 1D data into 2D images to be presented to neural networks and other classification algorithms. First, we load the data into memory. Then, we normalize the values ranging from 0 to 2428 to 0 to 255 using Equation (1) [27], where 255 is the highest value of an image and 24,248 is the highest value in the gene expression dataset. In the last step, 971 features are converted to (32 × 32) pixel images by appending some zeros. Finally, as the output, we obtain 2086 images of size 32 × 32.
Pixel = Round (CellValue × 255/24,248)
3.3. Data Augmentation
Data augmentation means increasing the size of data artificially to overcome the chances of overfitting the model [27]. Different augmentation parameters are available to increase the size of data. Parameters are chosen according to the requirements of the data. In this study, we used zoom range, vertical flip, horizontal flip, and shear. In this way, a comprehensive comparative analysis of the discussed models is made with and without the use of augmentation techniques.
3.4. Classification Model
In this study, multiple deep learning models are implemented for classification purposes. Brief detail about these models is given below.
3.4.1. Convolutional Neural Network
CNN developed by Yann LeCun [50] at Paris, is implemented for the classification of medical data. The CNN is stimulated by the biological process of transmission of information between the neurons. CNN is not like traditional networks composed of only two layers (i.e., input and output); it is a standardized form of multilayer perceptron, consisting of a fully connected architecture made up of an input layer, hidden layers, and an output layer [50,51,52].
3.4.2. ResNet
ResNet, short for residual network, was proposed in 2015 by Shaoqing Ren, Xiangyu Zhang, Jian Sun, and Kaiming He working at Microsoft Research Asia Lab. The main motivation for proposing this new architecture was for the dissipation of gradients. Adding depth to model backpropagation hits the gradient, and performance degrades drastically [53,54]. Therefore, this model introduced skip connections in which layers reducing the model’s performance are skipped. It achieves very impressive results for image processing tasks [55]. Multiple ResNet architectures are available.
3.4.3. ResNet50
Another benefit of using ResNet is that the model’s performance does not decrease, even as a model becomes bigger and deeper [56]. ResNet50 is a version of ResNet developed by Shaoqing Ren, Xiangyu Zhang, Jian Sun, and Kaiming He working at Microsoft Research Asia Lab, which comprises of 50 layers of architecture: 48 convolutional layers, 1 max pool, and 1 average pooling layer.
3.4.4. ResNet101
ResNet101 is another variant of ResNet and developed by Shaoqing Ren, Xiangyu Zhang, Jian Sun, and Kaiming He at Microsoft Research Asia Lab, which is 2× deeper than ResNet50. It comprises of 101 layers and can be used to easily classify hundreds of classes.
3.4.5. ResNet152
ResNet152 is the most recent version of ResNet and developed by Shaoqing Ren, Xiangyu Zhang, Jian Sun, and Kaiming He at Microsoft Research Asia Lab. It is a convolutional neural network that is 152 layers deeper. As it is much deeper than ResNet50, it takes more computation time and resources than other models.
3.4.6. VGG
VGG16 is a popular model developed by K.Simonyan and A.Zisserman [57] in University of Oxford used in DL models for classification and feature extraction. It is a convolutional neural network approach which may be used to reduce the feature space and time required for convergence [57]. It is a 16-layer architecture which uses approximately 138 M parameters for classification tasks. VGG19 is a variant of VGG16 using 19 layers, i.e., 16 convolutional layers and three fully connected layers.
3.4.7. GoogleNet
GoogleNet is a deep neural network architecture; we may say that it is a version of the Inception network developed by research work team at Google. There are 22 layers in GoogleNet, and it can be used for multiple purposes like face recognition, object finding, image processing, etc. [58,59].
3.4.8. AlexNet
AlexNet was the first deep neural network architecture to achieve high level performance in the ImageNet classification competition. It is very similar to the LeNet architecture, but is much deeper and larger. It has more convolutional layers and filters, and an increased dropout rate and momentum, as well as ReLU activation. There are, in total, eight layers, i.e., five convolutions and three fully connected layers. To overcome the problem of overfitting, the method introduced data augmentation and dropout. AlexNet was developed by Alex Krizhevsky and main reason for its popularity is its faster speed for ImageNet classification tasks [60].
3.5. Proposed System Design
In this paper, a novel approach for the classification of multiple tumor types is introduced. The proposed architecture is implemented in the following way. A dataset for multiple cancer types was extracted from [42] as a series of numerical values. The dataset contains five types of cancers i.e., BRCA, LUAD, KIRC, LUSC, and UCEC. It comprises 2086 rows and 972 columns, in which 971 are RPKM RNA-Seq values and the last column is the class of cancers. Some additional steps are required to convert the data from numerical values to images. For example, Equation (1) serves to convert numerical 1D data to 2D images. Additionally, numerical values are converted to an image range and some zeros are added at the end to obtain a square matrix. Upon completion of this process, a total of 2086 images are generated of size 32 × 32. These images are then passed to DL models to extract the most relevant features. In the final step, eight deep learning models (CNN, ResNet50, ResNet101, ResNet152, VGG16, VGG19, AlexNet, and GoogleNet) are applied to obtain the classification output for the RNA-Seq dataset. Figure 1 illustrates the overall flow of the proposed methodology.
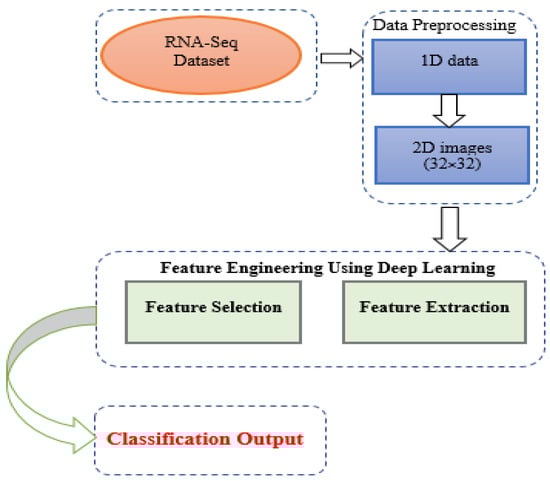
Figure 1.
Proposed Methodology Diagram.
3.6. Training and Testing Strategy
This study uses four different splitting strategies to measure the accuracy and analyze the different strategies used in our proposed architecture. Strategy 1 (S1) is when we pass 50% of the data to training and 50% to testing. The second strategy (S2) implies 60% of the data for training and 40% for testing. Strategy 3 (S3) makes classifications using 70% of the data for training and 30% for testing. The final strategy (S4) applies 80% of the data for data for training and 20% for testing. In addition to this, k-fold cross validation is also performed. Table 3 shows the splitting strategy used in our experiments.
Table 3.
Training and Testing strategies.
4. Results and Discussion
This section presents the classification results for various cancer types.
4.1. Evaluation of the Model Performance
To measure the accuracy of our proposed architecture, we use different metrics, including explicitness, delicacy, ratio of false negative, ratio of false positive, and correctness ratio.
Delicacy, also called sensitivity (SEN), ratio of true positive, or recall (REC), can all be calculated using Equation (2)
where FN is the false negative count and TP is the true positive count.
SEN/REC = TP/TP + FN
Explicitness, also known as specificity or true negative, can be calculated using Equation (3)
where TN is the true negative count and FP is the false positive count.
SPE = TN/TN + FP
Correctness ratio or accuracy (ACC) is calculated to measure the execution and performance of the classifier. This can be calculated using Equation (4)
ACC = TP + TN/FP + TN + FP + FN
The false positive ratio indicates how many instances have been misclassified by the model as positive instances; it can be calculated using Equation (5)
where TNR is the true negative rate.
FPR = 1 − TNR
The false negative rate is a measure that calculates how many instances have been misclassified by the model as negative instances; this can be calculated using Equation (6).
where TPR is the true positive rate.
FNR = 1 − TPR
If we calculate the rate of total true positive to the total predicted positive, we may call this precision (PRE), which can be calculated using Equation (7).
PRE = TP/TP + FP
F1-Score is an accordant average of precision and recall. This value considers both false positive and false negative, and can be calculated using Equation (8).
F1 Score = 2 × (PRE × REC/PRE + REC)
4.2. Deep Learning-Based Classification
Deep Learning is currently being applied to almost every type of real-world problem. We applied eight DL models for a comparative analysis of these approaches, both with and without augmentation of the data.
4.2.1. Results for DL Models without Augmentation
This section presents the results for multiple deep learning models without the use of augmentation techniques.
4.2.2. Discussion of DL Models without Augmentation
Table 4 shows the comparative results of eight different deep learning algorithms without any augmentation on the dataset. Table 3 depicts the accuracies of the eight models with four different splitting strategies and k-fold cross validation. It can be easily seen that the models performed best at 80–20 and 70–30 split. In short, we can say that more data in training results in more accurate testing results.
Table 4.
Comparative Results for DL-based approaches without augmentation.
Table 4 shows the model’s accuracies for a 80–20 split of the dataset. We can see that CNN achieved the highest accuracy, i.e., 97%, among all models. If we analyze the performance of the DL models for a 70–30 split, we see that ResNet101 and CNN were optimal, yielding accuracies of 97%. Table 4 also shows that by reducing training data, accuracy suffers, dropping to 95% from 97%; in this case CNN and ResNet101 also yielded the best results. The table shows the accuracy of the results for a 50–50 split; here, CNN, ResNet101, and ResNet50 achieved accuracies of 96%. The last column shows the accuracies of these DL classifiers for k-fold cross validation where k = 10. CNN yielded the best results here, achieving an accuracy of 96.952%.
An analysis of the data in Table 4 shows that CNN is competitive relative to other models for classifying cancer types from image data. Although the results for ResNet101 are also excellent, only one classifier can be declared a winner for a contaxt without augmenting the dataset. Figure 2 shows the evaluation matrix of CNN for all four strategies in terms of precison, recall and F1 Score. In addition to this, Figure 3 is a heatmap for CNN for a 70–30 split, which makes it possible to easily identify the best results at this split without augmentation.
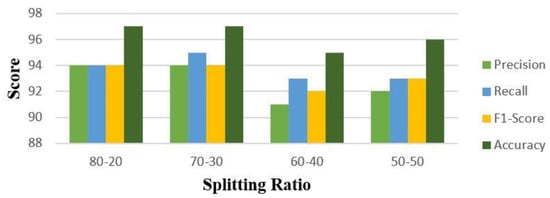
Figure 2.
Precision, Recall, F1−Score, and Accuracy for CNN without augmentation.
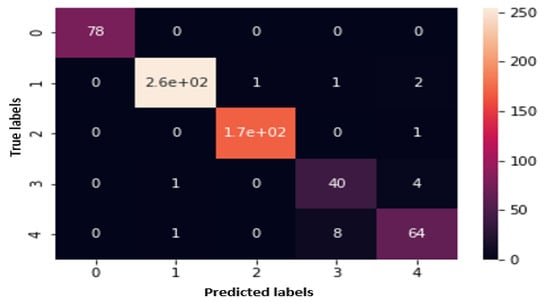
Figure 3.
Heatmap for CNN for 70–30 split without augmentation.
4.2.3. Results for DL Models with Augmentation
This section contains the results of DL models for classification with augmentation applied to the data.
4.2.4. Discussion for DL Models with Augmentation
Table 5 explains the comparative results of these eight different deep learning algorithms with augmentation techniques applied discussed earlier for increasing the size of data and removing chances of overfitting, if any. These results show how models behave when augmentation is applied. Here the results for split 70–30 are best among four mentioned splits. Detailed discussion for models accuracies is given below
Table 5.
Comparative Results for DL based approaches with augmentation.
Analysis of Table 5, we can see the results for split of 80–20 of data for training and testing, we can easily decide which classifier performed better than all. CNN and ResNet50 outperformed here with 94% accuracy for the split 80–20. Where analysis of split 70–30 shows that CNN with 96% accuracy is the best among all. For split 60–40, the accuracy of CNN decreased, and ResNet50 outperformed among all DL approaches in Table 5. The final accuracy report for the 50–50 split is shown in Table 5, where CNN again achieved first position by securing high accuracy i.e., 94%. In addition to the splitting strategies, accuracies of DL classifiers for k-fold cross validation is also shown in Table 5. Accuracies of all models other than CNN decreased from 90% and CNN achieved high accuracy among all.
Analysis of Table 5 shows that CNN performed well for all the four splitting strategies and k-fold validation with augmentation. Figure 4 is the classification report for CNN for all the splits as it is analyzed from Table 5 and declared a winner among all eight DL models. Figure 5 is the Heatmap for CNN for the split 70–30 as best accuracies are achieved at this split with augmentation.
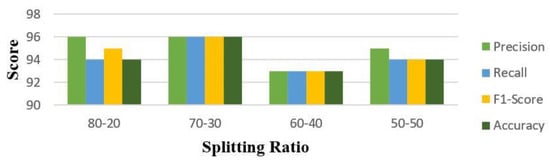
Figure 4.
Precision, Recall, F1−Score, and Accuracy for CNN with augmentation.
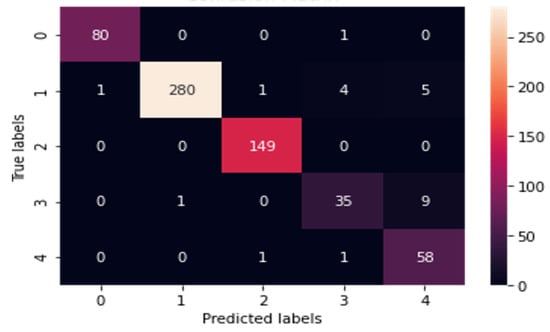
Figure 5.
Heatmap for CNN for 70–30 split with augmentation.
4.2.5. Comparison of DL Models with Other, State of the Art Techniques
The methodology proposed in this study for generating 2D images is similar to those used by other, state of the art preprocessing techniques, such as the ones described in the studies listed in Table 6. This table shows that the proposed methodology outperformed other, state of the art techniques with the same dataset, achieving an accuracy of 97%.
Table 6.
Comparison of results of DL models with related work in gene expression data.
5. Conclusions
Early prognosis and treatment of cancer are highly significant, as mortality due cancer remains very high. RNA-Seq data for multiple cancer types is beneficial in this regard, as it assists in identifying differentially expressed genes and the relationship among different genes that occur in our bodies. However, this is a complex process, as relatively few samples are available, and those that are available are high dimensional and have missing and duplicated values. Therefore, in this study, a novel approach has been proposed that tackles high dimensional and noisy RNA-Seq data. The RNA-Seq data used in this study was extracted from the Mendeley repository developed by Elsevier, a publishing company at Netherlands. The dataset contains information on five types of cancer, i.e., kidney renal clear cell carcinoma (KIRC), BRCA, lung squamous cell carcinoma (LUSC), lung adenocarcinoma(LUAD), and uterine corpus endometrial carcinoma(UCEC). In the first step, preprocessing is done, in which 1D data are converted to 2D images of size 32 × 2. In the next step, relevant features are extracted and selected using DL algorithms. As the last step, a classification task is performed through eight deep Learning based algorithms (CNN, ResNet152, ResNet50, ResNet152, GoogleNet, AlexNet, VGG16, and VGG19). Deep learning models have shown promising results; in this study, the highest obtained highest was 97%. CNN outperformed all other DL algorithms. In this paper, we made classification of five cancers based on the related genes identified by the DL algorithms. Comparative analysis with state of the art work is also conducted and the results achieved by proposed work outperformed the work presented in literature for the same cancer types. For future prospects, the proposed methodology can be used to identify the best accurate method for identification of cancer related biomarkers for each cancer type. Functional pathway analysis of related genes for these cancer types can also be conducted with the help of David website [61] or IntPath website [62]. Deep Learning architectures can be implemented to identify promising features from 2D images and these features could be incorporated to identify cancer specific biomarkers.
Author Contributions
Formal analysis, D.B.R.; Investigation, W.H.B.; Methodology, K.N.; Resources, M.S.A.K.; Writing—review & editing, L.R. and A.A.A.I. All authors have read and agreed to the published version of the manuscript.
Funding
The manuscript APC is supported by Universiti Malaysia Sabah, Jalan UMS, 88400, Kota 599 Kinabalu, Malaysia.
Institutional Review Board Statement
Not applicable.
Informed Consent Statement
Not applicable.
Data Availability Statement
Not applicable.
Conflicts of Interest
The authors declare that there is no conflict of interest.
References
- Ali, S.; Miah, S.; Haque, J.; Rahman, M.; Islam, K. An enhanced technique of skin cancer classification using deep convolutional neural network with transfer learning models. Mach. Learn. Appl. 2021, 5, 100036. [Google Scholar] [CrossRef]
- Xiao, Y.; Wu, J.; Lin, Z.; Zhao, X. A semi-supervised deep learning method based on stacked sparse auto-encoder for cancer prediction using RNA-seq data. Comput. Methods Programs Biomed. 2018, 166, 99–105. [Google Scholar] [CrossRef]
- Zararsiz, G.; Goksuluk, D.; Korkmaz, S.; Eldem, V.; Goksuluk, I.P.; Unver, T. MLSeq: Machine Learning Interface to RNA- Seq Data. Available online: https://bioconductor.org/packages/release/bioc/vignettes/MLSeq/inst/doc/MLSeq.pdf (accessed on 1 July 2021).
- Waseem, Q.; Alshamrani, S.; Nisar, K.; Din, W.W.; Alghamdi, A. Future Technology: Software-Defined Network (SDN) Forensic. Symmetry 2021, 13, 767. [Google Scholar] [CrossRef]
- Wesolowski, S.; Birtwistle, M.R.; Rempala, G.A. A Comparison of Methods for RNA-Seq Differential Expression Analysis and a New Empirical Bayes Approach. Biosensors 2013, 3, 238–258. [Google Scholar] [CrossRef] [Green Version]
- Conesa, A.; Madrigal, P.; Tarazona, S.; Gomez-Cabrero, D.; Cervera, A.; McPherson, A.; Szcześniak, M.W.; Gaffney, D.J.; Elo, L.L.; Zhang, X.; et al. A survey of best practices for RNA-seq data analysis. Genome Biol. 2016, 17, 13. [Google Scholar] [CrossRef] [Green Version]
- Urda, D.; Montes-Torres, J.; Moreno, F.; Franco, L.; Jerez, J.M. Deep Learning to Analyze RNA-Seq Gene Expression Data. In Proceedings of the 14th International Work-Conference on Artificial Neural Networks, IWANN, Cadiz, Spain, 14–16 June 2017; pp. 50–59. [Google Scholar] [CrossRef] [Green Version]
- Danaee, P.; Ghaeini, R.; Hendrix, D.A. A deep learning approach for cancer detection and relevant gene identification. Pac. Symp. Biocomput. 2017, 22, 219–229. [Google Scholar] [CrossRef] [Green Version]
- Khattak, A.; Asghar, M.Z.; Ishaq, Z.; Bangyal, W.H.; Hameed, A.I. Enhanced concept-level sentiment analysis system with expanded ontological relations for efficient classification of user reviews. Egypt. Inform. J. 2021, 22, 455–471. [Google Scholar] [CrossRef]
- Angra, S.; Ahuja, S. Machine Learning and Its Applications: A Review; International Conference on Big Data Analytics and Computational Intelligence (ICBDAC): Chirala, India, 2017; pp. 57–60. [Google Scholar]
- Langley, P.; Simon, H.A. Applications of machine learning and rule induction. Commun. ACM 1995, 38, 54–64. [Google Scholar] [CrossRef]
- Memon, S.K.; Nisar, K.; Hijazi, M.H.A.; Chowdhry, B.S.; Sodhro, A.H. A Survey on 802.11 MAC Industrial Standards, Architecture, Security & Supporting Emergency Traffic: Future Directions. J. Ind. Inf. Integr. Elsevier 2021, in press. [Google Scholar] [CrossRef]
- Gad, A.F. Practical Computer Vision Applications Using Deep Learning with CNNs with Detailed Examples in Python Using TensorFlow and Kivy, 1st ed.; Apress: New York, NY, USA, 2018. [Google Scholar]
- Haque, M.R.; Tan, S.C.; Yusoff, Z.; Nisar, K.; Lee, C.K.; Kaspin, R. Au-tomated controller placement for software-defined networks to resist ddos attacks. Comput. Mater. Contin. 2021, 68, 3147–3165. [Google Scholar] [CrossRef]
- Cao, J.; Wu, C.; Chen, L.; Cui, H.; Feng, G. An Improved Convolutional Neural Network Algorithm and Its Application in Multilabel Image Labeling. Comput. Intell. Neurosci. 2019, 2019, 2060796. [Google Scholar] [CrossRef] [Green Version]
- De Guia, J.M.; Devaraj, M.; Leung, C.K. DeepGX: Deep learning using gene expression for cancer classification. In Proceedings of the 2019 IEEE/ACM International Conference on Advances in Social Networks Analysis and Mining, ASONAM, Vancouver, BC, Canada, 27–30 August 2019; pp. 913–920. [Google Scholar]
- Guillen, P.; Ebalunode, J. Cancer Classification Based on Microarray Gene Expression Data Using Deep Learning. In Proceedings of the 2016 International Conference on Computational Science and Computational Intelligence (CSCI), Las Vegas, NV, USA, 15–17 December 2016; pp. 1403–1405. [Google Scholar] [CrossRef]
- Nisar, K.; Sabir, Z.; Raja, M.Z.; Ibrahim, A.A.; Rodrigues, J.; Khan, A.S.; Gupta, M.; Kamal, A.; Rawat, D. Evolutionary Integrated Heuristic with Gudermannian Neural Networks for Second Kind of Lane–Emden Nonlinear Singular Models. Appl. Sci. 2021, 11, 4725. [Google Scholar] [CrossRef]
- Yuan, Y.; Bar-Joseph, Z. Deep learning for inferring gene relationships from single-cell expression data. Proc. Natl. Acad. Sci. USA 2019, 116, 27151–27158. [Google Scholar] [CrossRef] [PubMed]
- Nisar, K.; Sabir, Z.; Raja, M.A.Z.; Ibrahim, A.A.A.; Erdogan, F.; Haque, M.R. Design of Morlet Wavelet Neural Network for Solving a Class of Singular Pantograph Nonlinear Differential Models. IEEE Access 2021, 9, 77845–77862. [Google Scholar] [CrossRef]
- Mal, K.; Kalwar, I.H.; Shaikh, K.; Memon, T.D.; Chowdhry, B.S.; Nisar, K.; Gupta, M. A New Estimation of Nonlinear Contact Forces of Railway Vehicle. Intell. Autom. Soft Comput. 2021, 28, 823–841. [Google Scholar] [CrossRef]
- Lyu, B.; Haque, A. Deep Learning Based Tumor Type Classification Using Gene Expression Data. In Proceedings of the 2018 ACM International Conference on Bioinformatics, Computational Biology, and Health Informatics, Washington, DC, USA, 11 June 2018; pp. 89–96. [Google Scholar]
- Ramroach, S.; Joshi, A.; John, M. Optimisation of cancer classification by machine learning generates an enriched list of candidate drug targets and biomarkers. Mol. Omics 2020, 16, 113–125. [Google Scholar] [CrossRef]
- Xiao, Y.; Wu, J.; Lin, Z.; Zhao, X. A deep learning-based multi-model ensemble method for cancer prediction. Comput. Methods Programs Biomed. 2018, 153, 1–9. [Google Scholar] [CrossRef]
- Goksuluk, D.; Zararsiz, G.; Korkmaz, S.; Eldem, V.; Zararsiz, G.E.; Ozcetin, E.; Ozturk, A.; Karaagaoglu, A.E. MLSeq: Machine learning interface for RNA-sequencing data. Comput. Methods Programs Biomed. 2019, 175, 223–231. [Google Scholar] [CrossRef]
- Ryvkin, P.; Leung, Y.Y.; Ungar, L.H.; Gregory, B.D.; Wang, L.-S. Using machine learning and high-throughput RNA sequencing to classify the precursors of small non-coding RNAs. Methods 2013, 67, 28–35. [Google Scholar] [CrossRef] [PubMed] [Green Version]
- Khalifa, N.E.M.; Taha, M.H.N.; Ezzat Ali, D.; Slowik, A.; Hassanien, A.E. Artificial Intelligence Technique for Gene Expression by Tumor RNA-Seq Data: A Novel Optimized Deep Learning Approach. IEEE Access 2020, 8, 22874–22883. [Google Scholar] [CrossRef]
- Hassanzadeh, H.R.; Phan, J.H.; Wang, M.D. A Multi-Modal Graph-Based Semi-Supervised Pipeline for Predicting Cancer Survival Hamid. In Proceedings of the Modern Artificial Intelligence and Cognitive Science Conference (MAICS), Fort Wayne, IN, USA, 28–29 April 2017; pp. 189–190. [Google Scholar] [CrossRef]
- Wu, J.; Hicks, C. Breast Cancer Type Classification Using Machine Learning. J. Pers. Med. 2021, 11, 61. [Google Scholar] [CrossRef] [PubMed]
- Tranchevent, L.-C.; Azuaje, F.; Rajapakse, J.C. A deep neural network approach to predicting clinical outcomes of neuroblastoma patients. BMC Med. Genom. 2019, 12, 178. [Google Scholar] [CrossRef] [PubMed] [Green Version]
- McDermaid, A.; Chen, X.; Zhang, Y.; Wang, C.; Gu, S.; Xie, J.; Ma, Q. A New Machine Learning-Based Framework for Mapping Uncertainty Analysis in RNA-Seq Read Alignment and Gene Expression Estimation. Front. Genet. 2018, 9, 313. [Google Scholar] [CrossRef]
- Sodhro, A.H.; Al-Rakhami, M.S.; Wang, L.; Magsi, H.; Zahid, N.; Pirbhulal, S.; Nisar, K.; Ahmad, A. Decentralized Energy Efficient Model for Data Transmission in IoT-based Healthcare System. In Proceedings of the 2021 IEEE 93rd Vehicular Technology Conference (VTC2021-Spring), Helsinki, Finland, 25–28 April 2021; pp. 1–5. [Google Scholar]
- Chowdhry, B.; Shah, A.A.; Harris, N.; Hussain, T.; Nisar, K. Development of a Smart Instrumentation for Analyzing Railway Track Health Monitoring Using Forced Vibration. In Proceedings of the 2020 IEEE 14th International Conference on Application of Information and Communication Technologies (AICT), Tashkent, Uzbekistan, 7–10 October 2020; pp. 1–5. [Google Scholar]
- Nisar, K.; Lawal, I.A.; Abdulmalik, U.I.; Mu’Azu, A.A.; Chowdhry, B.; Khan, S.; Memon, S. QoS Analysis of the MANET routing protocols with Respect to Delay, Throughput, & Network load: Challenges and Open Issues. In Proceedings of the 2020 IEEE 14th International Conference on Application of Information and Communication Technologies (AICT), Tashkent, Uzbekistan, 7–10 October 2020; pp. 1–8. [Google Scholar]
- Nisar, K.; Jimson, E.R.; Hijazi, M.H.B.A.; Ibrahim, A.A.A.; Park, Y.-J.; Welch, I. A New Bandwidth Management Model using Software-Defined Networking Security Threats. In Proceedings of the 2019 IEEE 13th International Conference on Application of Information and Communication Technologies (AICT), Baku, Azerbaijan, 23–25 October 2019; pp. 1–3. [Google Scholar]
- Nisar, K.; Ibrahim, A.A.A.; Park, Y.-J.; Hzou, Y.K.; Memon, S.K.; Naz, N.; Welch, I. Indoor Roaming Activity Detection and Analysis of Elderly People using RFID Technology. In Proceedings of the 2019 1st International Conference on Artificial Intelligence and Data Sciences (AiDAS), Perak, Malaysia, 19 September 2019; pp. 174–179. [Google Scholar]
- Ali, N.F.; Said, A.M.; Nisar, K.; Aziz, I.A. A survey on software defined network approaches for achieving energy efficiency in wireless sensor network. In Proceedings of the 2017 IEEE Conference on Wireless Sensors (ICWiSe), Miri, Malaysia, 13–14 November 2017; pp. 28–33. [Google Scholar]
- Salam, N.; Abbas, M.K.; Maheshwari, M.K.; Chowdhry, B.; Nisar, K. Future Mobile Technology: Channel Access Mechanism for LTE-LAA using Deep Learning. In Proceedings of the 2021 IEEE 18th Annual Consumer Communications & Networking Conference (CCNC), Las Vegas, NV, USA, 9–12 January 2021; pp. 1–5. [Google Scholar]
- Nisar, K.; Mu’Azu, A.A.; Lawal, I.A.; Khan, S.; Memon, S. Reliable Priority Based QoS Real-Time Traffic Routing in VANET: Open Issues & Parameter. In Proceedings of the 2020 IEEE 14th International Conference on Application of Information and Communication Technologies (AICT), Tashkent, Uzbekistan, 7–10 October 2020; pp. 1–6. [Google Scholar]
- Aevermann, B.D.; Zhang, Y.; Novotny, M.; Keshk, M.; Bakken, T.; Miller, J.; Hodge, R.D.; Lelieveldt, B.; Lein, E.S.; Scheuermann, R.H. A machine learning method for the discovery of minimum marker gene combinations for cell type identification from single-cell RNA sequencing. Genome Res. 2021, 31, 1767–1780. [Google Scholar] [CrossRef]
- Guo, Y.; Liu, S.; Li, Z.; Shang, X. Towards the classification of cancer subtypes by using cascade deep forest model in gene expression data. In Proceedings of the 2017 IEEE International Conference on Bioinformatics and Biomedicine (BIBM), Kansas City, MO, USA, 13–16 November 2017; pp. 1664–1669. [Google Scholar]
- Ferles, C.; Naidoo, K. Cancer Types: RNA Sequencing Values from Tumor Samples/Tissues. 2018. Available online: https://data.mendeley.com/datasets/sf5n64hydt/1 (accessed on 6 July 2021).
- Feng, T.; Zhang, P.; Sun, Y.; Han, X.; Tong, J.; Hua, Z. Evaluation of the Role of hsa-mir-124 in Predicting Clinical Outcome in Breast Invasive Carcinoma Based on Bioinformatics Analysis. BioMed Res. Int. 2020, 2020, 1839205. [Google Scholar] [CrossRef] [Green Version]
- Bozkurt, H.; Karakaya, I.B.; Aktas, E.; Irkorucu, O. Coexistence of phylloides tumour and invasive ductal cancer in the breast. Niger. J. Clin. Pract. 2019, 22, 1169–1171. [Google Scholar] [CrossRef]
- Zhan, Y.; Guo, W.; Zhang, Y.; Wang, Q.; Xu, X.-J.; Zhu, L. A Five-Gene Signature Predicts Prognosis in Patients with Kidney Renal Clear Cell Carcinoma. Comput. Math. Methods Med. 2015, 2015, 842784. [Google Scholar] [CrossRef] [Green Version]
- Zhang, L.; Xul, B.; Chen, S.; Lu, K.; Liu, C.; Wang, Y.; Zhao, Y.; Zhang, X.; Liu, D.; Chen, M. The Complex Roles of MicroRNAs in the Metastasis of Renal Cell Carcinoma. J. Nanosci. Nanotechnol. 2013, 13, 3195–3203. [Google Scholar] [CrossRef]
- Anusewicz, D.; Orzechowska, M.; Bednarek, A.K. Lung squamous cell carcinoma and lung adenocarcinoma differential gene expression regulation through pathways of Notch, Hedgehog, Wnt, and ErbB signalling. Sci. Rep. 2020, 10, 21128. [Google Scholar] [CrossRef]
- Zhou, C.; Li, C.; Yan, F.; Zheng, Y. Identification of an immune gene signature for predicting the prognosis of patients with uterine corpus endometrial carcinoma. Cancer Cell Int. 2020, 20, 541. [Google Scholar] [CrossRef]
- Lee, Y.C.; Lheureux, S.; Oza, A.M. Treatment strategies for endometrial cancer: Current practice and perspective. Curr. Opin. Obstet. Gynecol. 2017, 29, 47–58. [Google Scholar] [CrossRef]
- Żejmo, M.; Kowal, M.; Korbicz, J.; Monczak, R. Classification of breast cancer cytological specimen using convolutional neural network. J. Phys. Conf. Ser. 2017, 783, 012060. [Google Scholar] [CrossRef]
- Bangyal, W.H.; Ahmad, J.; Rauf, H.T. Optimization of Neural Network Using Improved Bat Algorithm for Data Classification. J. Med. Imaging Health Inform. 2019, 9, 670–681. [Google Scholar] [CrossRef]
- Bangyal, W.H.; Ahmad, J.; Shafi, I.; Abbas, Q. A forward only counter propagation network-based approach for contraceptive method choice classification task. J. Exp. Theor. Artif. Intell. 2012, 24, 211–218. [Google Scholar] [CrossRef]
- Feng, V. An Overview of ResNet and Its Variants. Available online: https://towardsdatascience.com/an-overview-of-resnet-and-its-variants-5281e2f56035 (accessed on 1 August 2021).
- Bangyal, W.H.; Ahmad, J.; Rauf, H.T.; Shakir, R. Evolving Artificial Neural Networks Using Opposition Based Particle Swarm Optimization Neural Network for Data Classification. In Proceedings of the 2018 International Conference on Innovation and Intelligence for Informatics, Computing, and Technologies (3ICT), Sakhier, Bahrain, 18–20 November 2018; pp. 1–6. [Google Scholar]
- Zhang, L.; Schaeffer, H. Forward Stability of ResNet and Its Variants. J. Math. Imaging Vis. 2020, 62, 328–351. [Google Scholar] [CrossRef] [Green Version]
- Sarwinda, D.; Paradisa, R.H.; Bustamam, A.; Anggia, P. Deep Learning in Image Classification using Residual Network (ResNet) Variants for Detection of Colorectal Cancer. Procedia Comput. Sci. 2021, 179, 423–431. [Google Scholar] [CrossRef]
- Jahangeer, G.S.B.; Rajkumar, T.D. Early detection of breast cancer using hybrid of series network and VGG-16. Multimed. Tools Appl. 2021, 80, 7853–7886. [Google Scholar] [CrossRef]
- Alake, R. Deep Learning: GoogLeNet Explained. Available online: https://towardsdatascience.com/deep-learning-googlenet-explained-de8861c82765 (accessed on 8 July 2021).
- Bangyal, W.H.; Hameed, A.; Alosaimi, W.; Alyami, H. A New Initialization Approach in Particle Swarm Optimization for Global Optimization Problems. Comput. Intell. Neurosci. 2021, 2021, 6628889. [Google Scholar] [CrossRef]
- Titoriya, A.; Sachdeva, S. Breast Cancer Histopathology Image Classification using AlexNet. In Proceedings of the 2019 4th International Conference on Information Systems and Computer Networks (ISCON), Mathura, India, 21 November 2019; pp. 708–712. [Google Scholar] [CrossRef]
- DAVID Functional Annotation Bioinformatics Microarray Analysis. Available online: https://david.ncifcrf.gov/ (accessed on 2 December 2021).
- Zhou, H.; Jin, J.; Zhang, H.; Yi, B.; Wozniak, M.; Wong., L. IntPat—An integrated pathway gene relationship database for model organisms and important pathogens. BMC Syst. Biol. 2012, 6, S2. [Google Scholar] [CrossRef] [Green Version]
Publisher’s Note: MDPI stays neutral with regard to jurisdictional claims in published maps and institutional affiliations. |
© 2022 by the authors. Licensee MDPI, Basel, Switzerland. This article is an open access article distributed under the terms and conditions of the Creative Commons Attribution (CC BY) license (https://creativecommons.org/licenses/by/4.0/).