1. Introduction
Marine pollution has been a critical environmental issue for decades. Most of the waste in the ocean comes from rivers. Oceanic debris frequently washes aground and is known as beach litter. Coastal trash is detected and monitored by certain agencies, usually using manpower. Fixed monitoring stations can also obtain trash information, but they only cover certain areas. In addition, these monitoring systems cannot automatically provide detailed information of the trash. Detailed information includes the category of the trash and the size of the area. In previous studies, Xu et al. [
1] surveyed 40 projects of related monitoring systems which used the internet of things (IoT) and sensors for ocean sensing and monitoring, water quality monitoring, fish farm monitoring, coral reef monitoring, and wave and current monitoring. Ullo and Sinha [
2] reviewed research on various environment monitoring systems used for air quality, water pollution, and radiation pollution. Although the performances of these monitoring systems were good, they all used fixed stations. Monitoring areas were limited to predefined areas. There is a lack of mobility. In addition, the IoT, web server, and wireless communications used in previous studies were only used for sensor data transmission. The integration of video streaming and image data analysis were not included. In our study, the proposed monitoring system had mobility by using unmanned aerial vehicles (UAVs) to obtain coastal images and capture trash information for further analysis.
With the rapid progress in artificial intelligence, communications engineering, and IC technology, ideas such as the IoT, the artificial intelligence of things (AIoT), industry 4.0, and smart factories have been practically implemented in recent years. In our previous studies, we successfully applied the IoT to cage culture by an unmanned aerial vehicle (UAV) [
3,
4]. Nowadays, UAVs are popular research tools due to their high-quality aerial image camera and flexibility for quick inspection ability. UAVs have been used in many applications for years, such as construction inspection, aerial photography and videography, real estate photography, mapping and surveying, asset inspection, payload carrying, agriculture, bird control, and crop spraying. Further, many projects combine UAVs and the AIoT to build systems for monitoring pollution, livestock, and pipeline security, which bring convenience to human life. Plastic trash can be found anywhere around coastal areas, constituting a huge crisis in the marine ecosystem. To monitor plastic pollution, we combined UAVs, trash detectors, and the IoT to develop a trash monitoring system that can help government agencies to monitor coastlines efficiently.
A UAV was applied to patrol the beach [
5], using aerial images with SegNet [
6], a deep neural network, for semantic segmentation to classify beach litter in pixel units. In an earlier study [
7], the authors used UAVs for a long-term monitoring program and studied the spatial and temporal accumulation of the dynamics of beached marine litter. Then, three supervised classification algorithms, including Maximum Likelihood, Random Forest, and Support Vector Machine, were applied to classify marine litter [
8]. To improve the performance of trash detection, the authors [
9] proposed the attention layer in the neuron network. A TACO trash dataset was built [
10], which adopted the Mask R-CNN [
11] to test the performance of litter detection. The authors [
12] then proposed an improved YOLOv2 [
13] model and built an automatic garbage detection system. Next, the authors [
14] modified the loss function in YOLOv3 [
15] and created an automated floating trash monitoring system based on UAVs. Although these studies provided several useful trash detection systems, real-time data analysis and monitoring were still not included.
In this study, we applied an intelligent controller to the UAV. A high-resolution aerial image trash dataset called HAIDA was created. We also built a trash detector based on the YOLO object detection algorithm with algorithm selection, hyper-parameter tuning, and model evaluation to obtain the best model for the lowest generalization error. The main purpose of this study was to construct a UAV and IoT architecture that includes a data streaming platform: Kafka, MongoDB database, web service, video streaming server, and control station for the data transmission. Real-time monitoring in a remote site was performed, and internet technology and computer–machine interaction were used in the system communications. In addition, the proposed system used a UAV to execute the monitoring mission; the UAV can automatically fly along a preset path and transmit trash information to the control center, which can save manpower in coastal environment surveillance.
2. System Description
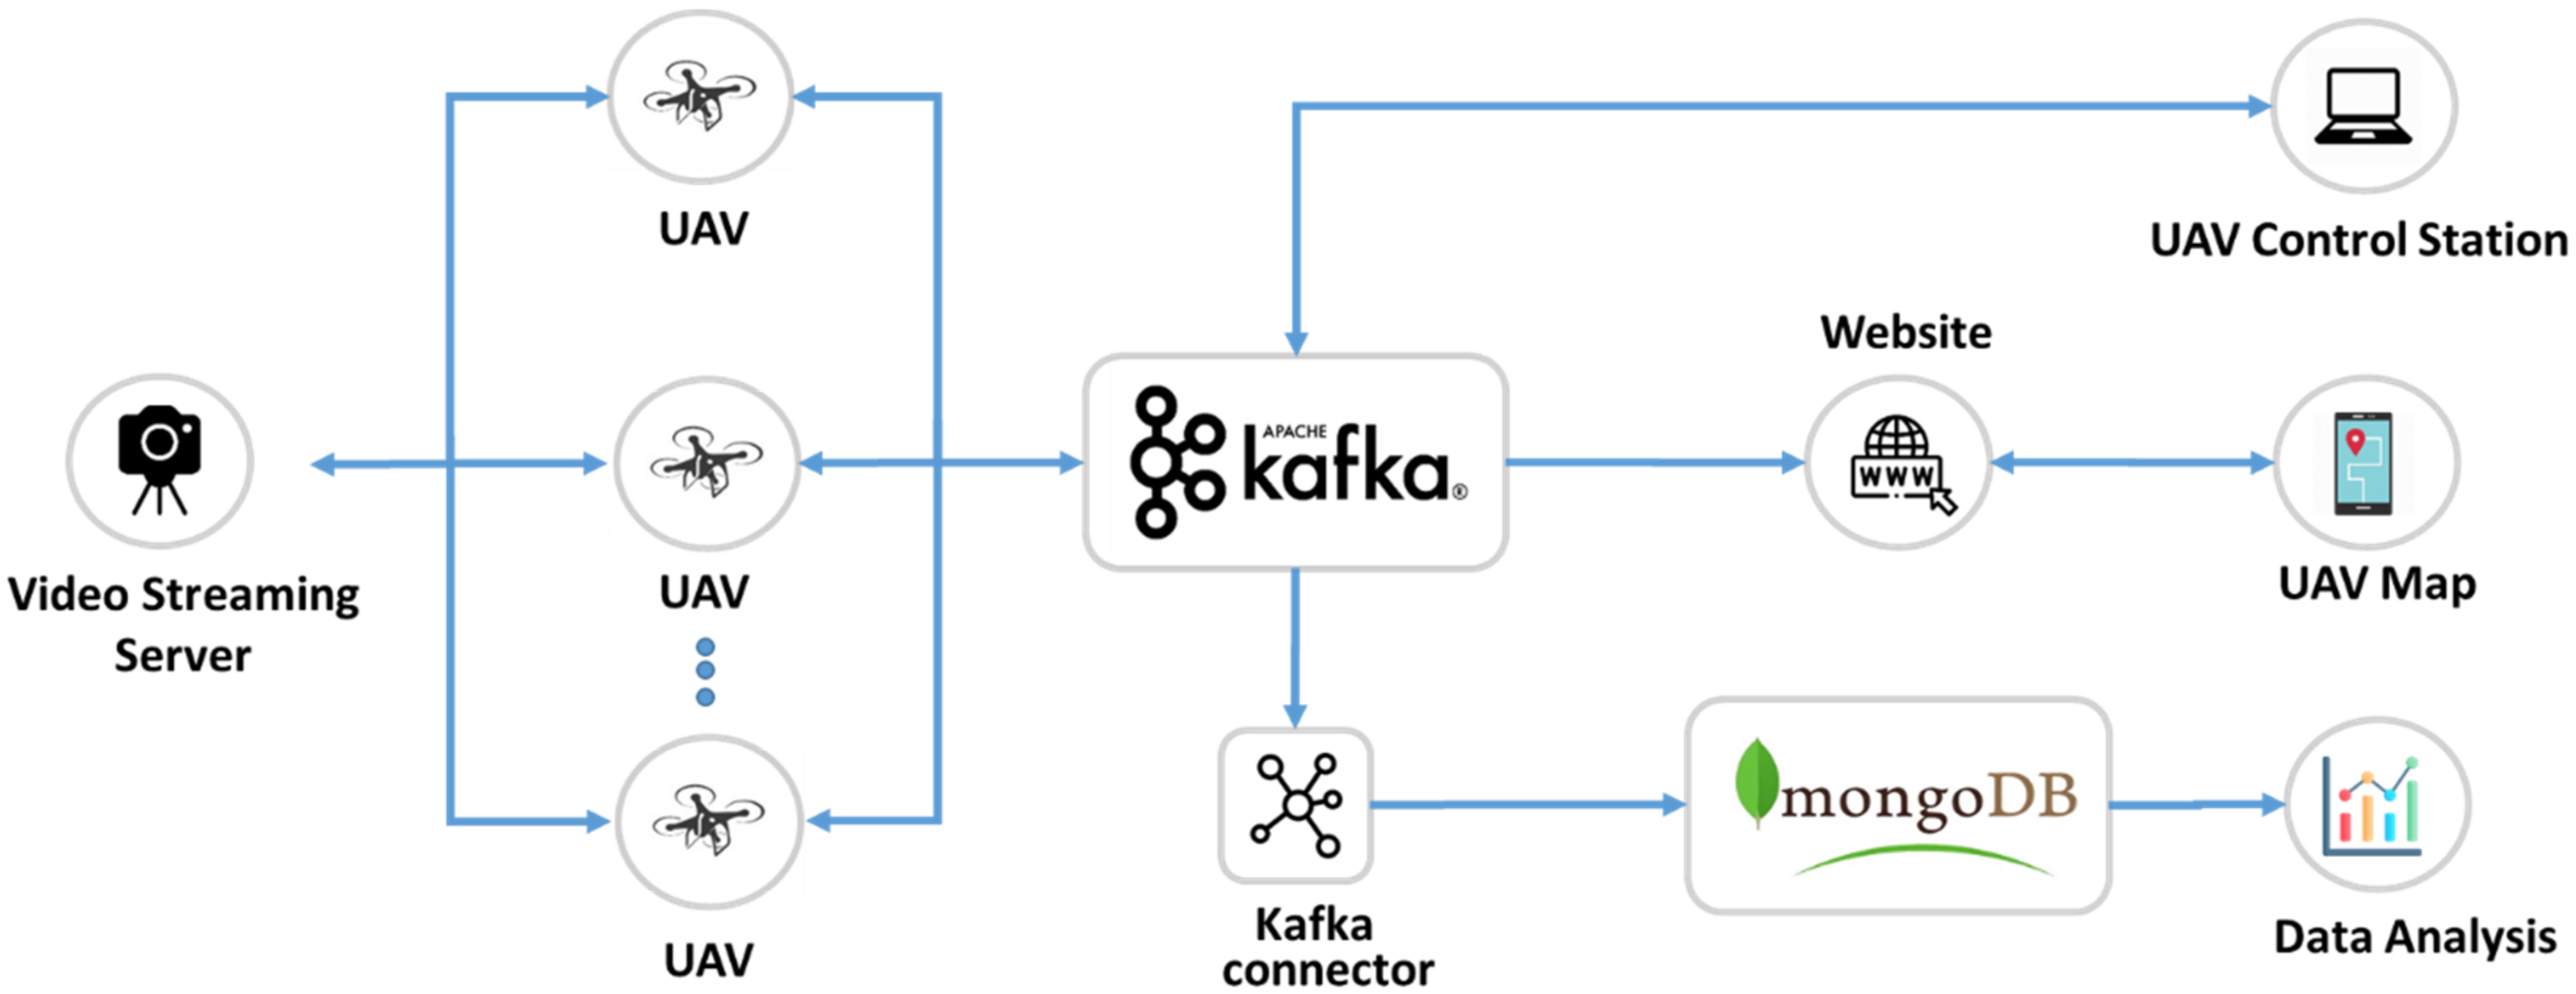
The real-time UAV trash monitoring system consisted of nine parts, including UAVs, a message queuing system, database, video streaming server, connector, UAV control station, web service, UAV map, and data analysis, as shown in
Figure 1. The video streaming server, Kafka, Kafka connector, MongoDB, and web service were built in the ground station.
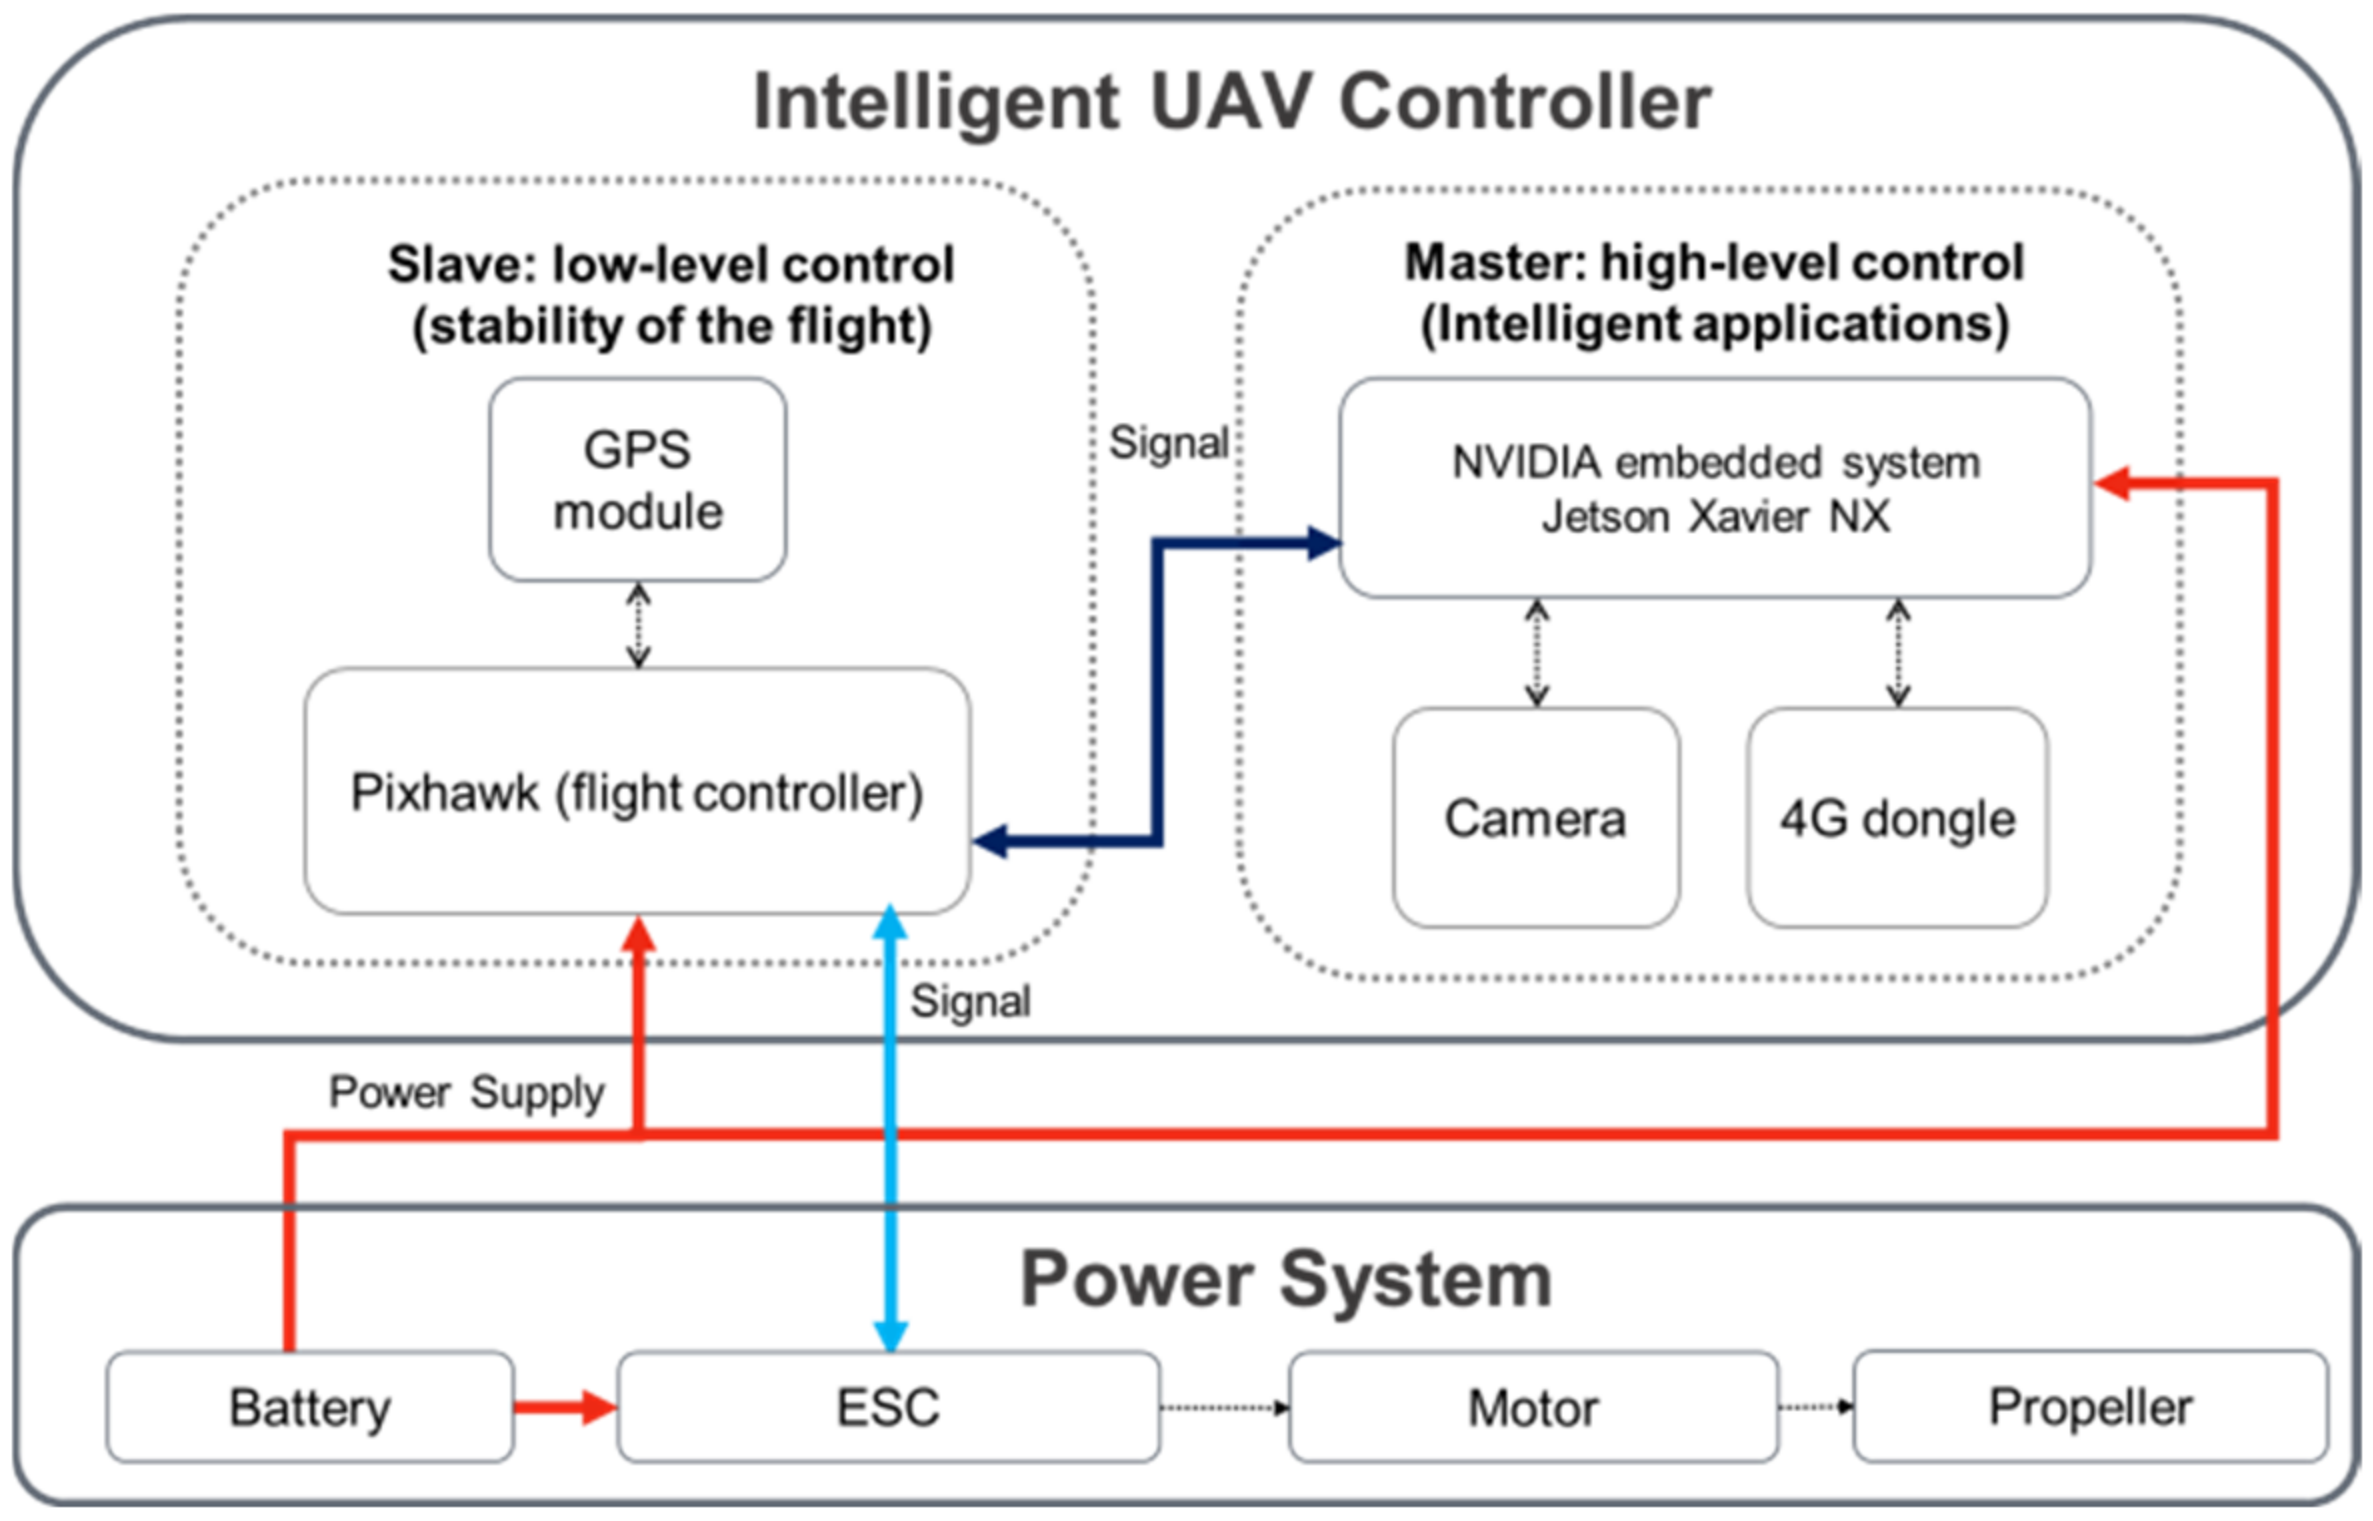
The UAV system included an intelligent UAV controller and a power system. The intelligent UAV controller used the master and slave structure to control the UAV. The power system was responsible for the lifting power of the UAV. A schematic of the UAV system is shown in
Figure 2, where ESC is the electric speed controller.
In a master and slave structure, the slave performs low-level control and is responsible for the stability of the flight. The master performs high-level control and sends the flight command to the slave, that is, intelligent applications. For the slave of the intelligent UAV controller, we used the Pixhawk flight controller [
16] equipped with an Ublox M8N GPS module [
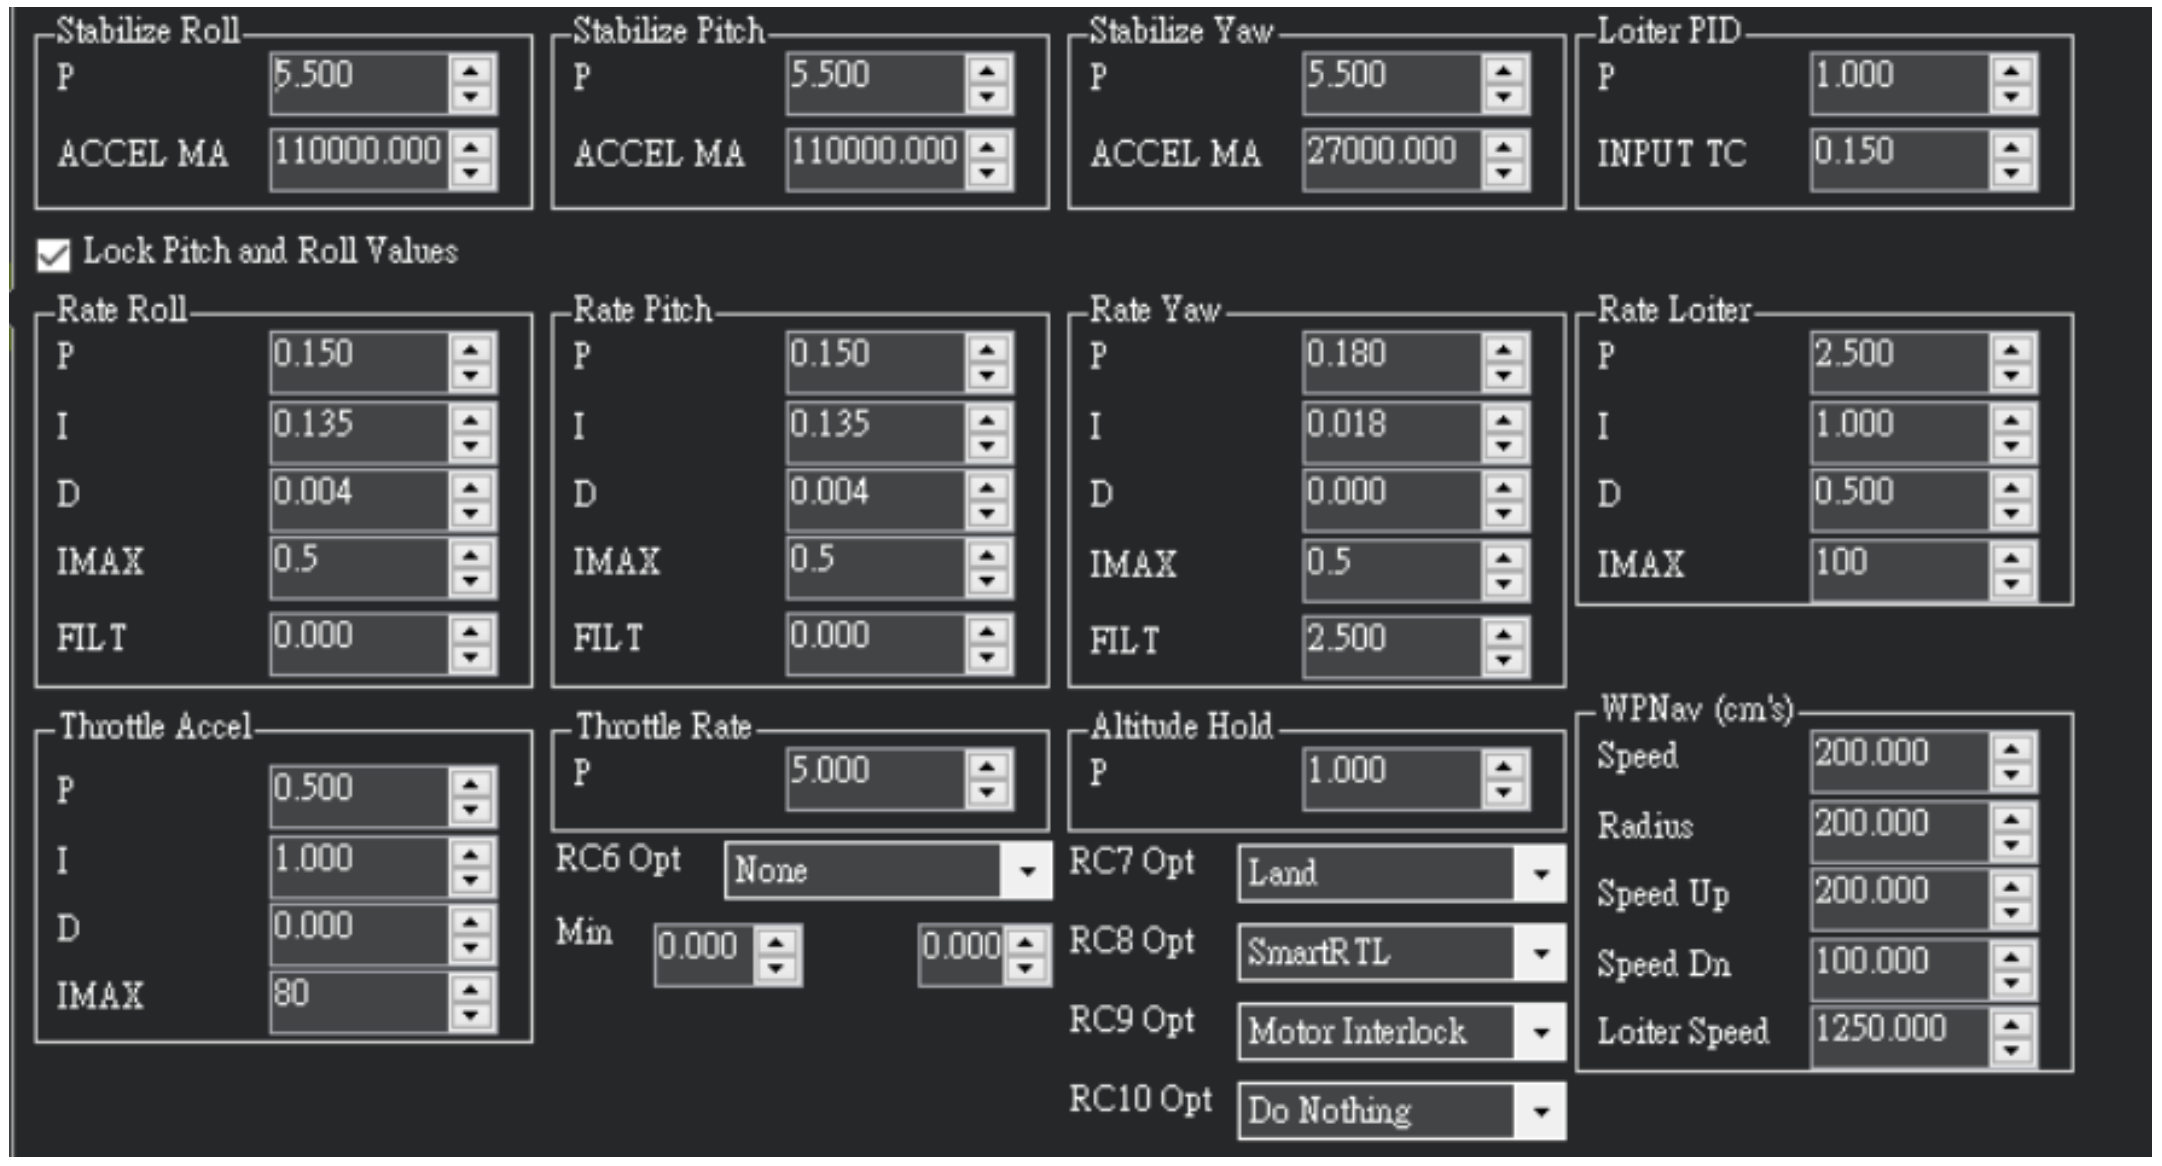
17] to control the stability of the flight. The GPS error was 2 to 6 m, which depended on the GPS signal. We fine-tuned the UAV’s proportional, integral, and derivative (PID) parameters in the UAV testing flight. The PID parameters were tuned in-flight. It used the auto-tuning technique [
18], which is based on the Ziegler–Nichols closed-loop method.
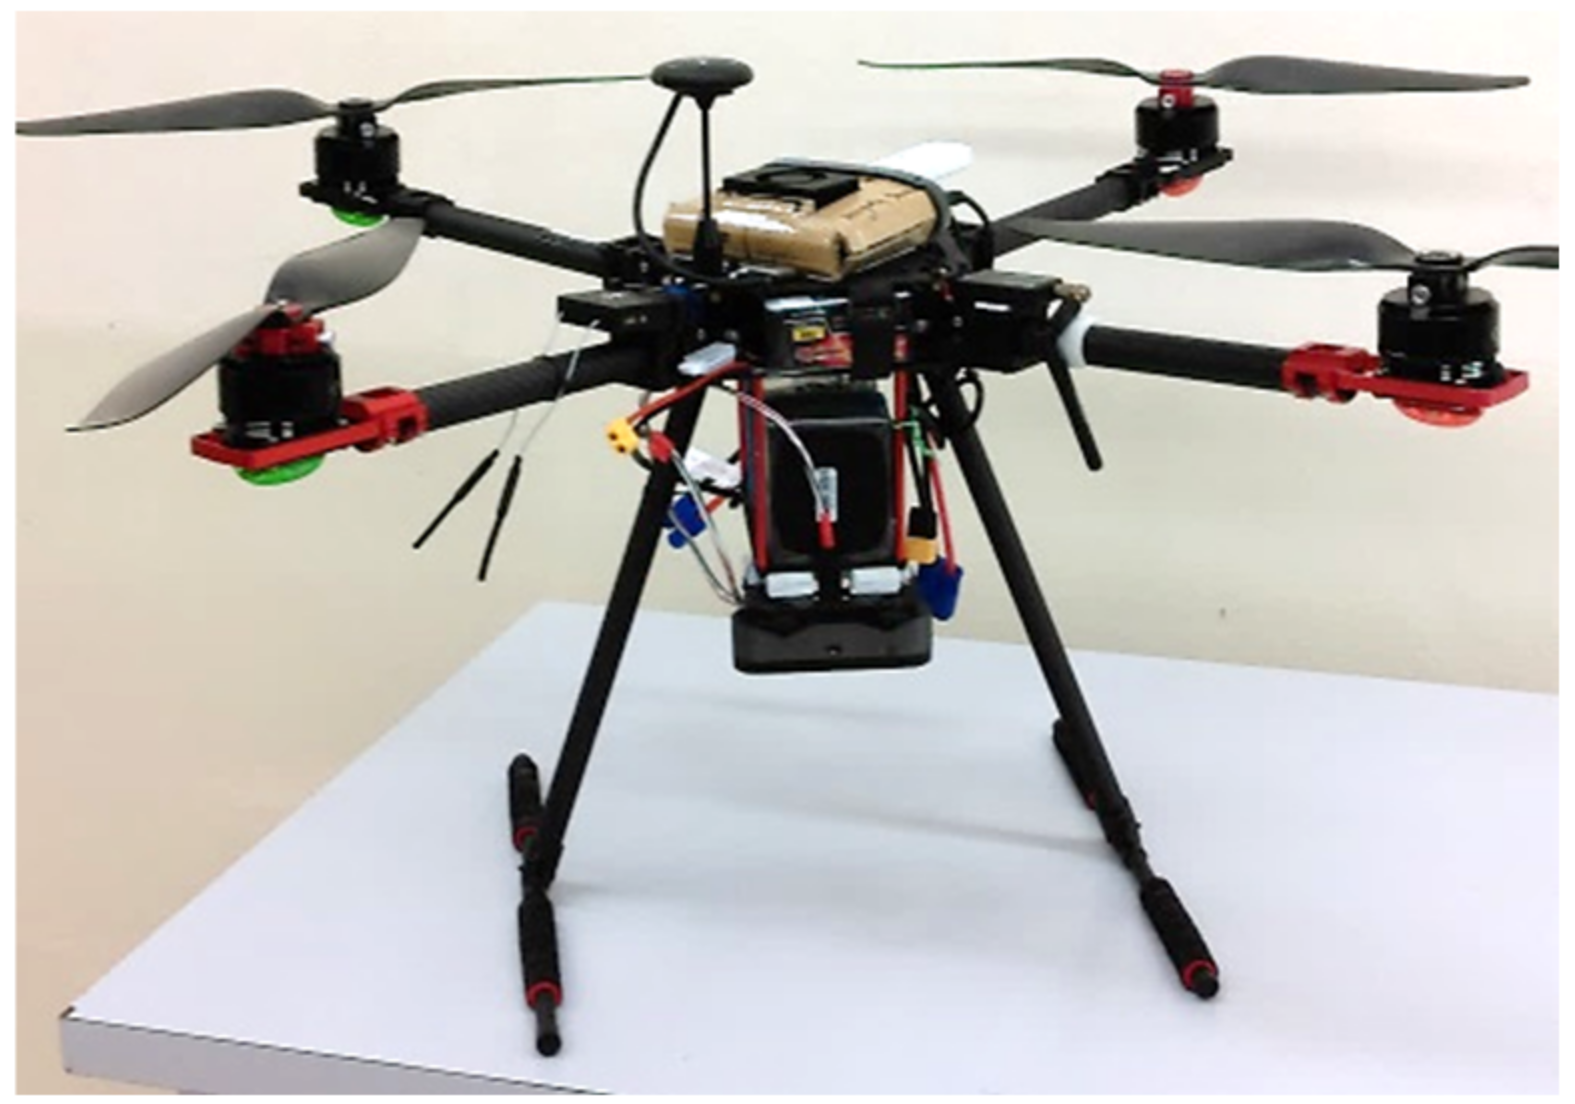
Figure 3 and
Figure 4 show the proposed quadrotor and the PID parameters.
For the master of the intelligent UAV controller, we used the NVIDIA-embedded system Jetson Xavier NX [
19] as the UAV onboard computer to carry out high-computational trash detection. The master was equipped with a Logitech BRIO webcam [
20] and a Huawei E8372 4G dongle [
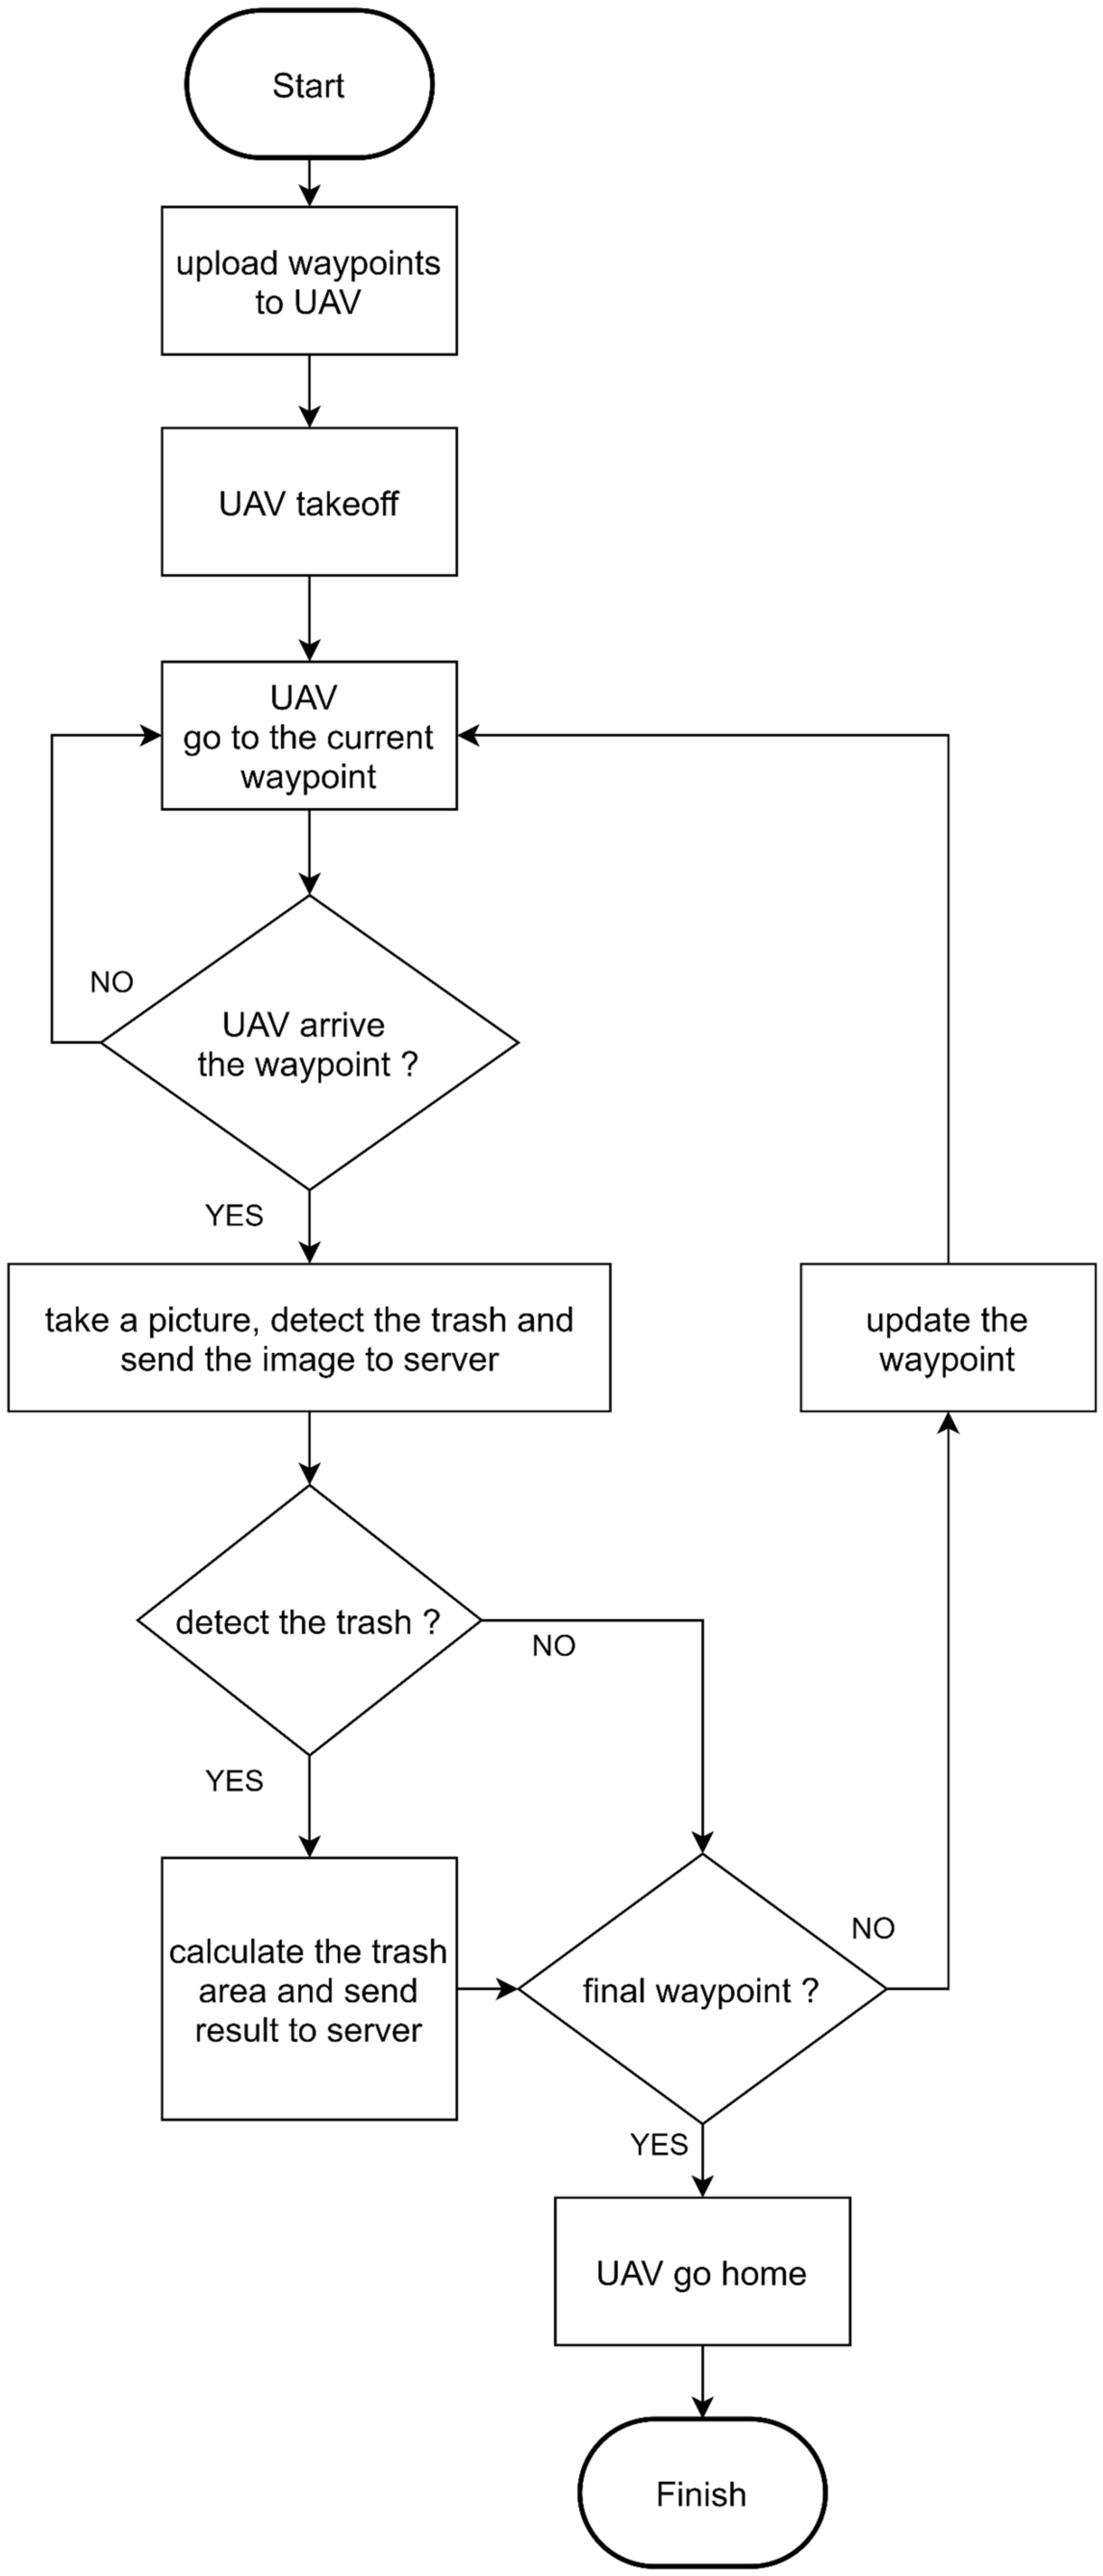
21]. For the UAV trash detection task, we uploaded the predefined waypoints to the UAV first. Then, the UAV was controlled by the onboard computer to patrol the coastline along these waypoints automatically. While flying between two waypoints, the UAV took pictures, detected trash, and calculated the trash area. After data analysis, the image and the information regarding the trash were sent to the server of base station. Then, the UAV flew to next waypoint and repeated image processing and data transmission. After all waypoints were checked, the UVA flew back to the home position. A flowchart of the UAV trash detection task is shown in
Figure 5.
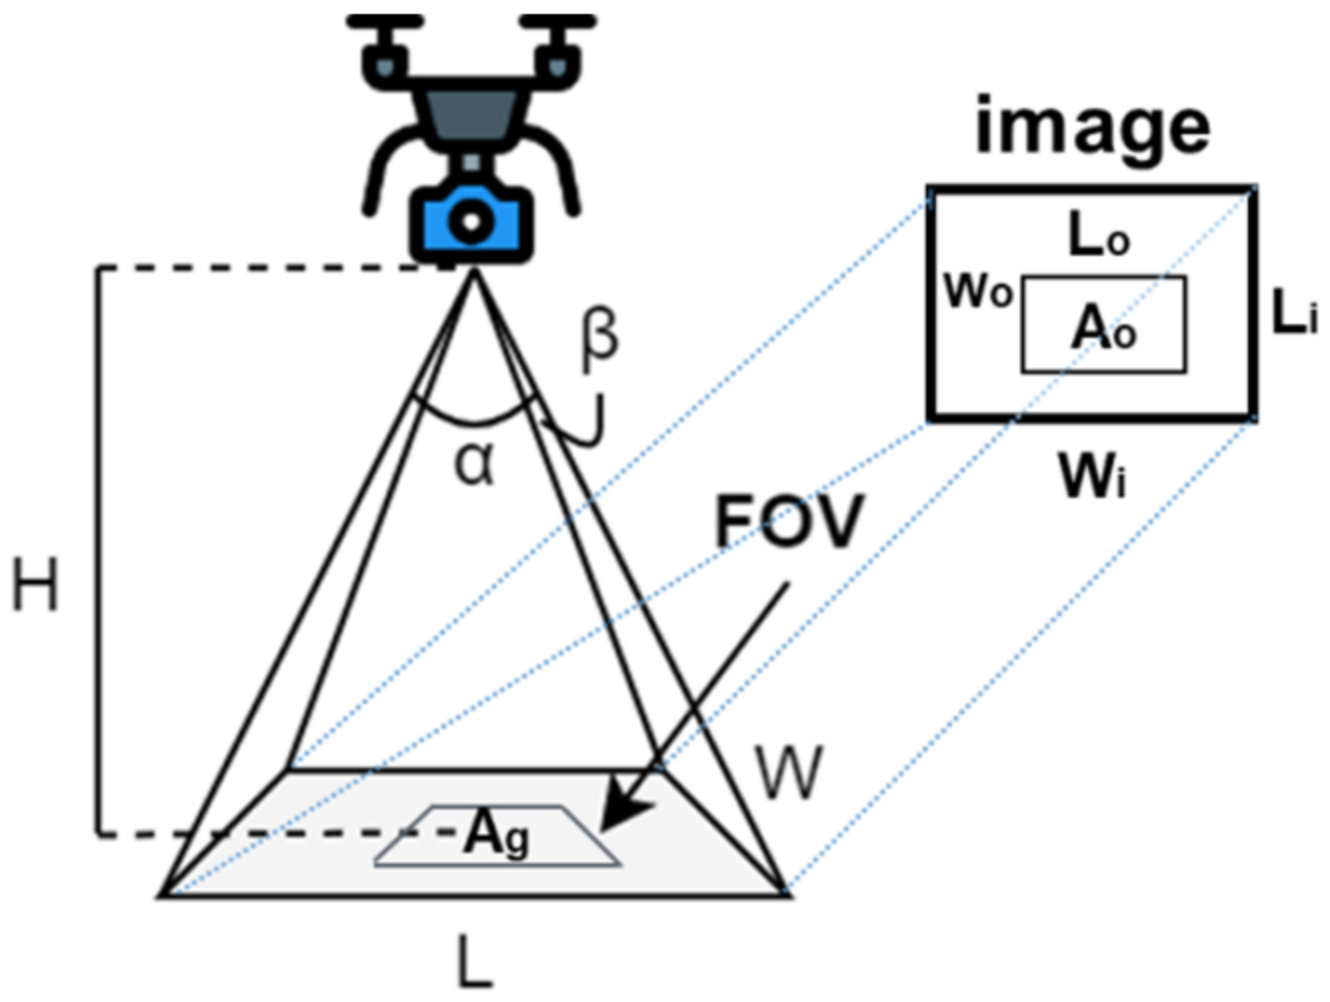
We can calculate the detected trash pollution area by Equations (1)–(4), where
,
H,
L,
W,
Wi,
Li,
Wo,
Lo,
Ao, and
Ag are the camera’s horizontal and vertical angle of view, the UAV’s height, the camera’s horizontal and vertical of view, the width and height of the camera’s image, the width and the height of detected trash in the image, detected trash’s area in the image, and the area of the detected trash in the real world, respectively, as shown in
Figure 6, where FOV is field of view.
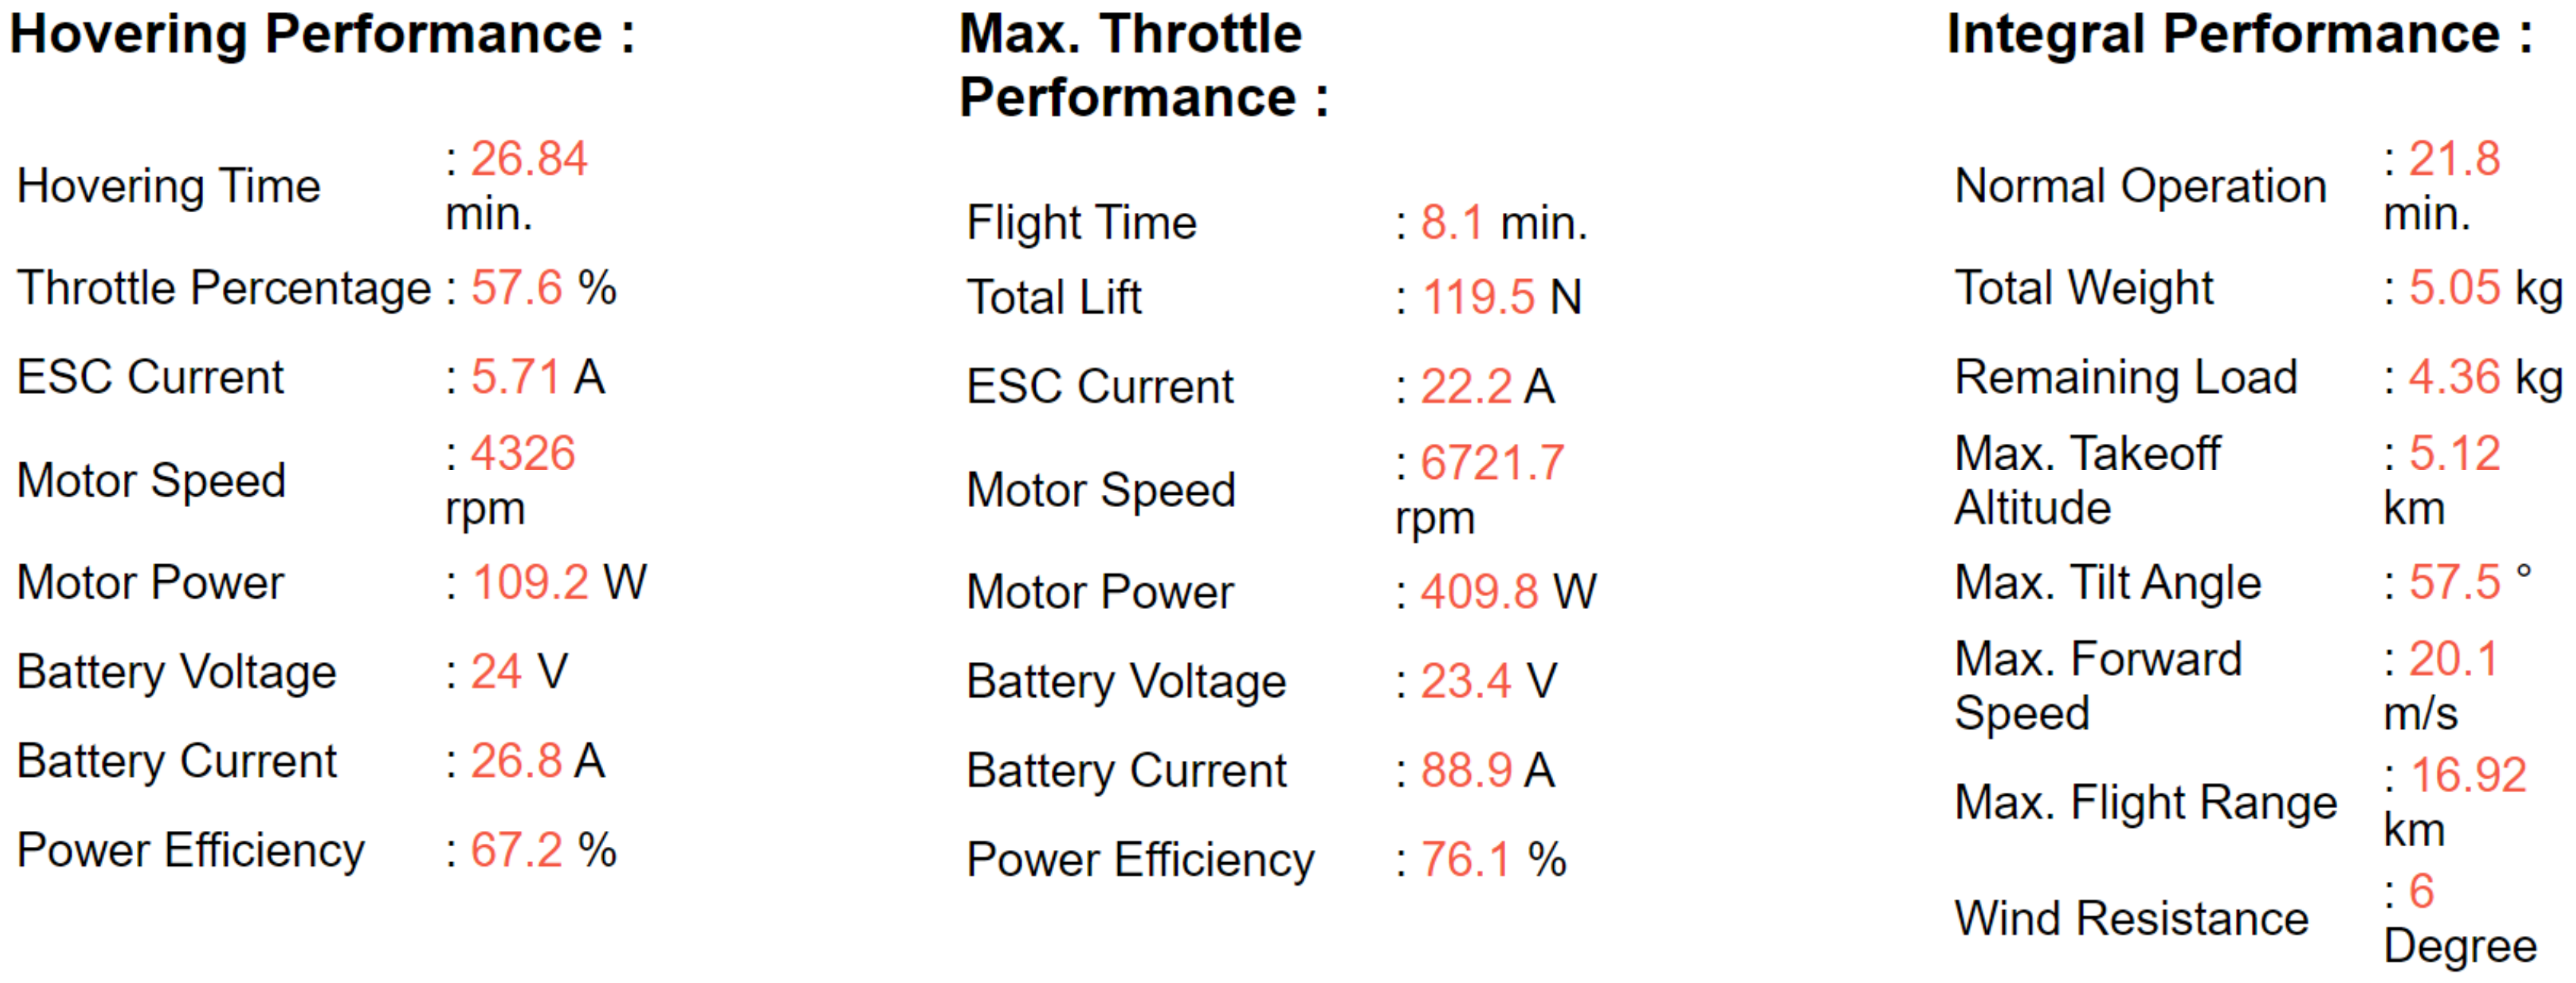
The proposed quadrotor was set up based on a practical performance evaluation method [
22]. This method provided necessary parameters’ values for electric multi-copters. The performance of our proposed quadrotor is shown in
Figure 7. The total weight of the quadrotor was 5.05 kg with a frame size of 700 mm. The quadrotor could fly for about 21.8 min at a minimum battery capacity of 25%.
3. Message Queuing System
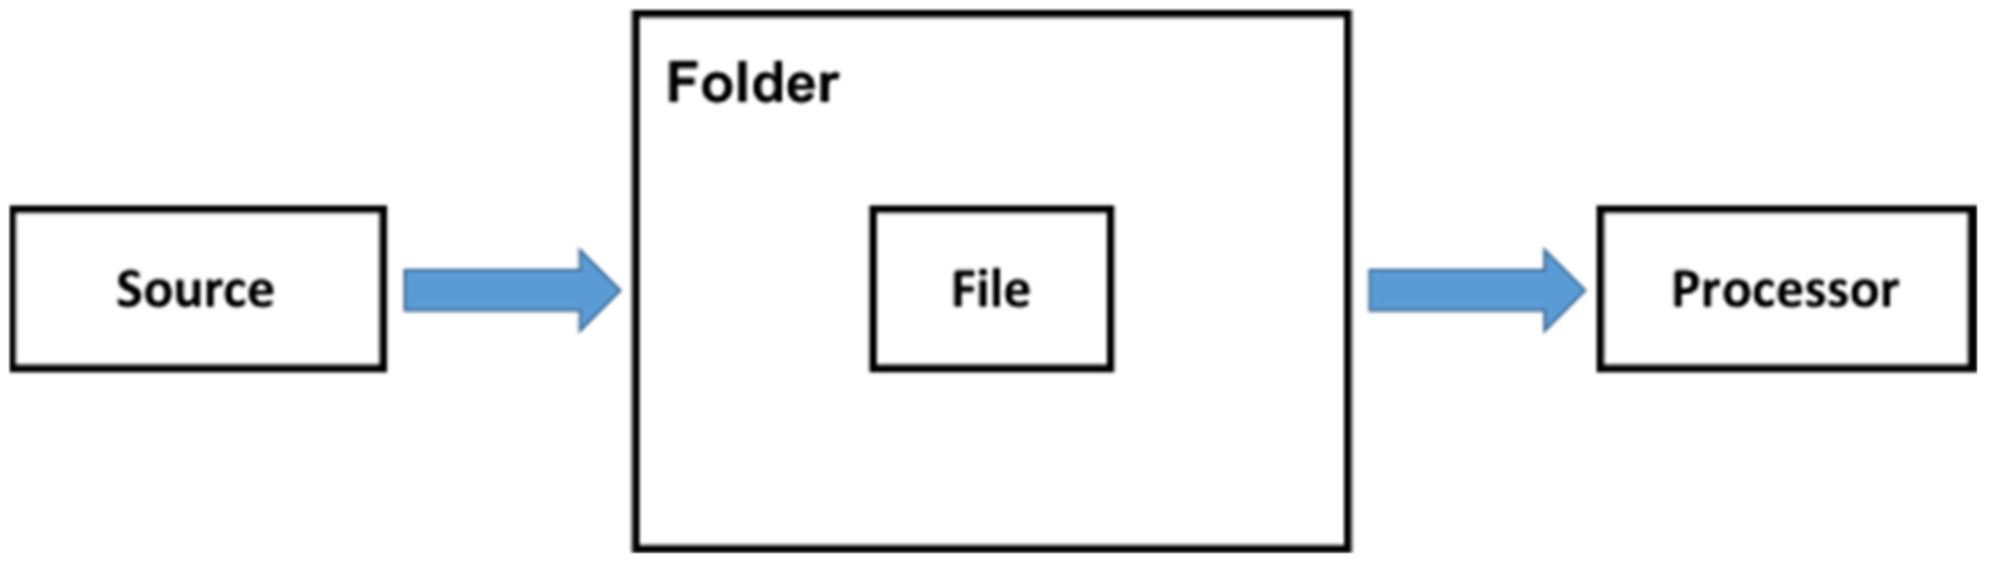
The streaming data are produced by the data sources such as the sensors in the factory, personal e-commerce purchases, social website activities, or other log files. For the monitoring system, it is important to build a suitable application integration for streaming data processing, storing, and analyzing. The integration of one or more data sources to construct a large application is proposed. According to [
23], the four main application integration styles are file transfer, shared database, remote procedure invocation, and messaging. The file transfer integration style means that the processor listens to the file in the folder. If the source creates the file, then the processor catches the file from the folder, as shown in
Figure 8. Although the idea of file transfer integration is intuitive, it is not suitable for the data streaming system due to the high latency.
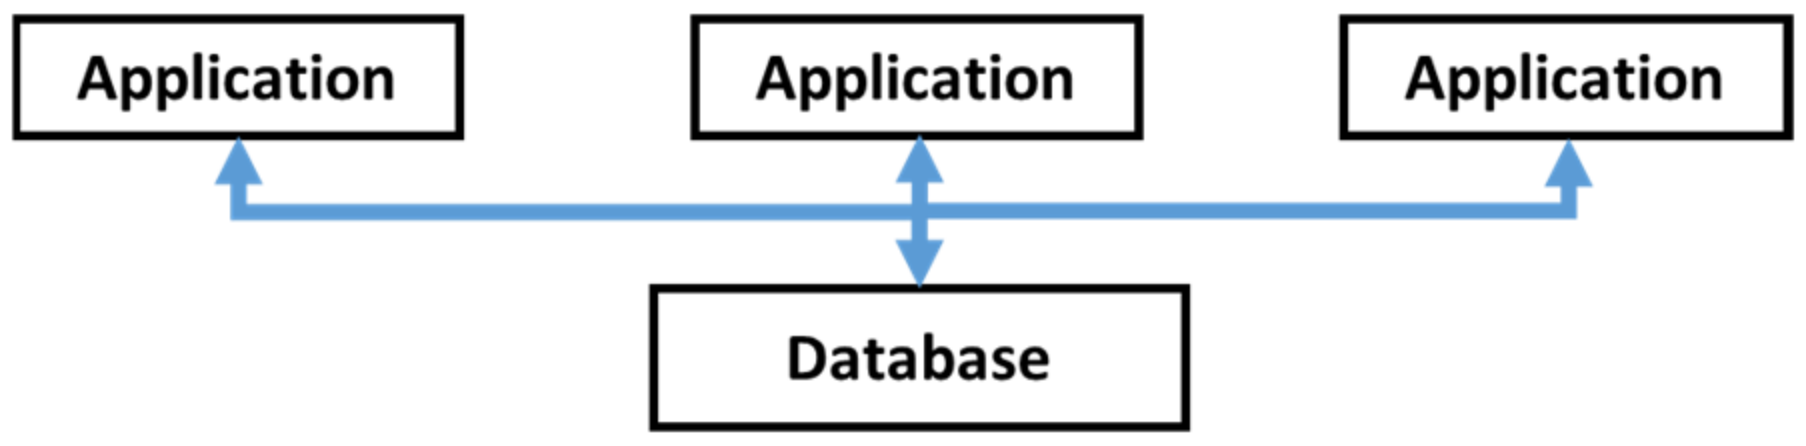
The shared database integration style facilitates the storage of data by multiple applications with a shared database, as shown in
Figure 9. Frequent reading and modification of the same data in the database causes a bottleneck to the performance and is not suitable for streaming data processing.
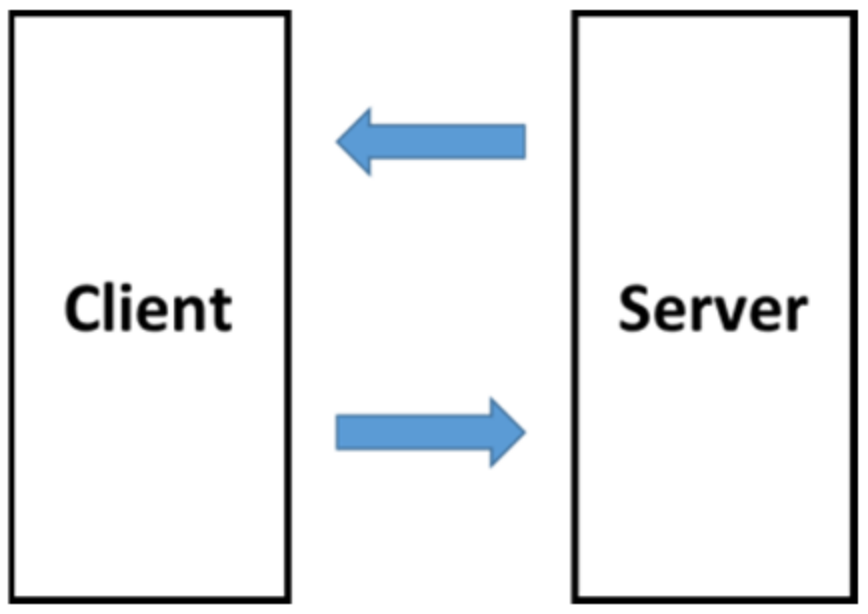
In remote procedure invocation, the client sends a request and the server replies, as shown in
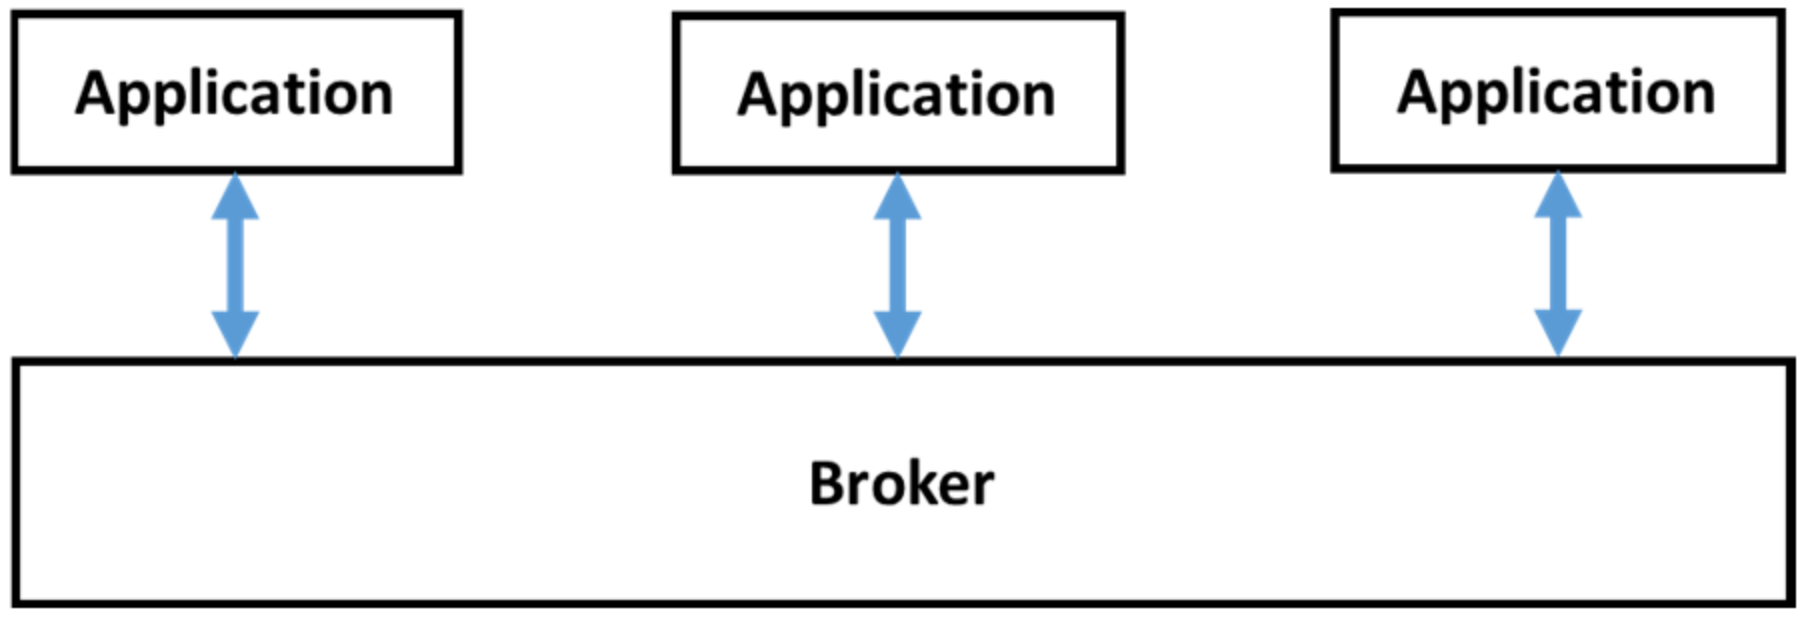
Figure 10. The drawback of remote procedure invocation is that all the applications are tightly coupled, and it is hard to maintain integration. The messaging integration style is asynchronous messaging and can decouple all the applications so the sender does not need to wait for the receiver, and we can develop the application efficiently in the real-time monitoring system, as shown in
Figure 11.
In an earlier study [
24], the authors compared five typical message queuing systems, including Kafka [
25], RabbitMQ [
26], RocketMQ [
27], ActiveMQ [
28], and Pulsar [
29]. They also tested the latency and the throughput in the three scenarios, including the message size, number of producers/consumers, and number of partitions. The latency means how long the message transmitted between the applications is affected by packet metadata processing, packet replication, memory access latency, the message guarantee mechanism, and dequeuing latency. Here, RocketMQ showed the lowest latency across the three scenarios. The throughput measures the message bytes transmitted through the message queuing system per time unit. In the throughput test of five message queuing systems, Kafka received the highest throughput in message sizes of 4K bytes, one producer and one consumer, and 16 partitions. Considering the scalability of our real-time UAV trash monitoring system in the future, the high throughput of Kafka is needed. Although the latency of Kafka is about 70 ms and is higher than RocketMQ, Kafka is still acceptable in our system.
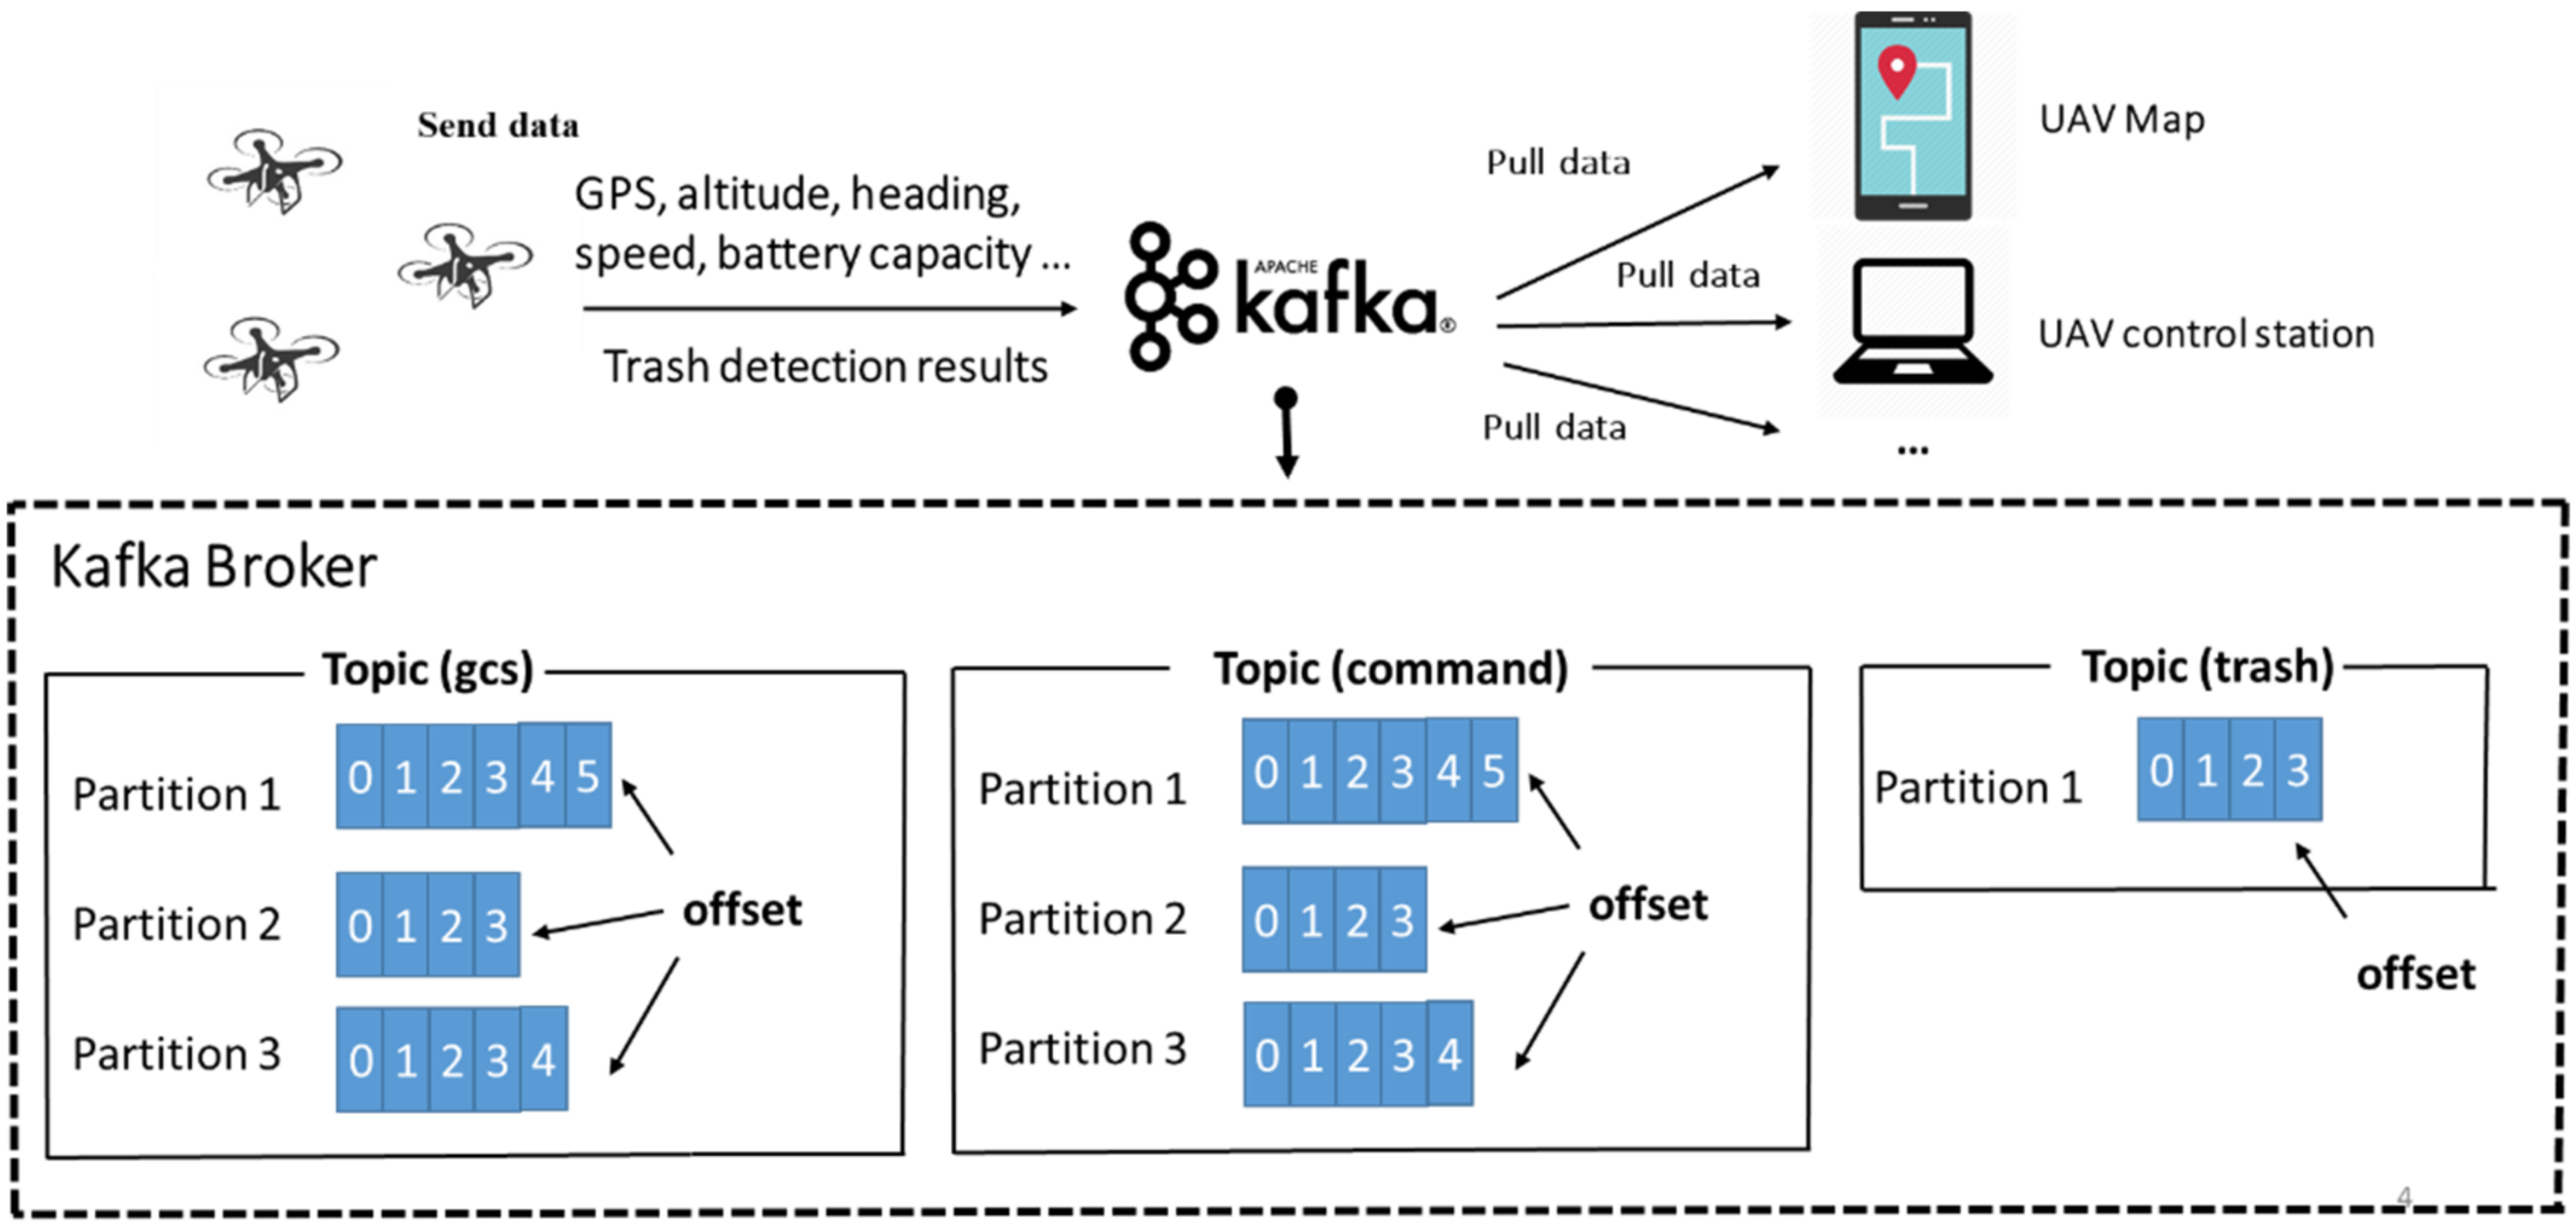
Kafka, a publish/subscribe messaging system designed by LinkedIn, is used as a distributed event streaming platform in most scenarios such as financial transactions, automotive industry tracking, and customer interactions in business. Kafka is good at handling multiple producers and multiple consumers and can scale up the brokers to handle any amount of data. Because of the disk-based retention of Kafka, if the data processing is in traffic, there is no danger of losing data. The data are retained in Kafka with custom retention rules. To validate the high performance of Kafka, we compared the throughput with one producer and one consumer in the topic (one partition) via three Python APIs. We sent 1M messages at 100 (bytes) per message.
Table 1 and
Table 2 show the high-performance test of the Kafka producer and consumer in our experiment with WD10EZEX-22MFCA0 hard disk drive and Intel i7-6700 CPU. In our experiment, the confluent-Kafka API had the best throughput both in the producer and the consumer.
The three topics
gcs,
trash, and
command were used in the UAV trash monitoring system. We used one Kafka broker to handle the messages from the UAVs. The topic
gcs was used to collect the stream of the UAVs’ flight data, and each UAV produced one partition with one replica. The topic
trash collected the trash data, which are detected by the UAV, and all the UAVs sent the data to the same partition in the topic. The UAV real-time maps consumed the topic
gcs and
trash to monitor the status of each UAV and the polluted area of the trash. The topic
command collected the commands sent by the base station and was partitioned with the number of UAVs.
Figure 12 shows the Kafka configuration in the UAV trash monitoring system. The fire-and-forget method was used to increase the throughput in the topic
gcs. The asynchronous method was used to gain the good throughput/latency tradeoff in the topic
trash. The synchronous method was used to guarantee the reliability of data in the topic
command.
A web service is a good way to exchange data between applications that are built in different operating systems or programming languages. In the UAV marine trash monitoring system, the Python web framework Django was used [
30] to develop a website that ran on a computer to listen to requests from clients via HTTP (HyperText Transfer Protocol). The real-time UAV trash map used Leaflet [
31], a JavaScript library for interactive maps, along with the Django website and the Kafka broker to develop a monitoring system for trash pollution. The consumers accessed the data from Kafka through the web service, and the trash information such as GPS and the polluted area, which is collected by the UAV, were displayed on the map.
For the design of a video streaming server, the UAVs used a 4G network to send the video stream to the server then publish it. Multiple users could subscribe to the video stream server with 30 FPS (Frames per Seconds) via the website. The UAV flew to the waypoints and used the current height and FOV (field of view) of an onboard camera to calculate the position where the UAV should detect the trash with no-repeat trash detection and sent the image back to the server. Additionally, the UAV sent the real-time video stream to the server continuously. ZeroMQ [
32] is a concurrency framework based on the socket with in-process, inter-process, and TCP communications. The ImageZMQ [
33] is a Python API built for video streaming based on the ZeroMQ framework. To suit the different network conditions, we used the ImageZMQ API with the auto image size tuning method, auto reconnection mechanism, and JPEG compression [
34]. In the auto reconnection mechanism, we set the timeout to 1.8 s (this value depended on the network condition of the server and the UAV via trial and error). If the disconnection time was higher than the timeout, the UAV reconnected to the video streaming server automatically. The UAV recorded the number of timeouts that occurred and used it to tune the appropriate image size automatically (the more timeouts occurred, the smaller the image size via trial and error was) to send the video stream to the server.
In the UAV trash detection task, the UAV continuously consumed the messages from the Kafka topic to check if there were any commands from the control station. Each UAV consumed one partition in the topic. The database supported large volumes of data to store and query. The SQL (Structured Query Language) database, such as MySQL [
35], stored the data in a predefined scheme with the table. The table was created by rows and columns, which meant that the data were stored in fixed columns that were not changeable. The addition of a new column for the table in the SQL database is time-consuming. The advantage of SQL is that it is more suitable for complex queries. The NoSQL (Non-Structured Query Language) database has a more flexible data storage format than the SQL database. In an NoSQL database such as Mongo [
36], the JSON (JavaScript Object Notation)-like data are used to store in the database. The JSON data are key–value pairs and have no predefined structure to follow. We could add a new key to the data and store it in the database with a high level of freedom.
In [
37], the authors compared the performance of seven databases with three SQL (Oracle, MySQL, and MsSQL) and four NoSQL (Mongo, Redis, GraphQL, and Cassandra) databases. The NoSQL databases were faster than the SQL databases, and Mongo had the best performance in the experiment, as shown in
Table 3 and
Table 4.
We chose Mongo as our database due to the good performance and schema-free nature of the data storage. In Mongo, the collection is created to store the documents. The trash document that is sent by the UAV includes id, time, lat, lon, and trash, which are the ID of the UAV, the time that the trash is detected, the latitude and the longitude of the trash position, and the polluted area of the trash, respectively. In the UAV trash monitoring system, Kafka is used as the data streaming platform; the data need to be accessed and stored in the database. We built the Kafka connector that consumed the data with batch processing from Kafka and transferred the data into the database.
4. Experimental Results
We deployed the YOLOv4-Tiny-3l model [
38] to the NVIDIA-embedded system Xavier NX on the UAV for the UAV trash monitoring system and tested it with three scenarios (NTOU campus, Badouzi fishing port, and Wanghai Xiang beach). The Mongo database was used in this study. The HAIDA dataset, which was collected in the NTOU campus, was applied to train the object detector (YOLO model). This dataset had 1319 pictures of trash, included two classes (3904 garbage objects and 2571 bottle objects) and 456 negative samples that were collected by the UAV. In this study, the dataset was split into three parts, a training set for model fitting, a validation set for hyper-parameter tuning and model selection, and a testing set for model evaluation. All models were trained on NVIDIA GeForce RTX-2080Ti GPU. After training, the YOLO model was implemented into the onboard computer Xavier NX. The YOLO model could process 22 FPS (frames per second) and identify trash objects with more than 70% AP50 (Test). Trash objects could be detected in real time. The flight time of the UAV was 21 min for each mission. The cruising speed of the UAV was 2 m/s. The UAV could fly 1 km in one mission, and the path was planned before the mission. The planned path was set in the flight controller of the UAV. Several waypoints were preset along the path. The UAV flew through all waypoints and obtained images of the coastal area. At the same time, the UAV sent a real-time video stream to the base station via mobile communication. In the video, one image frame covered a 10 m × 10 m area. Thus, the trash monitoring system processed one coastal picture and transmitted this still image to the base station every 5 s.
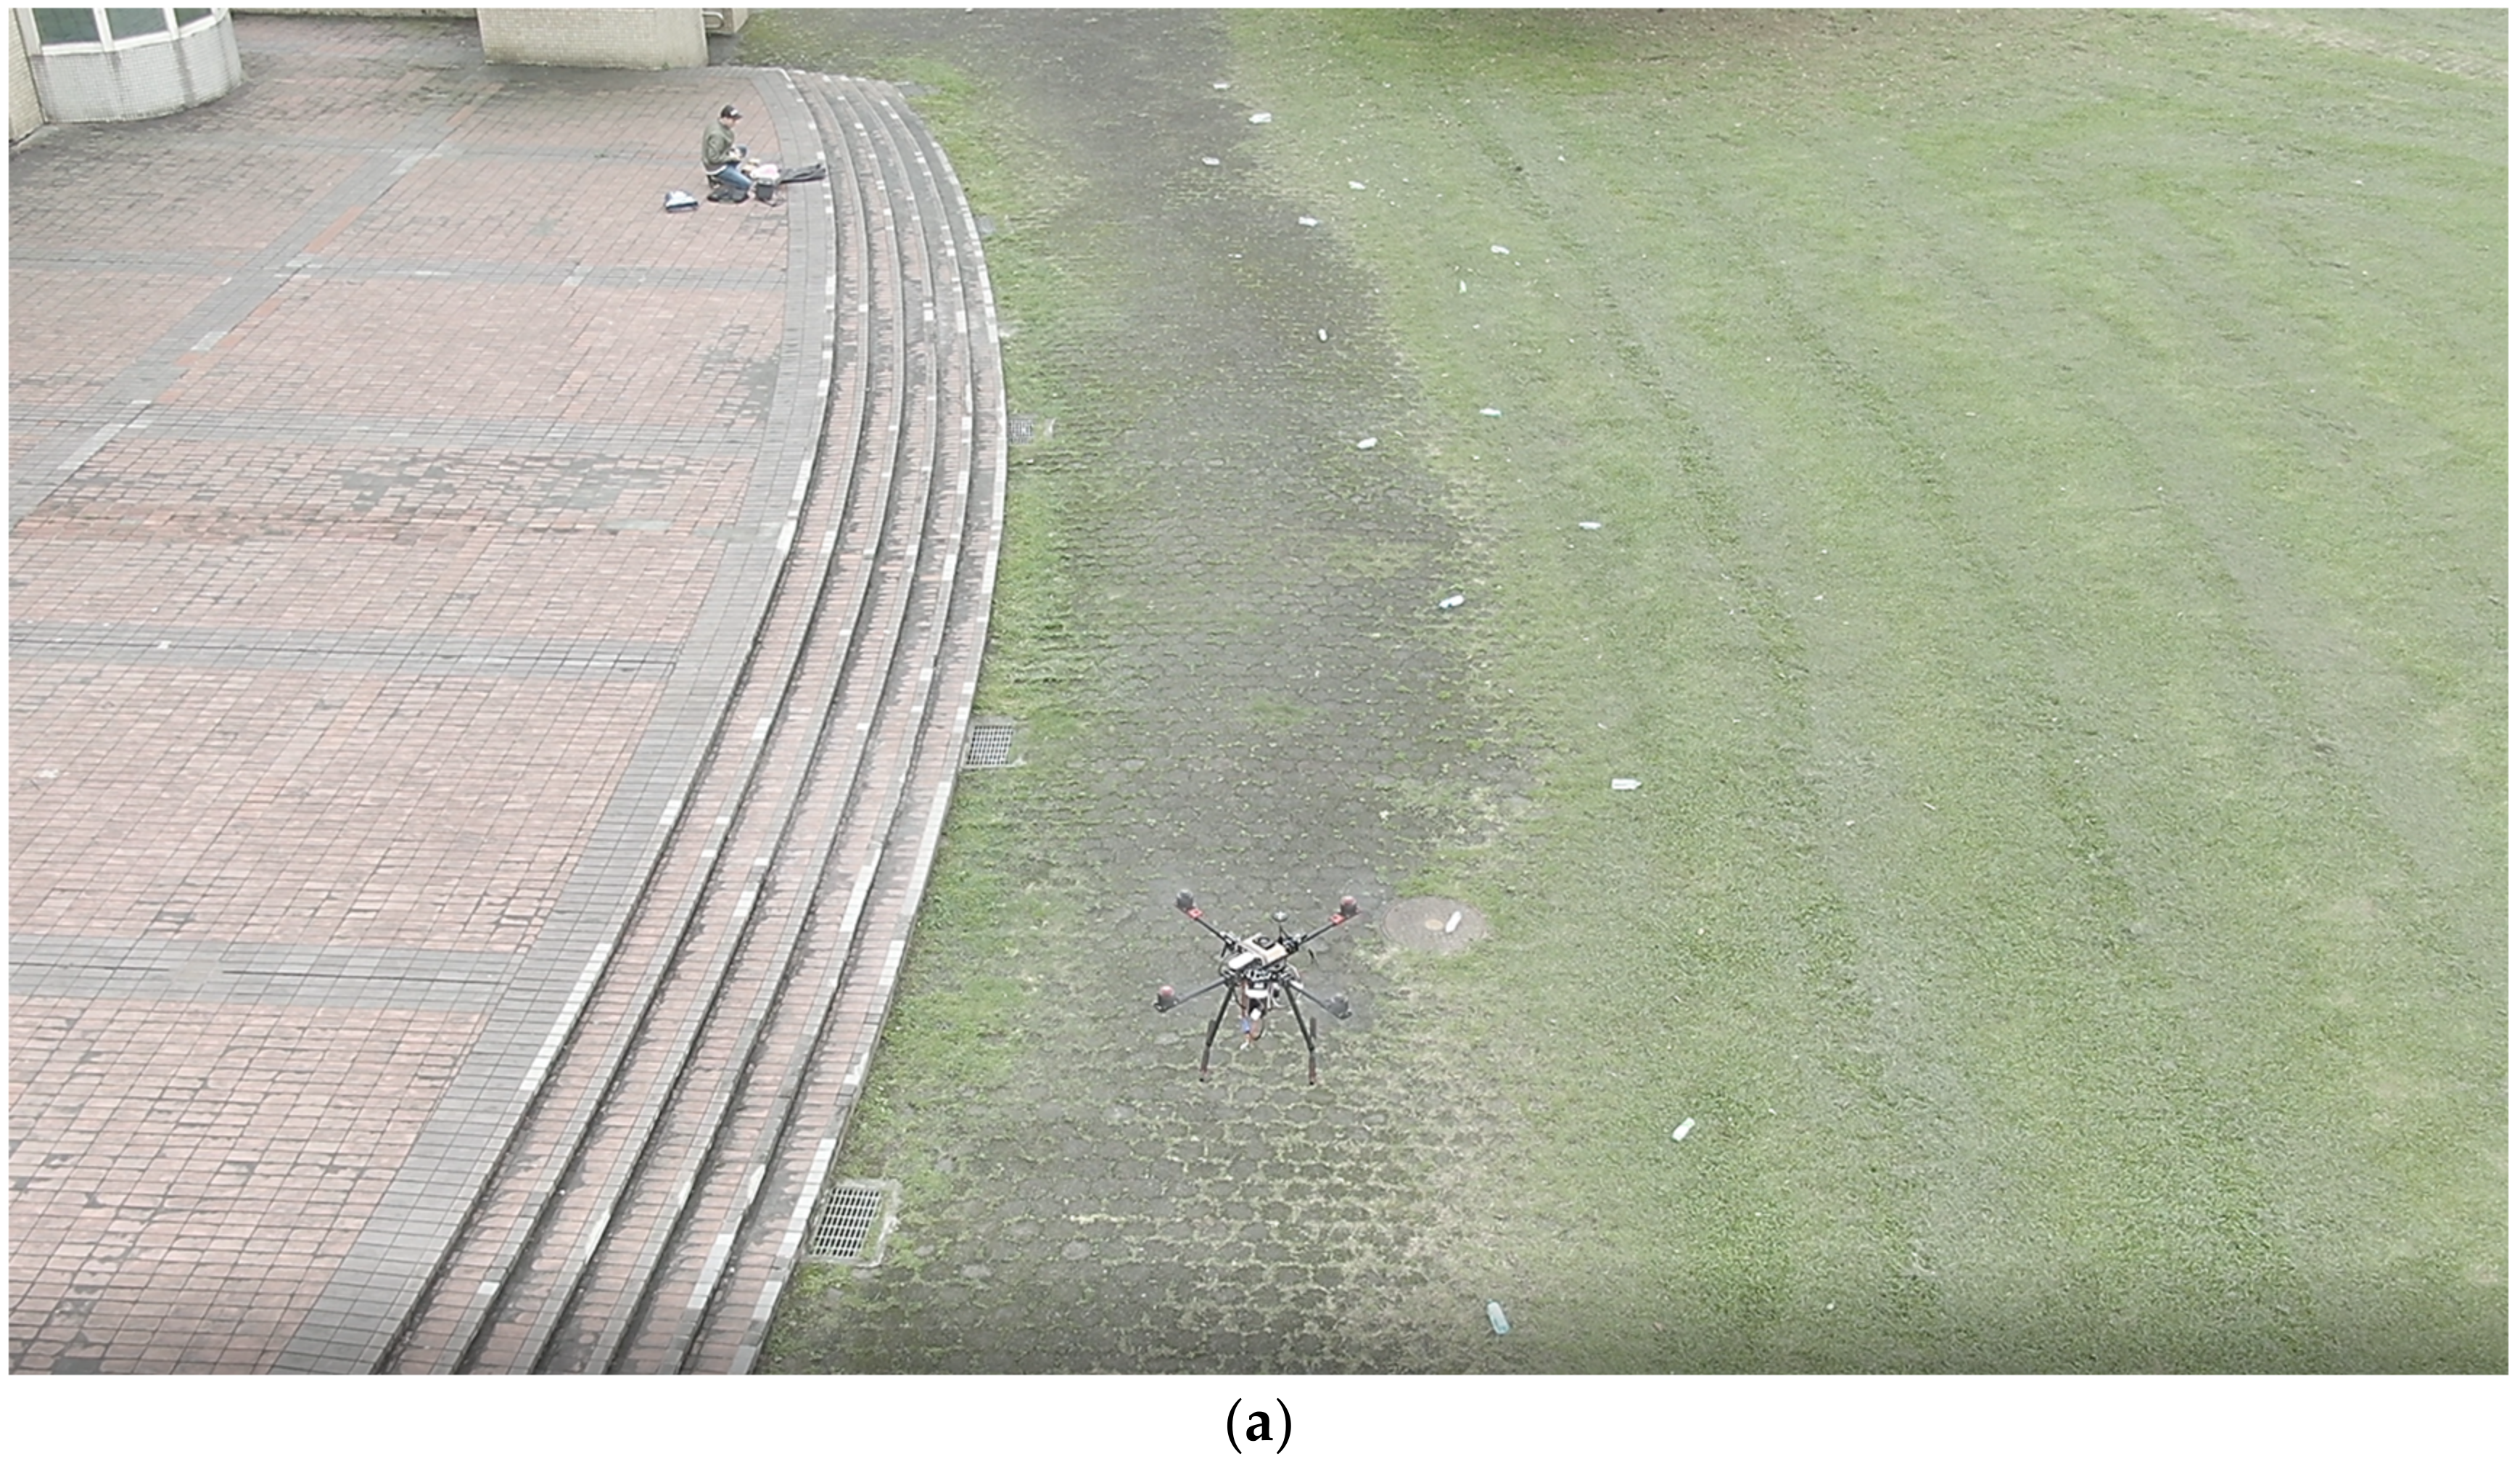
First, regular-shaped trash (bottle) detection was tested in the NTOU campus, as shown in
Figure 13. As shown in
Figure 13b, the confidence scores of small object detections were high (98.27%, 64.65%, and 91.86%).
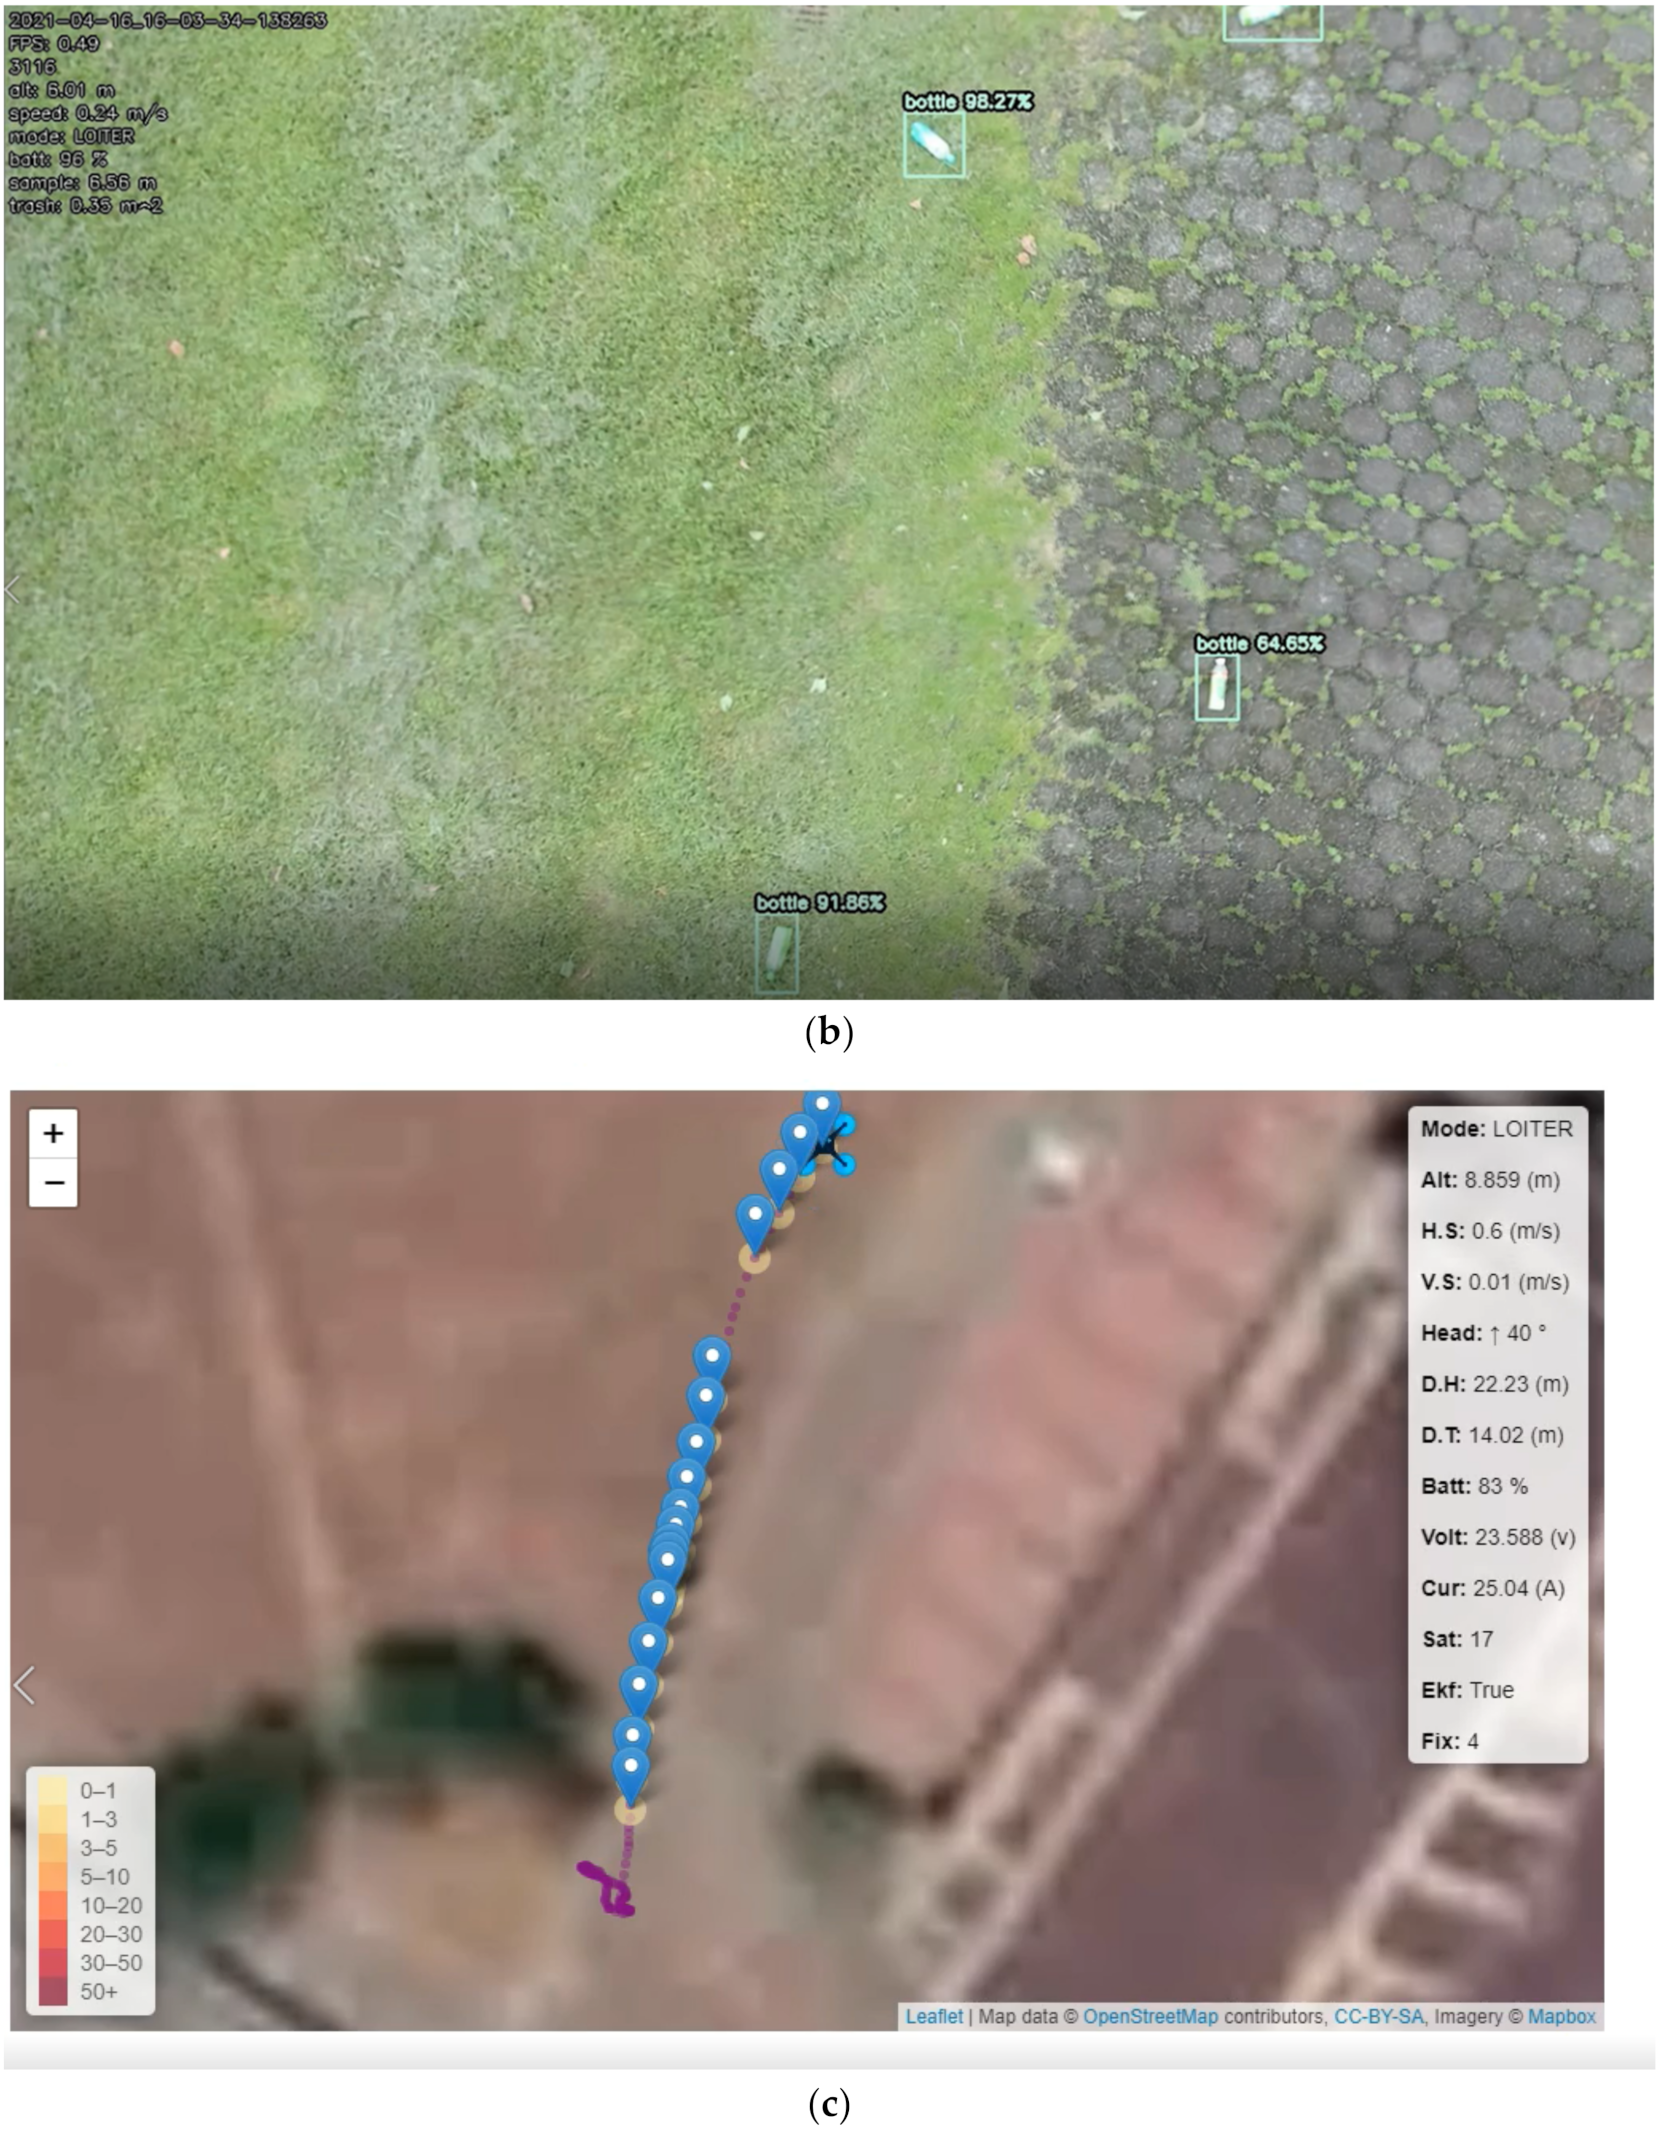
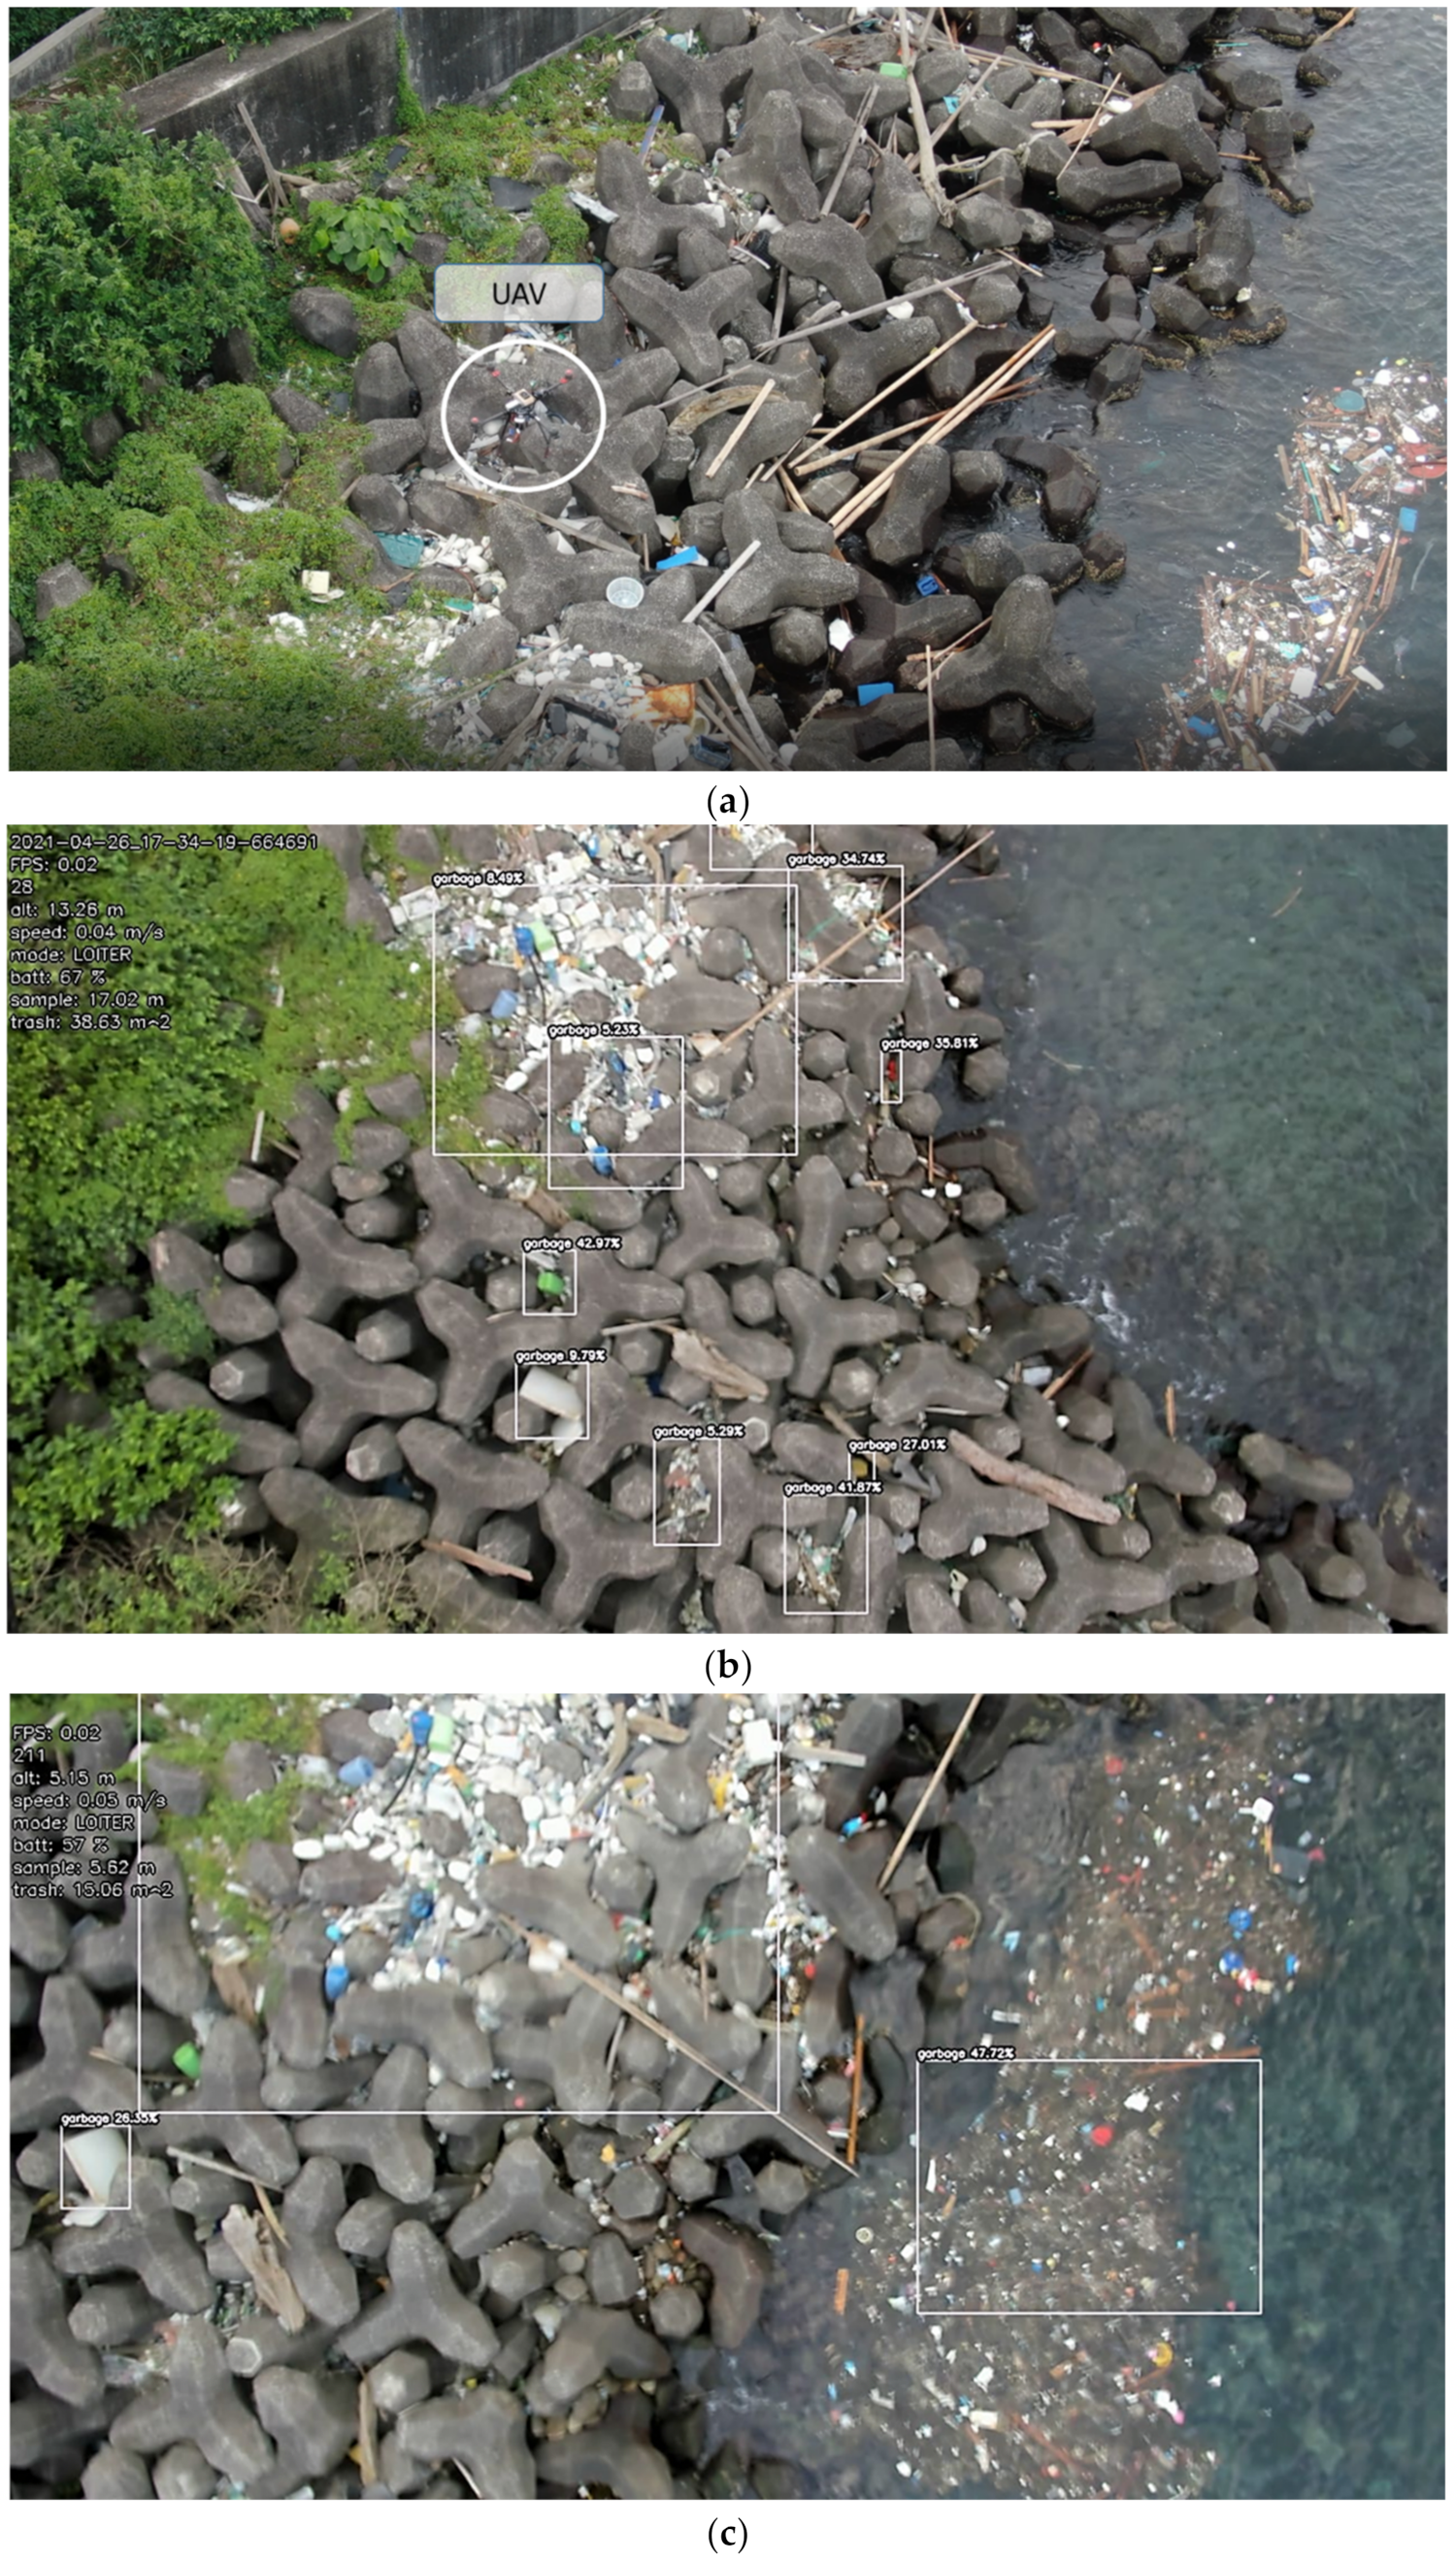
In the Badouzi fishing port, the shape and the texture of the garbage vary due to natural erosion, thus decreasing the confidence scores of garbage detection (42.97%, 9.97%, 41.87%, 5.29%, and 8.49%). Thus, for the HAIDA dataset, there was a large bias to the trash of the Badouzi fishing port. The best solution for this problem was to collect more data for training.
Figure 14a shows the UAV in the Badouzi fishing port, and
Figure 14b,c show the detection of large, medium, and small objects.
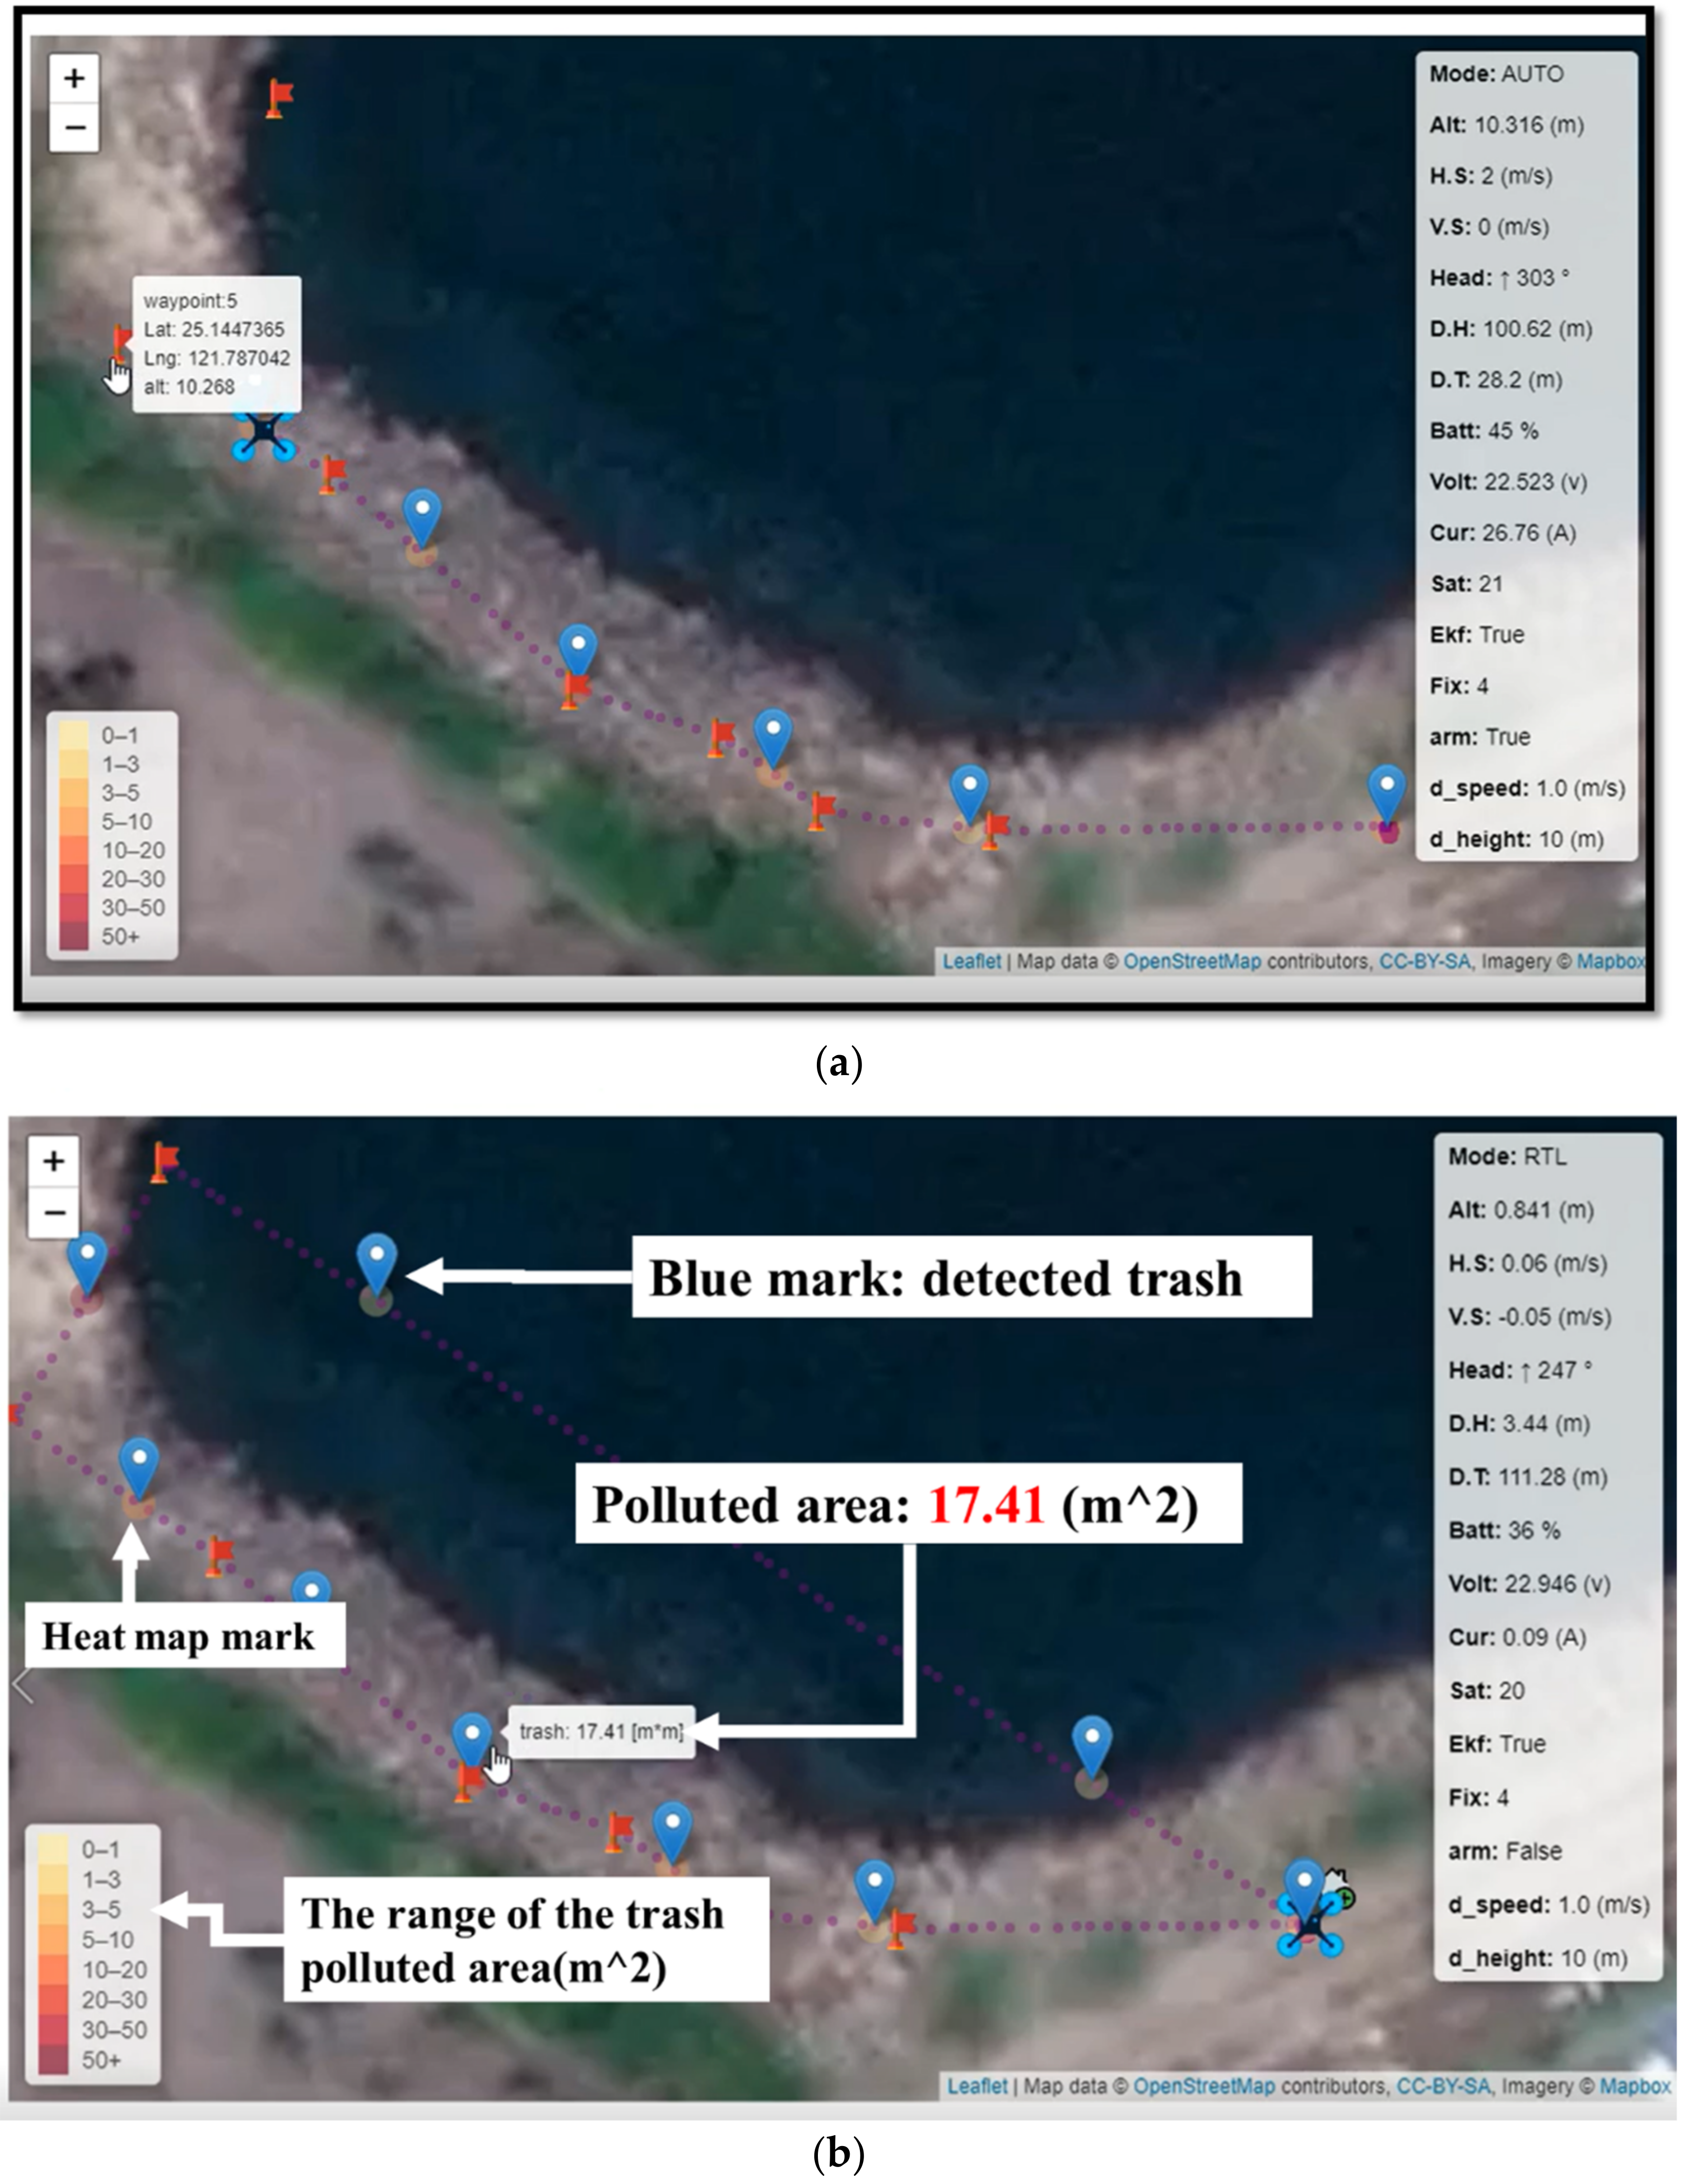
Figure 15 shows the UAV and trash information indicated on the proposed trash monitoring system.
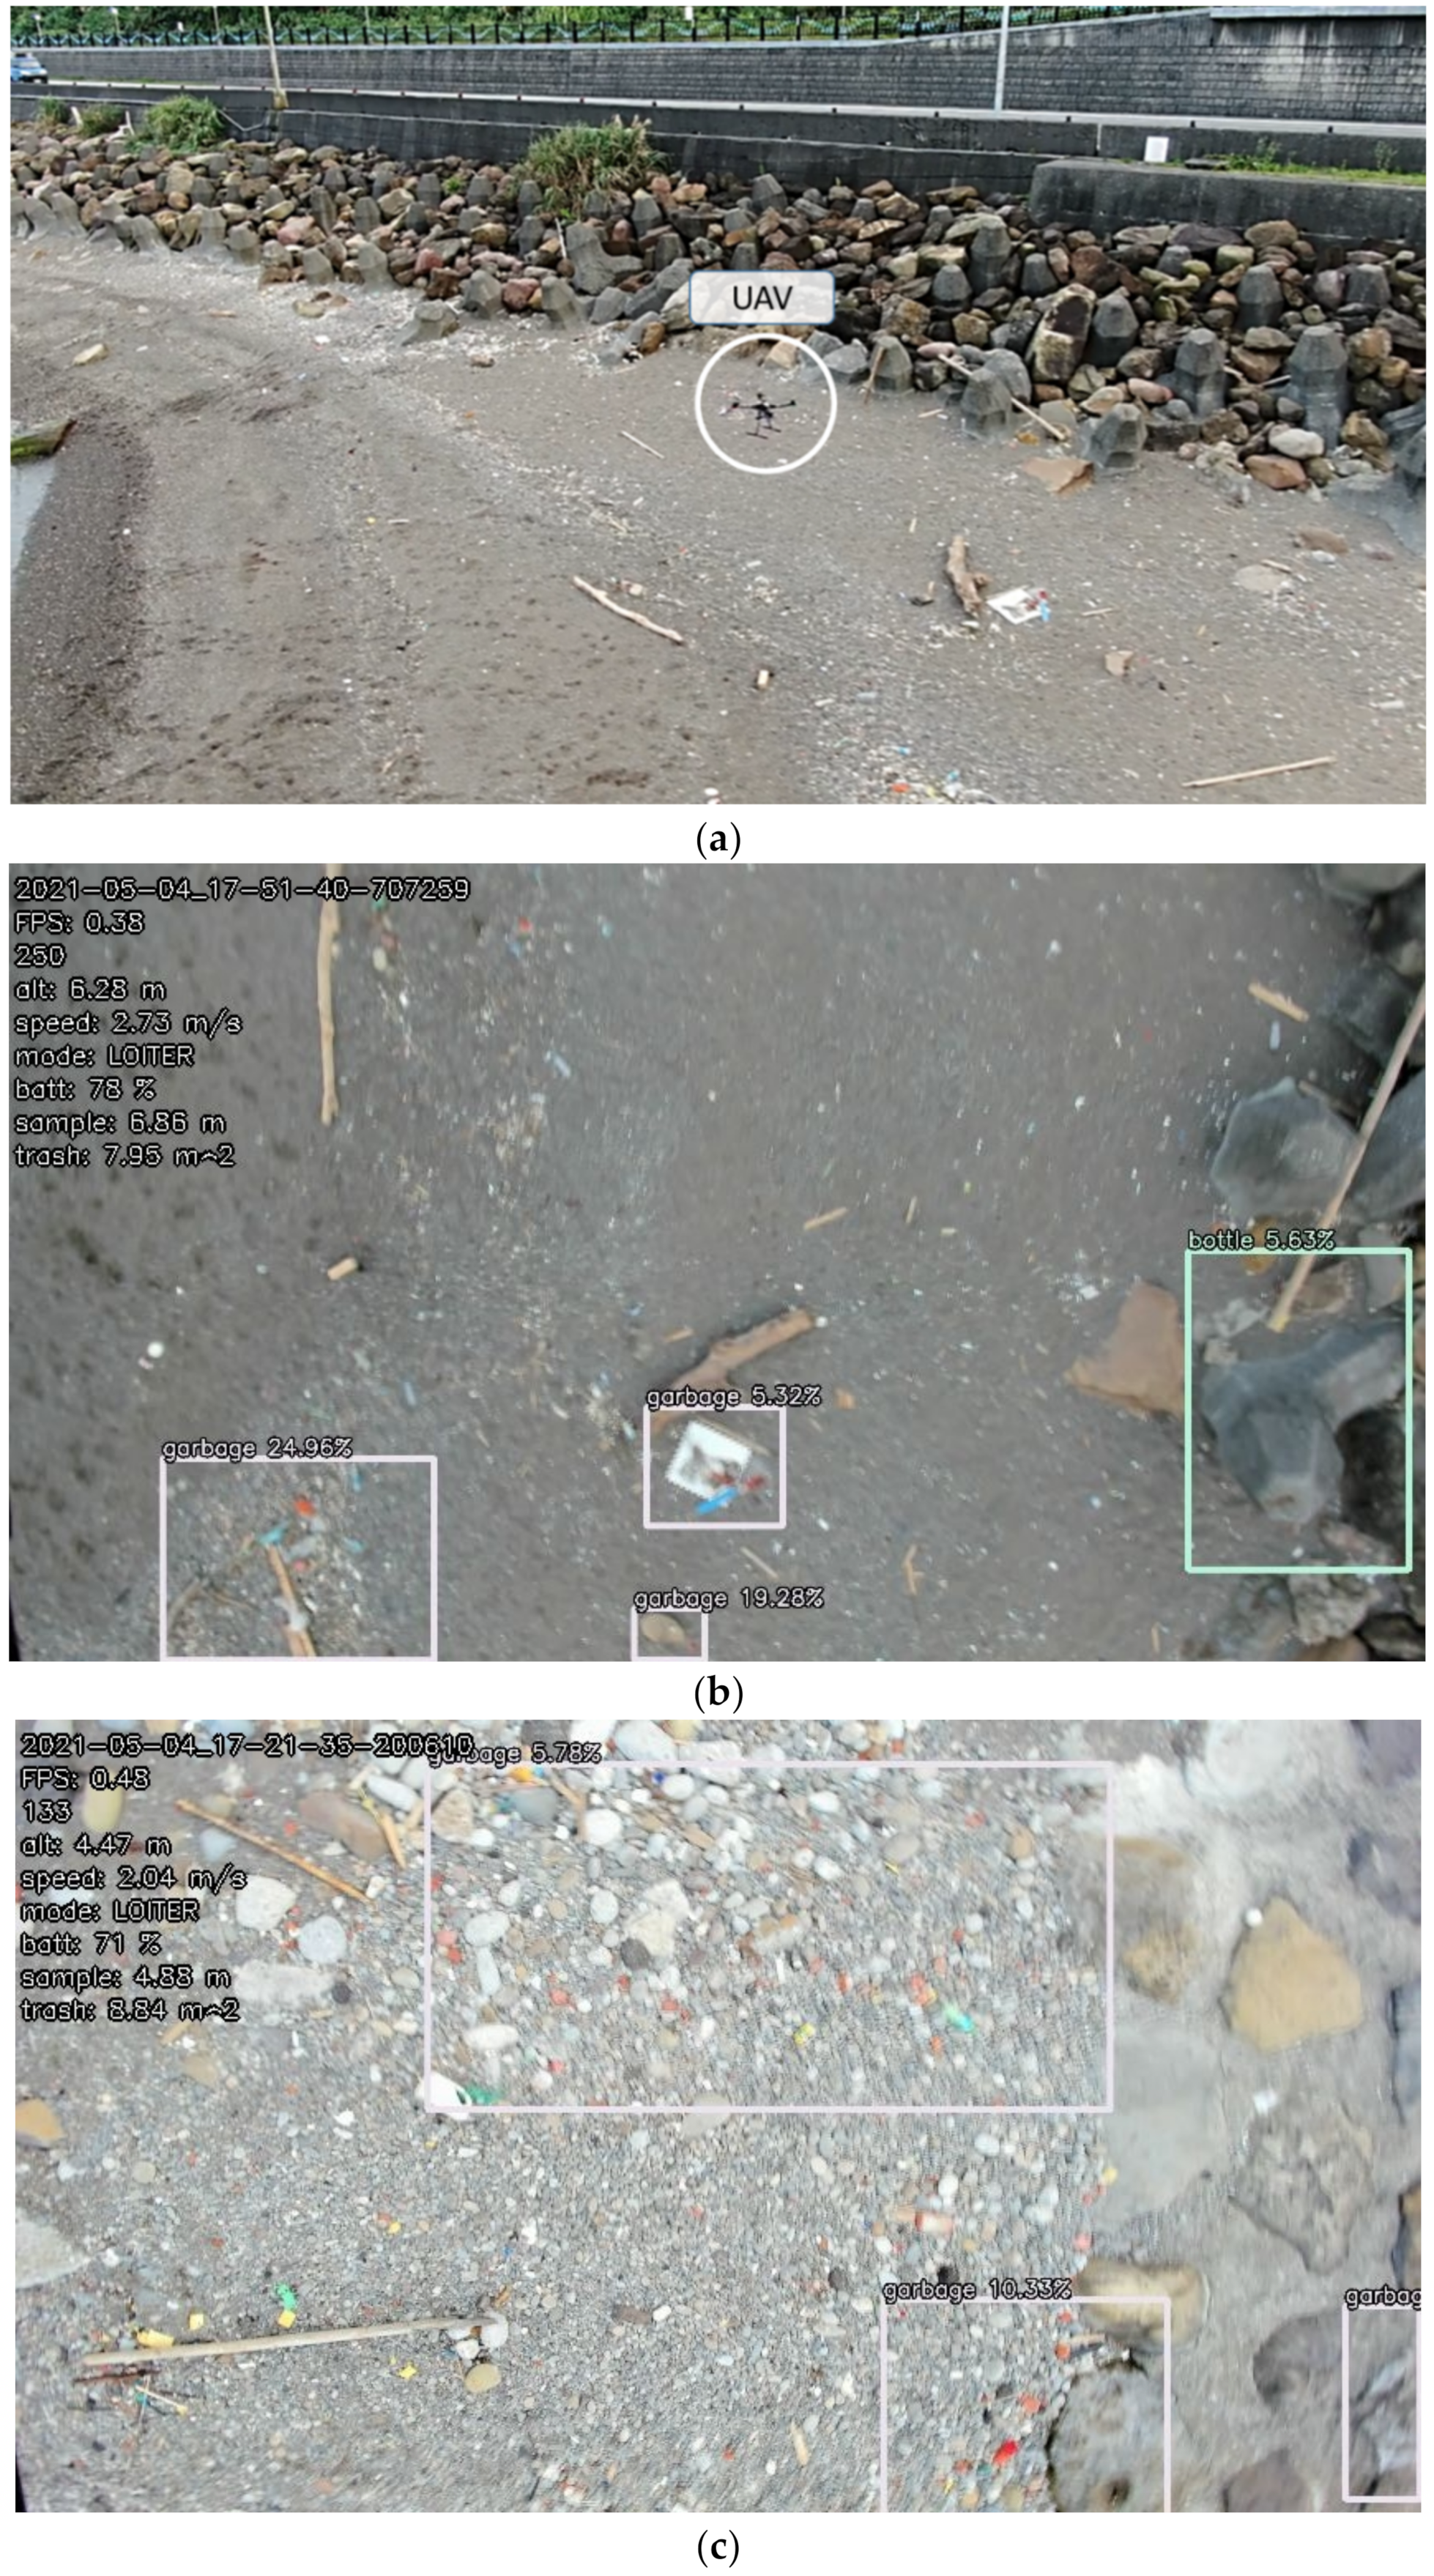
In the third case, there was more plastic debris on the Wanghai Xiang beach. The system easily confused both humans and the trash, and thus, gave false positive (FP) detection (whether it was a stone, garbage, or some plastic debris), as shown in
Figure 16b–d.
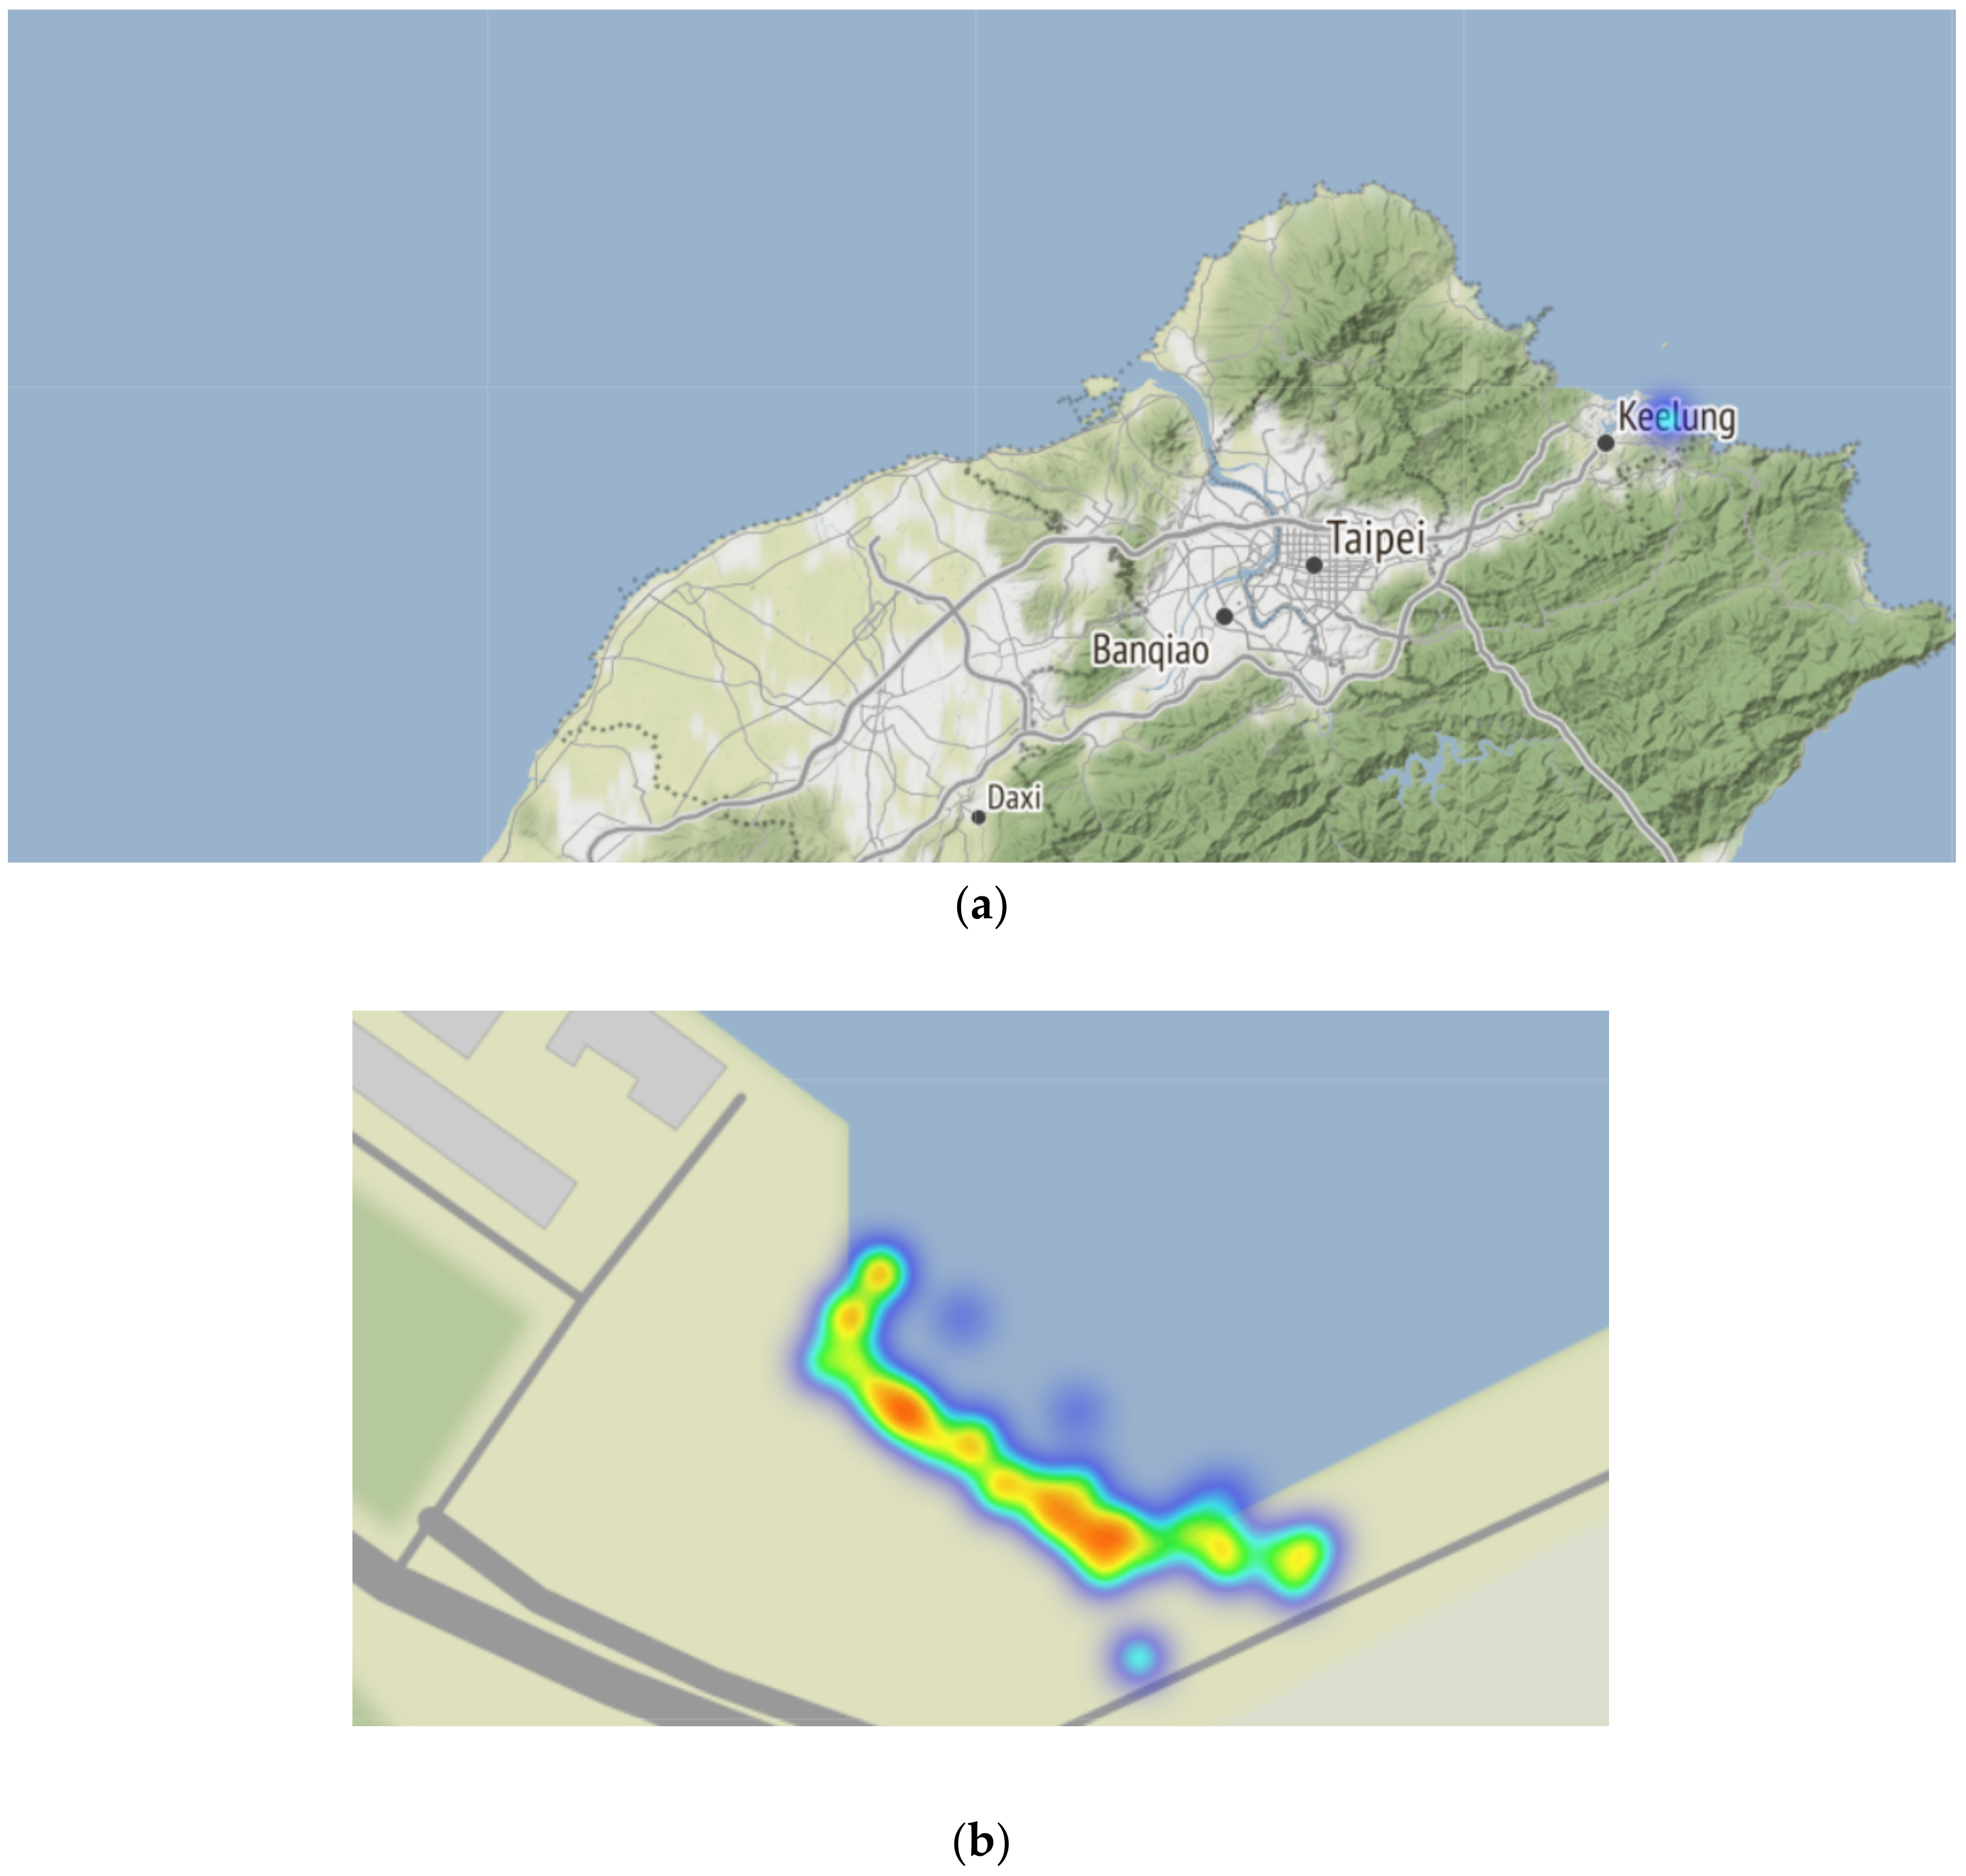
After real-world testing for the Badouzi fishing port, we analyzed the trash data with the Mongo database.
Figure 17 shows the degree of trash pollution map (based on trash polluted area) via our website. The red area means there was more trash.
In auto mode, the altitude of the UAV was set to 10 m on the cruising path so that the camera could obtain a picture with 10 m length. In auto mode, the speed of UAV was 2 m/s, which means every 5 s, the UAV flew 10 m (equal to the length of one picture). The proposed trash detection system sent one processed picture of the coastal image every 5 s so that the picture would not have overlap. The result of auto mode is shown in
Figure 15. In manual mode, as shown in other figures, the altitude was not fixed. In order to show a clear view of different size of trash, the UAV was controlled manually and the altitudes were different.


