Article

Elemental Profiles of Legumes and Seeds in View of Chemometric Approach

by
Małgorzata Grembecka
* and
Piotr Szefer
Department of Bromatology, Faculty of Pharmacy, Medical University of Gdańsk, Gen. J. Hallera Avenue 107, 80-416 Gdansk, Poland
*
Author to whom correspondence should be addressed.
Appl. Sci. 2022, 12(3), 1577; https://doi.org/10.3390/app12031577
Submission received: 5 January 2022 / Revised: 25 January 2022 / Accepted: 29 January 2022 / Published: 1 February 2022
(This article belongs to the Section Environmental Sciences)

Abstract

:
The study aimed to evaluate fourteen elements’ profiles of legumes and oilseeds, of various geographical origins, available on the Polish market. They were determined by flame atomic absorption spectrometry (F-AAS) and spectrophotometric method (phosphorus) in 90 analytical samples. In general, legumes were characterized with lower mean concentrations of Ca, Mg, Na, P, Zn, Cu, Fe, Mn, and Cr than oilseeds. However, the concentrations ranges within each group differed significantly (p < 0.05). Calcium content varied between 6.2 and 243.5 mg/100 g in legumes and 38.4 and 2003 mg/100 g in oilseeds. In the case of Fe, its concentration was between 1.99 mg/100 g and 10.5 mg/100 g in legumes, and 2.05 mg and 12.15 mg/100 g in seeds. All the samples were characterized with Pb concentration below the LOQ (30 µg/100 g). In the case of Cd, its presence (>LOQ, 9 µg/100 g) was confirmed in one sample of legumes (soybean) and five samples of seeds (poppy seeds, roasted linseeds, hulled wheat, linseed, and sunflower seeds). The detected Cd content in every sample, except for soybean and hulled wheat, exceeded the permissible European standards. According to Kruskal-Wallis test results, Mg, Na, K, P, Zn, Cu, Mn, Cr, and Cd content depended on the type of the analyzed product, while in the case of botanical provenance such relationship was recorded for most of the analyzed components, except for Fe, Cr, and Co. Factor and cluster analyses classified the analyzed samples in view of their botanical species and type based on their mineral composition.

1. Introduction

Legumes are one of the oldest human foods, which are vital for the naturally balanced diet as they enhance its nutritional and phytochemical content. Pulses constitute a subgroup of legumes and belong to the Leguminosae family (commonly known as the pea family) that produce edible seeds which are used for human and animal consumption [1]. Every pulse (dry peas, lentils, chickpeas, dry beans) belongs to legumes, but not all legumes such as soybean, peanuts, fresh peas, etc., are pulses [2,3]. They constitute valuable sources of proteins, unsaturated fatty acids, and bioactive compounds such as mineral components [3,4,5,6]. However, currently, the share of legumes in daily diets has been considerably reduced in favor of meat and other highly processed foods. It might be due to unpleasant symptoms, which are felt as a result of improper preparation of legumes for consumption. There are gas-forming oligosaccharides contained in the seeds, which the human body does not digest. This can be remedied by proper culinary treatment, which allows removing large quantities of fermenting sugars while preserving other valuable nutrients. The presence of off-flavors can be also sometimes problematic and limit their consumption by humans [4].
Besides high protein content in legumes and valuable fatty acids in oilseeds, they can provide mineral components, such as P, Mg, Fe, Zn, Cu, and Mn, which bioavailability can be increased by proper culinary treatments [7]. There is a range of factors influencing metals’ concentrations in plants such as soil temperature, pH, fertility, reductive-oxidative conditions, and the content of organic matter in the soil, as well as plant species [8]. However, due to the anthropogenic activity of humans, there can be observed a certain increase in heavy metals levels both in the environment and plants, thus, food products. Heavy metals, such as cadmium (Cd) and lead (Pb), are among the major contaminants of food products. Cd bioavailability is relatively low (3–5%) and depends on the nutritional status (low body Fe stores) of the body, as well as multiple pregnancies, preexisting health conditions, or diseases. However, Cd is accumulated in the kidney and liver in the human body, with a half-life ranging from 10 to 30 years [9]. Lead accumulates in the body, primarily in the skeleton with a half-life in bones between 10 and 30 years [10]. To protect consumers, World Health Organization (WHO) introduced Provisional Tolerable Monthly Intake (PTMI) for Cd, which is set at 25 µg/kg b.w./month [11]. In the case of Pb, its Provisional Tolerable Weekly Intake (PTWI) was found no health-protective, thus, it was withdrawn. Due to their toxicity, Pb and Cd levels should be constantly monitored in food products.
The study aimed to estimate and compare essential elements contents (P, Mg, Ca, K, Na, Zn, Cu, Fe, Cr, Co, Ni, Mn) and toxic heavy metals contents (Pb, Cd) in legumes and oilseeds available on the Polish market, but of different provenances. Furthermore, the contribution of these products to daily metal intakes and health risks associated with Cd and Pb intakes were assessed. Moreover, based on elemental profiles it was possible to differentiate chemometrically legumes and oleic seeds samples and classify them in view of their species and type characteristics.

2. Materials and Methods

2.1. Samples

Legumes and seeds of oleic plants were collected randomly from shops scattered within the city of Gdansk and in Pomeranian Voivodeship (Poland). All samples were commercially available and immediately prepared after purchase. In total, 28 products (90 analytical samples) including 14 kinds of legumes (lentils, beans, soybean, peas) and 14 varieties of seeds (linseed, poppy, pumpkin, sunflower, sesame, and wheat hulled) were analyzed. Samples represented several brand names available in Poland, but products were of Polish, European (Italy, Czech Republic, Hungary), Asian (India, China), Canadian and Australian origin (Table A1).

2.2. Samples Preparation

Legumes and oilseeds were homogenized and stored until analysis in desiccators in lockable polyethylene bags. Similarly to the previously published procedure [12], 10.0 (±0.0001) g products’ portions were dry ashed and then digested with the use of 36.5% HCl (Tracepur® Merck) and 65% HNO3 (Suprapur® Merck). Subsequently, each sample was replenished to 25 mL with ultra-pure water (18.2 MΩ cm−1) from a Milli-Q system (Millipore, MA, USA) [12].

2.3. Determination of Elements’ Concentrations

A PU-9100X model atomic absorption spectrometer (Philips, Great Britain) with deuterium-background correction was used for the determination of such elements as Mg, Ca, K, Na, Zn, Cu, Fe, Cr, Co, Ni, Mn, Pb, Cd. In all cases, stoichiometric flame air/acetylene was used with the fuel flow of 1.0 L/min. The instrument parameters were described in Table A2. Phosphorus was determined in the form of phosphomolybdate by spectrophotometric method [12] using Spekol 11 (Carl Zeiss, Jena, Germany).
Cesium chloride (Merck, Darmstadt, Germany) and lanthanum(III) oxide (Merck, Darmstadt, Germany) were used as chemical modifiers. Sodium and K analyses required the addition of an ionization buffer at a concentration of 0.2% w/v (CsCl), whereas Ca and Mg determinations needed a releasing agent at a concentration of 0.4% w/v (La2O3). The limit of detection (LOD), which is defined as the lowest concentration that can be detected with reasonable certainty for a given analytical procedure [13], was calculated as the concentration corresponding to signals equal to three times the standard deviation of ten replicates of a blank solution (1). The limit of quantification (LOQ), which is the lowest concentration of a substance that is possible to be determined using a given analytical procedure with the established accuracy, precision, and uncertainty, was calculated using Formula (2).
LOD = blank   mean + 3 SD
LOQ = 3 · LOD
The quantification limits were suitable for the determination of all elements, except for Pb and Cd, which were under the LOQ (0.03 mg/100 g w.w. and 0.003 mg/100 g, respectively) in some samples.

2.4. Accuracy and Precision of the Analytical Method Used for Quantification

Accuracy and precision were corroborated by using certified standard reference materials (CRMs) including tea (NCS DC 73351), cabbage (IAEA-359), and spinach (IAEA-331). NCS DC 73351 was purchased from China National Analysis Centre for Iron and Steel, Beijing (China). Cabbage (IAEA-359) and spinach (IAEA-331) were purchased from International Atomic Energy Agency (IAEA), Vienna, Austria. All CRMs were prepared according to the same decomposition procedure applied in the case of legumes and seeds. The results concerning recovery (86–103%) and precision (0.36–5.34%) were highly satisfactory (Table 1).

2.5. The Realisation of Dietary Recommendations and Health Risk Assessment

The daily mineral intake (in %) through consumption of 100 g of the analyzed legumes and oilseeds was calculated as DMI = C × 100/RDA (or AI), where C—element concentration (in mg) in 100 g of products; RDA (or AI)—according to the National Polish Food and Nutrition Institute, value for an adult male (from 19 to 65 years old) [14].
Cadmium content in the selected products (>LOQ) was assessed in view of the regulations of the European Commission No 1881/2006 and No 629/2008 [15,16]. Due to high Cd toxicity, WHO introduced provisional tolerable monthly intake (PTMI) for this metal [11], which is 25 µg/kg of body weight for an adult, i.e., 1750 µg monthly for a 70 kg person. To evaluate human exposure to Cd, the realization of its PTMI through consumption of 100 g products was assessed.

2.6. Data Analysis

Before the chemometric analysis, all the variables were tested for normality using Shapiro–Wilk and the Kolmogorov–Smirnov tests. In all cases, they did not follow the normal distribution, thus, nonparametric procedures, i.e., Spearman’s rank correlation analysis (p < 0.001, p < 0.01, and p < 0.05) and ANOVA Kruskal–Wallis (p < 0.05) tests were adapted in our analyses. A post-hoc Dunn’s test was used to verify which of the analyzed groups differ from each other. To reduce a large number of variables into fewer numbers of factors and to identify the main components underlying groups’ differences we conducted factor analysis (FA) and cluster analysis (CA).
The choice of discriminative elements was done based on Kruskal-Wallis test and 11 of them (Ca, Mg, Na, K, P, Zn, Cu, Fe, Mn, Cr, and Cd) were chosen for further chemometric analyses. Lead was eliminated from the statistical analysis as its concentration was below the LOQ in all the analyzed samples. To determine the number of factors, Kaiser criterion and the Cattell scree test plot were used. There were three defined factors, but the variance explained by the third factor was very small, thus, only two factors were taken into account when interpreting results. The cut-off loading value to determine which elements will be used at the clustering stage was set at level >0.70. All the analyses were performed using STATISTICA 12.0 for Windows (Copyright© StatSoft, Inc. 1984–2014, USA). Prior to the chemometric processing, the data matrix was autoscaled, standardized, and arranged in columns (elements) and rows (the analyzed legumes and seeds samples).

3. Results and Discussion

The analyzed elements concentrations in legumes and seeds of oleic plants were characterized by the arithmetic mean value, the corresponding standard deviation (SD), and ranges for wet weight (w.w.) basis in Table 2. Lead concentration in all the analyzed samples was below the LOQ (30 μg/100 g), thus, it was eliminated from the data analysis.

3.1. Macrominerals

The macrominerals’ concentrations in the analyzed samples of legumes and seeds were quite varied, both between and within the groups (Table 2). It can be partially explained by varietal differences and the geographical provenance of particular samples. The analyzed legumes were characterized by the highest average amounts of K (688 mg/100 g) and P (590.8 mg/100 g). The other macrominerals’ mean contents were within the range of 127.98 mg (Mg) and 1.41 mg/100 g (Na). In general, soybean and other beans contained the highest levels of these bioelements, in contrast to corn, which constituted rather a poor source of macroelements (Table 2). Lentils contained from 411 to 546 mg P/100 g, which is comparable with data presented by Souci et al. [17]. However, the determined content of K (513–689 mg K/100 g) was lower than the one reported by Souci et al. [17] (837 mg/100 g).
Similar trends could be observed in the case of oilseeds, which also contained the greatest mean amounts of P (1010 mg/100 g), and particularly pumpkin, poppy, and sunflower seeds were rich in this element. Oleic seeds also had comparable average levels of Ca (404 mg/100 g) and K (500 mg/100 g). However, great variability in Ca concentrations was observed, which ranged between 38.4 mg (hulled wheat) and 2003 mg/100 g (poppy seeds). Nevertheless, these results are comparable to data presented by Souci et al. [17]. According to them [17], poppy seeds contained Ca concentration of 1460 mg /100 g, while wheat grain had a concentration of 33 mg/100 g. Seeds were also characterized with the lowest amounts of Na, i.e., 0.75 mg (wheat hulled)–33.4 mg/100 g (sesame seeds) (Table 2).

3.2. Microminerals

In general, legumes were characterized with lower concentrations of Zn, Cu, Fe, Mn, and Cr than oilseeds (Table 2). Iron and Zn content in soybean amounted to 8.34 and 4.61 mg/100 g, respectively. Souci et al. [17] reported lower Fe values (6.6 mg/100 g) but comparable in the case of Zn (4.2 mg/100 g). According to Ramírez-Ojeda et al. [7], Fe content in dry lentils and beans amounted to 8.4 mg/100 g and 4.5 mg/100 g, respectively. However, in our current research, Fe content in beans was 3.72 mg/100 g, while Cabrera et al. [18] determined almost two times higher Fe content of 6.25 mg/100 g. Similarly, in the case of Zn, they [18] found almost a 100% higher level of Zn in beans (3.97 mg/100 g) than in our study (1.91 mg/100 g). These results might be in accordance with the findings of Eberl et al. [19], who stated that studies in the UK and the US have reported a temporal decline in the Fe content of plant-based foods. They found significant decreases in Fe content in legumes, with higher and more variable values reported pre-2000 compared to recent years [19]. However, Cabrera et al. [18] noted similar to ours Fe concentration in sunflower seeds, i.e., 4.09 mg/100 g. Manganese levels varied between each analyzed group, with the highest values noted for soybean (2.21 mg/100 g) among legumes, and poppy seeds (7.2 mg/100 g). According to Özcan et al. [20] beans were characterized with almost 50% higher Mn content (2.1 mg/100 g) than in our study (1.51 mg/100 g).
Nickel and Co levels in both groups of the analyzed products were comparable, with the highest Ni values found in soybean (0.51 mg/100 g) and sunflower seeds (0.47 mg/100 g). According to Cabrera et al. [18] Ni concentrations in lentils and beans were about three times lower than in our study and amounted to 0.05 mg and 0.06 mg/100 g, respectively. In the case of Co, its concentrations ranged between 0.01 and 0.02 mg/100 g. Leguminous plants are known for Co usage in symbiotic N2 fixation [8,21]. Moreover, soil pH strongly determines the availability of Fe, Mn, and Zn [8]. Zinc content was the highest in poppy seeds (7.02 mg/100 g) and pumpkin seeds (6.99 mg/100 g), which is comparable to Souci et al. [17] data. However, Zn bioavailability to leguminous plants can be limited by the low content of this metal in soil, high pH, high organic matter and P levels, low temperature, and high salt concentration [8]. What is more, according to Zhao et al. [22], Mn excess in plants can result in increased Fe and Zn levels. In our study, higher levels of Mn could be associated with higher Zn and Fe levels in soybean and poppy seeds (Table 2). Our findings concerning Mn content in soybean (2.21 mg/100 g) are comparable to those reported by Souci et al. [17] (2.7 mg/100 g) but much lower in the case of poppy seeds. Moreover, the phytoavailability of metals determines their potential entrance to the food chain [23,24].

3.3. Toxic Metals

All the samples were characterized with Pb concentration below the LOQ, i.e., 30 µg/100 g. In the case of Cd, its presence (>LOQ, 9 µg/100 g) was confirmed in one sample of legumes (soybean) and five samples of seeds (poppy seeds, roasted linseeds, hulled wheat, linseed, and sunflower seeds) (Table 2). The highest levels of this metal were found in roasted linseed (64.8 µg/100 g) and poppy seeds (39.2 µg/100 g). The latter were characterized with a quite varied Cd content as one of the commercial products had 62 µg Cd/100 g, whereas the second—16.4 µg Cd/100 g. Interestingly, these two products were of identical geographical provenance (Czech Republic) but different manufacturers. There can be observed a substantial difference in Cd content between natural and roasted linseed, i.e., 28.9 and 64.8 µg/100 g, respectively. Such variation may indicate environmental pollution, where plants were grown, as well as the influence of technological processing [25,26]. This metal is reckoned as the major phytotoxic element, which frequently induces both cytotoxic and genotoxic effects and plants account for the major source of entry of Cd into the food chain [26]. According to Cabrera et al. [18] pulses were characterized with much lower Cd contamination than in our study.

3.4. Recommended Dietary Intake and Health Risk Assessment

Consumption of 100 g of legumes and seeds provided the human body with varying amounts of mineral components (Table 3). In general, the realization of RDA for macrominerals was greater in the case of seeds consumption. On average, it amounted to 0.92% for Na, 40.4% for Ca, 68.8% for Mg, and 144.3% for P. Only realization of RDA for K was comparable for seeds and legumes, i.e., 14.3 and 19.7%, respectively. Similar trends were observed for microminerals. Lower average percentages of RDA realization for an adult man were obtained for legumes, i.e., 26.7% for Zn, 71% for Cu, and 56.5% for Mn. Again, consumption of 100 g of seeds fulfilled RDA to a greater extent, i.e., 49.6% for Zn, 117.7% for Cu, and 155.7% for Mn. However, the realization of RDA for Fe, like K, was exclusively comparable amounting to 60.3% and 57.1% for seeds and legumes, respectively. Although the content of minerals in legumes and seeds is high, their bioavailability is poor. It is mainly due to the presence of phytate and polyphenols, which are the main inhibitors of Fe and Zn absorption [27]. According to Mohan et al. [28] major types of polyphenols strongly inhibit dietary non-heam iron absorption. The content of polyphenols in pulses varies, and the greatest amounts can be found in beans while the lowest in peas [26]. Simultaneously, excess Zn can hinder the absorption of Fe, and haemagglutinins inhibit Fe and Zn bioavailability [3,29]. Therefore, a strictly vegetarian diet can be associated with low absorption of Zn and Fe, which can be increased by proper food processing such as fermentation, soaking, and germination, the addition of phytase, or polyphenol-degrading enzymes [26]. Besides, there are also substances of plant origin that promote micronutrients bioavailability, such as inulin and fructans, beta-carotene, or organic acids (ascorbic acid) [3,28]. According to Ramírez-Ojeda et al. [7] cooking of legumes decreased the total content of trace elements, due to the leaching of minerals from the seeds into the water, but considerably improved their bioaccessibility. This could be a result of the possible destruction of antinutritional’ components [7].
There was also assessed human exposure to Cd through PTMI realization (1750 µg/70 kg/month) by consumption of 100 g of legumes or seeds. In the case of soybean, it amounted to 0.51%, whereas in seeds it ranged between 1.12% (sunflower seeds) and 3.70% (roasted linseed). The maximum levels of Cd and other contaminants in different foodstuffs are regulated by Commission Regulation (EC) No 1881/2006 and No 629/2008 [15,16]. Therefore, we assessed the content of Cd in view of the above-mentioned regulations, which set the allowable limit in soybean, other legumes, and seeds at 0.2 mg/kg w.w. It was found that the detected Cd content in every sample, except for soybean and hulled wheat, exceeded the permissible standards (Table 2). Such contamination can be associated with a high health risk to the consumer, as this toxic metal tends to accumulate in the liver, kidneys, lung, pancreas, bones, and brain [25]. Our findings are in accordance with the scientific opinion of the European Food Safety Agency Contam Panel, which stated that cereals and cereals products, vegetables, nuts and pulses, starchy roots or potatoes, meat, and meat products contribute to a major part of the dietary cadmium exposure [30]. According to this Panel [30], exposure to cadmium at the population level should be reduced, that is why food products should be strictly controlled for this metal contamination.

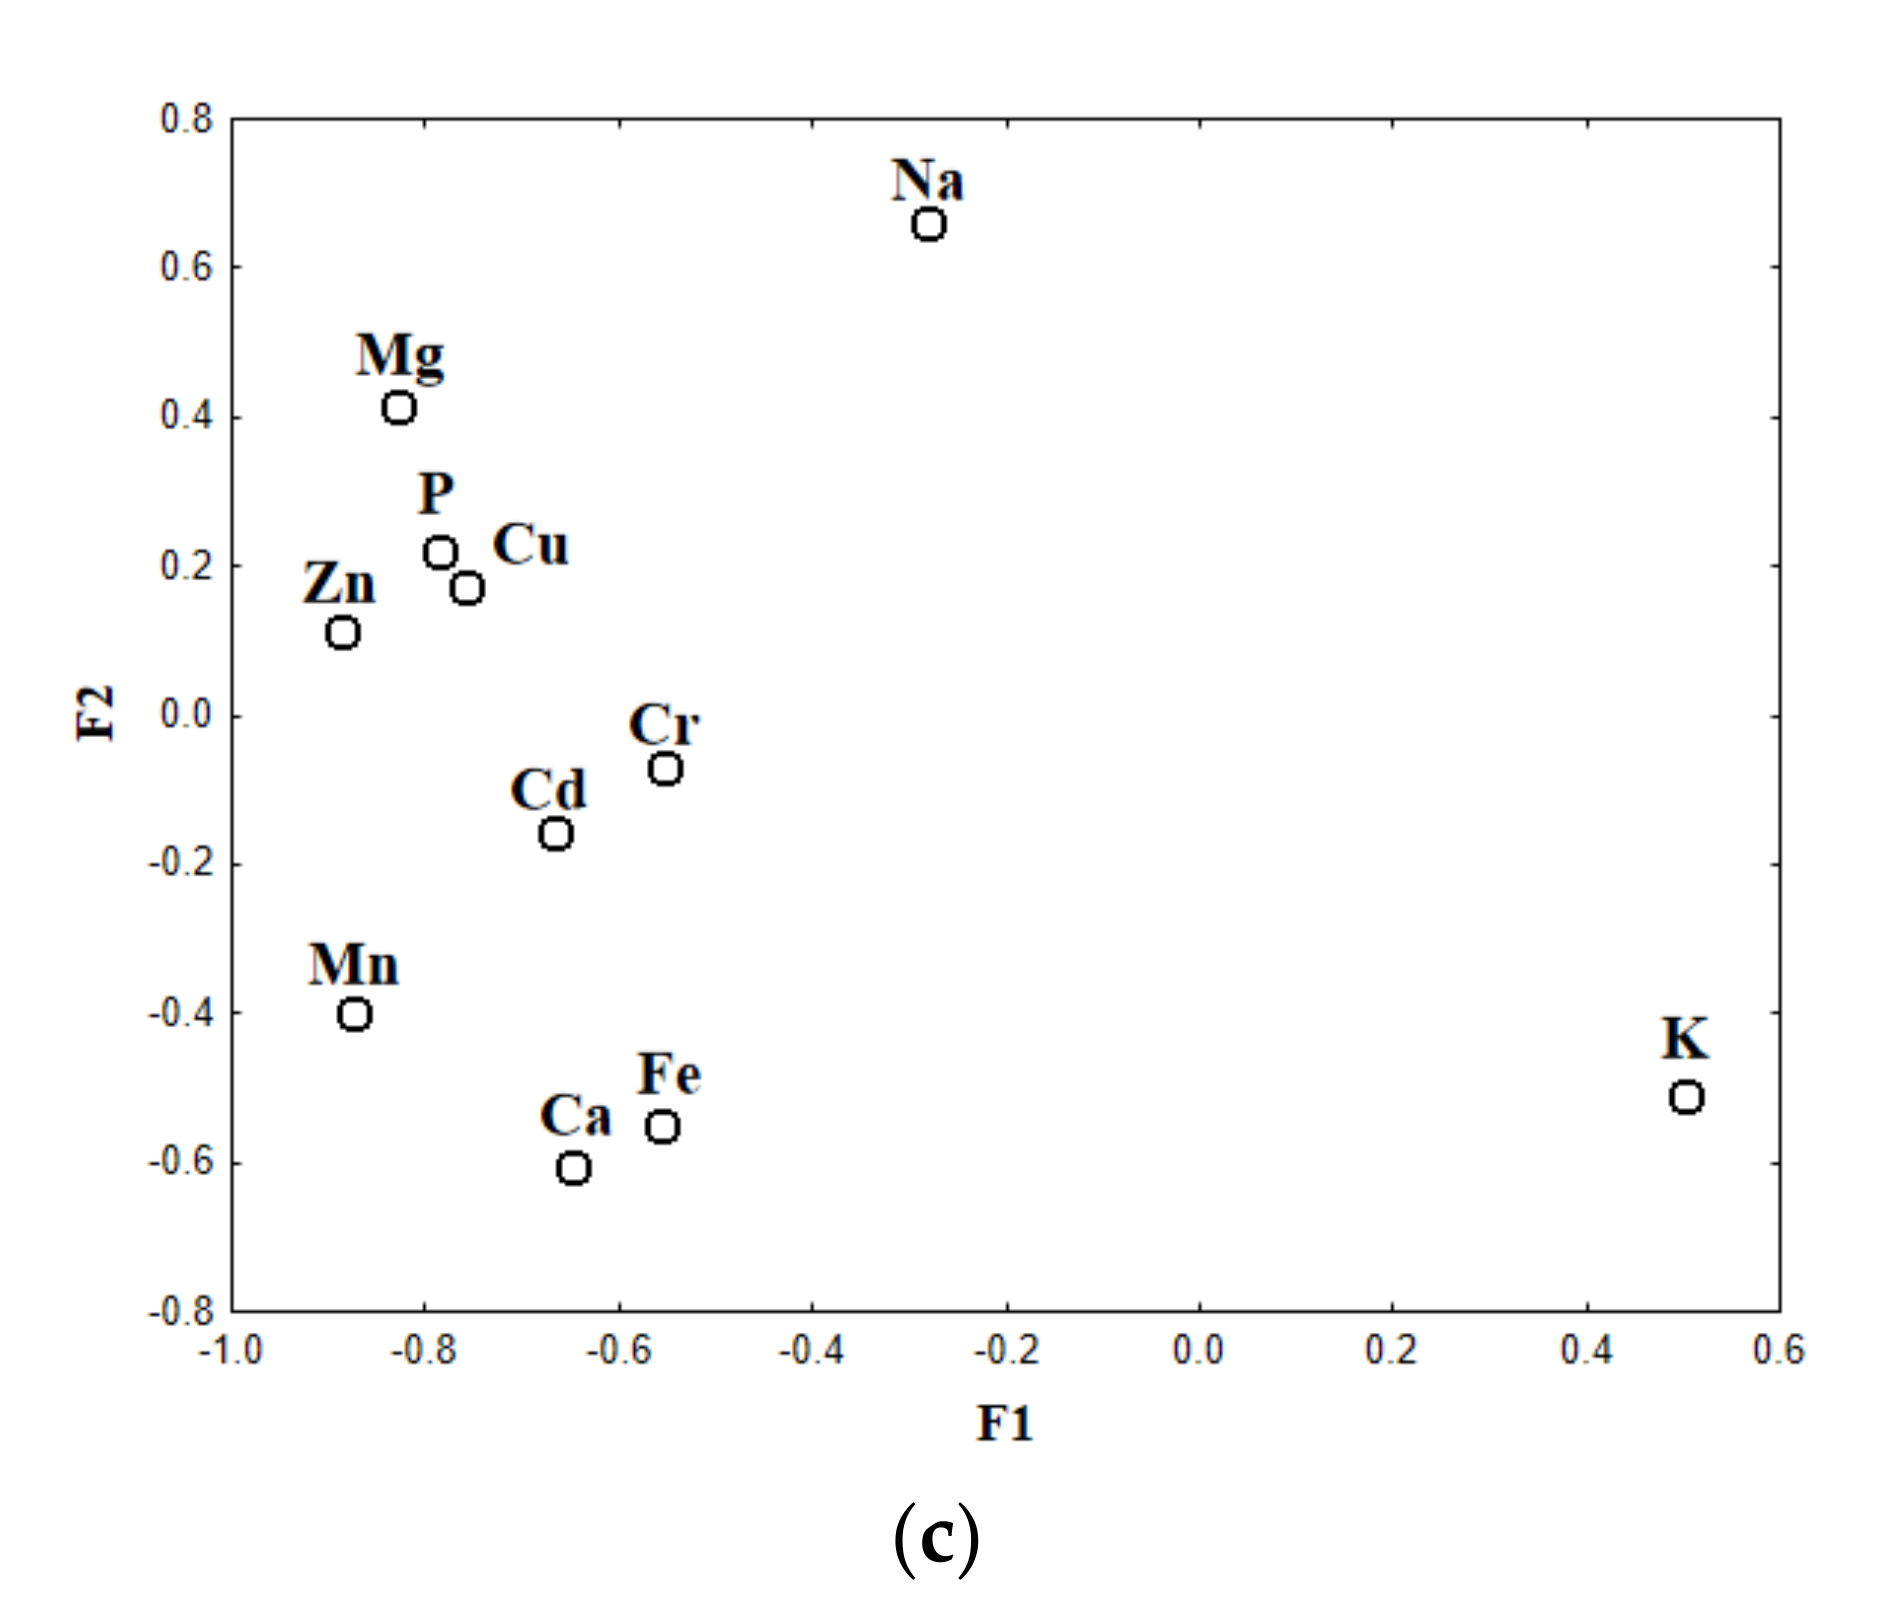
3.5. Correlations among Macro-, Microelements and Toxic Metals Content in Legumes and Oilseeds

Spearman correlation analysis has shown several statistically significant correlations (p < 0.001, p < 0.01, and p < 0.05) between concentrations of the elements studied in each group of the analyzed products, i.e., legumes and seeds (Table 4). There were observed both positive and negative correlations. Legumes were characterized with a greater number of such interrelationships than seeds. However, in the latter group, there were no correlations noted between K, Cu, Co, and Ni and the rest of the analyzed elements. Interestingly, Na correlated negatively with Mn (p < 0.05) in seeds, whereas in the group of legumes Na did not exhibit any correlation to other elements. Moreover, negative interrelationships were observed only for seeds, i.e., between Na and Mn or Cd and Mg. Seeds were also characterized with strong positive correlations (p < 0.001) between Mg and P or Zn-P. In the case of legumes majority of chemical elements exhibited positive correlations, however, the most significant (p < 0.001) were noted for the following pairs of elements, i.e., Mg-Ca and Mg-K. A positive correlation was also observed between Cu and Fe, which is similar to results presented by Ramírez-Ojeda et al. [7]. However, in contrast to Ramírez-Ojeda et al. [7] findings, we did not notice a correlation between Fe and Zn. Cadmium correlated positively with P and Zn in legumes and Ca in seeds while negatively with Mg. However, according to Erdem et al. [31], as well as Murtaza et al. [22] P is known to decrease to phytoavailability of Ca, Cu, Fe, and Zn. Murtaza et al. [22] found that concentrations of metals in legumes decrease with increasing P levels. Nevertheless, N fertilizers usage resulted in a significant increase of metals levels relative to control and other P treatments [22]. Moreover, the chemical similarity of Cd and Zn results in their interaction in soil-plant systems which influence their bioavailability to plants [22,32]. Correlations between P, Mg, K, and Ca in plants, according to Garten [33], seem to be based on biochemical similarities between these elements in cell metabolism.

3.6. Influence of the Product Type (Legumes, Seeds) and Its Botanical Family on Metal Concentrations

A statistically significant result of the Kruskal-Wallis test means that our independent variable affects the dependent variable. In our study, the Kruskal-Wallis test allowed the verification of the influence of the product type (legumes, seeds) and its botanical family (Fabaceae, Papaveraceae, Cucurbitaceae, Asteraceae, Linaceae, Pedaliaceae) on metal concentrations. There were found differences in Mg, Na, K, P, Zn, Cu, Mn, Cr, and Cd content depending on the type of the analyzed product (Table 5). In the case of botanical provenance, such statistical dependence was recorded for most of the analyzed components, except for Fe, Cr, and Co (Table 5).
However, based on the result of the analysis of variance, we were not able to determine exactly which groups differ from each other in view of their botanical affinity. Therefore, a post-hoc analysis using multiple step-down comparisons was performed that enabled us to answer the question of which of the analyzed groups were different. Statistically significant differences (p < 0.05) were noted for the following elements: Ca (Cucurbitaceae vs. Papaveraceae), Mg (Cucurbitaceae vs. Fabaceae), K (Pedaliaceae vs. Fabaceae; Asteraceae vs. Fabaceae), P (Cucurbitaceae vs. Fabaceae), Zn (Cucurbitaceae vs. Fabaceae), Cu (Asteraceae vs. Fabaceae), Ni (Asteraceae vs. Pedaliaceae), Mn (Papaveraceae vs. Fabaceae; Cucurbitaceae vs. Fabaceae), and Cd (Linaceae vs. Fabaceae).

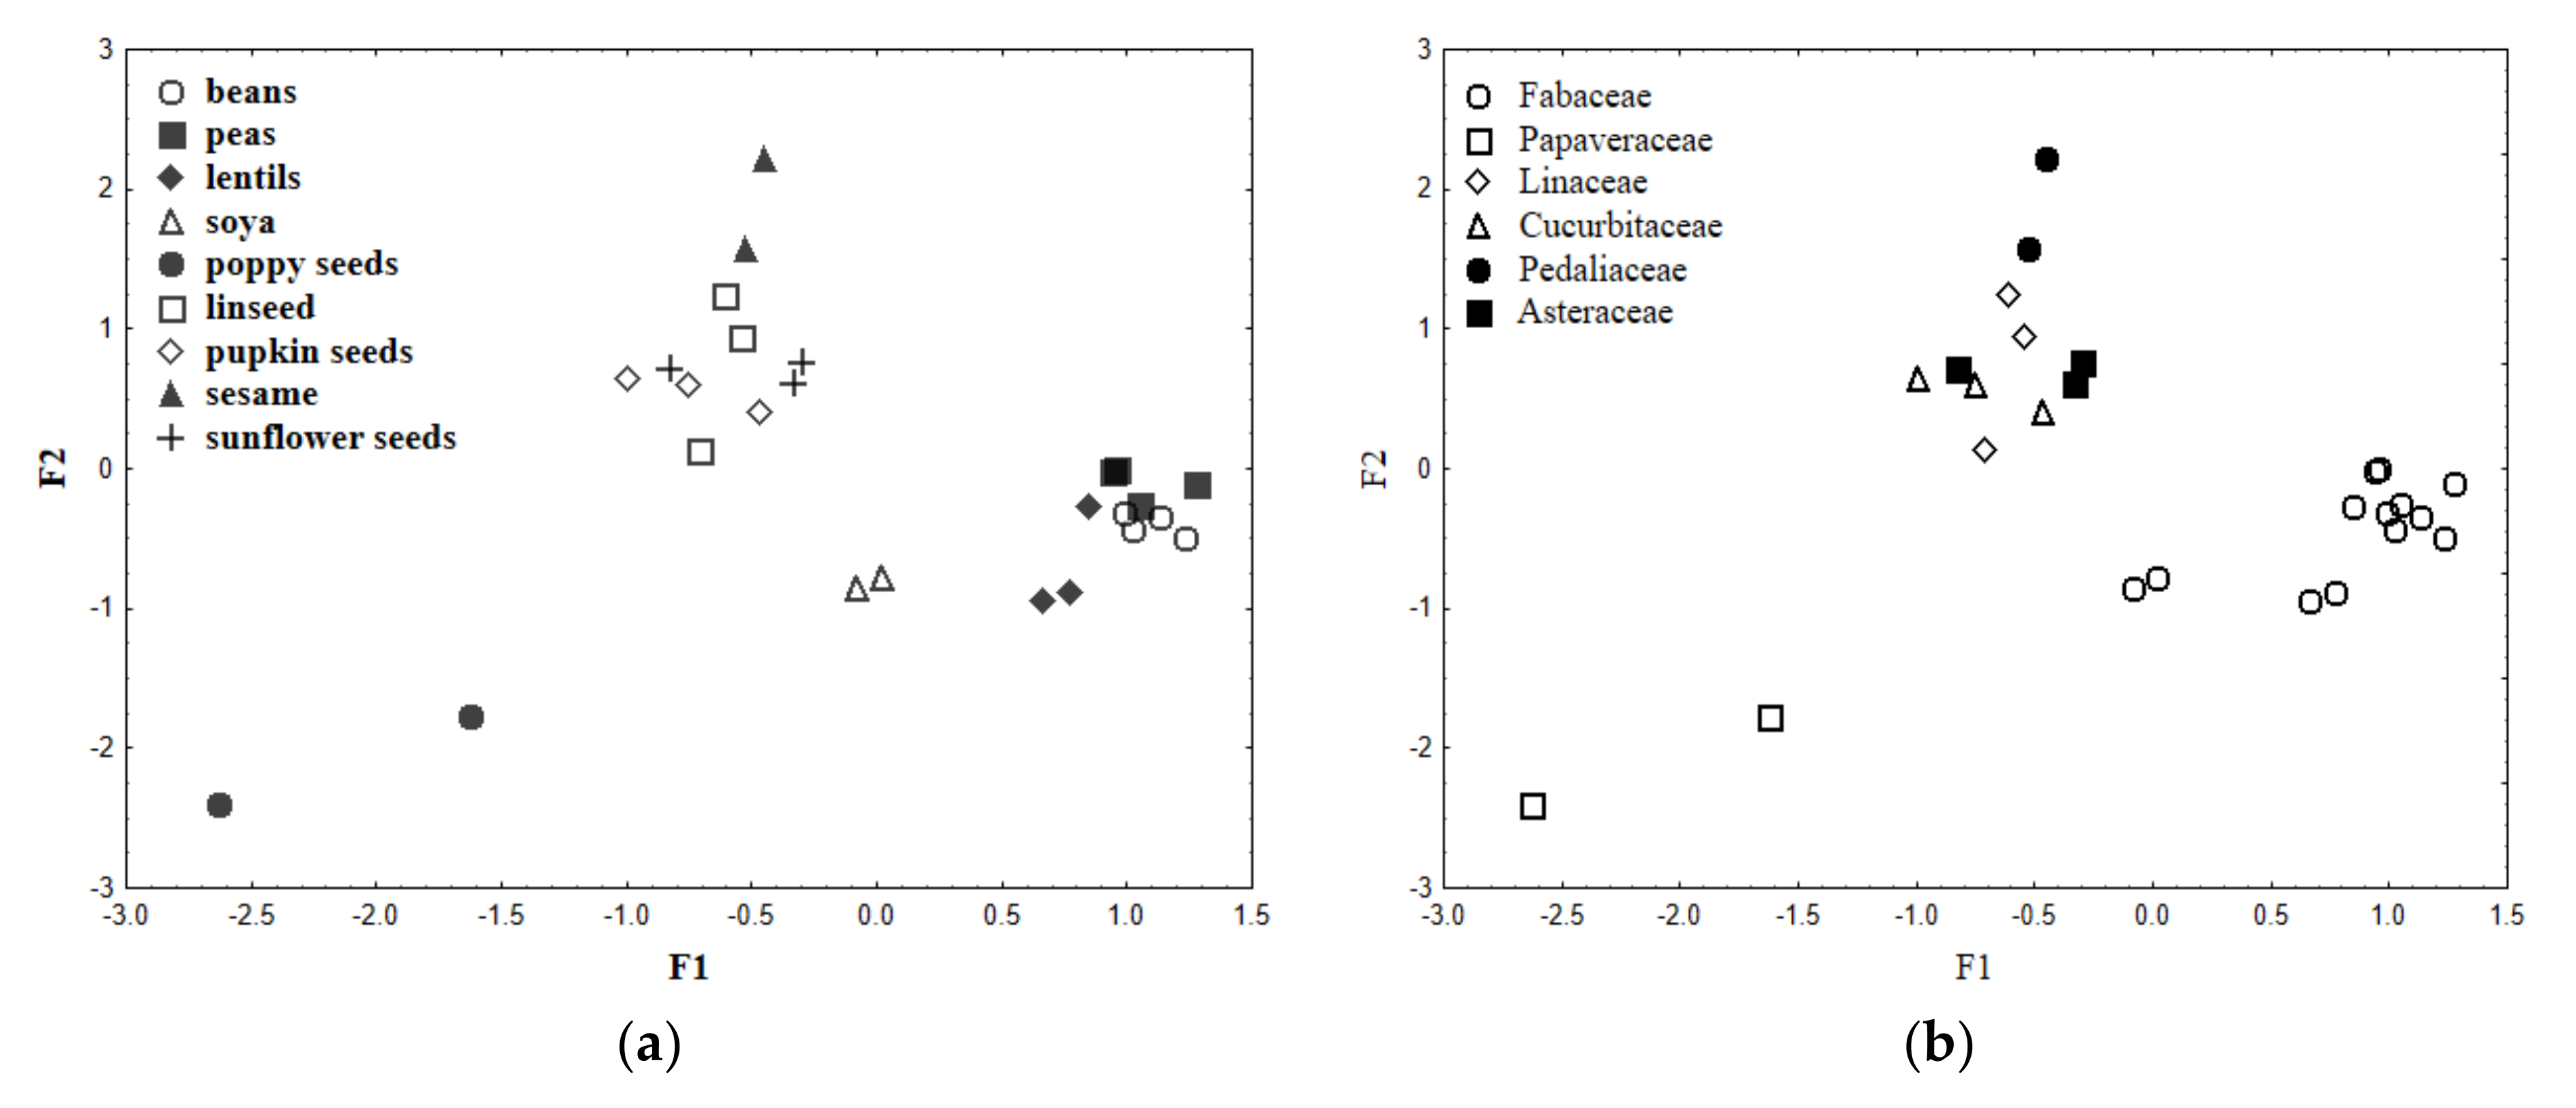
3.7. Discrimination of Legumes and Oleic Seeds Samples Based on Their Type and Botanical Origins

Factor analysis (FA) is a set of statistical methods and procedures that allow cross-examination of the relationships between large numbers of variables and detection of hidden trends. To visualize data structure and discriminate samples in view of their type and botanical provenance, FA was performed on raw data sets of legumes and oilseeds samples, using the elements (Ca, Mg, Na, K, P, Zn, Cu, Fe, Mn, Cr, and Cd) as columns and samples as rows. Nickel and Co were eliminated from the final data matrix based on the results of the Kruskal-Wallis test results. Lead was eliminated from the dataset as its concentration was below the LOQ.
The results of the conducted FA are depicted in Figure 1a–c. Using Kaiser criterion and the Cattell scree test plot there were obtained three factors (F1, F2, F3) that cumulatively explained 76.9% of the total variance, of which 47.6% was explained by F1, 16.5% by F2, and 12.8% by F3. The eigenvalues obtained for each factor were as follows: 5.23 (F1), 1.82 (F2), and 1.40 (F3). Factorial scatterplots for the analyzed samples are depicted in Figure 1a,b, while biplot of loadings drawn for F1–F2 in Figure 1c.
There can be an observed clear diversification of samples in view of both their type (Figure 1a) and botanical origin (Figure 1b). The samples described by higher F1 values belong to pulses (Fabaceae family), while the lower ones to seeds of oil plants. Soybean samples can be found between these two groups (medium F1 values), which may be related to the dual role of this plant. Botanically it belongs to legumes (Fabaceae family), but it is also reckoned as a valuable source of oil. The oleic seeds (Asteraceae, Pedaliaceae, Cucurbitaceae, and Linaceae families) were differentiated by Na, except for poppy seeds described by the highest levels of Mn, Zn, Mg, Ca, P, Cu, Cd, and Fe (Figure 1c). Pulses’ samples were characterized by the highest amounts of K. Such diversification of samples can supposedly be explained by specific usage of nutrients by plants’ systems and elements cycling in ecosystems [34].
Higher values of F2 correspond to samples of oleic plants seeds, except for poppy seeds (Papaveraceae family), which similarly to legumes were described by lower F2 values (Figure 1b). Elements responsible for the classification of legumes (Fabaceae family) and poppy seeds (Papaveraceae family) were Ca, K, Fe, Mn, and Cd, while oleic seeds (Asteraceae, Pedaliaceae, Cucurbitaceae, and Linaceae families) were described by Na, Mg, Zn, Cu, and P.

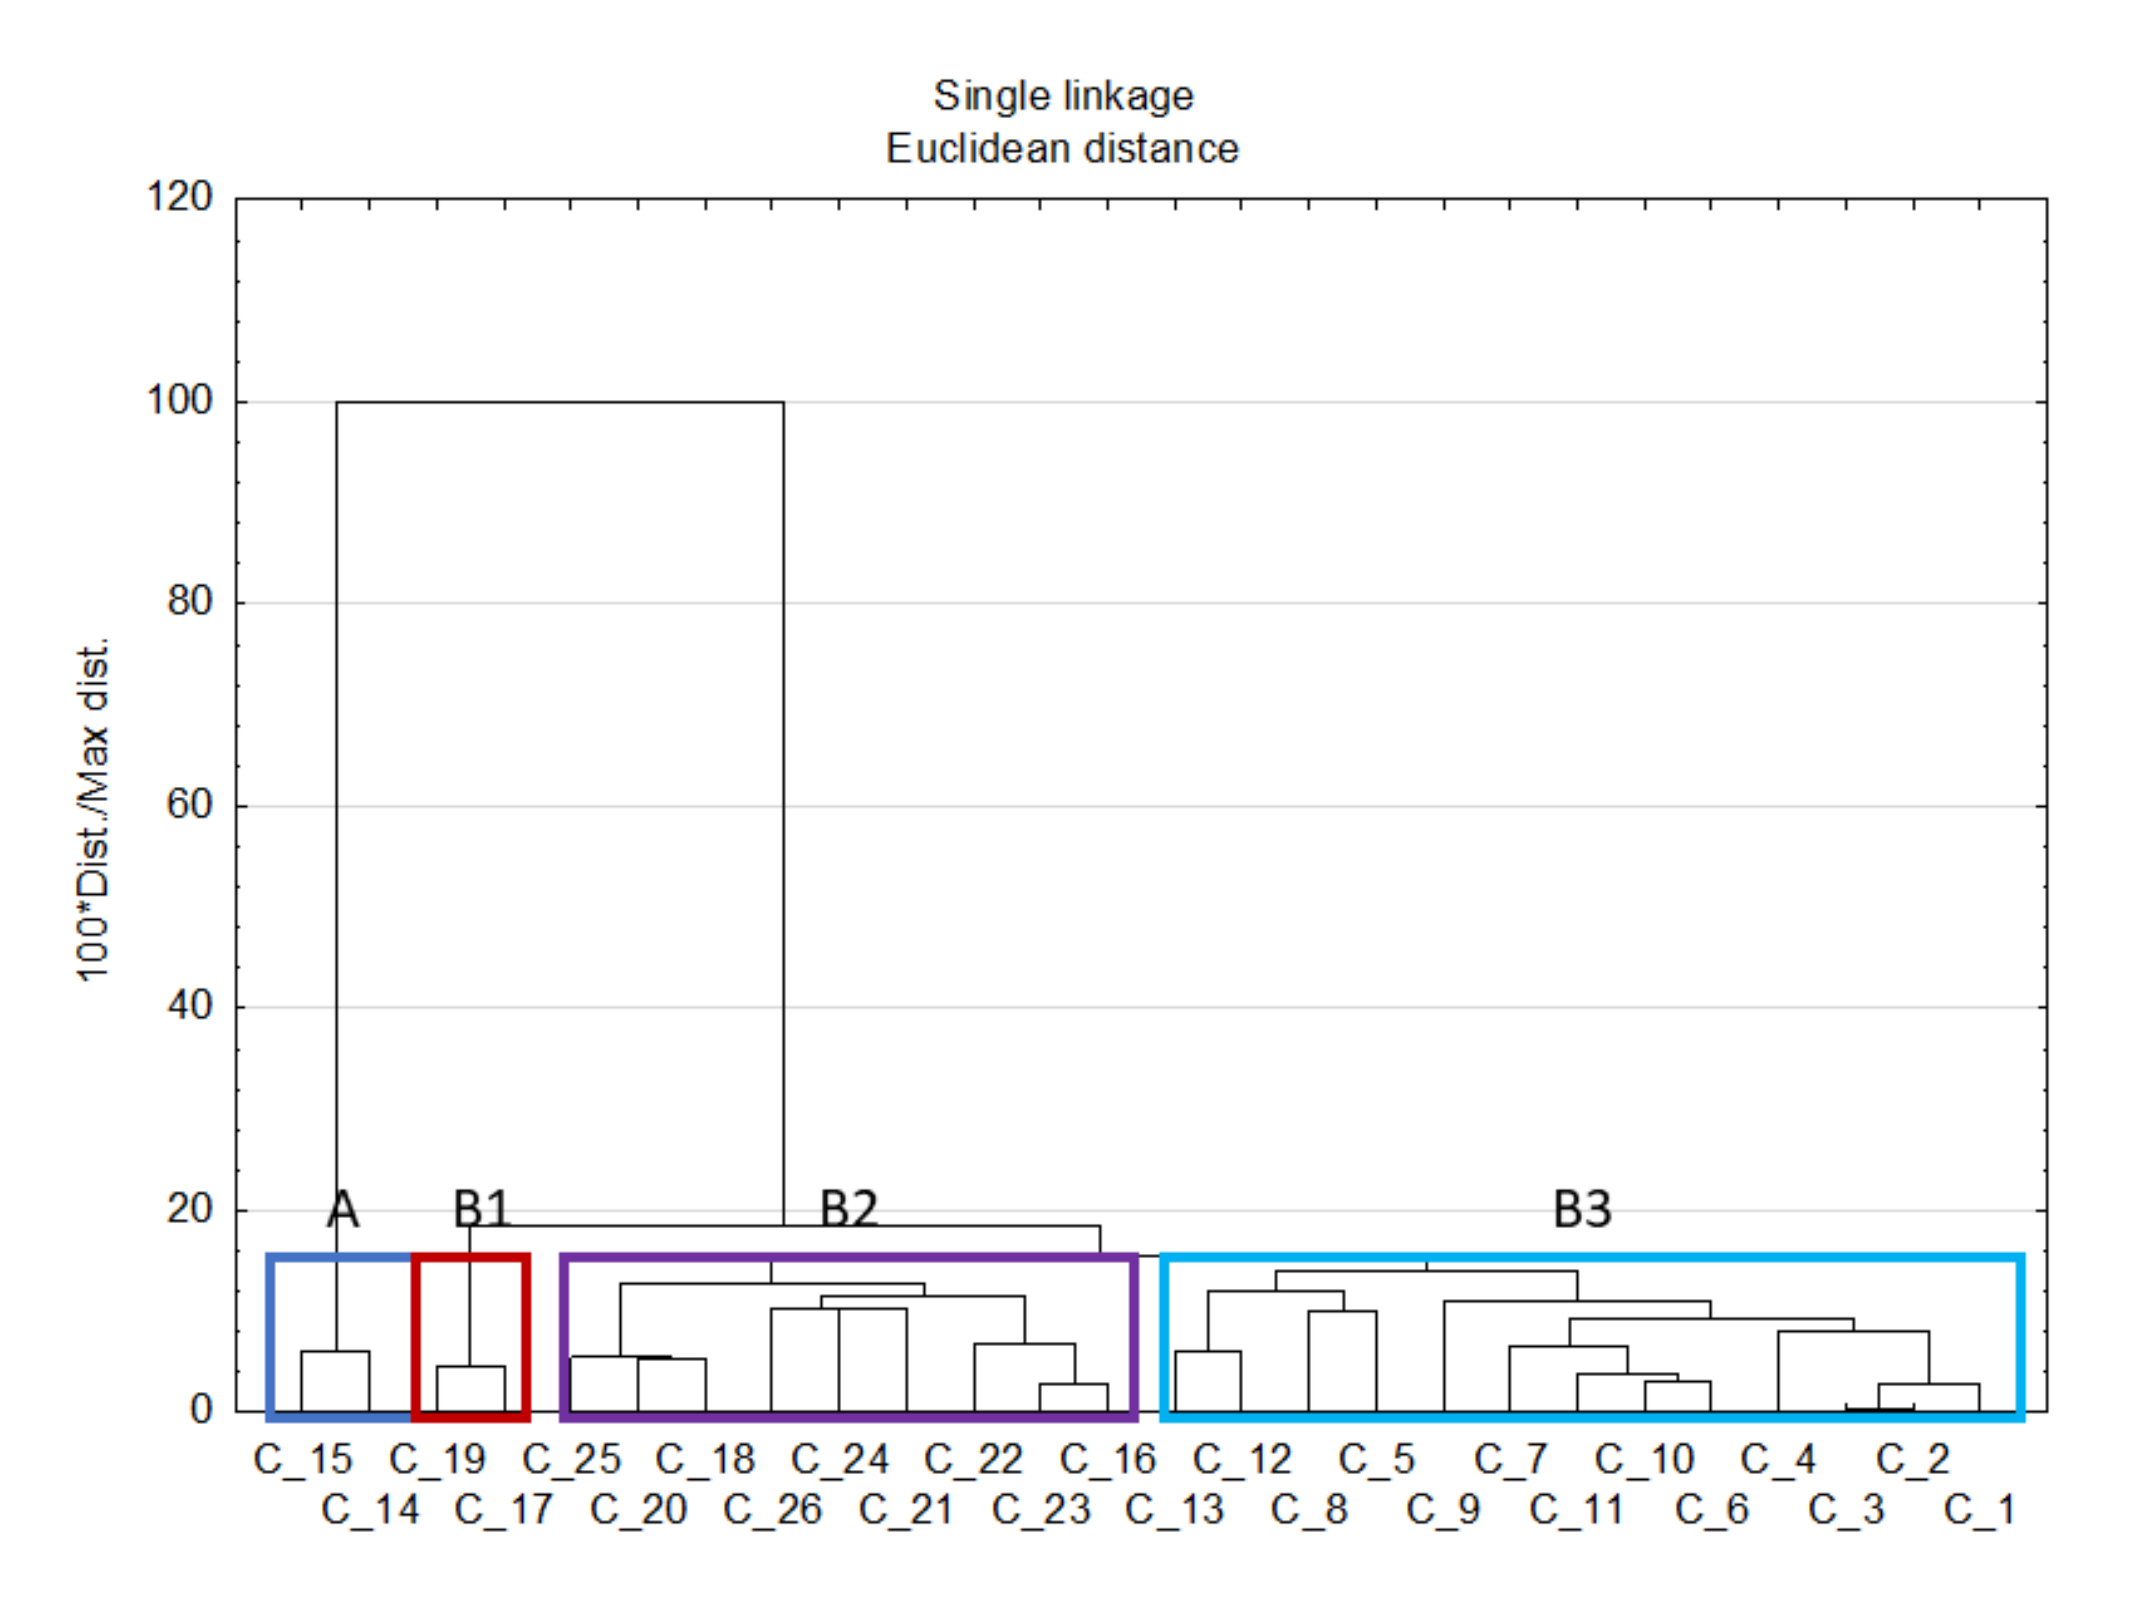
3.8. Cluster Analysis

Cluster analysis (CA) is an explorative analysis, which aims to identify homogenous groups of objects within the data. It can be used to detect structures in data without explaining why they occur. In order to find similarities between samples, there was applied hierarchical clustering using Euclidean distance as a distance measure and a single linkage as an amalgamation rule. The ultimate data matrix was composed of P, K, Cd, Fe, Mn, Ni, Co, Cr, Cu, Zn, Na, Mg, and Ca. There were two main obtained clusters A and B, however, three subclusters can be distinguished in B cluster (Figure 2). Cluster A contains objects representing samples of the Papaveraceae family, i.e., poppy seeds. Cluster B contains the rest of the objects that were divided into three well-separated subclusters, i.e., B1—pumpkin seeds (Cucurbitaceae family), B2—oleic seeds (Asteraceae, Pedaliaceae, Cucurbitaceae, and Linaceae families), and B3—pulses (Fabaceae family). Therefore, it can be concluded that the results of CA generally confirm the outcome of FA. Thus, this technique allowed the differentiation of samples within their type and botanical provenance.
According to our knowledge, there are relevant literature data concerning mineral composition of legumes and seeds in view of chemometric analysis similar to our approach [35,36,37,38,39,40,41,42]. A combination of multi-elemental composition with chemometric processing analysis was a useful approach in a deeper understanding of the distribution of the selected elements and classification of samples with respect to their effective traceability and authenticity.

4. Conclusions

Plant-based diets are becoming increasingly popular around the world. Therefore, there is a need for the constant monitoring of plant foods, which can be contaminated with heavy metals such as Cd or Pb. This study provided data on the fourteen elements’ concentration in legumes and seeds available for consumers not only in Poland but also abroad as the products analyzed were imported from other European countries, Asia, and North America.
Among legumes, soybean was characterized as having the highest concentration of the analyzed elements, i.e., P, Mg, Ca, K, Na, Zn, Cu, Fe, Cr, Co, Ni, Mn, and Cd. In general, oilseeds were characterized with higher concentrations of the analyzed elements. However, the concentration range within each group differed significantly, which can result from varietal differences, as well geographical origin. The most significant differences were observed in the case of Ca, Mg, P, Fe, Mn, Zn, and Cu. It was found that pumpkin seeds were the richest source of P (1489 mg/100 g) and Mg (376 mg/100 g). Among all products, hulled wheat contained the lowest amounts of macrominerals, with the lowest value noted for Na (0.75 mg/100 g). Lead was below the LOD of the method used, but Cd levels exceeded the permissible European standards for these food products. There was also performed an assessment of human exposure to Cd through consumption of these products in view of PTMI, and 100 g of seeds provided at most 3.70% of this permitted dose. However, it is worth noting that a plant-based diet might be characterized by much greater consumption of these products than 100 g monthly. Therefore, we think that all food products, especially legumes and seeds, available on the market should be strictly controlled for Cd contamination, as food safety and quality are the most important public health issues. The applied multivariate techniques, i.e., FA and CA, proved to be efficient tools that can be successfully applied to food quality and authenticity assessment. They allowed the classification of legumes and seeds in view of their type and botanical origin.

Author Contributions

Conceptualization, M.G.; methodology, M.G.; validation, M.G.; formal analysis, M.G.; investigation, M.G.; resources, M.G. and P.S.; writing—original draft preparation, M.G.; writing—review and editing, M.G. and P.S.; writing—final review and approval, M.G. and P.S.; funding acquisition, M.G. and P.S. All authors have read and agreed to the published version of the manuscript.

Funding

The authors gratefully acknowledge the financial support received from grant PB 0676/P052005/28 from the Polish Ministry of Scientific Research and Information Technology.

Institutional Review Board Statement

Not applicable.

Informed Consent Statement

Not applicable.

Data Availability Statement

All data are contained within the article and Appendix A.

Conflicts of Interest

The authors declare no conflict of interest.

Appendix A

Table A1. Characteristics of the analyzed material.
ProductBotanic NameBotanic FamilyOrigin
Legumes
BeansPhaseolus vulgaris L.FabaceaePoland
Mung beanVigna radiataFabaceaeItaly
Australia
Peas huskedPisum L.FabaceaePoland
Peas unhuskedPisum L.FabaceaePoland
Peas greenPisum L.FabaceaePoland
CornZea mays L.PoaceaeHungary
Lentils, redLens culinarisFabaceaeCanada
LentilsLens culinarisFabaceaeCanada
Lentils, greenLens culinarisFabaceaeCanada
SoybeanGlycine maxFabaceaeCanada
Seeds
Poppy seedsPapaver rhoeasPapaveraceaeCzech Republic
Linseed roastedLinum usitatissimumLinaceaePoland
Pumpkin seedsCucurbita L.CucurbitaceaeHungary
Belgium
Wheat hulledTriticum L.PoaceaePoland
LinseedLinum usitatissimumLinaceaePoland
Czech Republic
Sesame seedsSesamum L.PedaliaceaeIndia
Sunflower seedsHelianthus annuusAsteraceaeChina
Hungary
Table A2. Experimental conditions for elements determination by FAAS.
ElementWavelength (nm)Burner Width (cm)Slit (nm)Lamp Current (mA)Deuterium-Background Correction
Mn279.5100.54+
Fe248.350.26+
Cu324.850.53
Zn213.950.55+
Cr357.9100.55
Ni232.0100.25+
Co240.7100.26+
Mg285.250.54+
Ca422.750.55
Na589.050.26
K766.5100.55
Pb217100.56+
Cd228.8100.54+

References

  1. Calles, T. The International Year of Pulses: What Are They and Why Are They Important? Available online: https://www.fao.org/3/bl797e/bl797e.pdf (accessed on 16 December 2021).
  2. Asif, M.; Rooney, L.W.; Ali, R.; Riaz, M.N. Application and opportunities of pulses in food system: A review. Crit. Rev. Food Sci. Nutr. 2013, 53, 1168–1179. [Google Scholar] [CrossRef] [PubMed]
  3. Kumar, S.; Pandey, G. Biofortification of pulses and legumes to enhance nutrition. Heliyon 2020, 6, e03682. [Google Scholar] [CrossRef] [PubMed]
  4. Karolkowski, A.; Guichard, E.; Briand, L.; Salles, C. Volatile Compounds in Pulses: A Review. Foods 2021, 10, 3140. [Google Scholar] [CrossRef] [PubMed]
  5. Shevkani, K.; Singh, N.; Chen, Y.; Kaur, A.; Yu, L. Pulse Proteins: Secondary Structure, Functionality and Applications. J. Food Sci. Technol. 2019, 56, 2787–2798. [Google Scholar] [CrossRef]
  6. Pedrosa, M.M.; Guillamón, E.; Arribas, C. Autoclaved and Extruded Legumes as a Source of Bioactive Phytochemicals: A Review. Foods 2021, 10, 379. [Google Scholar] [CrossRef]
  7. Ramírez-Ojeda, A.M.; Moreno-Rojas, R.; Cámara-Martos, F. Mineral and trace element content in legumes (lentils, chickpeas and beans): Bioaccesibility and probabilistic assessment of the dietary intake. J. Food Compos. Anal. 2018, 73, 17–28. [Google Scholar] [CrossRef]
  8. Anjum, N.A.; Singh, H.P.; Khan, M.I.R.; Masood, A.; Per, T.S.; Negi, A.; Batish, D.R.; Khan, N.A.; Duarte, A.C.; Pereira, E.; et al. Too much is bad—An appraisal of phytotoxicity of elevated plant-beneficial heavy metal ions. Environ. Sci. Pollut. Res. 2015, 22, 3361–3382. [Google Scholar] [CrossRef]
  9. European Food Safety Authority (EFSA). Cadmium in food—Scientific opinion of the Panel on Contaminants in the Food Chain. EFSA J. 2009, 7, 980. [Google Scholar] [CrossRef]
  10. European Food Safety Authority (EFSA). Scientific Opinion on Lead in Food. EFSA J. 2010, 8, 1570. [Google Scholar] [CrossRef]
  11. World Health Organization. Evaluation of Certain Contaminants in Food; World Health Organization: Geneva, Switzerland, 2011. [Google Scholar]
  12. Grembecka, M.; Szefer, P. Comparative assessment of essential and heavy metals in fruits from different geographical origins. Environ. Monit. Assess. 2013, 185, 9139–9160. [Google Scholar] [CrossRef] [Green Version]
  13. IUPAC Gold Book. Limit of Detection. Available online: https://goldbook.iupac.org/terms/view/L03540 (accessed on 10 December 2021).
  14. Jarosz, M.; Rychlik, E.; Stoś, K.; Charzewska, J. Normy Żywienia Dla Populacji Polski i Ich Zastosowanie; Narodowy Instytut Zdrowia Publicznego–Państwowy Zakład Higieny: Warszawa, Poland, 2020; ISBN 9788365870285. [Google Scholar]
  15. Commission of the European Communities. Commission Regulation (EC) No. 1181/2006 of 19 December 2006 setting maximum levels for certain contaminants in foodstuffs. Off. J. Eur. Union 2006, 364, 5–24. [Google Scholar]
  16. Commission of the European Communities. Commission Regulation (EC) No. 629/2008 of 2 July 2008 amending Regulation (EC) No. 1881/2006 setting maximum levels for certain contaminants in foodstuffs. Off. J. Eur. Union 2008, 173, 6–9. [Google Scholar]
  17. Souci, S.W.; Fachmann, W.; Kraut, H. Food Composition and Nutrition Tables; Scientific Publishers: Stuttgart, Germany, 2002. [Google Scholar]
  18. Cabrera, C.; Lloris, F.; Giménez, R.; Olalla, M.; López, M.C. Mineral content in legumes and nuts: Contribution to the Spanish dietary intake. Sci. Total Environ. 2003, 308, 1–14. [Google Scholar] [CrossRef]
  19. Eberl, E.; Li, A.S.; Zheng, Z.Y.J.; Cunningham, J.; Rangan, A. Temporal Change in Iron Content of Vegetables and Legumes in Australia: A Scoping Review. Foods 2022, 11, 56. [Google Scholar] [CrossRef] [PubMed]
  20. Özcan, M.M.; Dursunm, N.; Juhaimi, F.A. Macro- and microelement contents of some legume seeds. Environ. Monit. Assess. 2013, 185, 9295–9298. [Google Scholar] [CrossRef] [PubMed]
  21. Marschner, H. Mineral Nutrition in Higher Plants, 2nd ed.; Academic: London, UK, 1995. [Google Scholar]
  22. Zhao, H.; Wu, L.; Chai, T.; Zhang, Y.; Tan, J.; Ma, S. The effects of copper, manganese and zinc on plant growth and elemental accumulation in the manganese-hyperaccumulator Phytolacca americana. J. Plant Physiol. 2012, 169, 1243–1252. [Google Scholar] [CrossRef] [PubMed]
  23. Murtaza, G.; Javed, W.; Hussain, A.; Wahid, A.; Murtaza, B.; Owens, G. Metal uptake via phosphate fertilizer and city sewage in cereal and legume crops in Pakistan. Environ. Sci. Pollut. Res. 2015, 22, 9136–9147. [Google Scholar] [CrossRef]
  24. Grant, C.A. Influence of phosphate fertilizer on cadmium in agricultural soils and crops. Agric. Agri. Food Canada 2011, 54, 143–155. [Google Scholar]
  25. Sekara, A.; Poniedziałek, M.; Ciura, J.; Jedrszczyk, E. Cadmium and lead accumulation and distribution in the organs of nine crops: Implications for phytoremediation. Polish J. Environ. Stud. 2005, 14, 509–516. [Google Scholar]
  26. Roy, S. Cadmium Accumulation in Crops and the Increasing Risk of Dietary Cadmium Exposure. In Cadmium Tolerance in Plants: Agronomic, Molecular, Signaling, and Omic Approaches; Hasanuzzaman, M., Narasimha, M., Prasad, V., Nahar, K., Eds.; Elsevier: Amsterdam, The Netherlands, 2019; pp. 247–254. [Google Scholar] [CrossRef]
  27. Sandberg, A.-S. Bioavailability of minerals in legumes. Br. J. Nutr. 2002, 88, S281–S285. [Google Scholar] [CrossRef] [Green Version]
  28. Mohan, V.R.; Tresina, P.S.; Daffodil, V.O. Antinutritional factors in legume seeds: Characteristics and determination. In Encyclopedia of Food and Health; Caballero, B., Finglas, P.M., Toldrá, F., Eds.; Elsevier: Amsterdam, The Netherlands, 2016; pp. 211–220. [Google Scholar]
  29. Thavarajah, P.; Gupta, D.S. Pulses biofortification in genomic era; multidisciplinary opportunities and challenges. In Legumes in the Omic Era; Springer: New York, NY, USA, 2014; pp. 207–220. [Google Scholar]
  30. Commission Regulation (EU) No. 488/2014 of 12 May 2014 Amending Regulation (EC) No. 1881/2006 as Regards Maximum Levels of Cadmium in Foodstuffs. Available online: https://eur-lex.europa.eu/legal-content/EN/TXT/?uri=celex:32014R0488 (accessed on 1 December 2021).
  31. Erdem, H.; Tosun, Y.K.; Ozturk, M. Effect of cadmium-zinc interactions on growth and Cd-Zn concentration in durum and bread wheats. Fresenius Environ. Bull. 2012, 21, 1046–1051. [Google Scholar]
  32. Dar, S.; Thomas, T.; Dagar, J.; Mir, H.; Amin, A.; Shankar, V.; Singh, D.; Pundir, A.; Malik, R.; Grover, G.P. Yield potential, nutrient uptake, metal fractionation and effect on soil properties under integrative use of varied C:N ratio composts, fly ash and inorganic fertilizer nitrogen in rice grown on inceptisol. J. Agric. Sci. 2012, 4, 206–214. [Google Scholar] [CrossRef] [Green Version]
  33. Garten, C. Correlations between concentrations of elements in plants. Nature 1976, 261, 686–688. [Google Scholar] [CrossRef]
  34. Liu, C.; Liu, Y.; Guo, K.; Wang, S.; Yang, Y. Concentrations and resorption patterns of 13 nutrients in different plant functional types in the karst region of south-western China. Ann. Bot. 2014, 113, 873–885. [Google Scholar] [CrossRef] [PubMed]
  35. Gundersen, V.; Bechmann, I.E.; Behrens, A.; Stürup, S. Comparative investigation of concentrations of major and trace elements in organic and conventional Danish agricultural crops. 1. Onions (Allium cepa Hysam) and peas (Pisum sativum Ping Pong). J. Agric. Food Chem. 2000, 48, 6094–6102. [Google Scholar] [CrossRef] [PubMed]
  36. Bibak, A.; Behrens, A.; Stürup, S.; Knudsen, L.; Gundersen, V. Concentrations of 55 major and trace elements in Danish agricultural crops measured by Inductively Coupled Plasma Mass Spectrometry. 2. Pea (Pisum sativum Ping Pong). J. Agric. Food Chem. 1998, 46, 3146–3149. [Google Scholar] [CrossRef]
  37. Santos, W.P.C.; Castro, J.T.; Bezerra, M.A.; Korn, M.G.A. Application of multivariate optimization in the development of an ultrasound-assisted extraction procedure for multielemental determination in bean seeds samples using ICP OES. Microchem. J. 2009, 91, 153–158. [Google Scholar] [CrossRef]
  38. Moyib, O.K.; Alashiri, G.O.; Adejoye, O.D. Chemometric dissimilarity in nutritive value of popularly consumed Nigerian brown and white common beans. Food Chem. 2015, 166, 576–584. [Google Scholar] [CrossRef]
  39. Laursen, K.H.; Schjoerring, J.K.; Olesen, J.E.; Askegaard, M.; Helekoh, U.; Husted, S. Multielemental fingerprinting as a tool for authentication of organic barley, faba bean, and potato. J. Agric. Food Chem. 2011, 59, 4385–4396. [Google Scholar] [CrossRef]
  40. Singh, J.; Kumar, R.; Awasthi, S.; Singh, V.; Rai, A.K. Laser Induced Breakdown Spectroscopy: A rapid tool for the identification and quantification of minerals in cucurbit seeds. Food Chem. 2017, 221, 1778–1783. [Google Scholar] [CrossRef]
  41. Bolaños, D.; Marchevsky, E.J.; Camiña, J.M. Elemental analysis of amaranth, chia, sesame, linen, and quinoa seeds by ICP-OES: Assessment of classification by chemometrics. Food Anal. Meth. 2016, 9, 477–484. [Google Scholar] [CrossRef]
  42. Kafaoğlu, B.; Fisher, A.; Hill, S.; Kara, D. Chemometric evaluation of trace metal concentrations in some nuts and seeds. Food Additiv. Contam. Part A 2014, 31, 1529–1538. [Google Scholar] [CrossRef] [PubMed]
Figure 1. Scatterplot of object scores of the two discriminant functions of legumes and oilseeds classified according to their type (a) and botanical family (b); scatterplot of loadings for 11 elements in legumes and seeds (c).
Applsci 12 01577 g001aApplsci 12 01577 g001b
Figure 2. Hierarchical dendrogram for legumes and oleic seeds samples based on 13 elements including P, K, Cd, Fe, Mn, Ni, Co, Cr, Cu, Zn, Na, Mg, and Ca.
Applsci 12 01577 g002
Table 1. The results of the analysis of three certified reference materials, i.e., Tea NCS DC 73351 1, Cabbage IAEA–359 2, and Spinach IAEA-331 3.
ElementDeclared Value
(μg/g)
Obtained Value
(μg/g)
Recovery (%)RSD (%)
P 128402900 ± 1211024.26
P 251805340 ± 94.8103 1.83
K 116,600 ± 120014,780 ± 75089.04.51
K 232,50027,940 ± 93286.02.87
Na 144 ± 639.8 ± 0.1690.50.36
Na 2i580522 ± 2390.03.97
Mg 11700 ± 2001740 ± 81.91024.82
Mg 221602110 ± 35.697.71.65
Ca 14300 ± 4003820 ± 3788.80.86
Ca 2i18,50017,450 ± 7894.30.42
Zn 126.3 ± 2.024.2 ± 0.492.01.52
Zn 238.635.3 ± 1.7891.44.61
Fe 1264 ± 15239 ± 4.9690.51.88
Fe 2148137 ± 7.992.65.34
Cu 117.3 ± 1.816.7 ± 0.8295.54.74
Cu 25.675.45 ± 0.1496.12.47
Mn 11240 ± 701150 ± 54.092.74.35
Mn 231.928.7 ± 0.2890.00.88
Cr 10.80 ± 0.030.76 ± 0.0495.05.00
Cr 21.31.17 ± 0.0590.03.85
Co 30.390.38 ± 0.0297.45.13
Ni 14.6 ± 0.54.12 ± 0.0889.61.74
Ni 21.050.95 ± 0.0590.54.76
Pb 14.4 + 0.33.92 ± 0.1589.13.41
Cd 20.120.11 ± 0.00491.73.33
i—informative value.
Table 2. Macro-, microelements, and toxic metals content ( x ¯ ± SD, range) in legumes and seeds in mg/100 g w.w. (* μg/100 g w.w.).
ProductnCaMgNaKPZnCuFeMnCrNiCoPb *Cd *
Legumes
Beans6152 ± 6.36166 ± 29.01.36 ± 0.98891 ± 91.2544 ± 32.52.48 ± 0.170.48 ± 0.173.73 ± 1.121.51 ± 0.080.02 ± 0.010.17 ± 0.020.02 ± 0.01NDND
Phaseolus vulgaris L.141–168134–2020.62–2.16760–1014485–5861.97–2.950.34–0.602.84–4.611.43–1.600.01–0.020.15–0.200.01–0.01
Mung bean6131 ± 3.54163 ± 4.951.08 ± 0.75828 ± 1.41480 ± 0.711.92 ± 0.060.75 ± 0.103.84 ± 0.151.28 ± 0.030.03 ± 0.010.1 ± 0.000.02 ± 0.01NDND
Vigna radiata126–144156–1760.52–1.77787–879446–5091.84–2.010.67–0.833.64–4.031.24–1.350.02–0.030.10–0.100.01–0.02
Peas husked660.5 ± 1.34118 ± 17.03.06 ± 2.88784 ± 126734 ± 2692.70 ± 0.440.61 ± 0.233.38 ± 0.110.91 ± 0.000.01 ± 0.000.11 ± 0.020.02 ± 0.01NDND
Pisum L.55.3–67.598.2–1301.00–5.23659–935538–10222.34–3.080.42–0.793.33–3.520.89–0.930.01–0.010.09–0.120.01–0.02
Peas unhusked3124 ± 10.5130 ± 10.12.04 ± 0.03583 ± 32.4628 ± 74.12.92 ± 0.070.50 ± 0.004.67 ± 0.140.84 ± 0.050.02 ± 0.0010.11 ± 0.0020.01 ± 0.00NDND
Pisum L.117–136123–1422.02–2.07561–606567–7112.86–2.990.50–0.504.54–4.820.79–0.900.02–0.020.11–0.110.01–0.01
Peas green351.9 ± 0.94107 ± 10.81.16 ± 0.09794 ± 26.4766 ± 52.53.66 ± 0.180.41 ± 0.013.66 ± 0.121.33 ± 0.030.01 ± 0.0020.08 ± 0.0040.01 ± 0.00NDND
Pisum L.51.2–52.5100–1201.07–1.25774–824724–8253.52–3.860.40–0.423.56–3.801.29–1.360.01–0.010.07–0.080.01–0.01
Corn36.20 ± 0.17113 ± 1.471.17 ± 0.10172 ± 9.45367 ± 30.52.32 ± 0.050.15 ± 0.011.99 ± 0.131.00 ± 0.010.01 ± 0.0010.02 ± 0.0000.01 ± 0.00NDND
Zea mays L.6.06–6.29112–1141.07–1.28165–178345–3882.27–2.380.14–0.161.88–2.130.99–1.010.01–0.010.02–0.020.01–0.01
Lentils, red339.0 ± 1.6666.1 ± 2.601.55 ± 0.02513 ± 27.1411 ± 19.83.32 ± 0.080.87 ± 0.016.94 ± 0.251.41 ± 0.020.01 ± 0.0010.13 ± 0.0020.02 ± 0.00NDND
Lens culinaris37.9–40.264.3–68.01.54–1.56494–533397–4253.27–3.410.85–0.886.73–7.211.40–1.430.01–0.010.13–0.130.02–0.02
Lentils 693.8 ± 1.3298.5 ± 3.230.95 ± 0.06652 ± 23.1546 ± 4.862.78 ± 0.010.65 ± 0.0110.5 ± 0.511.32 ± 0.010.02 ± 0.0010.19 ± 0.0000.02 ± 0.00NDND
Lens culinaris92.8–95.395.3–1020.91–0.99631–677540–5492.77–2.790.64–0.6610.1–11.11.31–1.330.02–0.020.19–0.190.02–0.02
Lentils, green372.9 ± 4.0297.1 ± 0.880.91 ± 0.01689 ± 10.8478 ± 7.232.70 ± 0.060.70 ± 0.0110.1 ± 0.181.18 ± 0.010.05 ± 0.0030.11 ± 0.0020.02 ± 0.00NDND
Lens culinaris69.8–77.596.5–97.80.90–0.92679–701473–4862.65–2.760.69–0.719.86–10.21.17–1.190.05–0.050.11–0.120.02–0.02
Soybean6244 ± 24.7221 ± 5.660.88 ± 0.44975 ± 4.95955 ± 69.34.61 ± 0.351.28 ± 0.038.34 ± 0.152.21 ± 0.170.04 ± 0.020.51 ± 0.230.02 ± 0.00ND8.93 ± 5.33
Glycine max223–283209–2400.55–1.20902–1041861–10944.35–5.111.25–1.347.85–8.992.07–2.380.02–0.060.34–0.670.02–0.024.50–12.7
Seeds
Poppy seeds62003 ± 56.7315 ± 13.42.09 ± 0.21566 ± 12.71251 ± 36.87.02 ± 2.151.39 ± 0.1312.2 ± 1.347.19 ± 1.830.06 ± 0.010.06 ± 0.070.02 ± 0.01ND39.2 ± 31.8
Papaver rhoeas1937–2046300–3381.89–2.35549–5871096–13385.43–8.601.28–1.6010.6–13.25.72–8.490.04–0.060.01–0.110.01–0.0216.4–62
Linseed roasted3250 ± 30.6303 ± 12.115.0 ± 0.65641 ± 54.8863 ± 73.65.79 ± 0.040.95 ± 0.025.15 ± 0.113.50 ± 0.010.03 ± 0.0000.09 ± 0.0020.02 ± 0.00ND64.8 ± 0.98
Linum usitatissimum228–272295–31214.5–15.4578–676779–9195.75–5.820.93–0.975.05–5.263.49–3.520.03–0.030.08–0.090.02–0.0263.8–65.7
Pumpkin seeds960.3 ± 2.38376 ± 26.35.11 ± 4.09571 ± 37.71489 ± 2106.99 ± 1.480.89 ± 0.197.33 ± 1.413.68 ± 0.350.03 ± 0.010.11 ± 0.030.01 ± 0.00NDND
Cucurbita L.54.3–64.9340–4050.35–7.54505–6351208–17095.28–8.330.67–1.115.59–8.653.32–4.100.02–0.040.07–0.140.01–0.01
Wheat hulled338.4 ± 3.2888.9 ± 7.290.75 ± 0.04270 ± 18.8479 ± 29.73.04 ± 0.080.29 ± 0.022.05 ± 0.044.43 ± 0.120.01 ± 0.0010.07 ± 0.0020.01 ± 0.00ND11.6 ± 0.51
Triticum L.35.7–42.181.5–96.10.72–0.77252–289445–5022.96–3.120.26–0.302.01–2.084.31–4.560.01–0.010.07–0.080.01–0.0111.0–12.0
Linseed6250 ± 13.4312 ± 9.9039.0 ± 3.54592 ± 52.3837 ± 63.64.18 ± 0.391.07 ± 0.135.40 ± 0.432.15 ± 0.160.07 ± 0.010.11 ± 0.010.02 ± 0.00ND28.9 ± 2.33
Linum usitatissimum232–274293–32435.1–45.5517–640758–8973.79–4.490.96–1.195.03–5.822.01–2.280.06–0.090.09–0.130.02–0.0226.5–31.0
Sesame seeds9115 ± 21.5334 ± 11.333.4 ± 15.4378 ± 96.91136 ± 1235.25 ± 0.281.32 ± 0.085.58 ± 0.341.55 ± 0.040.03 ± 0.010.06 ± 0.010.02 ± 0.01NDND
Sesamum L.99.4–141301–36120.6–48.3285–476983–14064.95–5.561.21–1.505.23–5.931.51–1.620.02–0.030.05–0.070.01–0.04
Sunflower seeds9113 ± 28.2294 ± 30.01.28 ± 1.07481 ± 63.81016 ± 2065.89 ± 1.281.51 ± 0.044.53 ± 0.882.57 ± 0.640.02 ± 0.010.47 ± 0.330.01 ± 0.00ND19.7 ± 13.4
Helianthus annuus92.7–148256–3440.57–2.62409–617804–13255.00–7.381.45–1.563.48–5.322.18–3.360.01–0.030.28–0.860.01–0.016.74–34.4
ND—not detected, Pb LOQ = 30 μg/100 g, Cd LOQ = 9 μg/100 g, n—number of samples.
Table 3. Results of the realization of dietary recommendations (%) for the selected elements by a 100 g portion of legumes and seeds.
ProductCaMgNaKPZnCuFeMn
1000 mg/day420 mg/day1500 mg/day3500 mg/day700 mg/day11 mg/day0.9 mg/day10 mg/day2.3 mg/day
Legumes
Beans15.239.40.125.477.722.553.337.365.4
Mung bean13.138.70.123.768.517.483.338.455.7
Peas husked6.028.10.222.4104.824.667.833.839.6
Peas unhusked12.431.00.116.789.726.555.646.736.5
Peas green5.225.50.122.7109.433.345.636.657.8
Corn0.626.90.14.952.421.116.719.943.5
Lentils, red3.915.70.114.758.730.296.769.461.3
Lentils9.423.50.118.678.025.372.2105.057.4
Lentils, green7.323.10.119.768.324.577.8101.051.3
Soybean24.452.60.127.8136.441.9142.283.496.1
Seeds
Poppy seeds200.374.90.116.2178.763.8154.4121.5312.4
Linseed25.074.32.616.9119.638.0118.354.093.3
Pumpkin seeds6.089.60.316.3212.863.699.373.3160.0
Wheat hulled3.821.20.17.768.427.632.220.5192.6
Sesame seeds11.579.52.210.8162.347.7146.755.867.4
Linseed roasted25.072.11.018.3123.352.6105.651.5152.2
Sunflower seeds11.369.90.113.7145.153.6167.445.3111.7
Table 4. Significant correlations between content of elements in legumes and oilseeds.
ElementLegumesOilseeds
Mg(+)Ca c, (+)K c(+)P c, (+)Fe a, (−)Cd a
Ca(+)Mg c, (+)K b, (+)Mn a, (+)Cr b, (+)Ni b(+)Cr b, (+)Cd a
Na-(−)Mn a
K(+)Mg c, (+)Ca b, (+)P b-
P(+)K b, (+)Zn a, (+)Cd b(+)Mg c, (+)Zn c, (+)Fe b
Zn(+)P a, (+)Cd b(+)P c
Cu(+)Fe a, (+)Co b, (+)Cr a, (+)Ni a-
Fe(+)Cu a, (+)Cr a, (+)Ni a, (+)Co a(+)Mg a, (+)P b
Mn(+)Ca a, (+)Ni b(−)Na a
Cr(+)Ca b, (+)Cu a, (+)Fe a(+)Ca b
Co(+)Cu b, (+)Ni b, (+)Fe a-
Ni(+)Ca b, (+)Cu a, (+)Fe a, (+)Mn b, (+)Co b-
Cd(+)P b, (+)Zn b(+)Ca a, (−)Mg a
(+) positive correlation between particular elements in each group; (−) negative correlation between particular elements in each group; a p < 0.05; b p < 0.01; c p < 0.001.
Table 5. The results of the ANOVA Kruskal-Wallis test of legumes and oleic seeds’ elemental composition (results are expressed as H value).
MgCaNaKPZnCuFeMnCrCoNiCd
Type18.8 c1.225.44 a13.8 c13.4 c17.5 c11.6 c1.9914.6 c6.44 a0.010.9013.8 c
Botanical family21.2 c13.0 a13.2 a17.0 b17.8 b19.2 b16.6 b8.5018.5 b11.15.4912.0 a17.9 b
ap < 0.05; b p < 0.01; c p < 0.001.
Publisher’s Note: MDPI stays neutral with regard to jurisdictional claims in published maps and institutional affiliations.

