Abstract
This paper investigates the dynamic response of a fully nonlinear model of a DeepCWind floating offshore wind turbine (FOWT) after one of its three-catenary mooring systems is broken. The drift area of the platform, pitch motion of the wind turbine, and tension on the two ends of the mooring line are the main dynamic response foci; in addition, a single mathematical formula is provided in this study to predict the maximum drift in surge direction. After the platform reaches the new equilibrium position maintained by the remaining two mooring lines, the tower pitch exceeds 20 degrees. The tension change is closely related to the drift motion, necessitating an increase in the minimum breaking load (MBL) of the mooring line components. The mathematical forecast of the maximum surge shows good agreement with the numerical results, even with different water depths
1. Introduction
Floating offshore wind turbines (FOWT) have recently shown great potential due to the considerable wind resources and more flexible installation sites they provide compared to onshore wind turbines [1]. As a result, FOWT capacity has obtained significant progress in the last decade [2,3]. According to Offshore Wind Market Report: 2021 Edition ii, in 2020 alone the global floating offshore wind capacity grew by more than three times, from 7663 MW (2019) to 26,529 MW [4]. This higher wind energy density brings with it new challenges for the offshore wind industry, particularly the mooring system [2,3]. One of the main challenges with mooring systems is their high rate of failure, as experienced in the oil and gas industry with 296 mooring system accidents in a roughly 40-year period [5], and an annual probability of failure during 2001–2011 estimated at 3.0 × 10⁻³ [6]. Similar challenges exist with respect to FOWT, and further comprehensive studies based on specific FOWT properties are required [2].
The floating wind industry currently applies three conventional mooring configurations from the oil and gas industry: catenary mooring systems, tension-leg mooring systems, and semi-taut mooring systems, shown in Figure 1 [7,8]. A catenary mooring system mainly houses steel chains, and hangs freely between the floating structure and anchor to form a catenary shape. The relaxed catenary of the system leads to flexible vertical and horizontal motion of the floating platform [9,10]. The mooring lines of tension-leg mooring systems are pre-tensioned, allowing them to be fully tautened by the floating body [9]. The semi-taut mooring system combines the taut mooring system and catenary mooring system [9,10]. The advantages and disadvantages of the three mooring systems are summarized in Table 1. Current offshore floating wind projects such as the spar type foundation (Hywind Scotland [11], Hywind Tampen [7], TODA Hybrid Spar [12]), semi-submersible foundation (WindFloat Atlantic [13], Fukushima FORWARD [14], and VolturnUS Aqua Ventus I [15]) all apply a three-leg catenary mooring system due to its simple design and installation.
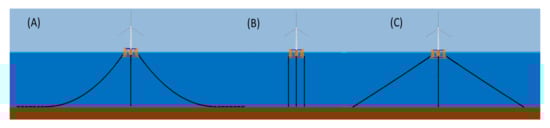
Figure 1.
Three types of mooring systems: (A) Catenary mooring system, (B) Tension-leg mooring system, (C) Semi-taut mooring system.

Table 1.
Comparison of the three mooring systems [7,9,10].
Mooring line failure mechanisms were investigated by Akers [16] and five common failure mechanisms were summarized: out-of-plane bending of the chain, ultimate load exceedance, fatigue, corrosion, and abrasion. The first two common failures typically occur during extreme events such as heavy weather, while the remaining three can be classed as fatigue failures due to the accumulated load over installation lifetime.
Mooring line failures studies with publicly available investigations are vital for risk assessment and rescue, with most of the focus on offshore oil and gas floating platforms [17]. Sekita and Sakai [18] applied the nonlinear method to analyze a TLP mooring system under critical sea conditions, and pointed out that snap loads were generated on the mooring lines, resulting in successive breakage of the mooring line. Deb [19] presented an investigation of the static and dynamic behavior of tension leg platform (TLP) after partial or total loss of a mooring line at any corner along with the effects of various pertinent parameters on instability. Yang, et al. [20] considered the transient effect of mooring line disconnection on the performance of the TLP in a storm. It was noted that mooring line tension is more significantly affected by the transient mode than by the motions, and that the vertical motions, especially pitch, are more significantly impacted by mooring line failure. A new code combining the Boundary Element and Finite Element Methods (BE-FEM), developed by Kim and Zhang [21], was applied to the transient effects of mooring line disconnection on the survivability of a TLP in a typhoon. Yang and Kim [22] indicated that the inclusion of second-order sum- and difference-frequency wave excitations can calculate tendon tensions more accurately in the transient effect. Yu, et al. [23] studied one-time and progressive tendon failure for a TLP under extreme conditions. For the offshore wind energy industry specifically, studies are very limited. Bae, et al. [24] used a numerical tool that combines a floater–mooring-coupled dynamic analysis program (CHARM3D) with an aero-hydro-servo-elastic wind turbine simulation tool to model the failure case of an FOWT and report its dynamic motion during the accident. Their results suggested the need for a more comprehensive study with additional scenarios. Most of the above-mentioned previous studies on the effects of mooring failure considered TLP; however, for semi-submersible floating wind turbines the dynamic response of the platform following mooring line failure and the impact of various incident wind and wave angles have not been thoroughly discussed in the literature and require dedicated studies. Furthermore, a non-operational wind turbine as considered in this research compares to the Bae, Kim and Kim [24] operational model. In the present study, a fully nonlinear numerical model was built with consideration of the Quadratic Transfer Function (QTF), added mass, and damping matrices of the platform. The hydrodynamic model of an FOWT [25,26] with the three-leg mooring configuration is investigated under mooring failure along with the dynamic response in detail, including platform performance, drift area, and tension in the remaining mooring lines.
The remainder of this paper is organized as follows: Section 2 introduces the analytical model of the FOWT, floating platform and the mooring system; Section 3 presents the numerical modelling of the FOWT, including the numerical tools and validation; Section 4 presents the hydrodynamic performance of the FOWT under the mooring filature conditions; Section 5 discusses the main findings and considers potential industrial applications; finally, the main findings and conclusions are drawn in Section 6.
2. Analytical Modelling
2.1. Governing Equation
The governing equations of the OC4-FOWT are modelled via Newton’s second law.
The external force includes the wave load on the OC4 platform, the wind load on the FOWT, and the mooring force on the whole system.
The is calculated via the Potential flow theory, including the wave radiation force and the exciting force . The cases in this study use extreme wave conditions with shallow water; therefore, the second-order wave force (difference frequency) is considered. The governing equation is then presented as:
where is the mass of the FOWT including the platform, the wind turbine, and the tower; is the aerodynamic load on wind turbine and tower; is the first order wave excitation force; is the second order wave excitation force, called wave drift force in this study; is the mooring force; is the linear damping matrix, including drift damping effects; is the quadratic damping matrix; is the total stiffness matrix; is the added mass matrix at the infinite frequency; and , and represent the displacement, velocity, and acceleration time-series vectors in translational or rotational motions, respectively. Damping and added mass matrix are frequency-dependent.
The second-order wave excitation force is simulated by the QTF data to all pairs of the wave components in the sea state, which is a superposition of a number, , of the regular wave components present in all the wave trains specified. The wave drift load can be present as:
where Re. denotes taking the real part of a complex number; is wave drift (QTF) in complex-valued form for the interaction of wave components j and k; and are direction relative to the heading of the platform; and are the wave amplitudes; and are the phase lags relative to the simulation time origin at the position of the platform’s QTF origin; and are the wave period of different components; and and are angular frequencies of different components.
2.2. Wind Load
Wind load is captured through implementation of the blade element momentum (BEM) method, adapted from AeroDyn v15.04 [2]. In this study, the wind speeds surpass a modern utility-scale turbine’s rated wind speed. Therefore, the blades are set to feather and reduce their surface area, and are locked down to ride out severe gusts. The yaw drive is stopped to point the wind direction. Hence, the aerodynamic load on the wind turbine and tower can be described as below:
where is the air density; is the drag coefficient obtained for the incident wind angle using the linear interpolation of the wing type data or tower data; is the element projective area with load calculated individually on the mid-segment frame of each segment and the area changed with different incident wind; is the wind speed in unit meter per second; and is the horizontal velocity of turbine moves in unit meter per second.
2.3. Mooring Load
In the static analysis, the catenary equation [27] provides the essential idea of a relationship between the x-offset and the horizontal restoring force in the static stage:
where is the horizontal projection distance between fairlead and anchor, is un-stretched mooring line length, is the horizontal force from mooring line self-weight, is the vertical distance from fairlead to seabed, and is the per meter weight of the mooring line. Once the tension of each line is computed, the overall static force on the floating structure can be defined.
In the dynamic analysis, a finite element model was used to simulate the mooring line in Orcaflex [26]. The line is divided into a series of line segments modelled by straight massless model segments with a node at each end, as illustrated in Figure 2. Line properties such as mass, weight, and buoyancy are lumped to the nodes. The index value of the line segment between nodes 0 and 1 is 1/2, and the node at the top of the fairlead node is N. In this study, there are 84 segments nodes in an 835.5 m mooring line. The mooring line model combines internal axial stiffness, damping force, buoyancy force, and hydrodynamic forces from Morison’s equation.
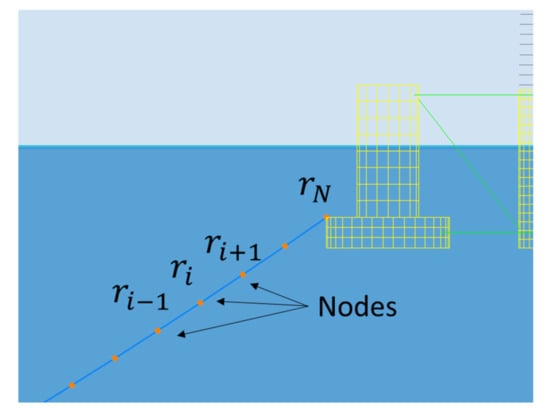
Figure 2.
Discretized mooring line model.
The equivalent mass of the mooring cable is discretised into point masses at each node by assigning each node half the combined mass of the two nearby segments. The 3 × 3 mass matrix for node can be represented by
where is equivalent mooring line diameter, is the density of the mooring cable, and is the identity matrix.
The added-mass matrix (which is included in the mass matrix) for node is expressed as:
where is the corresponding transverse, is the tangential added-mass matrix, is the transverse added-mass coefficient, is the tangential added-mass coefficient, and is defined as the tangent direction at each node and can be approximated as the direction of a line passing between the two adjacent node points.
The internal stiffness and damping force of the line segment are expressed as and , respectively. Meanwhile, the weight of the line segment lumped at each node i is denoted as , whereas is the net buoyancy at node . and are drag forces in the transverse and tangential directions, respectively. Therefore, the motion equation of the mooring cable for each node can be presented as below:
where is the position vector at node .
3. Numerical Modelling
3.1. Model Set-Up
An overview of the modelling scope is provided in Figure 3. The numerical simulation includes both a frequency and a time domain model. The coefficients of hydrodynamic forces were obtained by the frequency-domain boundary element method solver OrcaWave [28]. The diffraction analysis was considered as 31 wave periods ranging from 4 s through to 200 s and 9 wave headings between 0 and 180 degrees, including 0, 45, 90, and 120 degrees. First, the OC4 floating platform model (Figure 4), with the mesh sensitivity checked by [26], generated the meshes using ANASYS AQWA and imported them to OrcaWave for diffraction analysis. Then, the OrcaWave-generated data, including first-order wave load data and second-order drift loads plus stiffness, added mass and damping data were brought into the Orcaflex model. Then, the other components including the mooring system and wind turbine were built and connected to the platform. Finally, the physical properties of the wind turbine, mooring system and floating platform were implemented in a coupled nonlinear time-domain model to estimate the hydrodynamic response.
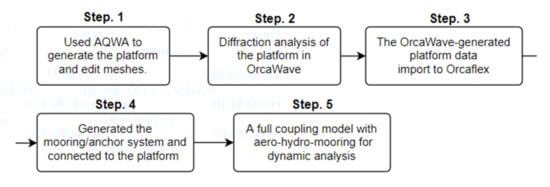
Figure 3.
The flowchart of the simulation.
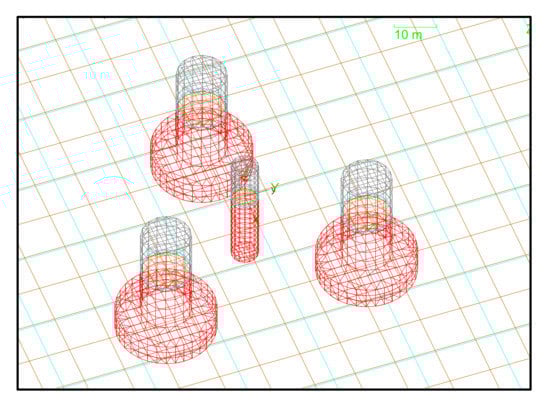
Figure 4.
The DeepCWind OC4 semi-submersible panel mesh.
As shown in Figure 5, the investigated FOWT houses an OC4 DeepCwind semi-submersible platform and a 5-MW baseline wind turbine. This selected turbine has been publicly used as a reference in several previous studies. The general parameters of the 5-MW turbine and the tower are listed in Table 2 and Table 3, respectively.
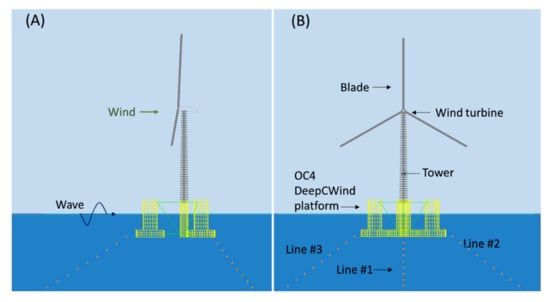
Figure 5.
OC4 DeepCwind semi-submersible system: (A) Side view; (B) Front view.
Table 2.
Wind Turbine Data Overview (Adapted with permission from Ref. [25]. NREL).
Table 3.
Tower Physical Properties (Adapted with permission from Ref. [29]. NREL).
The OC4 DeepCwind platform includes a 6.5 m-diameter main column and three offset columns that are connected to the main column through a series of smaller diameter pontoons and cross members, and the tower is cantilevered at an elevation of 10 m above the still water level (SWL) to the top of the main column (MC). The centre of mass (CM) is located at 13.6 m along the platform centrelineF below the SWL. The draft of the platform is 20 m. Details of the floating platform are presented in Table 4 [29].
Table 4.
Properties of the semi-submersible platform (Adapted with permission from Ref. [30]. NREL).
The configuration and parameters of the three-leg catenary mooring system used in the FOWT are shown in Figure 6 [29]. Three mooring lines were applied, each with an unstretched length of 835.5 m; the other properties are presented in Table 5 [25]. The code comparison of the OC4 DeepCWind model is presented in Appendix A. The hydrodynamic results displayed good agreement with the other numerical tools [30].
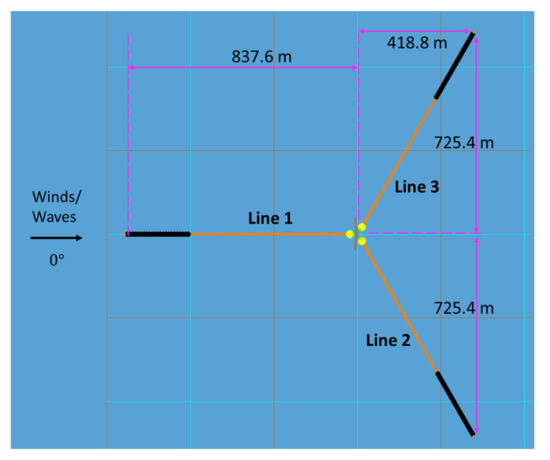
Figure 6.
Model set-up of the OC4 floating wind turbine and mooring system.
Table 5.
Properties of the mooring system (Adapted with permission from Ref. [30]. NREL).
3.2. Load Cases
The non-operational FOWT dynamic response in an accidental limit state (ALS) during extreme wind and wave conditions were studied. Mooring line #1 was set to release at 2000 s to simulate the ALS. The total numerical simulation time of each case was set to 6000 s, with a time step of 0.1 s. A recurrence period of 50-year typhoon condition with misalignment wind and wave directions, as recommended by the offshore standards [31], was selected as the extreme environmental load.
Table 6 shows different return periods of typhoon wave conditions from local government analysis of over 20 years of typhoon wave data [32] in offshore Hsinchu, Taiwan, the site of a potential wind farm. denotes the significant wave period and the significant wave height. The wave condition in = 9.1 m, = 12.7 s and , and the spectral density of the sea elevation process is represented by the JONSWAP spectrum (shown in Figure 7). The wind speed takes the 50-year return period typhoon event at 60 m/s [32]. All of the load cases in this study are provided in Table 7 and visualised in Figure 8. LC1–5 represent the various incident wind direction situations (Figure 8A), while LC6–9 represent the different direction conditions (Figure 8B) and LC10 shows the wind and waves coming from 180°.
Table 6.
Return periods of the typhoon wave conditions at Hsinchu offshore.
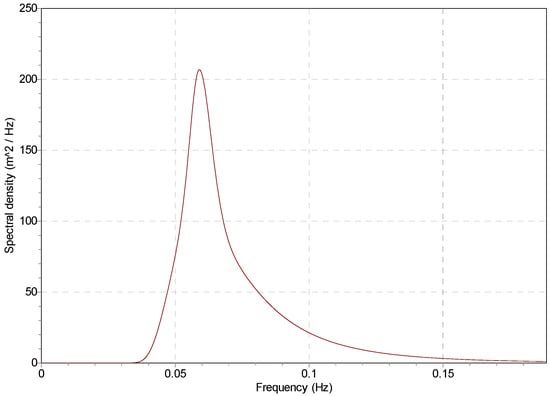
Figure 7.
JONSWAP spectrum for 50-year return period wave conditions.
Table 7.
Load cases for multi-directional incident wind and waves.
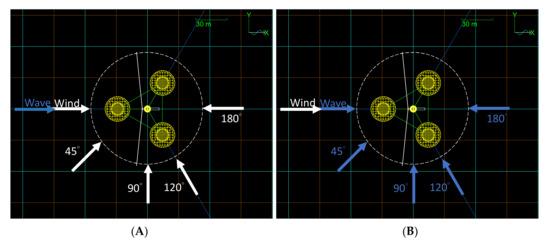
Figure 8.
Multi-directional incident wave and wind directions: (A) LC1 to LC5; (B) LC5 to LC9.
Notably, the design water depth for the OC4 DeepCwind platform is 200 m; however, the water depth in Hsinchu offshore is 50–100 m. To mitigate the differences in water depth, a simple mathematical theory to predict maximum surge drift distance in water depths of 200, 100 and 50 m is provided and discussed in Section 5.
4. Results
When mooring line #1 fails, the floating platform experiences a major drift motion in the x-direction (or surge direction) which induces a slight motion in the y-direction; the platform trail process is shown in Figure 9. To identify the characteristics of the dynamic platform in different situations the whole simulation is separated into three stages, as illustrated in Figure 10. The first stage is the normal scenario, that is, the floating platform with complete mooring system. The second stage shows the platform drifting process, while the third stage presents the floating platform reaching a new balance in the x-direction with the two remaining mooring lines. Notably, the time taken by the second stage differs with each load case because of various environmental loads. The main topics in this section are the drift area and stability of the floating platform, the tension force on mooring line’s two ends, and the mathematical formula of maximum drift prediction. The following subsections provide the results on each topic in detail.
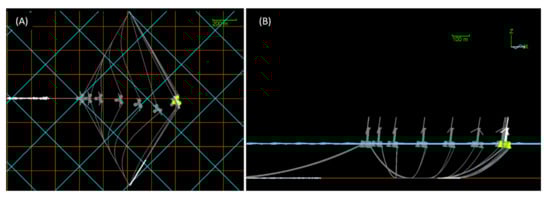
Figure 9.
Motion trails in the numerical model: (A) Plan view and (B) side view.
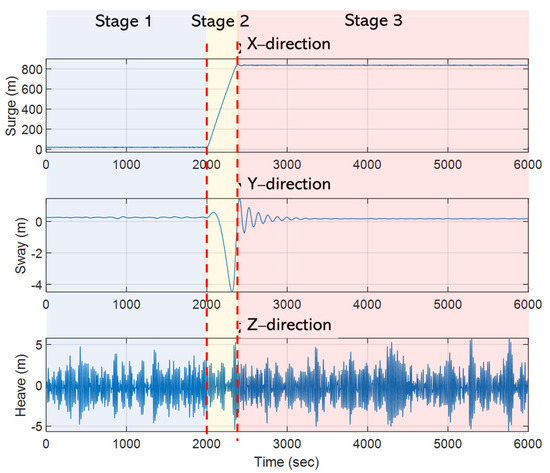
Figure 10.
Description of the three stages.
4.1. Drift Area and Velocity of the Platform
The incident wave and wind directions have an influence on the drift process (Figure 11). Most of the cases reached the new balance at a position around 800 m in the x-direction. By contrast, the surge drift distance was significantly reduced when the wind incidence angle was over 90° or when the incident wave and wind were both set at 180°. During the drifting process, the obvious sway motion was mainly caused by incident wave angle cases such as LC6–9.
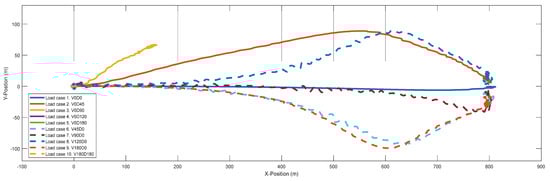
Figure 11.
Floating platform drift trails during the entire simulation in the X–Y plane in ten load cases; the solid lines present the incident wind changing cases and the dotted lines are the incident wave changing cases.
To clarify the maximum drift area in X–Y plane, Table 8 presents the highest/lowest values in each load case for all three stages. The maximum range is given by the highest value minus the lowest value. Considering all load cases, the suggested alert area is a rectangle 830 m long and 192 m wide once mooring line#1 is broken.
Table 8.
Maximum range for x-direction and y-direction.
The platform takes less than 10 min to reach the new balance position after the mooring line failure occurs (Figure 12). In some extreme cases, it even immediately reaches stage three. The maximum velocity of the platform in the surge and sway directions is presented in Figure 12. The highest velocity occurred in LC1 in the surge direction; on the other hand, the highest sway velocity appeared with the lowest surge velocity in LC7.
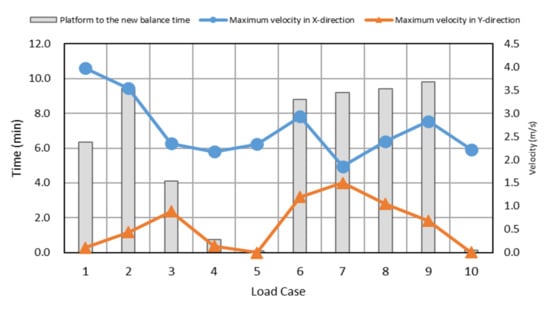
Figure 12.
Maximum velocity of the floating platform and the time to new balance after the failure of mooring line #1.
4.2. Floating Platform Dynamic Response
For the safety of a floating platform, the maximum permissible tilt at the tower top should be less than 15° for a non-operational scenario [33]. Most of the load cases fulfilled the critical limitation, except for the LC1 condition where highest pitch was over 20°. With a wind incident direction over 120° (LC4–5 and LC10), only small responses in x-axis drift and pitch were under 10°. The largest sway occurred in LC2, LC6, LC8 and LC9, and the maximum pitch was only 7–8°. Generally, the maximum pitch appeared in stage three instead of during the drift process in stage two. The figures for each case are shown in Appendix A, Figure A2.
4.3. Mooring Line Tension
4.3.1. Tension on Top End (Fairlead)
The incident wind–wave misalignment influenced the fairlead time-series tensions. Three modes illustrate the tension variation before and after mooring line failure on line#2 (blue line in Figure 13; the unit is kN in y-axis):
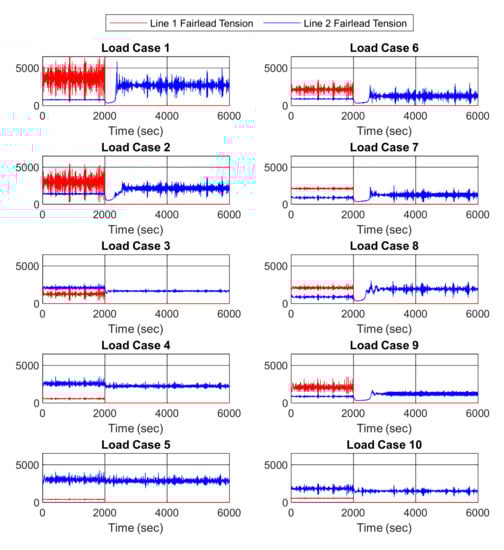
Figure 13.
Mooring line #1 and line #2 tension change in time series; the tension unit is kN.
- Mode A: line #2 mean tension in stage one lower than stage three.
- Mode B: line #2 mean tension in stage one higher than stage three.
- Mode C: line #2 mean tension in stage one and stage three have no obvious change.
LC1–2 and LC6–9 are in Mode A; the time-series tension immediately drops after the mooring line is broken, then increases slowly and reaches a higher tension than in stage one. LC3–4 and LC10 are in Mode B, while LC5 is in Mode C.
4.3.2. Tension on Bottom End (Anchor)
In Figure 14, LC1–2 and LC6–9 have the horizontal anchor force changed from a positive to a negative value. This change phenomenon shows that the anchor was pulled in opposite directions during the simulation. On the other hand, the mean tension presented a slight decrease in stage three in LC3–4 and LC10. All load cases have a slight vertical force (black dotted line in Figure 14; the unit is kN in the y-axis) acting on the anchor.
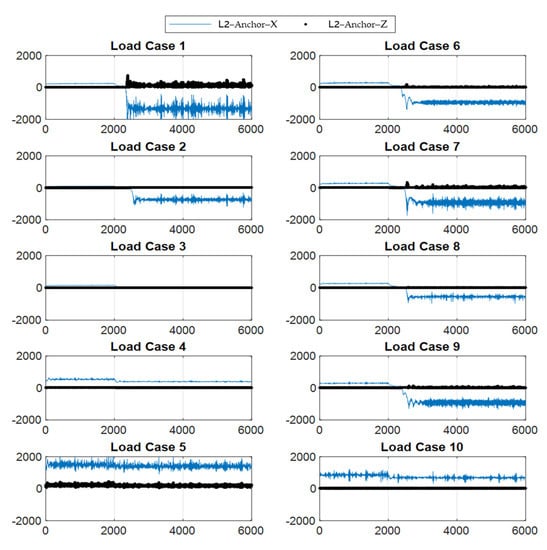
Figure 14.
Horizontal and vertical tension in mooring line #2 anchor point (the x-axis is time in sec, y-axis is tension in the unit kN).
4.4. Mathematical Method to Maximum Drift Prediction
A mathematical method based on a trigonometric function was proposed for the prediction of maximum drift in a range of water depths. The geometric configuration of the mooring system is shown in Figure 15 and its side-view layout in Figure 15A, where is the length of the mooring line (835.5 m), is the vertical distance from the platform fairlead to the seabed, and is the horizontal distance between the fairlead and the anchor. From the top view in Figure 15B, is the maximum drift distance in the surge direction and is the orthographic distance between the anchor and fairlead, assuming that the mooring line was strained in the second position.
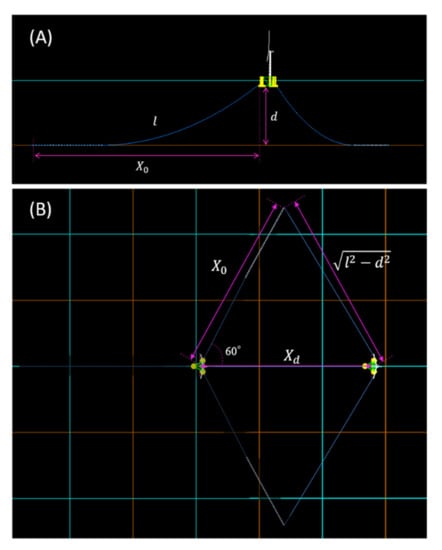
Figure 15.
Geometric configuration of the mooring system and floating platform layout: (A) Side view and (B) top view.
Based on the cosine law, the connection between , , and can be described as Equation (9), and following mathematical deduction we obtain the simple Equation (10):
In order to focus on the influence of various water depths in the prediction of maximum drift, the length of the mooring line is kept the same in the three water depths. Furthermore, the mooring restoring forces were set similarly in order to confirm the dynamic response of the platform was kept the same in the different water depths, as shown in Figure 16. The 50 m water depth restoring force (yellow dotted line in Figure 16) did not match well with the others restoring curves, as the shallow water effect allows a rapid increase in the restoring tension with respect to increased displacement. For example, the restoring force in 50 m of water depth is smallest before the platform moves to surge +20 m; however, the restoring force rises rapidly when the platform continues moving, and the curve matches the other two water depths.
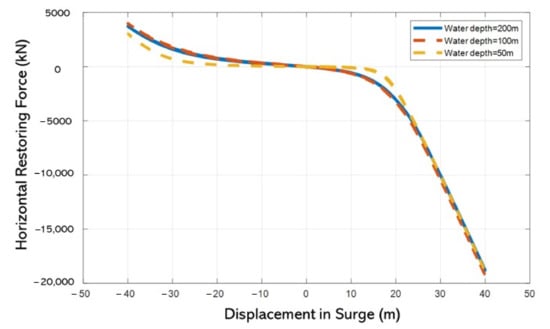
Figure 16.
Horizontal load–displacement relationships for three water depths.
5. Discussion
5.1. Drift Area and Velocity of the Platform
Figure 17, Figure 18, Figure 19 and Figure 20 present stage three′s mean and trend charts on the surge and sway directions along with the dynamic response influenced by the changing incident direction from waves or wind. Figure 17 and Figure 18 depict the platform response, which is mainly impacted by wind direction rather than waves in surge; when incident wind angles are over 90° there is a significant decrease in the surge drift.
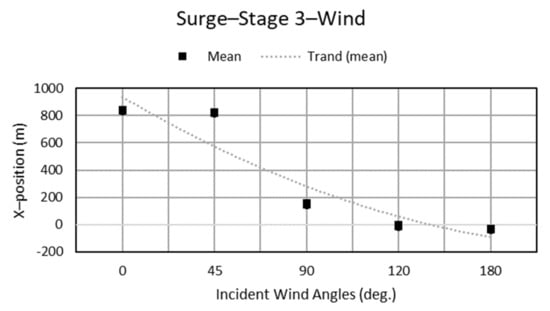
Figure 17.
Surge motion with different incident wind angles.
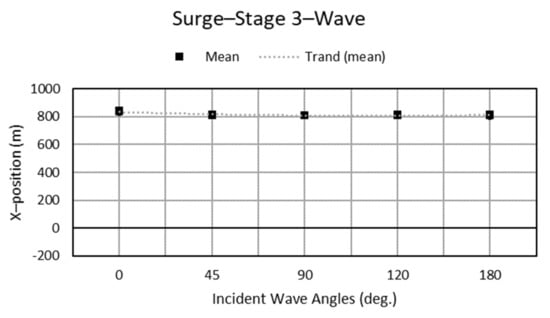
Figure 18.
Surge motion with different incident wave angles.
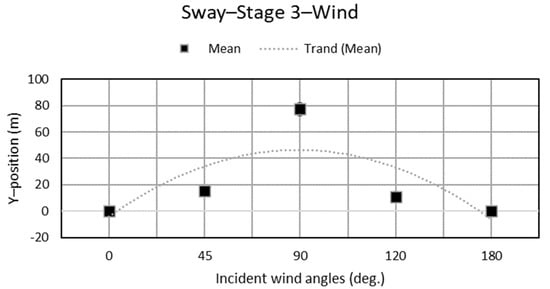
Figure 19.
Sway motion with different incident wind angles.
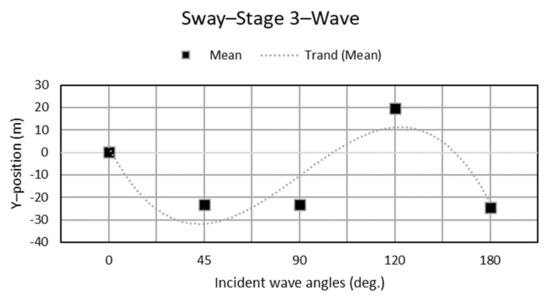
Figure 20.
Sway motion with different incident wave angles.
The largest sway drift occurred with the incident wind from 90°, as seen in Figure 19. In addition, Figure 20 shows that an incident wave direction of 45°, 90°, and 180° induced negative motion because the incident waves forced the platform to rotate to face them and this rotation process led to a slightly negative value in the sway. For the same reason, in the 0°and 120° incident wave cases the platform already faced the waves and did not have any evidently rotational motion.
5.2. Floating Platform Dynamic Response
The largest tilt pitch occurred with wind and waves from the same direction (the LC1 condition), which did not satisfy the safety standard [33]. Somewhat surprisingly, the new balance position (stage three) could be the riskiest stage as it faces fatigue issues from tower bending. Compared to stage one, the two remain mooring lines had limited restoring force to stabilize the platform in stage three, causing an unstable pitch degree. Although stage two had the same number of remaining mooring lines as stage three, the environmental loads on the platform induced a large surge motion rather than the platform tilt observed in stage three.
5.3. Mooring Line Tension
The drift process is highly related to the time-series tension variation. In Mode A, the stage two time-series tension showed that the horizontal distance from the platform fairlead to the mooring anchor point decreased and then increased during the drift process, as shown by the curve in line #2 tension (Figure 13, blue line). On the contrary, Modes B and C did not have obvious tension variety as the surge drift was less than in the Mode A cases, although in some cases the platform position changed only slightly after line#1 broke (for example, with the incident wind at 180°).
To check the range and the average of the tension in each case, Figure 21 shows the boxplot of the tension on line #2 in the first and third stages, respectively. On each box the central mark indicates the average and the bottom and top edges of the box indicate the 25th and 75th percentiles, respectively. The two extended ‘whiskers’ indicate the maximum and minimum values.
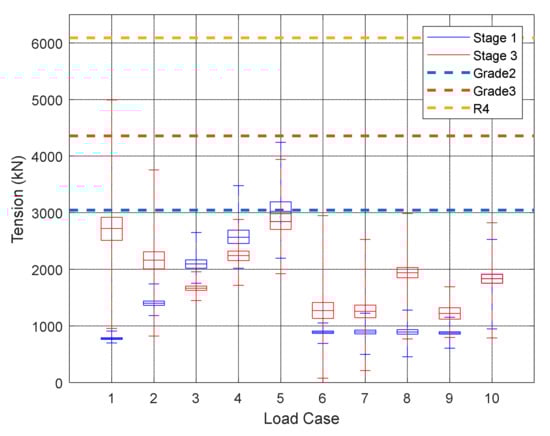
Figure 21.
Boxplot of mooring line#2 fairlead tension in stages 1 and 3.
In stage one the average fairlead tension of line #2 grew with an increase in the wind direction. However, changes in wave direction had no impact on the mean tension in line #2. The same trend was apparent for surge drift (Section 4.1).
Notably, the remaining mooring lines induced extreme tension after the mooring line disconnect with certain load cases exceeding the minimum breaking load, as seen in Figure 21, potentially leading to a series of mooring line failures with very serious consequences. It is suggested that designers select a strong enough grade of chain to endure the worst-case situation.
The stage one trend of anchor force (Figure 22) is similar to trend of fairlead force. The stage three negative tension cases explain that the pull directions are opposite from those in stage one. On the other hand, the maximum vertical force on the anchor is small, which means there may not be a lifting anchor issue in this condition; however, more study in needed.
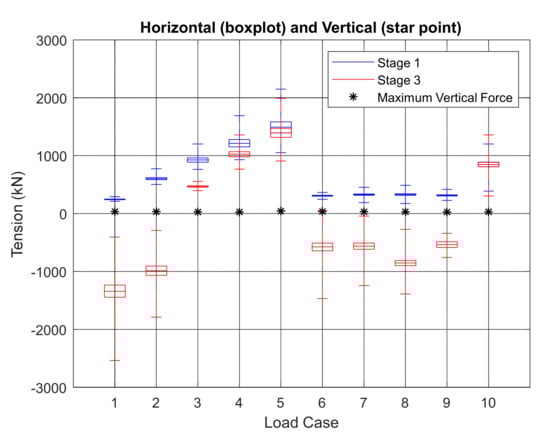
Figure 22.
Boxplot of mooring line #2 anchor tension in Stage 1 and Stage 3.
5.4. Mathematical Method for Prediction of Maximum Drift
The maximum drift results for different water depths are shown in Table 9. The maximum forward and backward surge in stage one at three different water depths is similar, confirming that the initial mooring system setups are mostly the same. The water depth impacted the drift distance slightly in the surge direction, indicating that water depth cannot be a dominant parameter. Overall, after breaking the mooring line the maximum surge drift in the simple method has more than 97% similarity to the simulation results for all water depths.
Table 9.
Drift of the floating platform in different water depths.
6. Conclusions
In this paper, a fully nonlinear model was built to integrate an OC4 DeepCwind semi-submersible FOWT. The coupled effects of failure on this FOWT system, including the drift response of the platform, the pitch motion of the turbine, the tension on the mooring line, and the prediction of maximum drift distance method have been explored in detail in this study.
When mooring failure occurs, it is almost impossible to rescue the platform during the drift process. The platform takes less than 10 min to attain a two-mooring-line balanced position, which means that the design of the mooring system should carefully consider survival of the incomplete mooring system. Although the large drift distance means that the platform might not immediately hit neighbouring FOWTs (the normal distance between FOWTs is about 7D–10D, which is 882–1260 m for NREL 5MW wind turbines), there is a potentially significant risk to nearby offshore structures.
In the pitch motion section, the maximum pitch with incident wind and wave both from 0° is over 20°, which is unacceptable {DNV, 2019 #253;Robertson, 2014 #256}. In addition, the highest pitch in each case generally appeared in stage three. In the other words, the third stage is potentially more unstable than stages one or two.
The mooring line tension and drift distance are closely related; for example, in cases where platform drifted over 800 m the anchor suffered opposite horizontal forces in stage one and stage three, respectively. In addition, the material strength of the chain is important for avoiding a series of breakages in the mooring line after the first line broken. The choice of an R4 or stronger level mooring line could prevent potential disasters. Although the vertical force on anchors is not as large as the tension on the fairlead, it could nevertheless pose a risk to the drift anchor.
The mathematical formula proposed here for predicting the maximum drift has high consistency with the numerical results and can assist wind farm managers by providing a quick picture of the failure impact area when an accident happens, or alternatively help wind farm designers to organize emergency standard operating procedures (such as the urgency area for mooring line failure) well in advance.
It must be borne in mind that this study focused primarily on the dynamic response of the platform following mooring line disconnect. The mechanical causes of broken mooring lines, such as fatigue issues, as well as risk to the drift anchor and power cable components, are not included in this research. Thus, further research is needed to consider the impact of drift anchor or the power cable breakage before any generalised risk assessment of FOWT failure can be drawn.
Author Contributions
R.-Y.Y. and T.-C.C. conceived the original idea and original draft preparation. All simulations and formal analysis were performed by T.-C.C. with ANSYS AQWA and Orcina Orcaflex. C.Z. and L.J. contributed with constructive discussions, corrections, and comments to increase the quality of the publication. All authors have read and agreed to the published version of the manuscript.
Funding
This research was funded by Ministry of Science and Technology, Taiwan under the grant numbers MOST 109-3116-F-006-013-CC1.
Institutional Review Board Statement
Not applicable.
Informed Consent Statement
Not applicable.
Data Availability Statement
Not applicable.
Acknowledgments
The authors are grateful for the support of the Ministry of Science and Technology, Taiwan under the grant numbers MOST 109-3116-F-006-013-CC1.
Conflicts of Interest
The authors declare no conflict of interest.
Appendix A
One way to verify the response characteristics of an FOWT covering a range of wave periods is to verify the response amplitude operators (RAOs) using various numerical tools. In the NREL report [30], nineteen institutions compared the hydrodynamic results for an OC4 DeepCWind platform. Figure A1 provides the RAO comparison for surge, heave, and pitch. Both the response frequency and the amplitude have good agreement with other numerical tools.
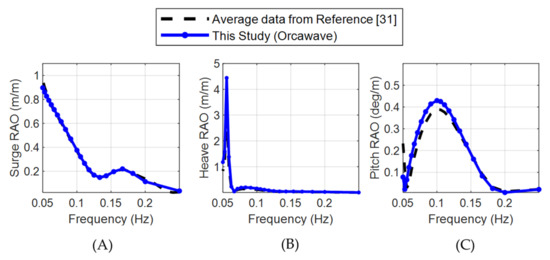
Figure A1.
Code comparison in (A) surge, (B) heave and (C) pitch. Adapted with permission from Ref. [31]. NREL.
Figure A2 illustrates four items for each load case: the drift area, maximum pitch in each position (the numbers shown in the figures), location of the maximum pitch in each load case (red markers), and color definition, in order to show whether the degree is over the critical level of 15°. The orange–red indicates that the maximum pitch in the particular position is close to or over critical, while the green–yellow indicates that is well under 15°.
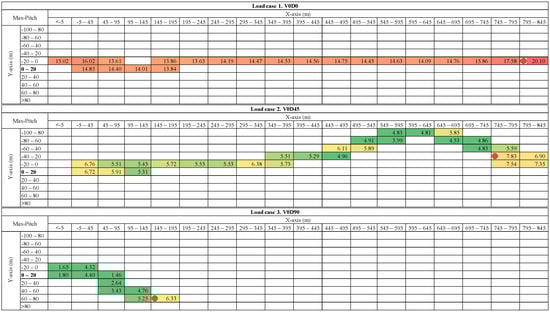
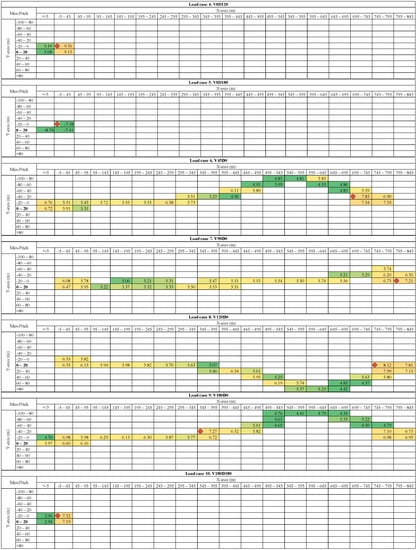
Figure A2.
Multiple diagrams tracking maximum pitch and drift trails in ten load cases.
References
- Eriksen, E.; Aanestad, O.M.; Eidsvold, M.F. The Future of Offshore Wind Is a Float. Available online: https://www.equinor.com/en/what-we-do/floating-wind.html (accessed on 12 September 2021).
- Spearman, D.K.; Strivens, S.; Matha, D.; Cosack, N.; Macleay, A.; Regelink, J.; Patel, D.; Walsh, T. Floating Wind Joint Industry Project Phase II Summary Report; The Carbon Trust: London, UK, 2020. [Google Scholar]
- Strivens, S.; Northridge, E.; Evans, H.; Harvey, M.; Camp, T.; Terry, N. Floating Wind Joint Industry Project Phase III Summary Report; The Carbon Trust: London, UK, 2021. [Google Scholar]
- Musial, W.; Spitsen, P.; Beiter, P.; Duffy, P.; Marquis, M.; Cooperman, A.; Hammond, R.; Shields, M. Offshore Wind Market Report: 2021 Edition; Department of Energy: Washington, DC, USA, 2021. [Google Scholar]
- Ibrion, M.; Paltrinieri, N.; Nejad, A.R. Learning from failures: Accidents of marine structures on Norwegian continental shelf over 40 years time period. Eng. Fail. Anal. 2020, 111, 104487. [Google Scholar] [CrossRef]
- Ma, K.-t.; Shu, H.; Smedley, P.; L’Hostis, D.; Duggal, A. A historical review on integrity issues of permanent mooring systems. In Proceedings of the Offshore Technology Conference, Houston, TX, USA, 6–9 May 2013. [Google Scholar]
- Technology, S.S. Advanced Anchoring and Mooring Study; Oregon Wave Energy Trust (OWET): Portland, OR, USA, 2009. [Google Scholar]
- Anchors, V. Anchor Manual. 2010. Available online: http://www.vryhof.com/pdf/anchor_manual.pdf. (accessed on 21 August 2021).
- James, R.; Ros, M.C. Floating offshore wind: Market and technology review. Carbon Trust 2015, 1, 439. [Google Scholar]
- Thomsen, J.B.; Ferri, F.; Kofoed, J.P.; Black, K. Cost optimization of mooring solutions for large floating wave energy converters. Energies 2018, 11, 159. [Google Scholar] [CrossRef] [Green Version]
- Enterprise, S. Mooring and Anchoring Research Report: Mooring and Anchoring Literature Review and Consultation; Xodus Group: Glasgow, UK, 2020. [Google Scholar]
- Leong, M. Japan Awards First Floating Offshore Wind Tender. Available online: https://connect.ihsmarkit.com/upstream-insight/article/phoenix/4011325/japan-awards-first-floating-offshore-wind-tender (accessed on 24 April 2021).
- Durakovic, A. WindFloat Atlantic Fully up and Running. Available online: https://www.offshorewind.biz/2020/07/27/windfloat-atlantic-fully-up-and-running/ (accessed on 1 May 2021).
- Shimada, K.; Shiroeda, T.; Hotta, H.; Phuc, P.V.; Kida, T. Fukushima Offshore Wind Consortium. Available online: http://www.fukushima-forward.jp/english/ (accessed on 1 September 2021).
- Margaronis, S. New England Aqua Ventus will Launch First US Floating Offshore Wind Turbine in 2023/24. Available online: https://ajot.com/insights/full/ai-new-england-aqua-ventus-will-launch-first-us-floating-offshore-wind-turbine-in-2024 (accessed on 2 November 2021).
- Akers, R.H. Why Good Mooring Systems Go Bad. In Proceedings of the Maine Ocean&Wind Industry Initiative, Portland, OR, USA, 16 July 2012. [Google Scholar]
- F-konstruksjonssikkerhet; Kvitrud, A.; Bache, B.T. Anchor line failures—Norwegian Continental Shelf—2010–2014; Petroleumstilsynet: Stavanger, Norwey, 2014; Volume 5, pp. 212–236. [Google Scholar]
- Sekita, K.; Sakai, M. Model tests to establish a design method for TLP-tether systems. In Proceedings of the Offshore Technology Conference, Houston, TX, USA, 7–9 May 1984. [Google Scholar]
- Deb, M.K. Statics and Dynamics of a Tension Leg Platform in Intact and Tether Damage Conditions; Memorial University of Newfoundland: St. John’s, NL, Canada, 1986. [Google Scholar]
- Yang, C.K.; Padmanabhan, B.; Murray, J.; Kim, M. The transient effect of tendon disconnection on the global motion of ETLP. In Proceedings of the International Conference on Offshore Mechanics and Arctic Engineering, Estoril, Portugal, 15–20 June 2008; pp. 497–507. [Google Scholar]
- Kim, M.H.; Zhang, Z. Transient effects of tendon disconnection on the survivability of a TLP in moderate-strength hurricane conditions. Int. J. Nav. Archit. Ocean Eng. 2009, 1, 13–19. [Google Scholar] [CrossRef] [Green Version]
- Yang, C.K.; Kim, M.-H. Transient effects of tendon disconnection of a TLP by hull–tendon–riser coupled dynamic analysis. Ocean Eng. 2010, 37, 667–677. [Google Scholar] [CrossRef]
- Yu, J.; Hao, S.; Yu, Y.; Chen, B.; Cheng, S.; Wu, J. Mooring analysis for a whole TLP with TTRs under tendon one-time failure and progressive failure. Ocean Eng. 2019, 182, 360–385. [Google Scholar] [CrossRef]
- Bae, Y.; Kim, M.; Kim, H. Performance changes of a floating offshore wind turbine with broken mooring line. Renew. Energy 2017, 101, 364–375. [Google Scholar] [CrossRef]
- Jonkman, J.; Butterfield, S.; Musial, W.; Scott, G. Definition of a 5-MW Reference Wind Turbine for Offshore System Development; National Renewable Energy Lab. (NREL): Golden, CO, USA, 2009. [Google Scholar]
- Robertson, A.; Jonkman, J.; Masciola, M.; Song, H.; Goupee, A.; Coulling, A.; Luan, C. Definition of the Semisubmersible Floating System for Phase II of OC4; National Renewable Energy Lab. (NREL): Golden, CO, USA, 2014. [Google Scholar]
- Faltinsen, O.M. Sea Loads on Ships and Offshore Structures; Cambridge University Press: Cambridge, UK, 1999. [Google Scholar]
- Orcina, L. OrcaWave User Manual: Version 11.1 d. Available online: https://www.orcina.com/webhelp/OrcaFlex/Default.htm (accessed on 2 November 2021).
- Jonkman, J. Definition of the Floating System for Phase IV of OC3 (No. NREL/TP-500-47535; National Renewable Energy Lab. (NREL): Golden, CO, USA, 2010. [Google Scholar]
- Robertson, A.; Jonkman, J.; Vorpahl, F.; Popko, W.; Qvist, J.; Frøyd, L.; Chen, X.; Azcona, J.; Uzunoglu, E.; Guedes Soares, C. Offshore Code Comparison Collaboration Continuation Within IEA Wind Task 30: Phase II Results Regarding a Floating Semisubmersible Wind System Preprint. In Proceedings of the 33rd International Conference on Ocean, Offshore and Arctic Engineering, San Francisco, CA, USA, 8–13 June 2014. [Google Scholar]
- DNV GL. DNV GL-ST-0437: Loads and Site Conditions for Wind Turbines; DNV GL: Oslo, Norway, 2016. [Google Scholar]
- The 2nd River Management Office, Water Resources Agency. Planning Report on Environmental Protection and Construction Plan for the South Coast of Hsinchu Port. 2005. Available online: https://www-ws.wra.gov.tw/Download.ashx?u=LzAwMS9VcGxvYWQvb2xkRmlsZTIvbWVkaWEvMTEyNjAvMTkyMTY4MjUzMy1yb2JvY29weS0zMmFwLXJpdmVyX3dlYi1naXBudWxsLXN5cy1wdWJsaWMtZGF0YS0xNzgxNzE5MTg3MS5wZGY%3D&n=MTc4MTcxOTE4NzEucGRmLnBkZg%3D%3D&icon=.pdf (accessed on 9 December 2021).
- DNV GL. DNVGL-RP-0286: Coupled analysis of floating wind turbines. In Recommend Practice DNVGL-RP-0286; DNV GL: Oslo, Norway, 2019. [Google Scholar]
Publisher’s Note: MDPI stays neutral with regard to jurisdictional claims in published maps and institutional affiliations. |
© 2022 by the authors. Licensee MDPI, Basel, Switzerland. This article is an open access article distributed under the terms and conditions of the Creative Commons Attribution (CC BY) license (https://creativecommons.org/licenses/by/4.0/).