
Influence of Seismic Loads Considering Soil Properties and Wave Passage Effect on the Seismic Response of a Multi-Span PSC Girder Bridge


Abstract
:1. Introduction
2. Background
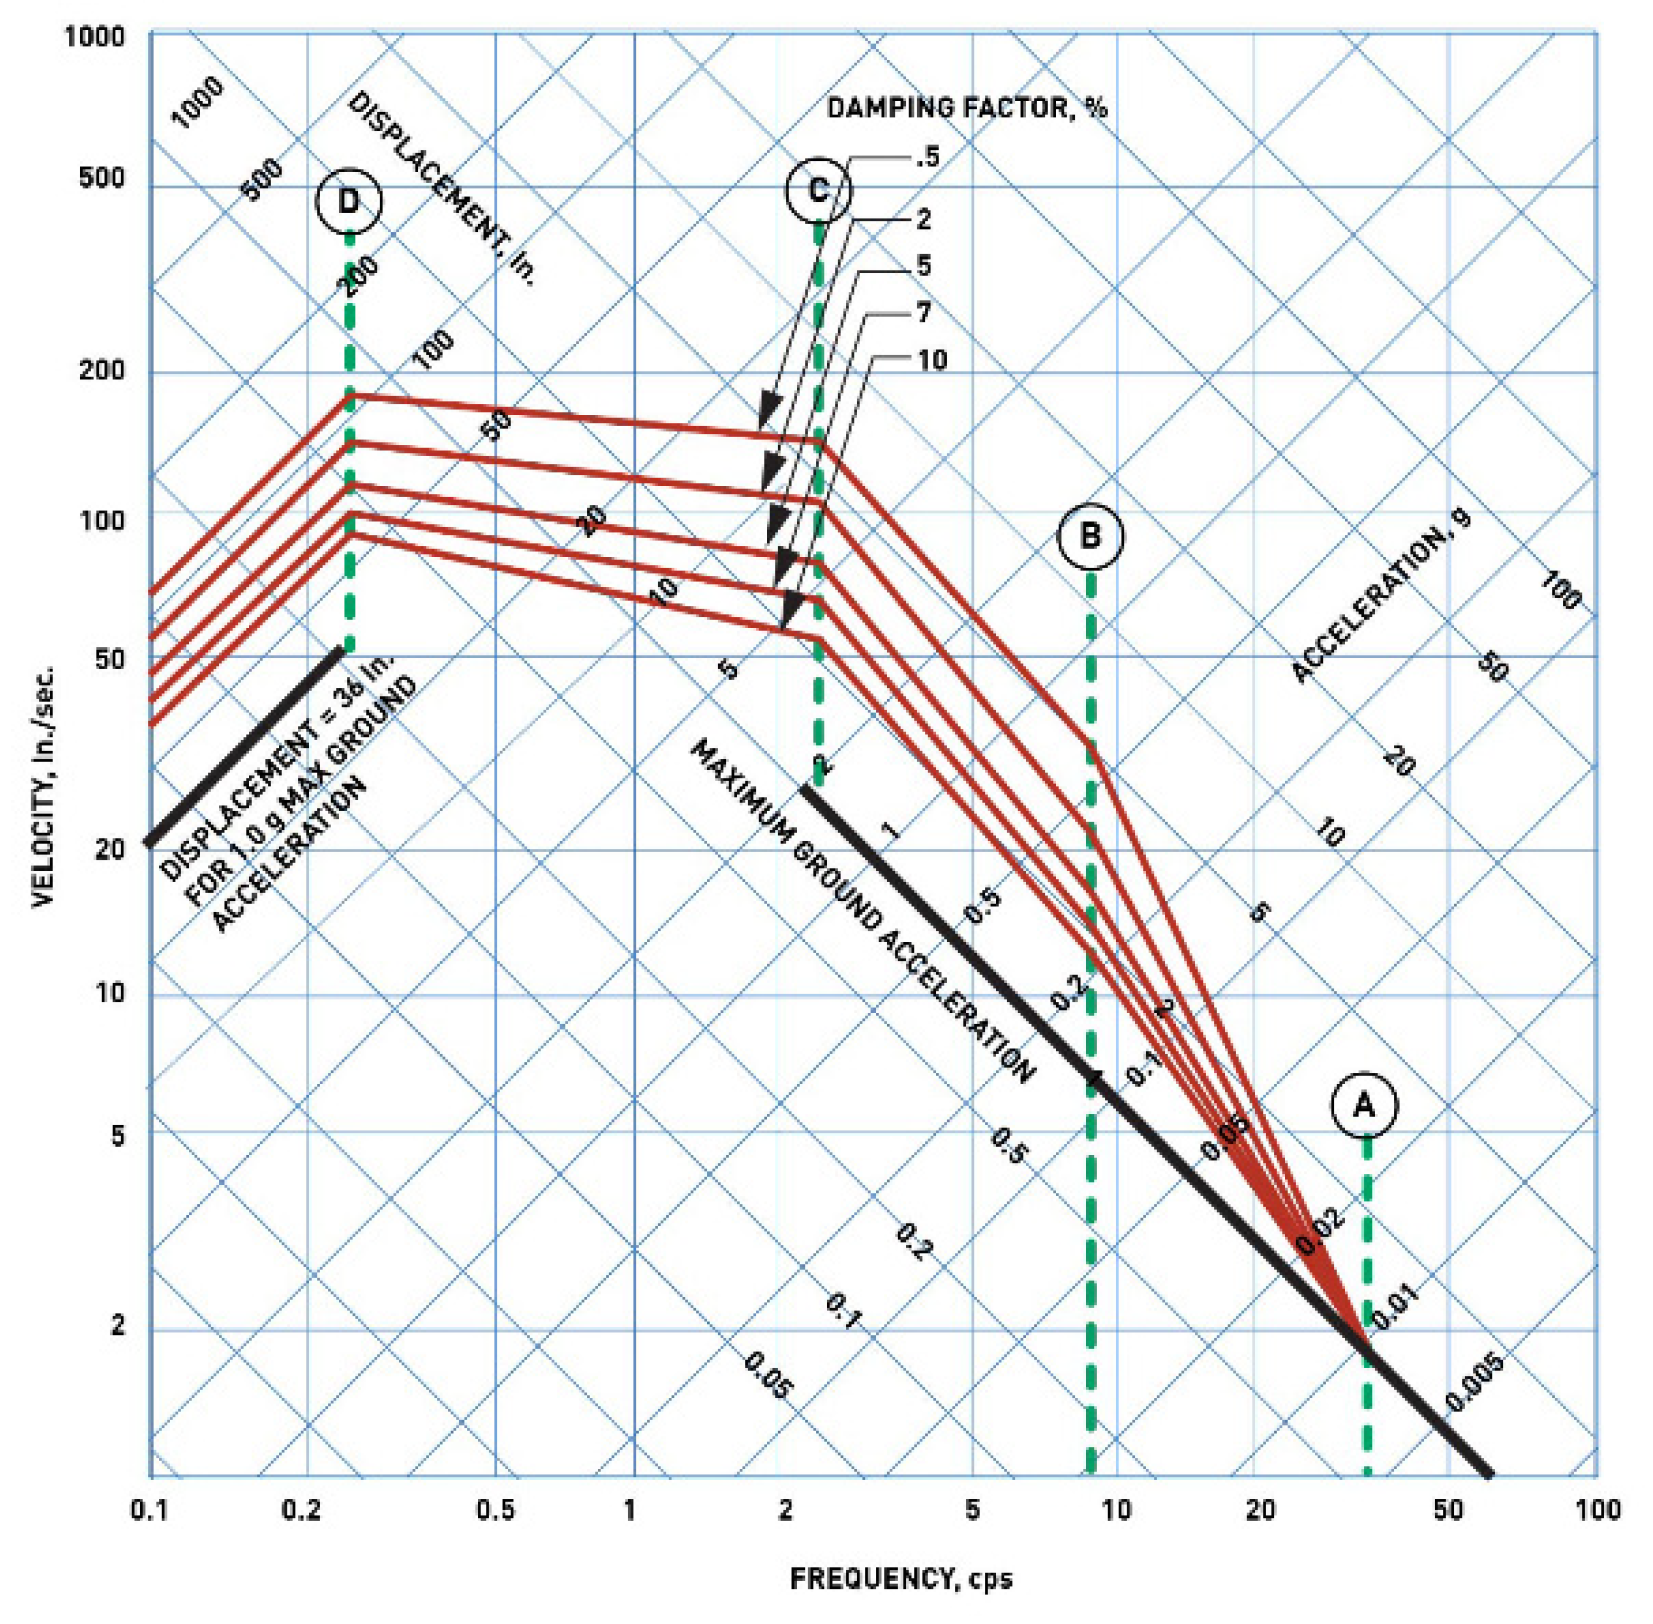
- (1)
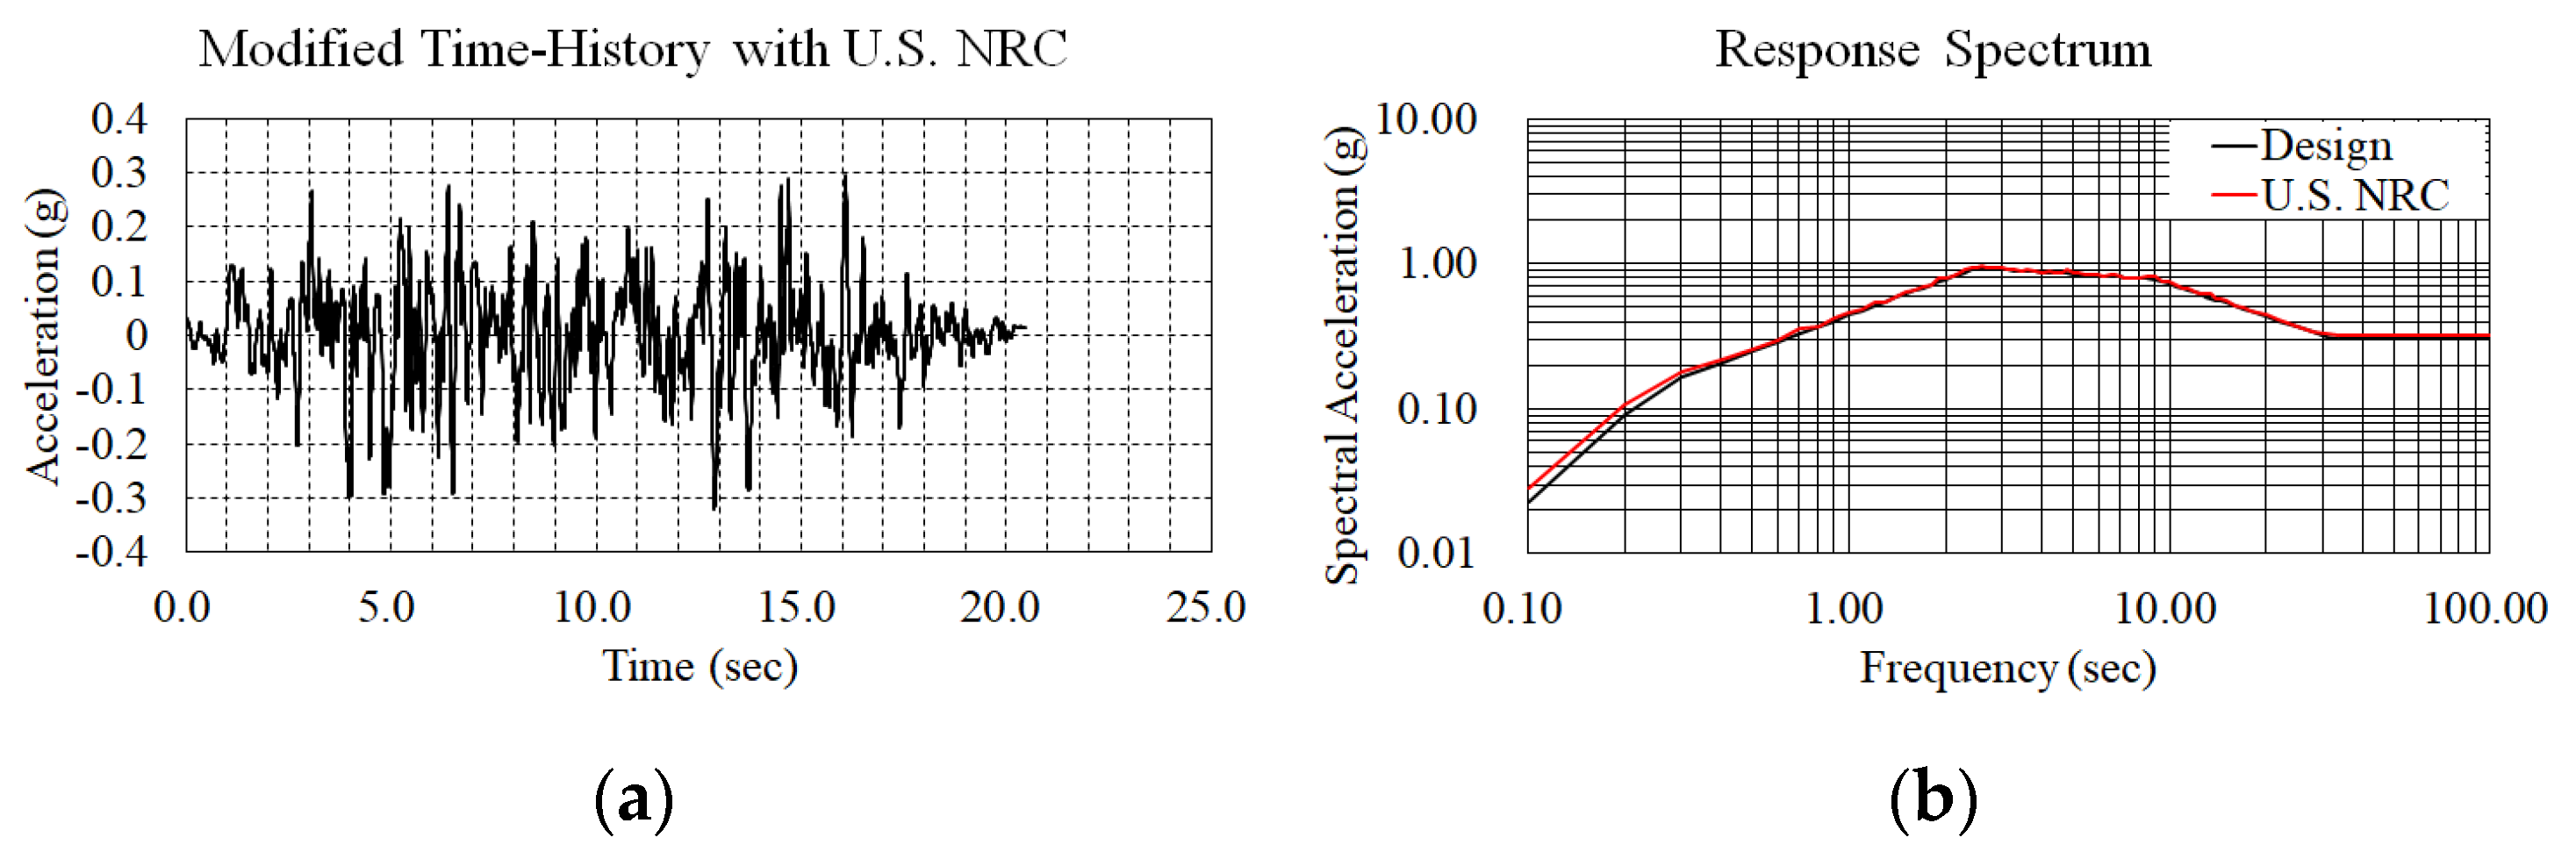
- The response spectra generated by the seismic load should cover the design response spectrum shown in Figure 3. However, for the frequency of up to five points, the response spectrum generated by the seismic load may have a smaller value than the design response spectrum;
- (2)
- When the response spectrum of the seismic load is smaller than the design response spectrum, the value of the response spectrum of the seismic load shall not be less than 10% less than the value of the design response spectrum. In addition, even if the value is large, the value of the response spectrum of the seismic load should not be larger than 30% of the design response spectrum;
- (3)
- The interval for generating the response spectrum is proposed in two cases, as follows:
- When calculating spectrum values based on seismic loads, the frequency interval for calculating spectrum values must be sufficiently small. Table 1 shows the allowable frequency intervals for calculating the response spectrum using multiple damping ratios;
- When calculating the spectral acceleration from the seismic load for a single damping ratio, the allowable frequency interval shall be calculated over 100 or more points of the frequency, with equal intervals on a log scale.
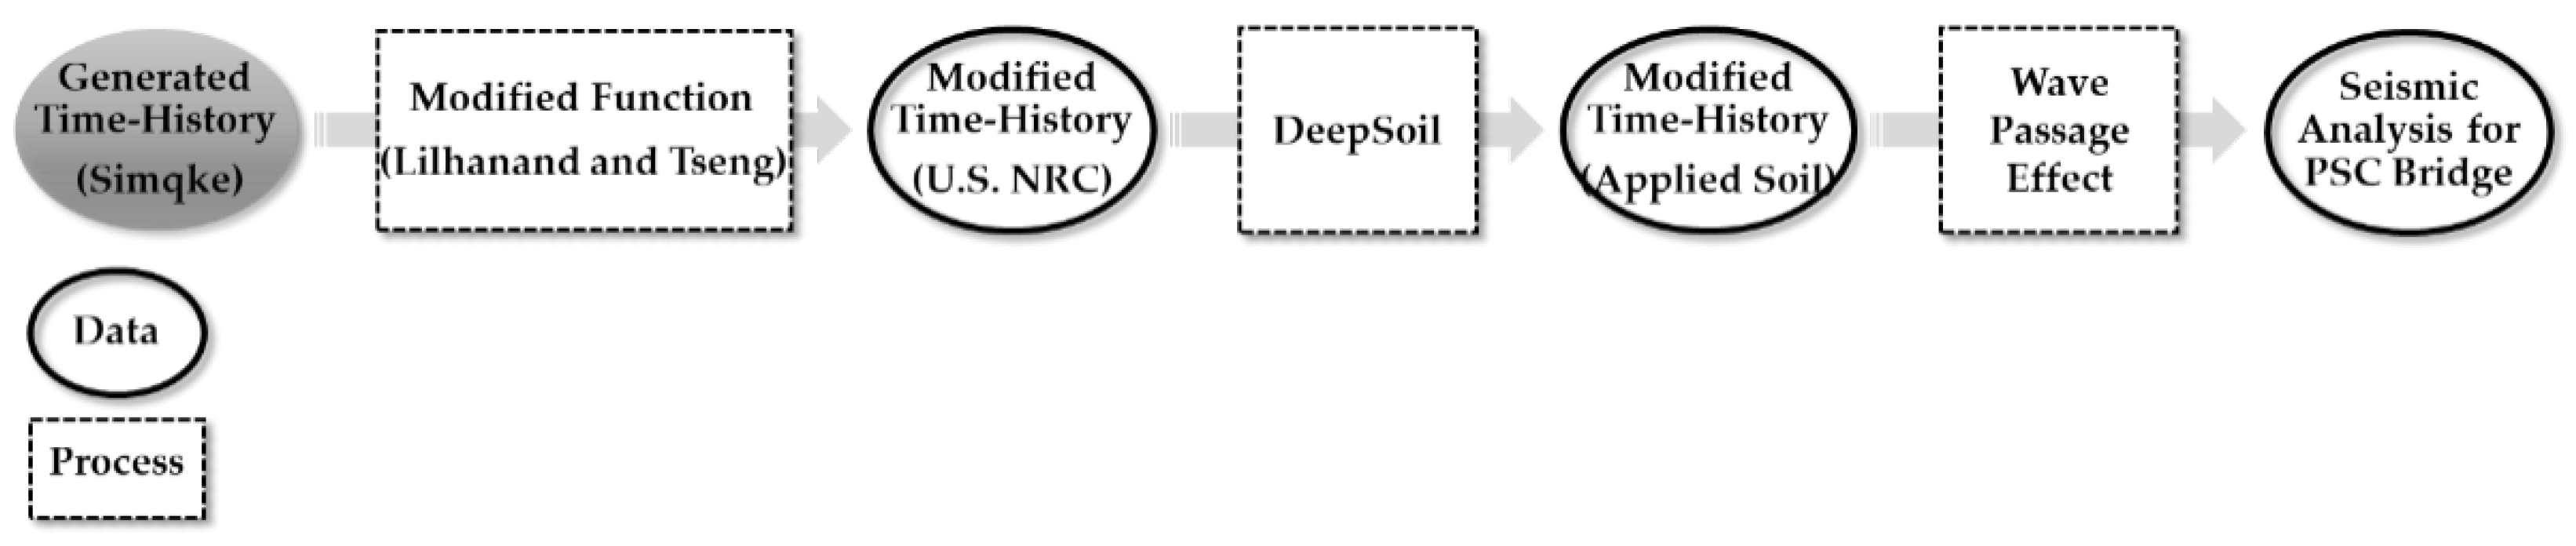
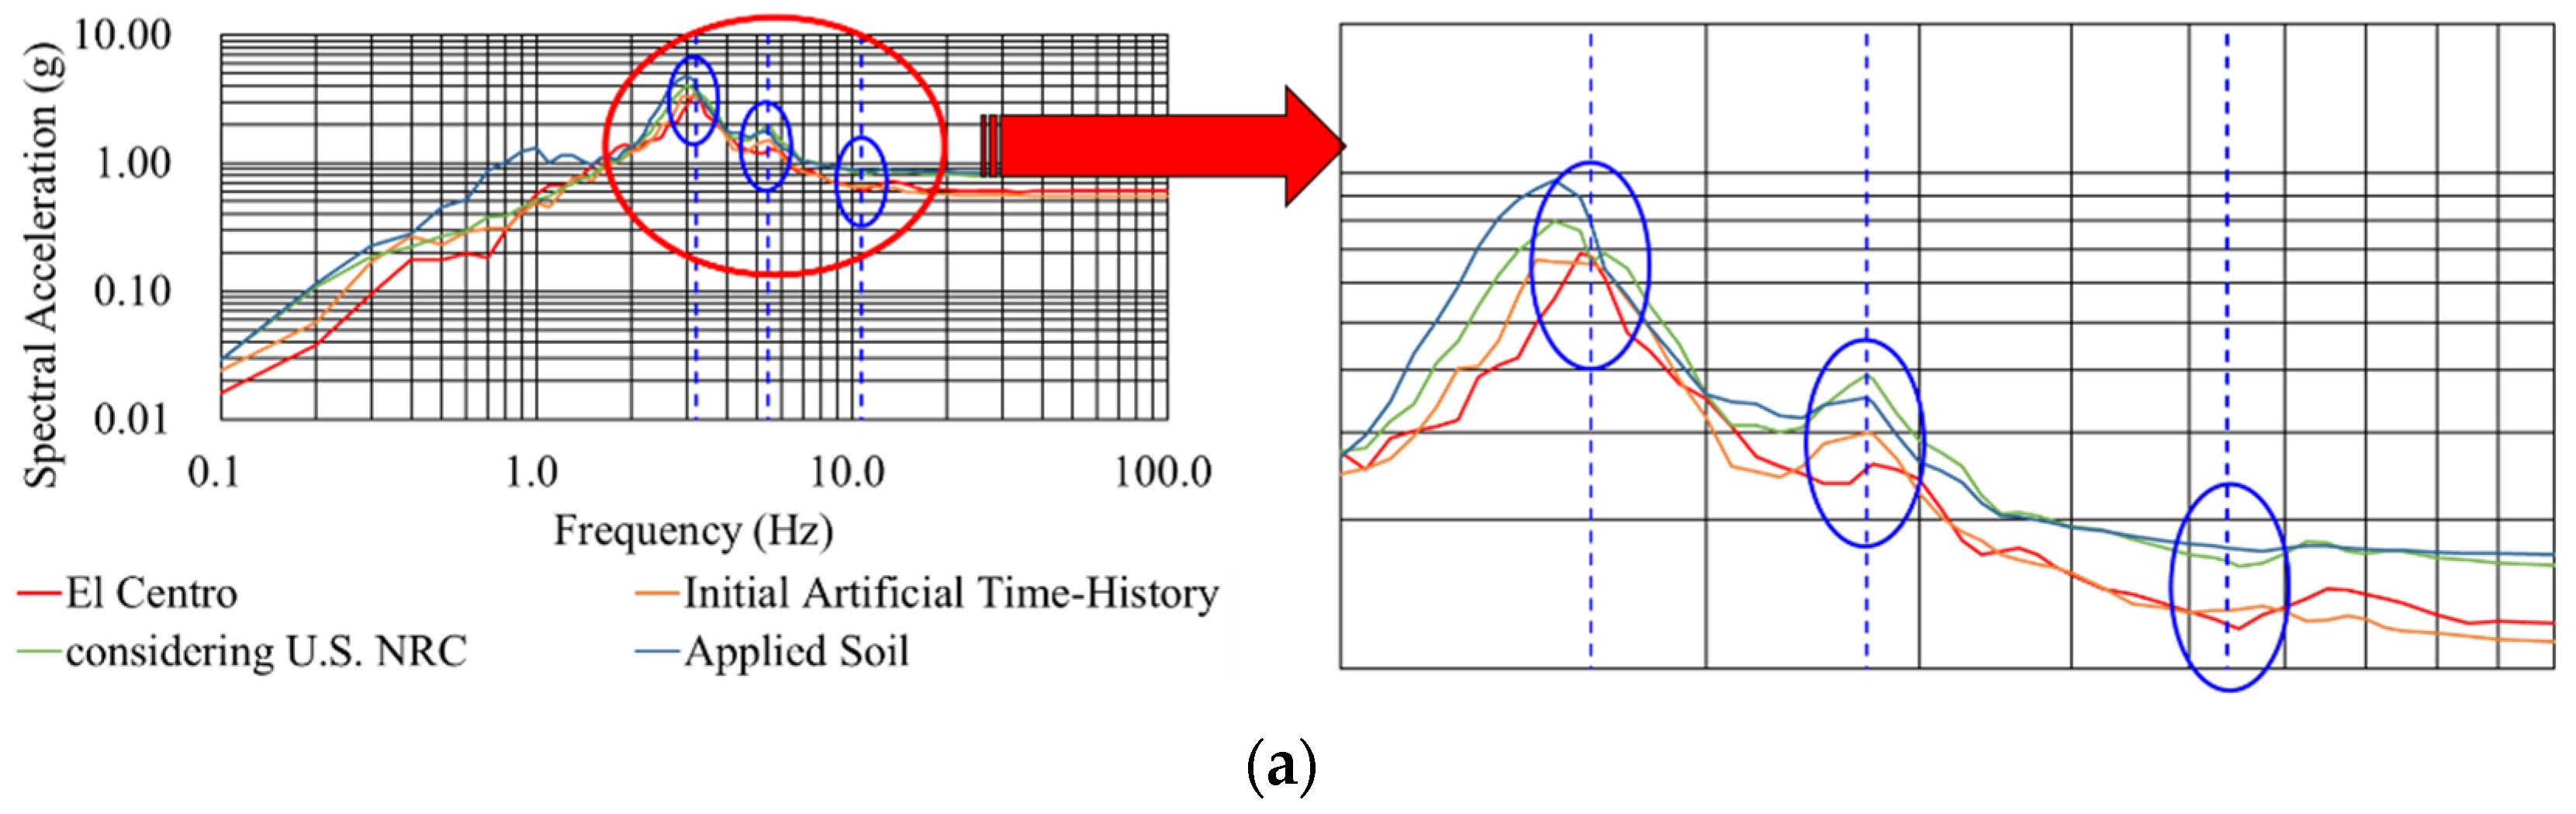
3. Comparison of Seismic Load
- Seismic Load 1: El Centro record;
- Seismic Load 2: Seismic load generated by SIMQKE;
- Seismic Load 3: Seismic load generated by SIMQKE, modified to meet U.S. NRC standards;
- Seismic Load 4: Seismic load considering the soil properties of the location where the bridge was installed using DEEPSOIL—a site response analysis program for seismic load modified to satisfy the USNRC.
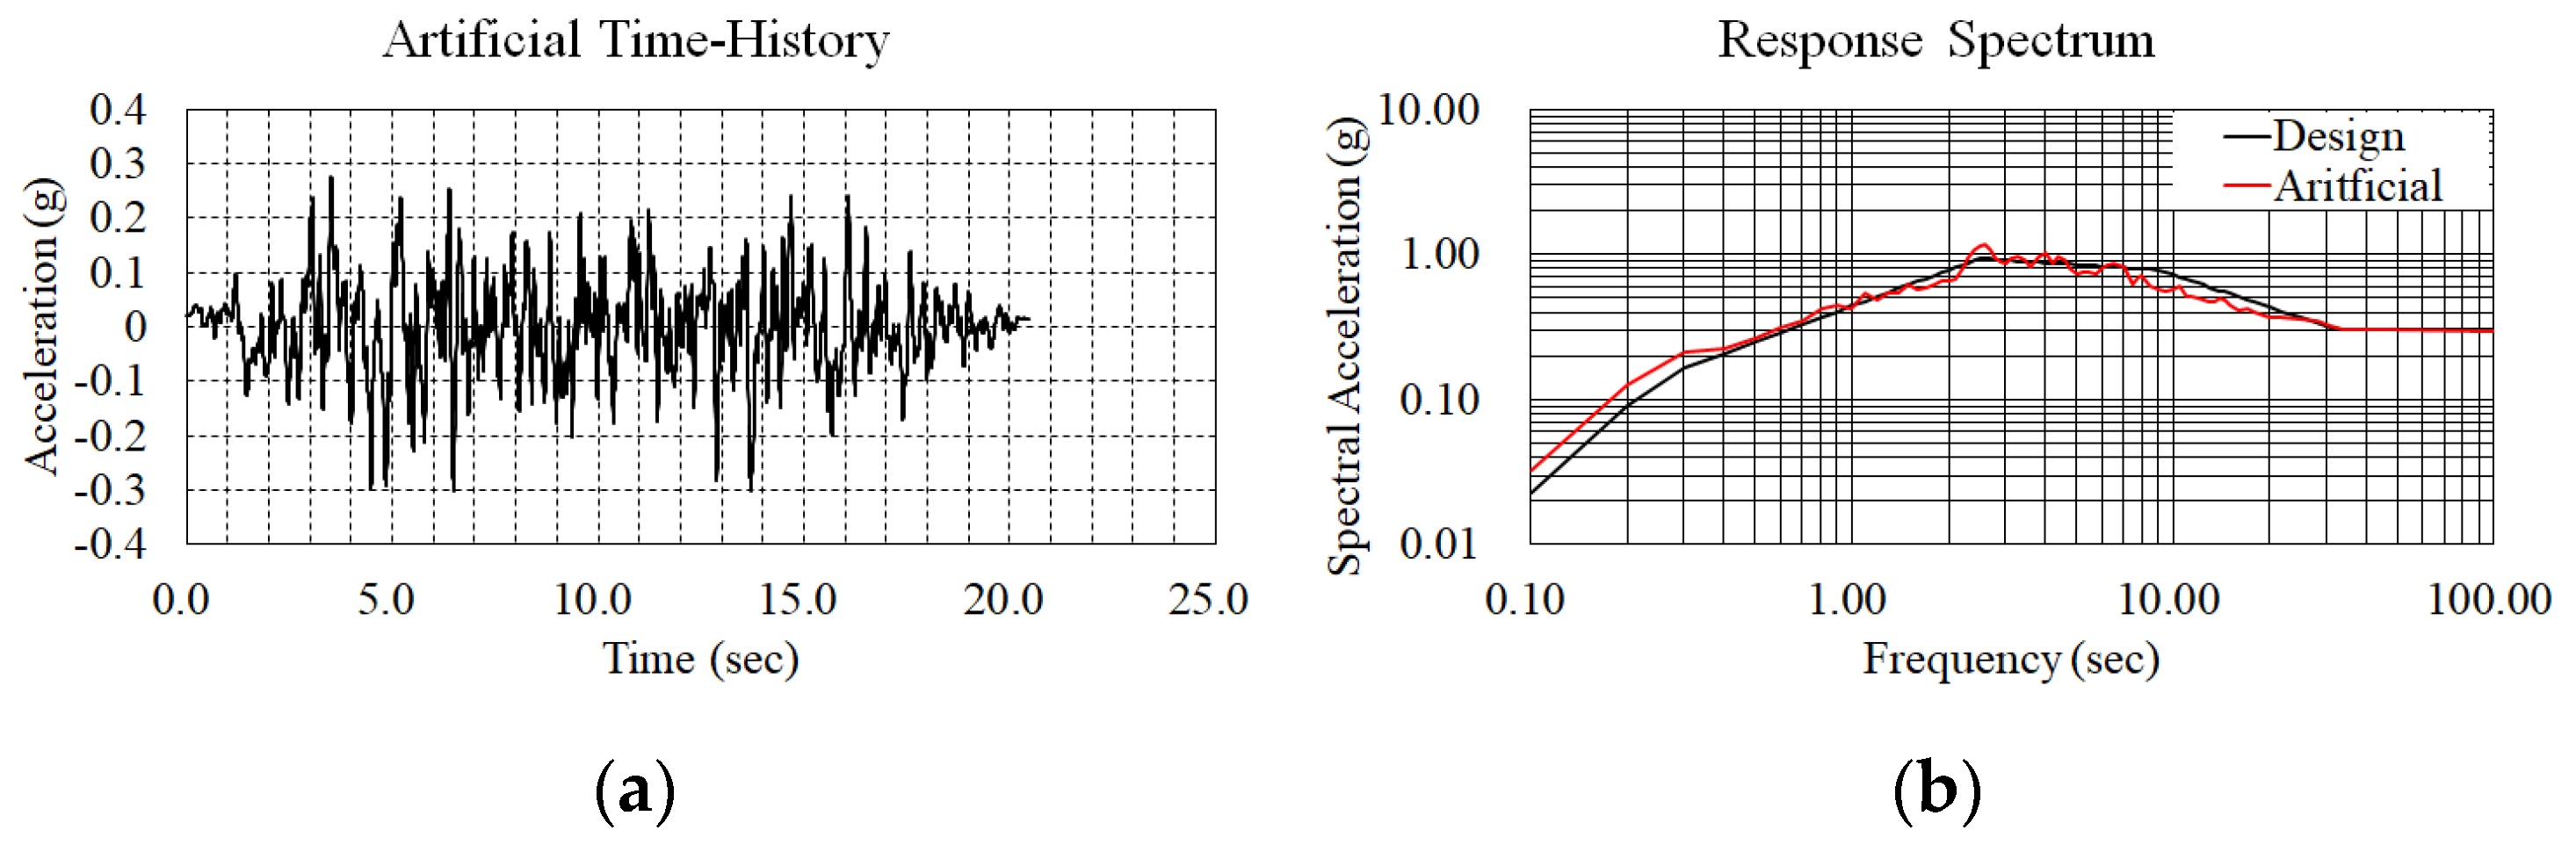
3.1. Artificial Seismic Load
3.2. Modified Artificial Seismic Load
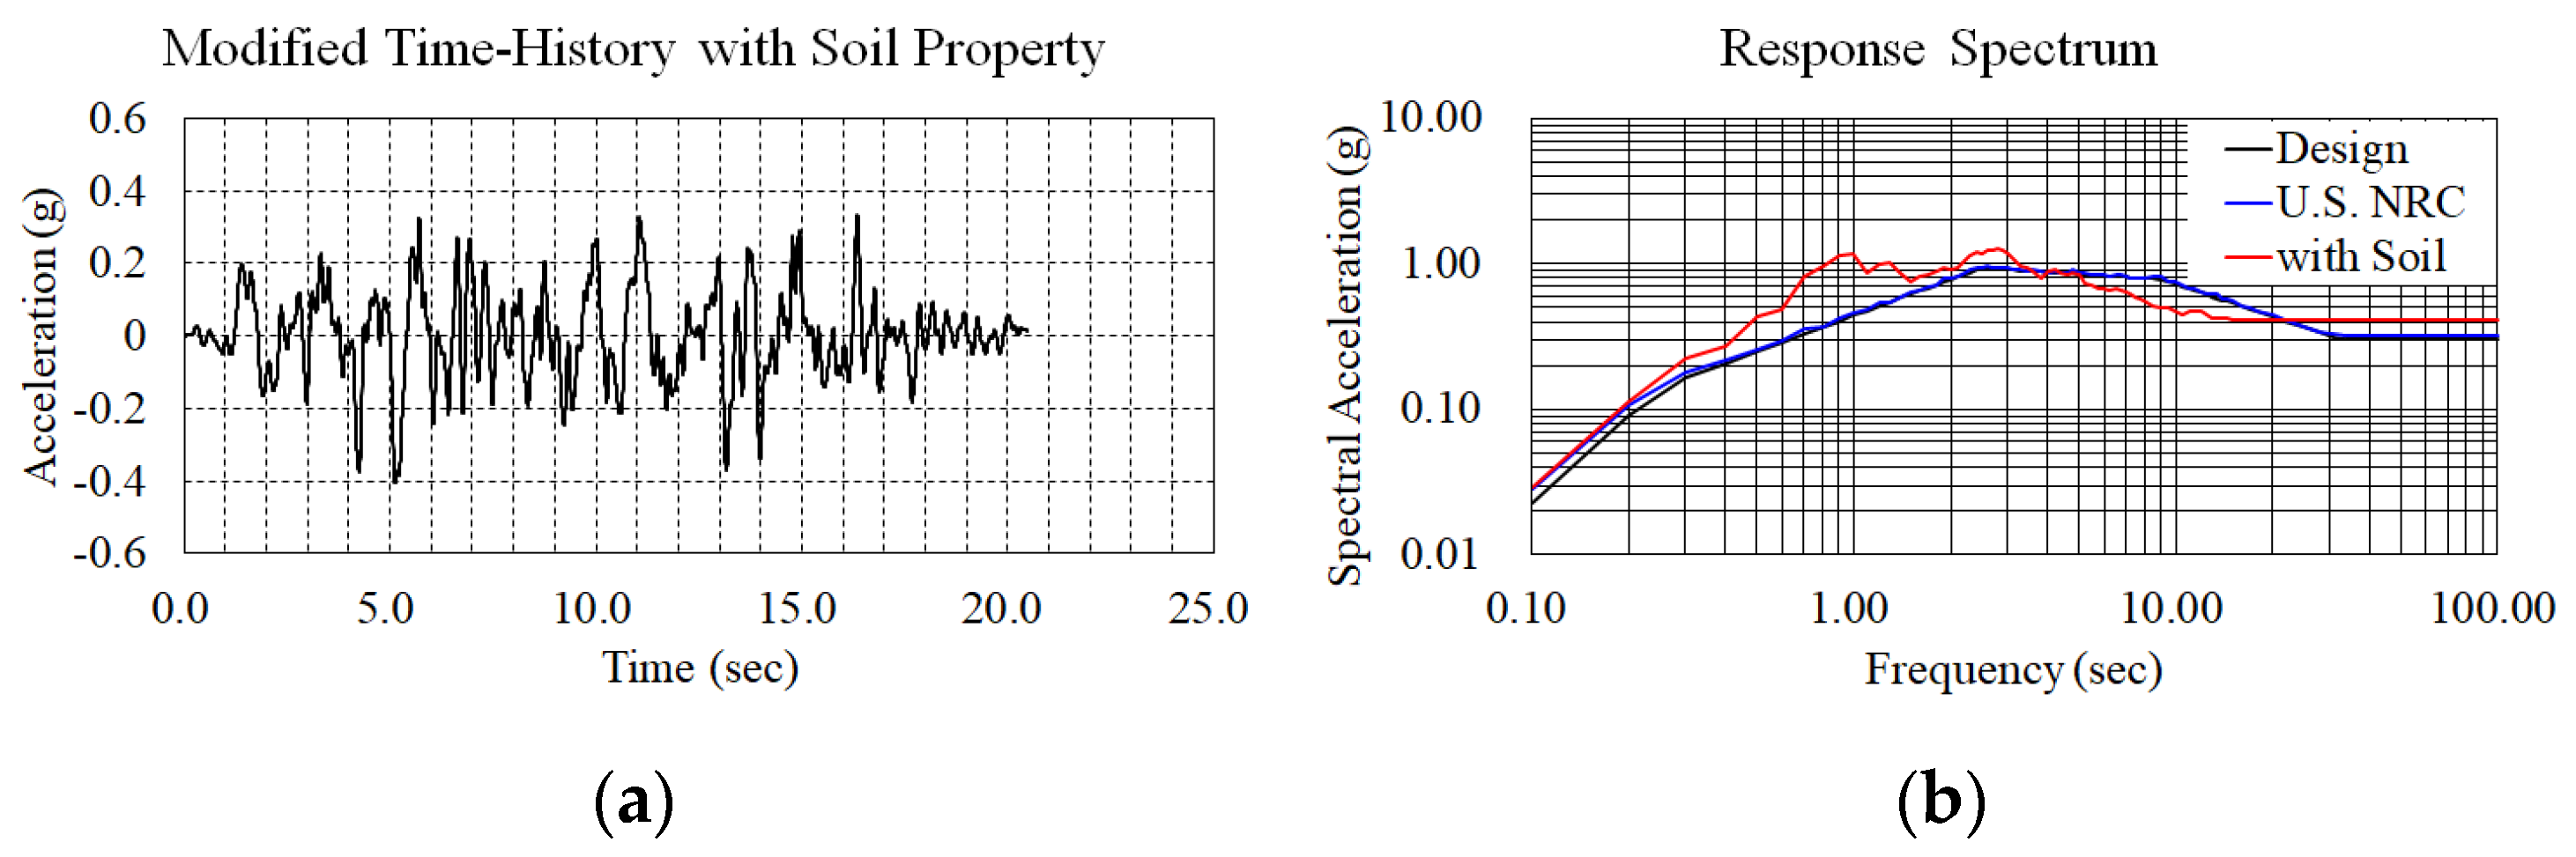
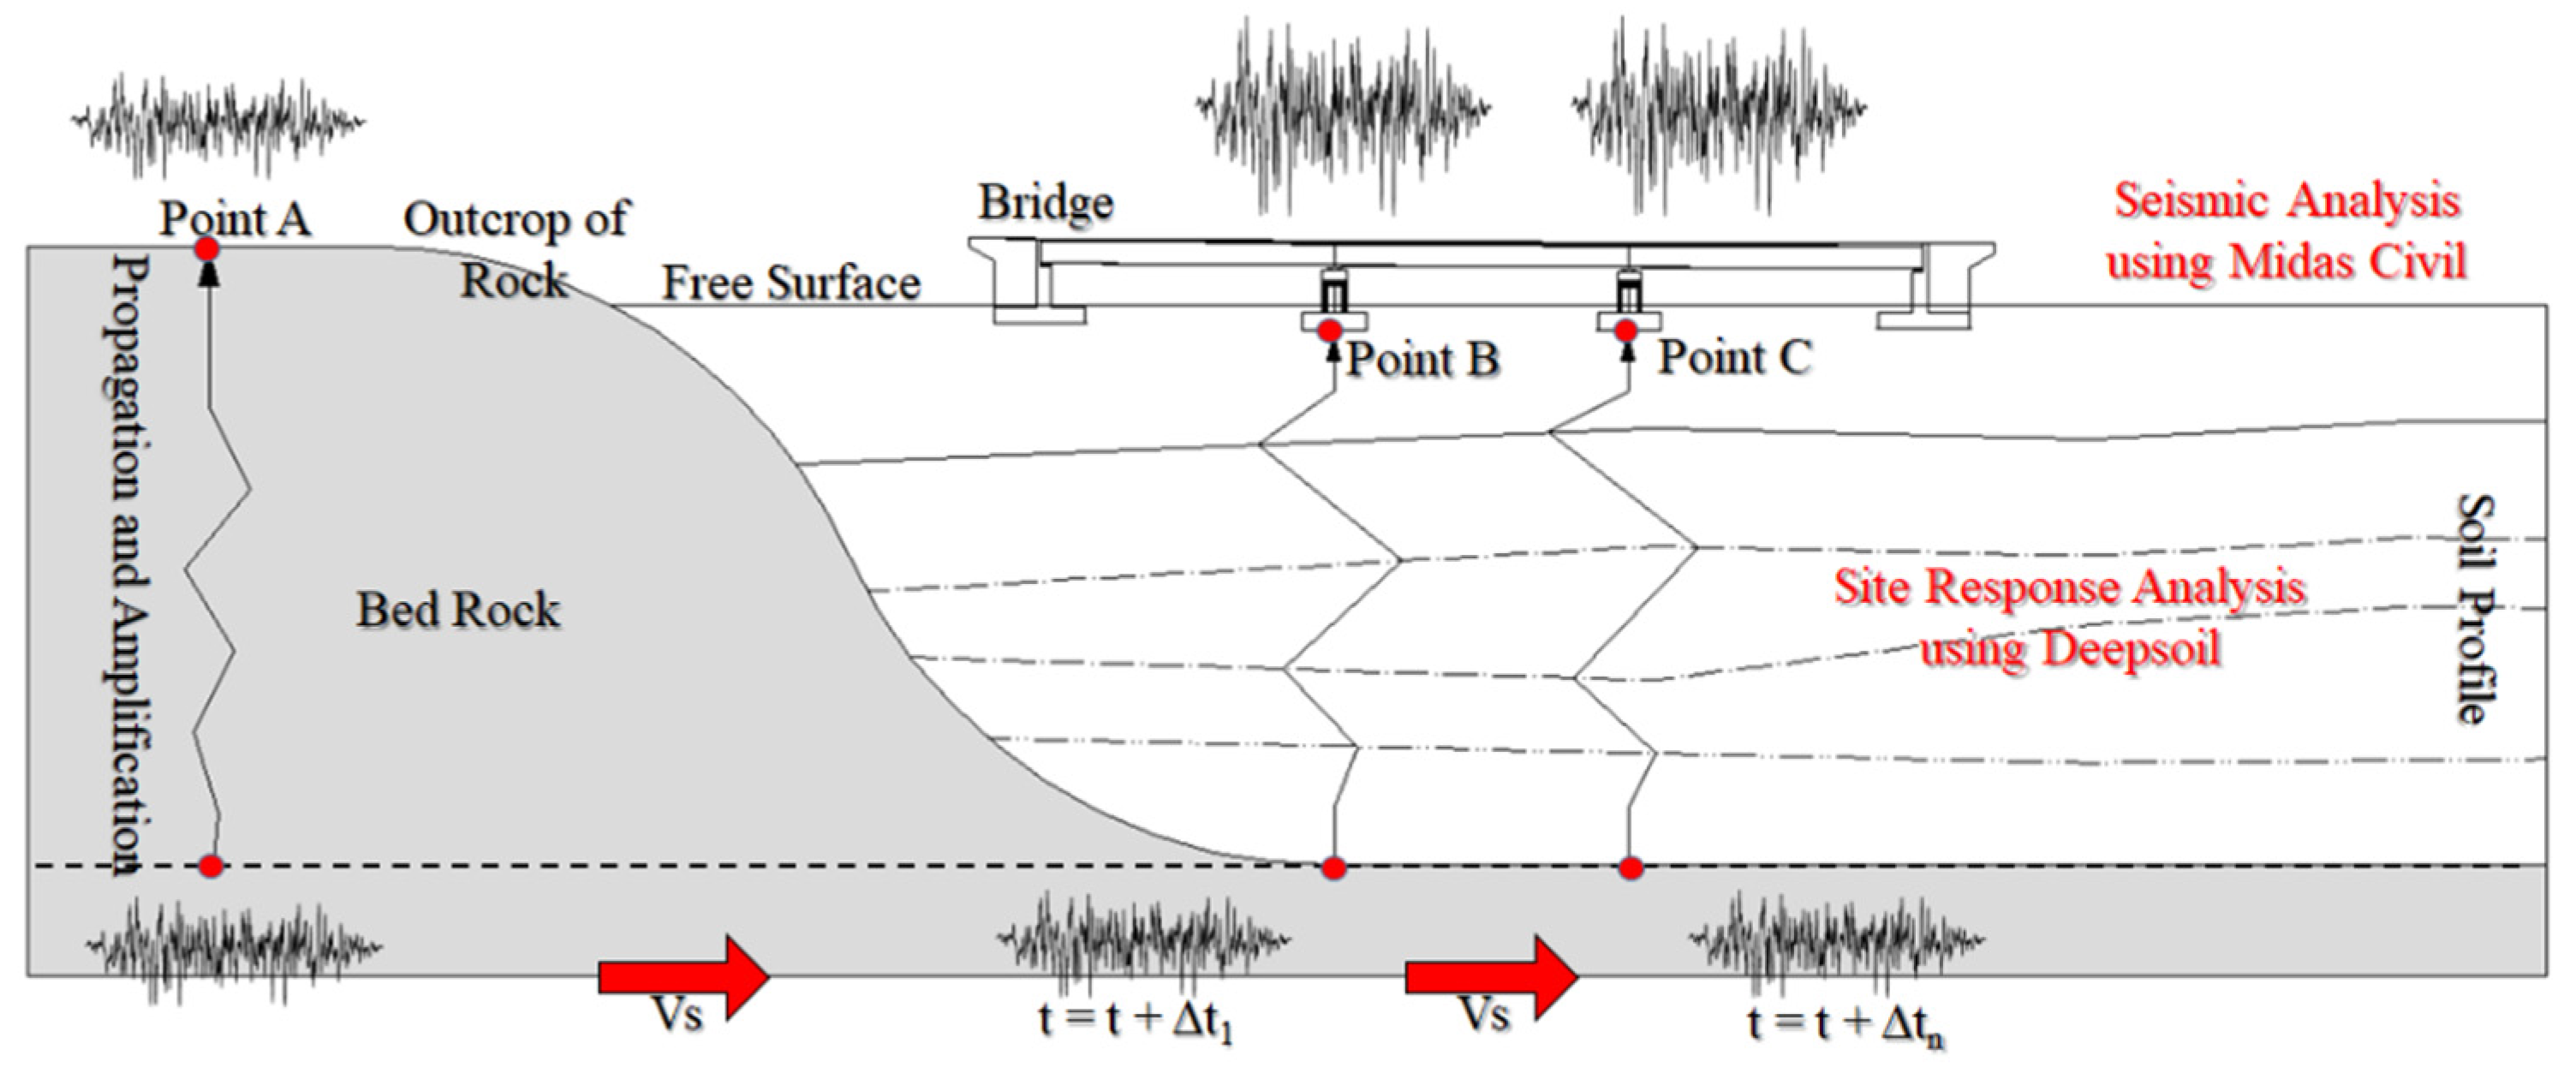
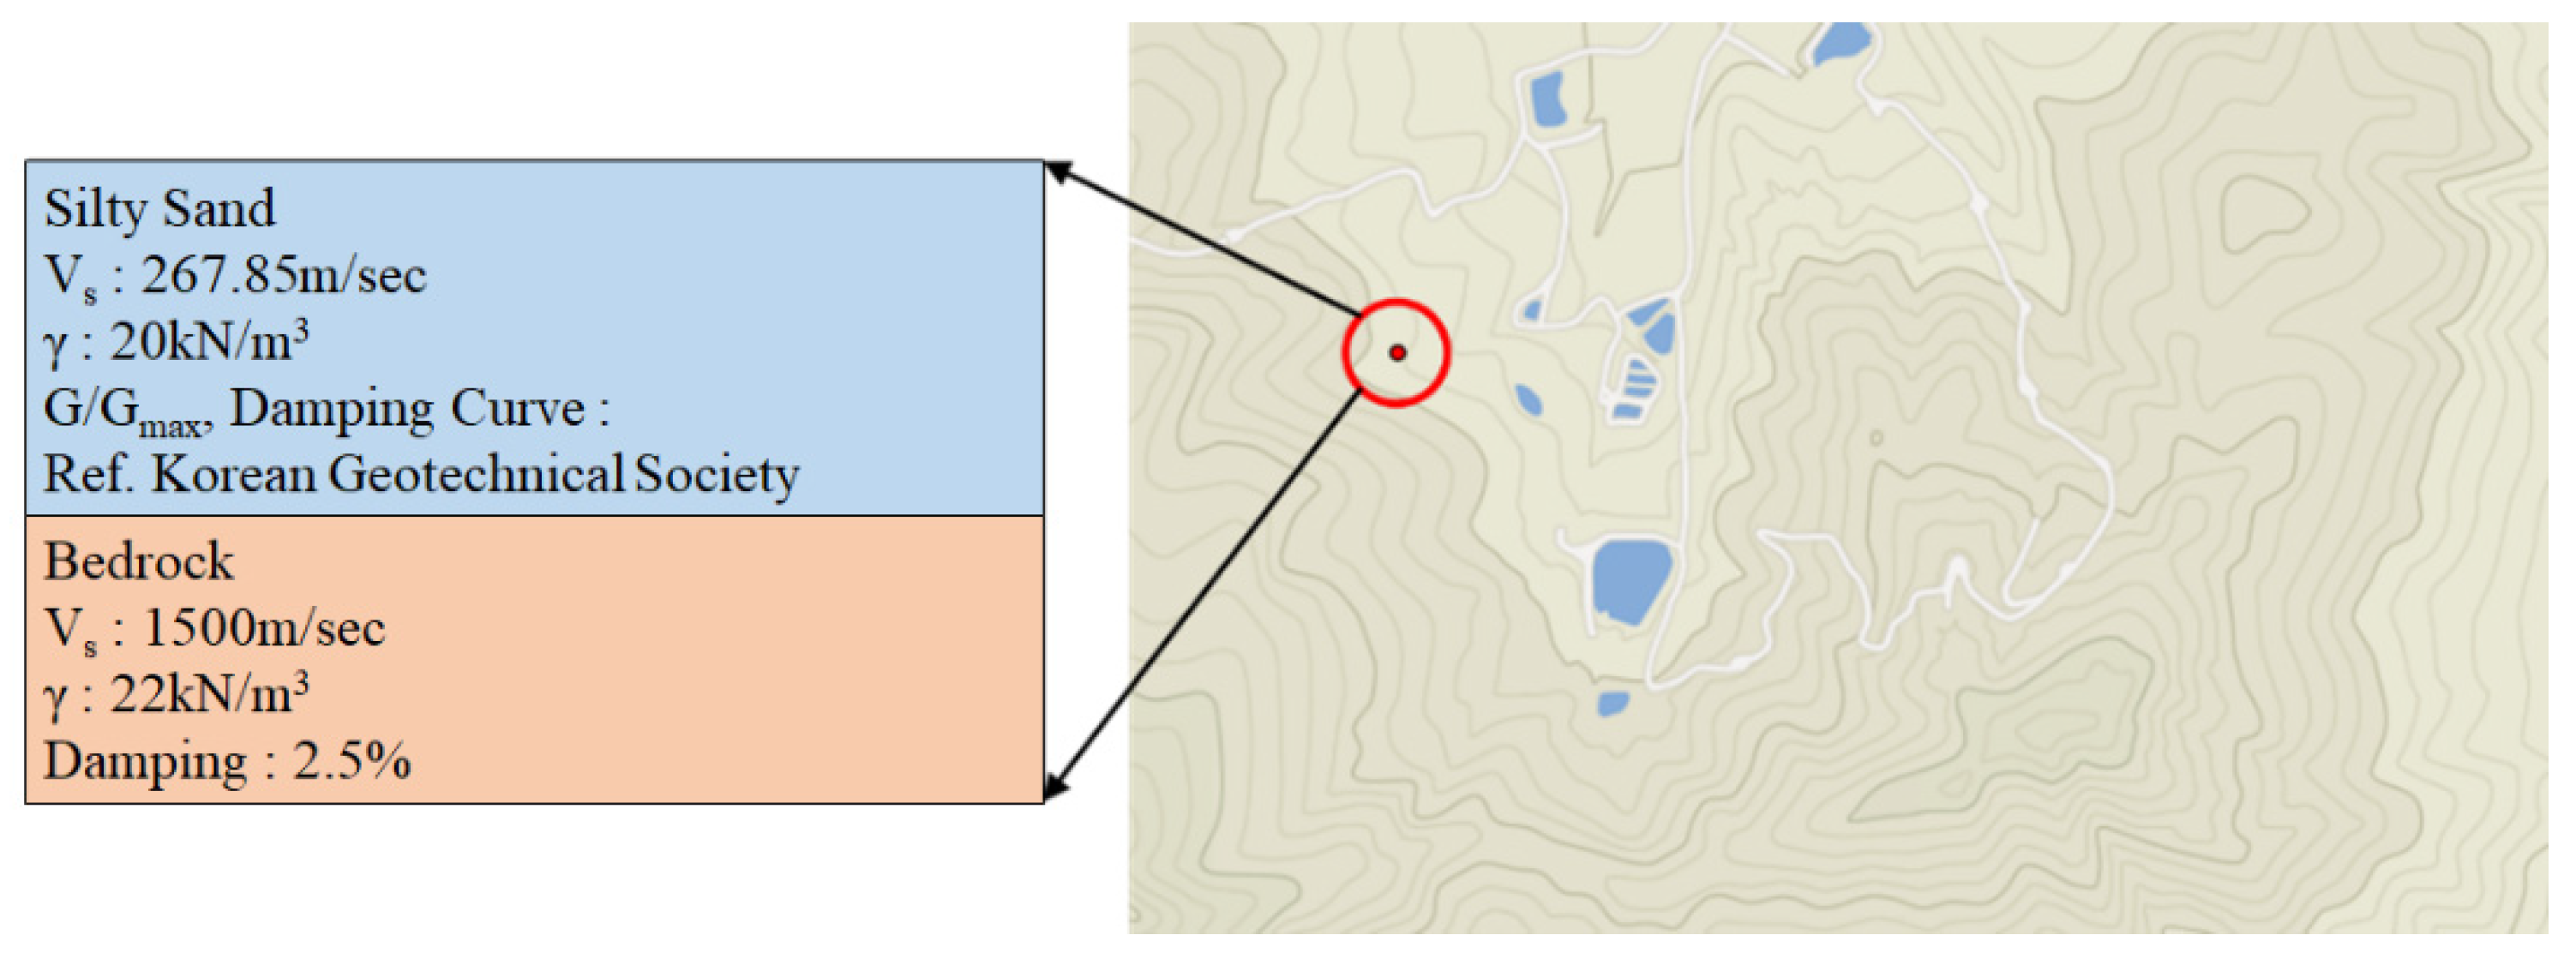
3.3. Modified Seismic Load Considering Soil Properties
4. Discussion
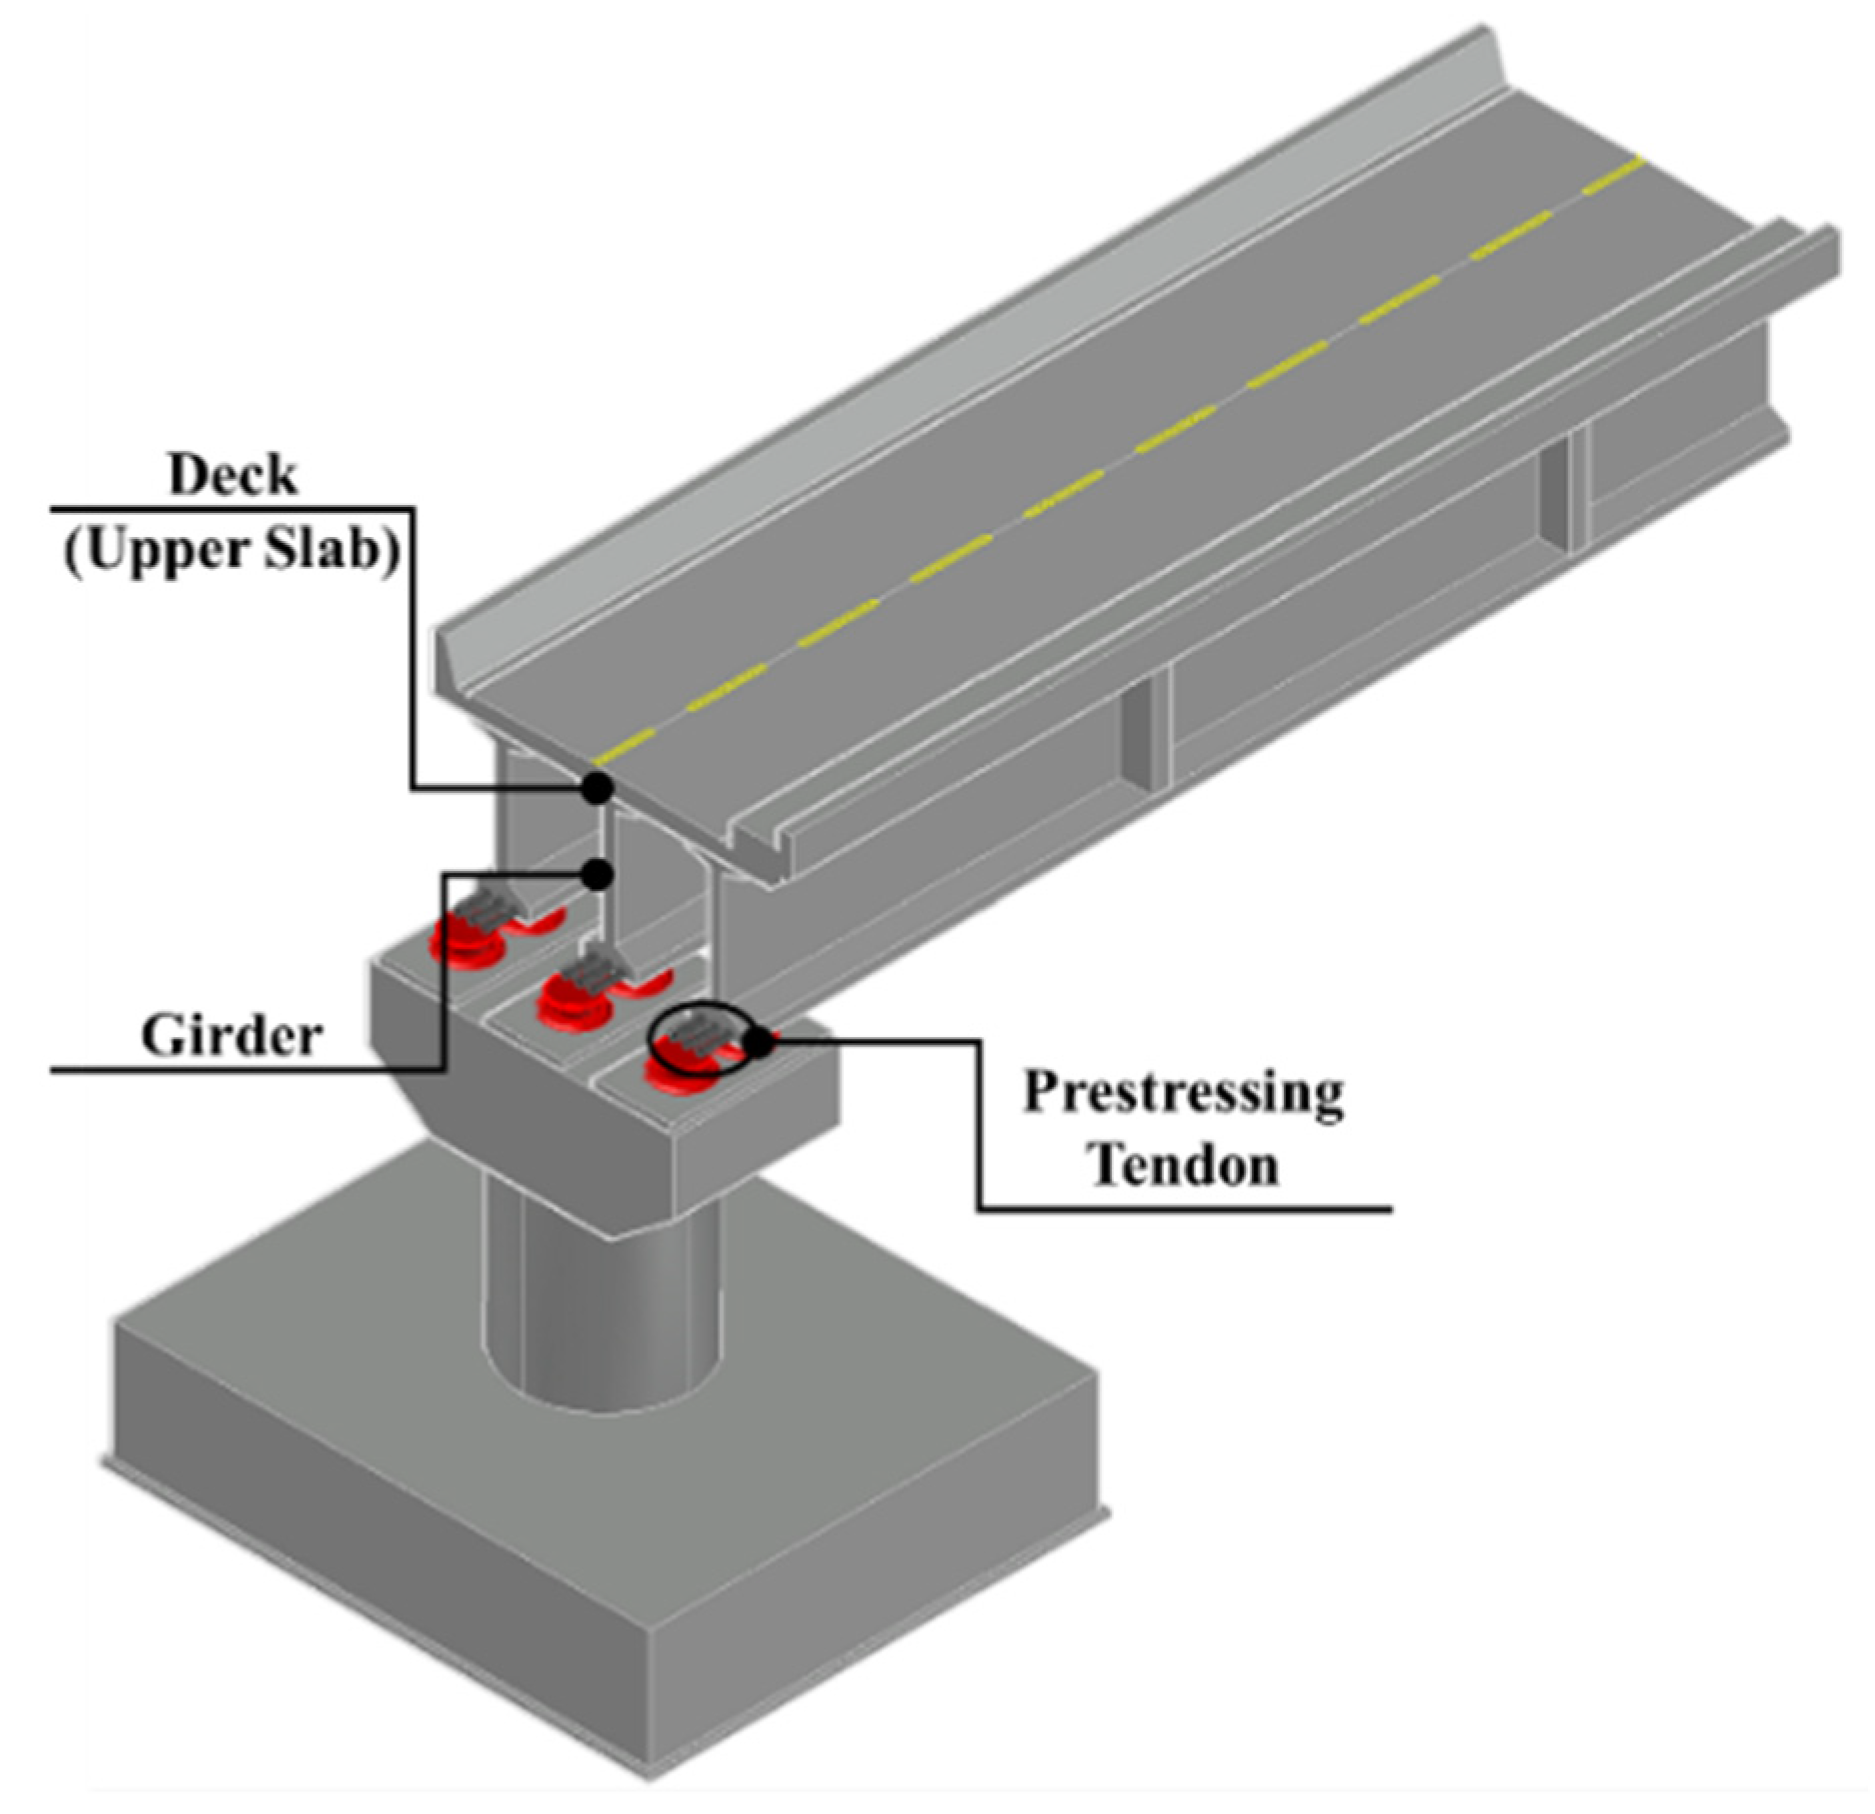
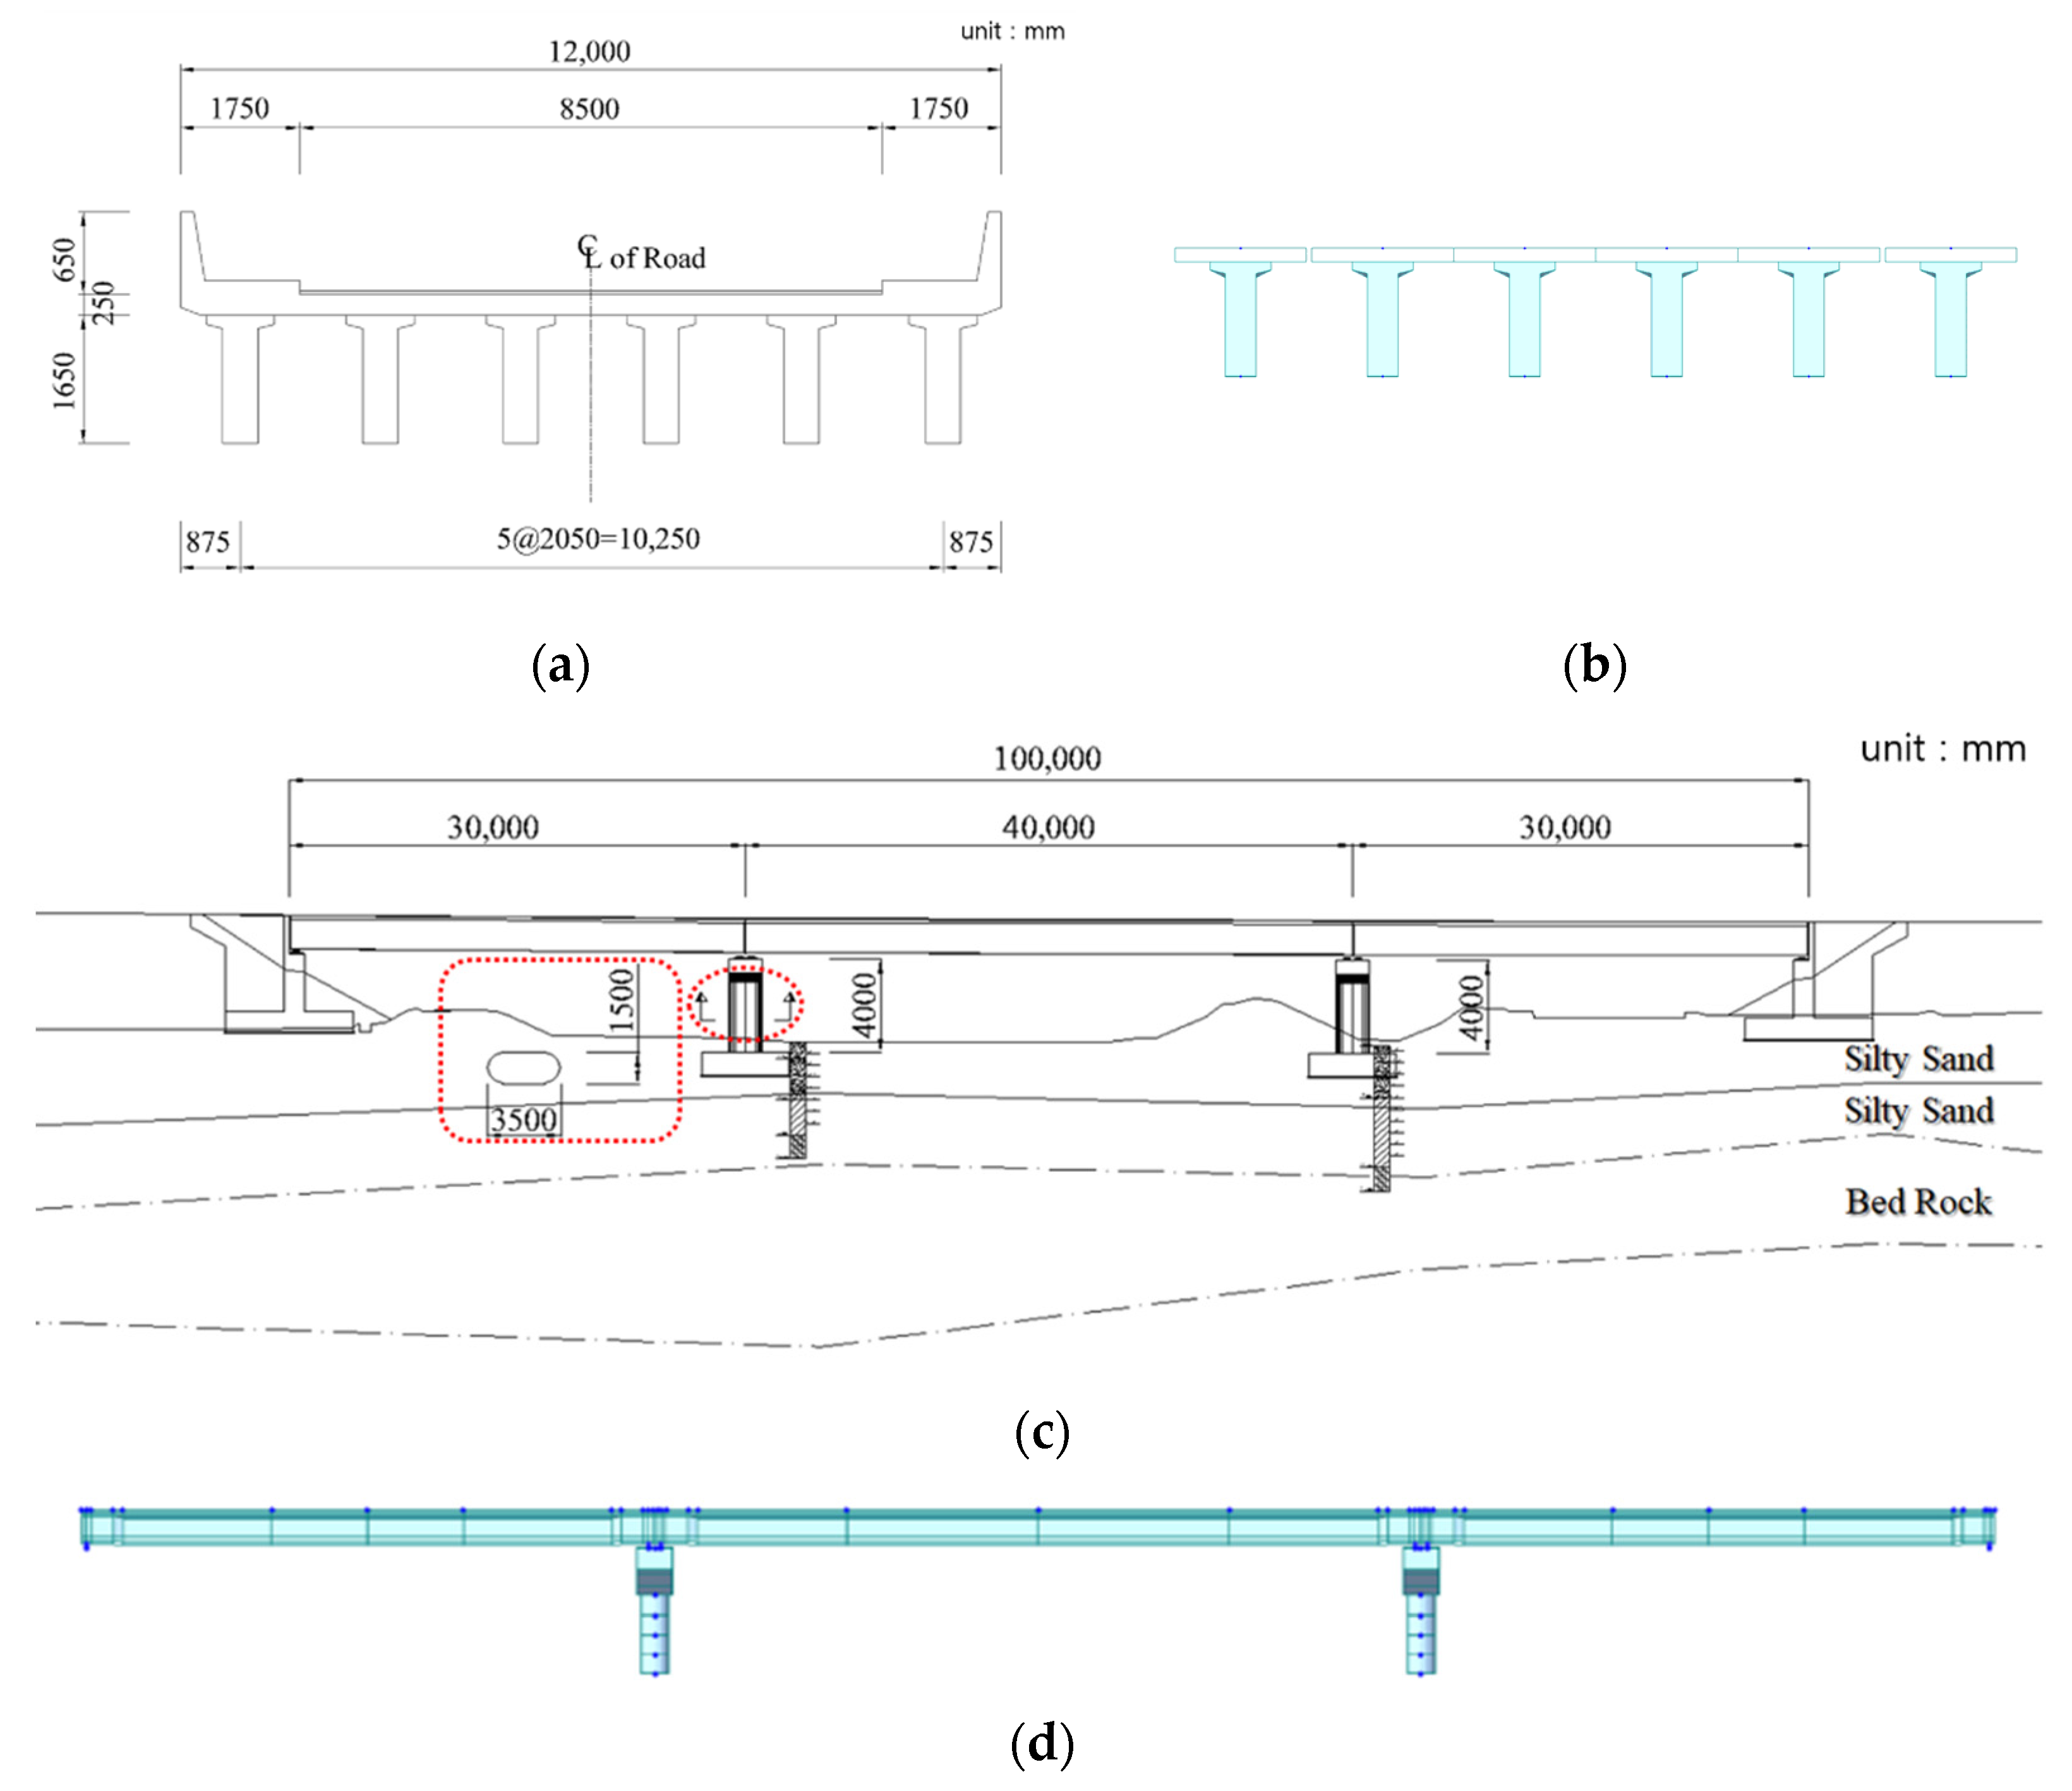
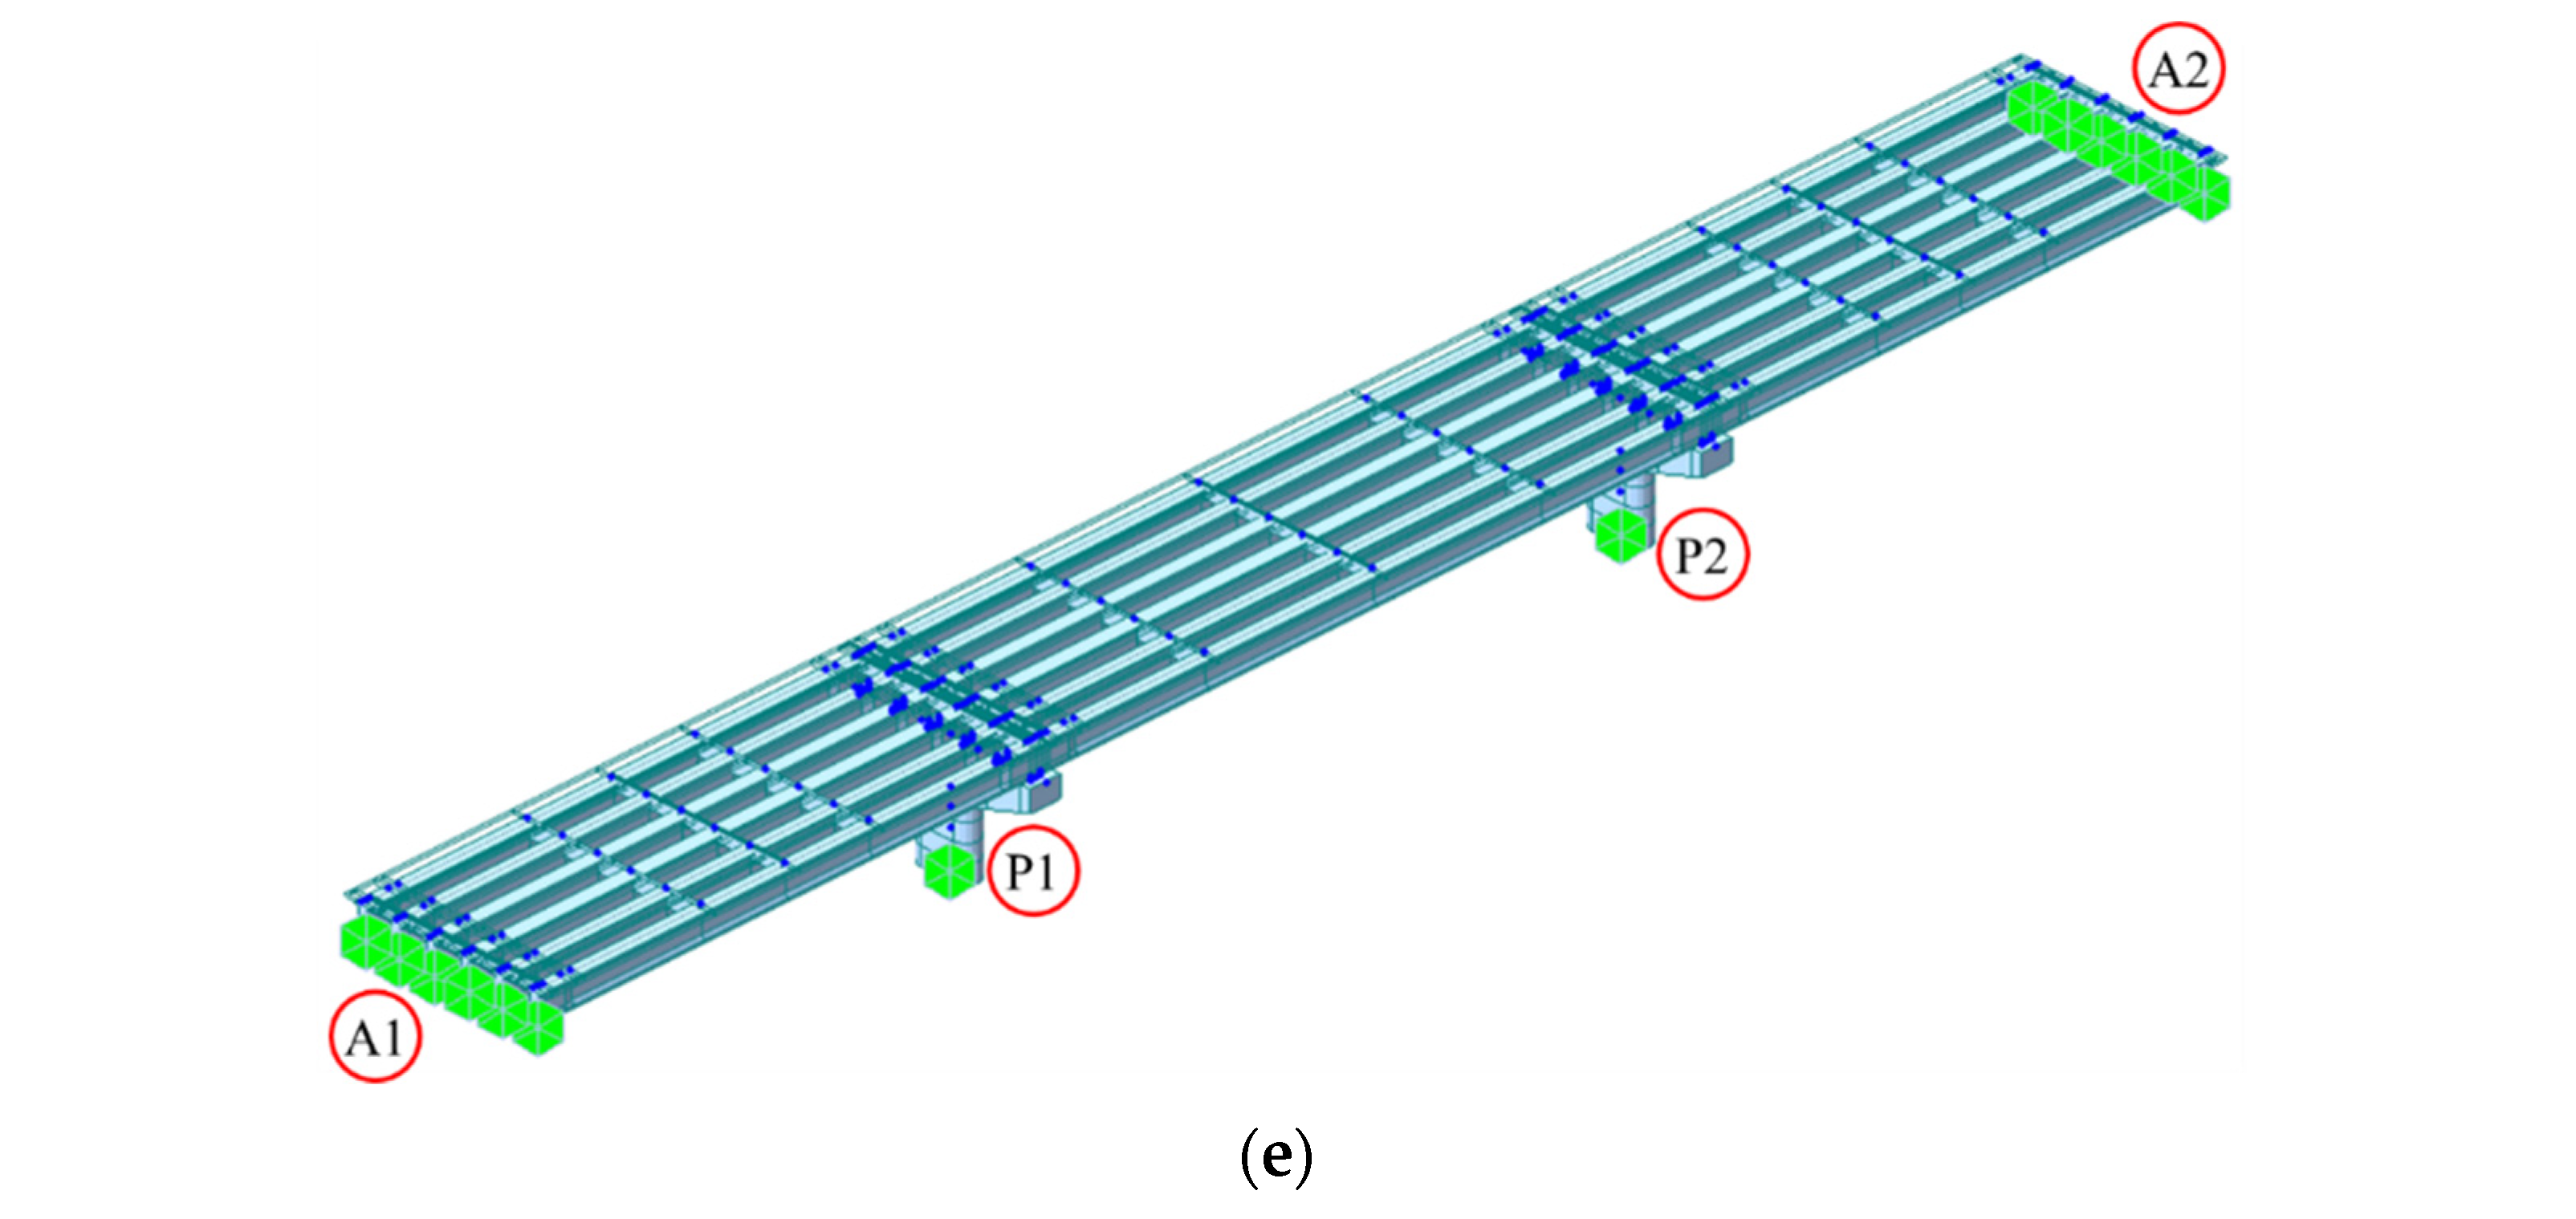
4.1. FE Model for the PSC Girder Bridge
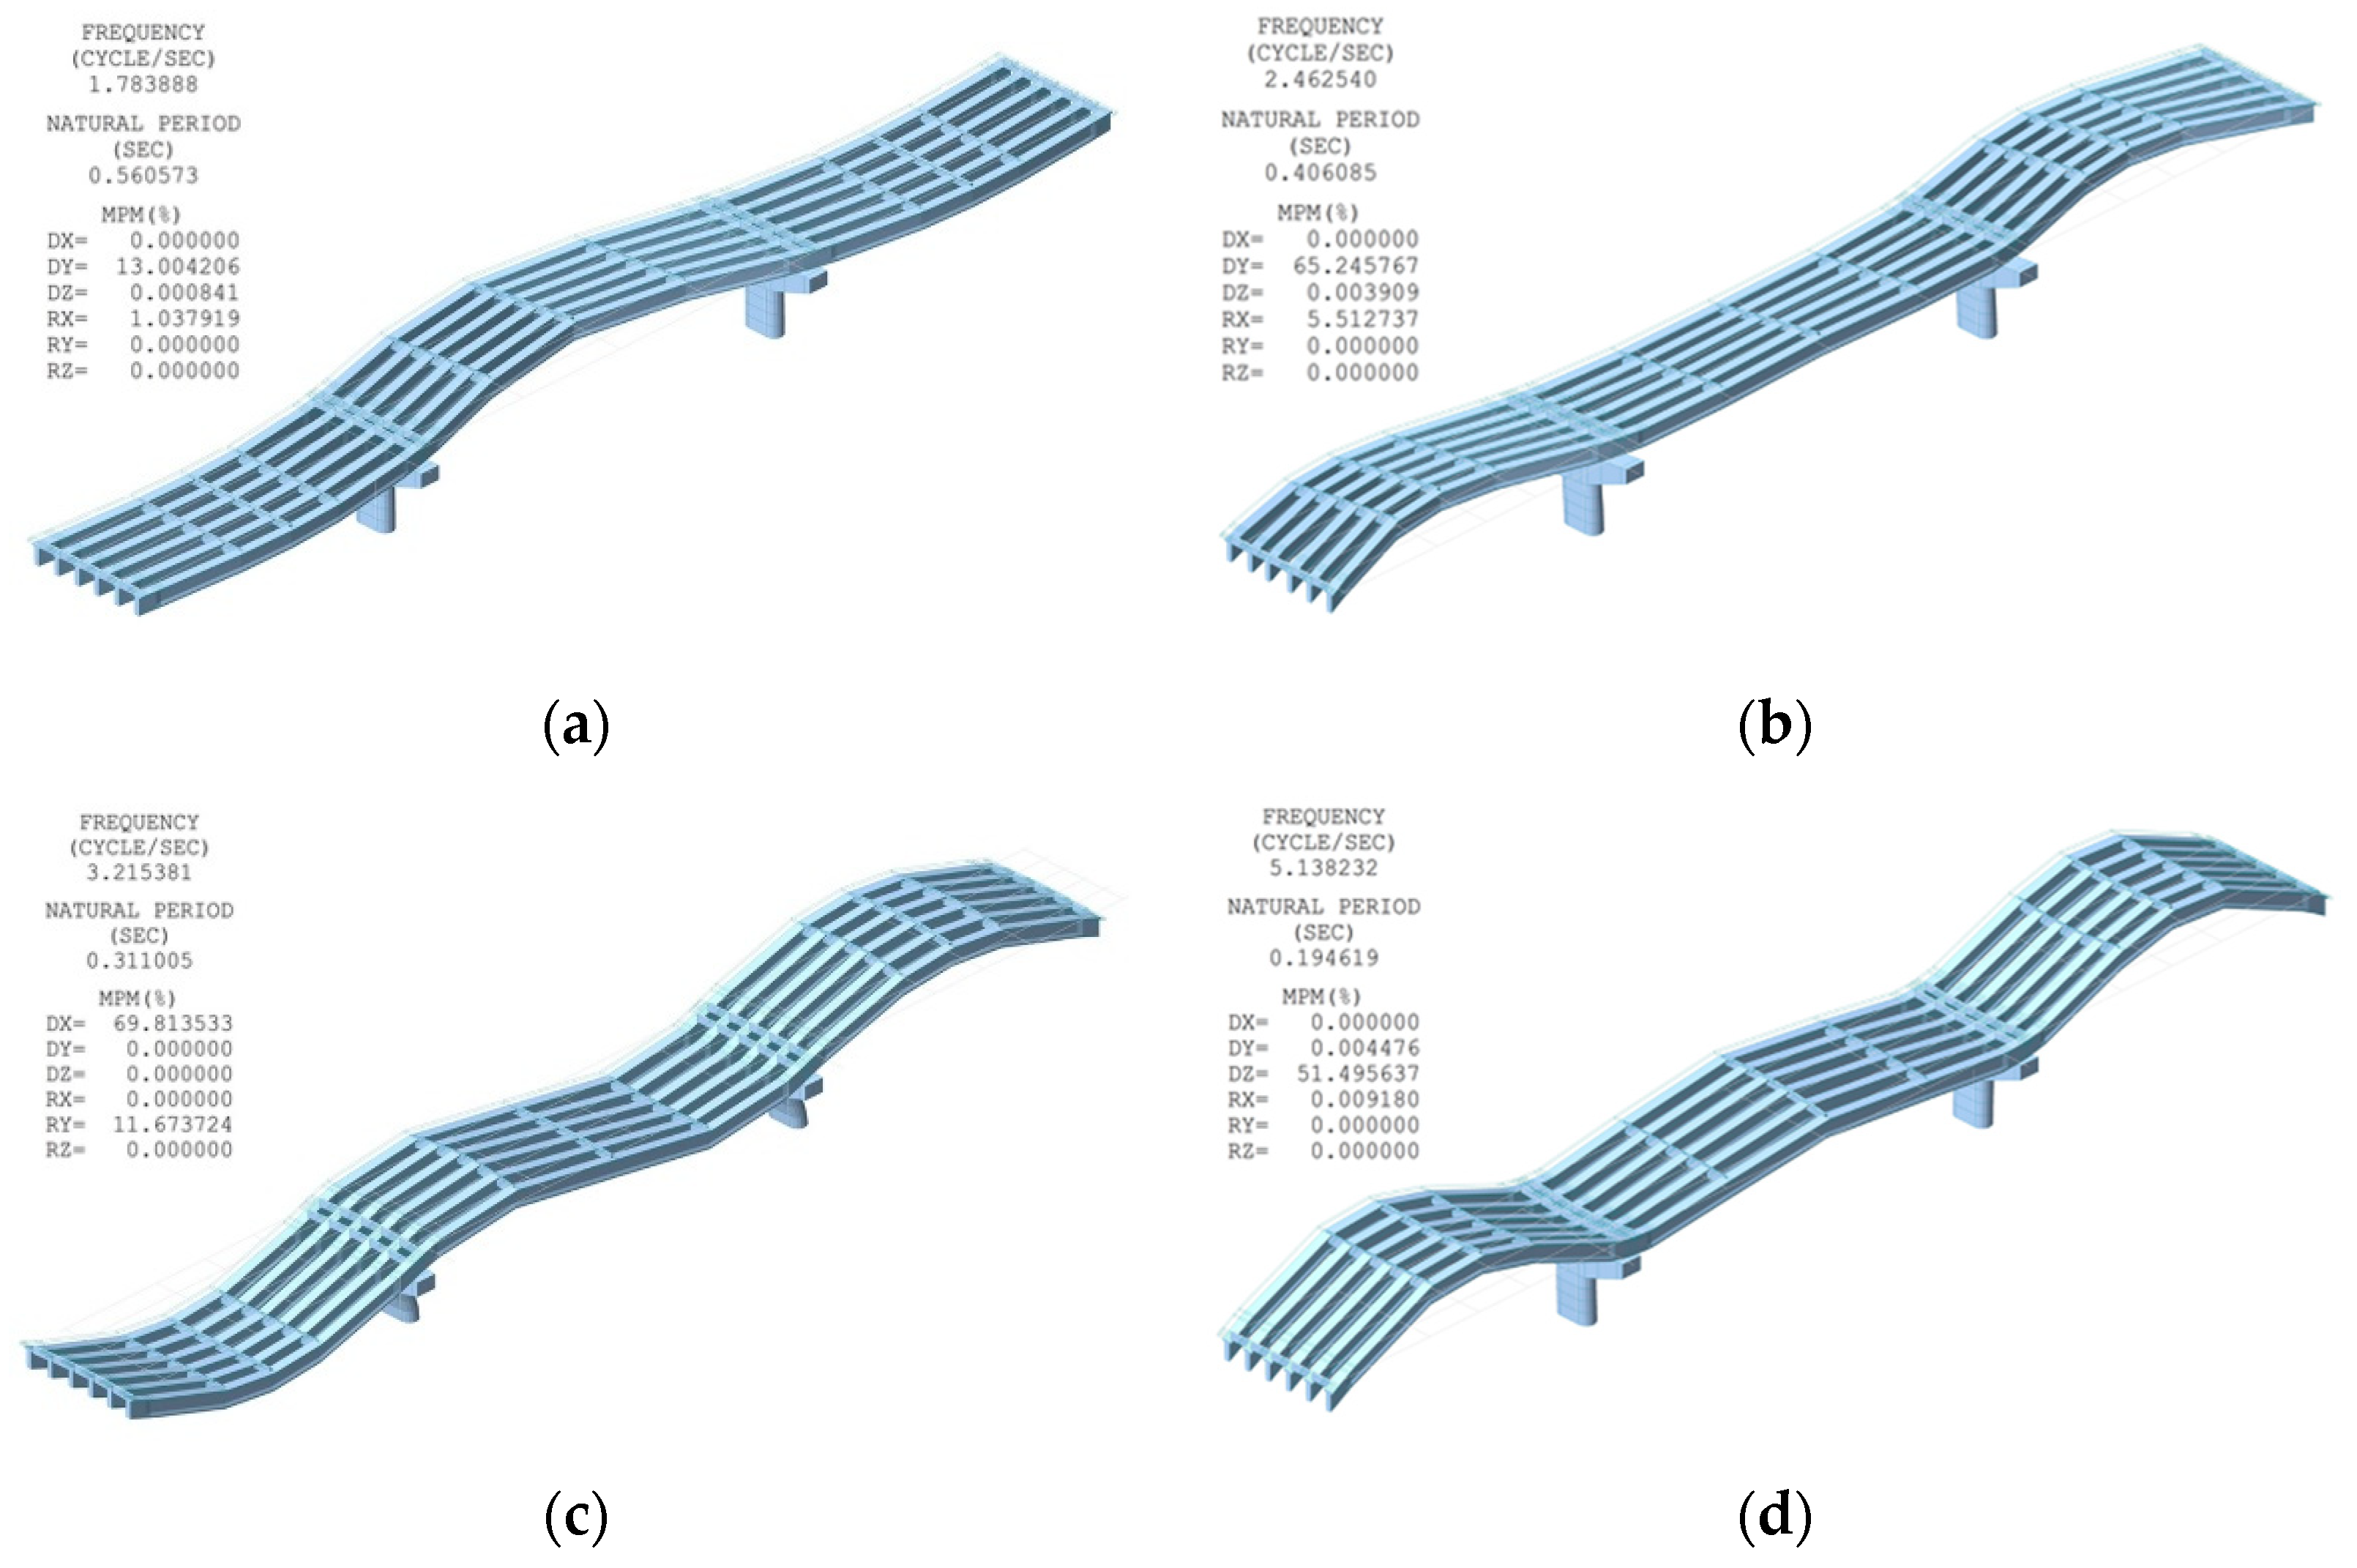
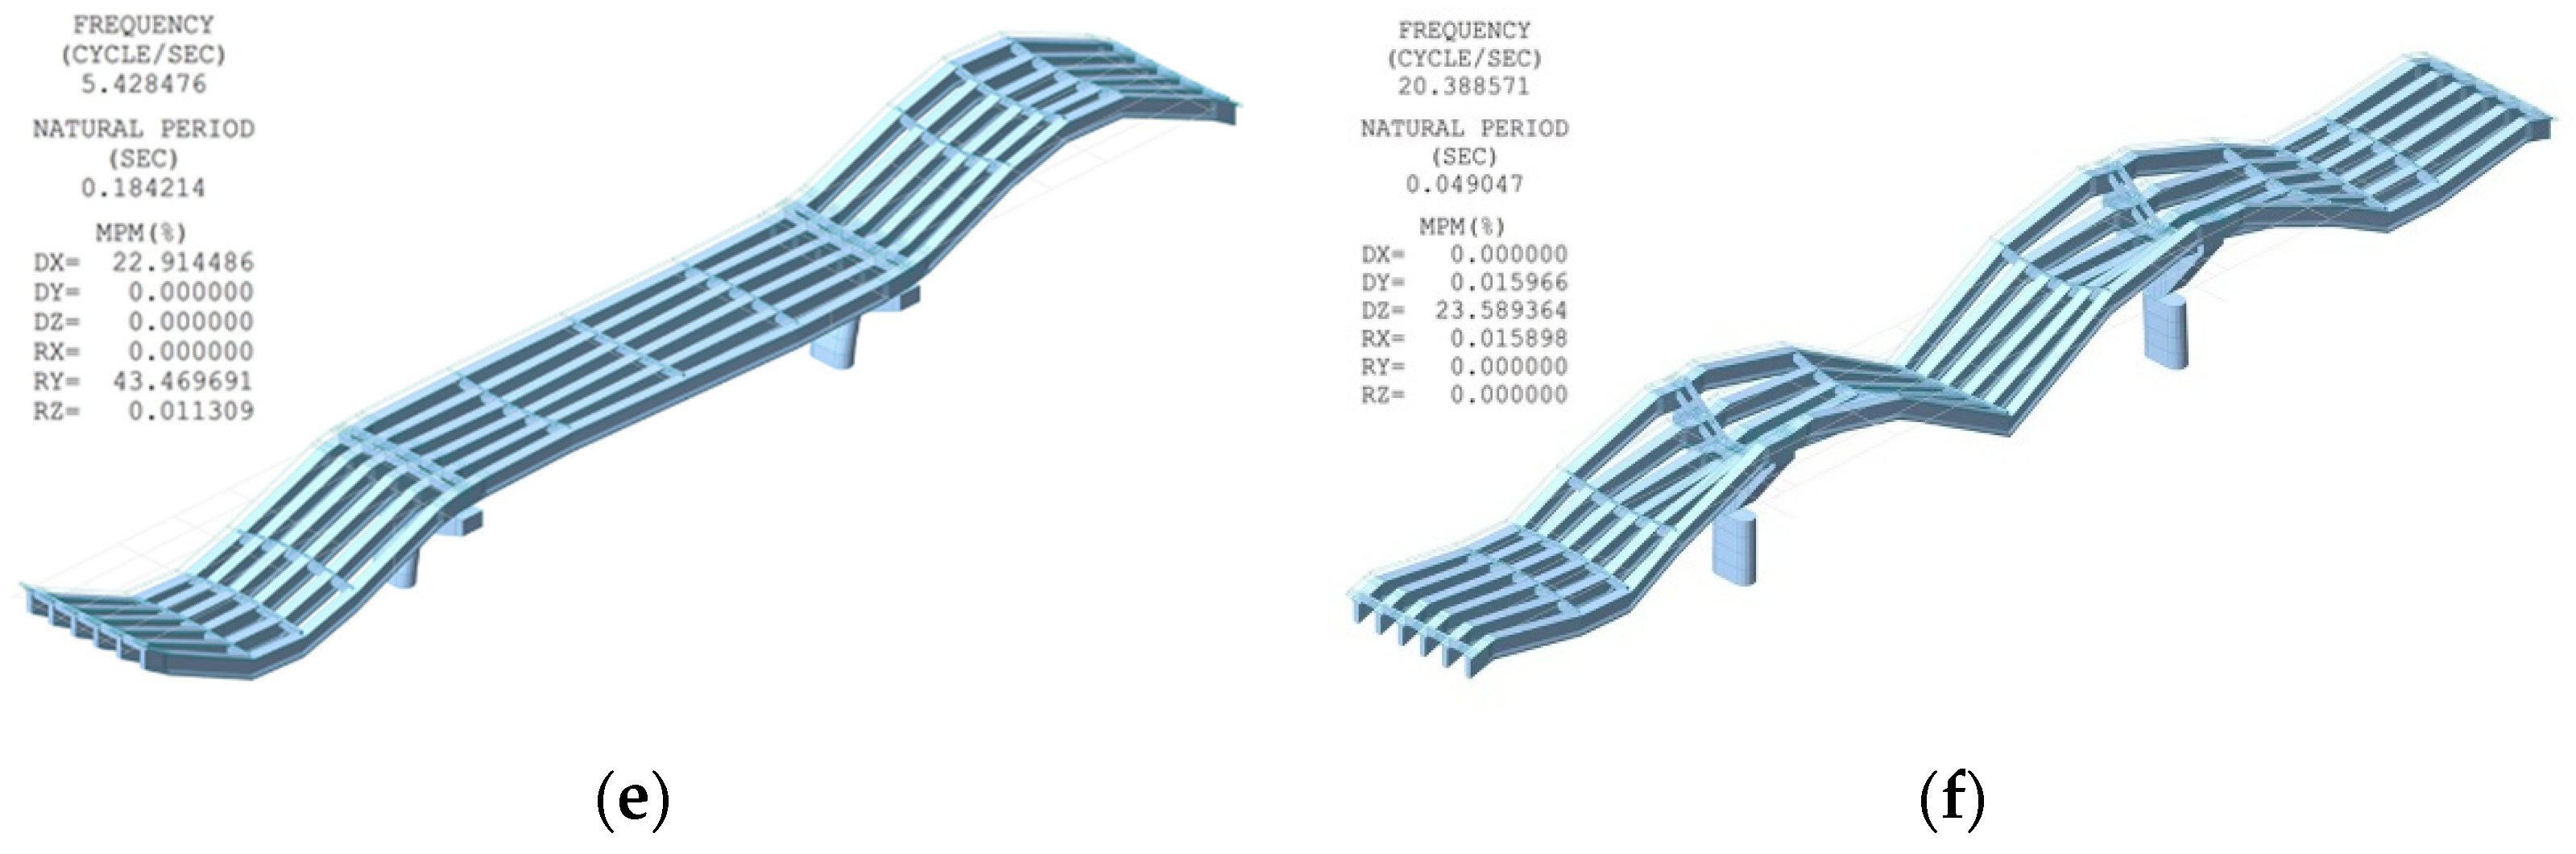
4.2. Modal Analysis of the PSC Girder Bridge
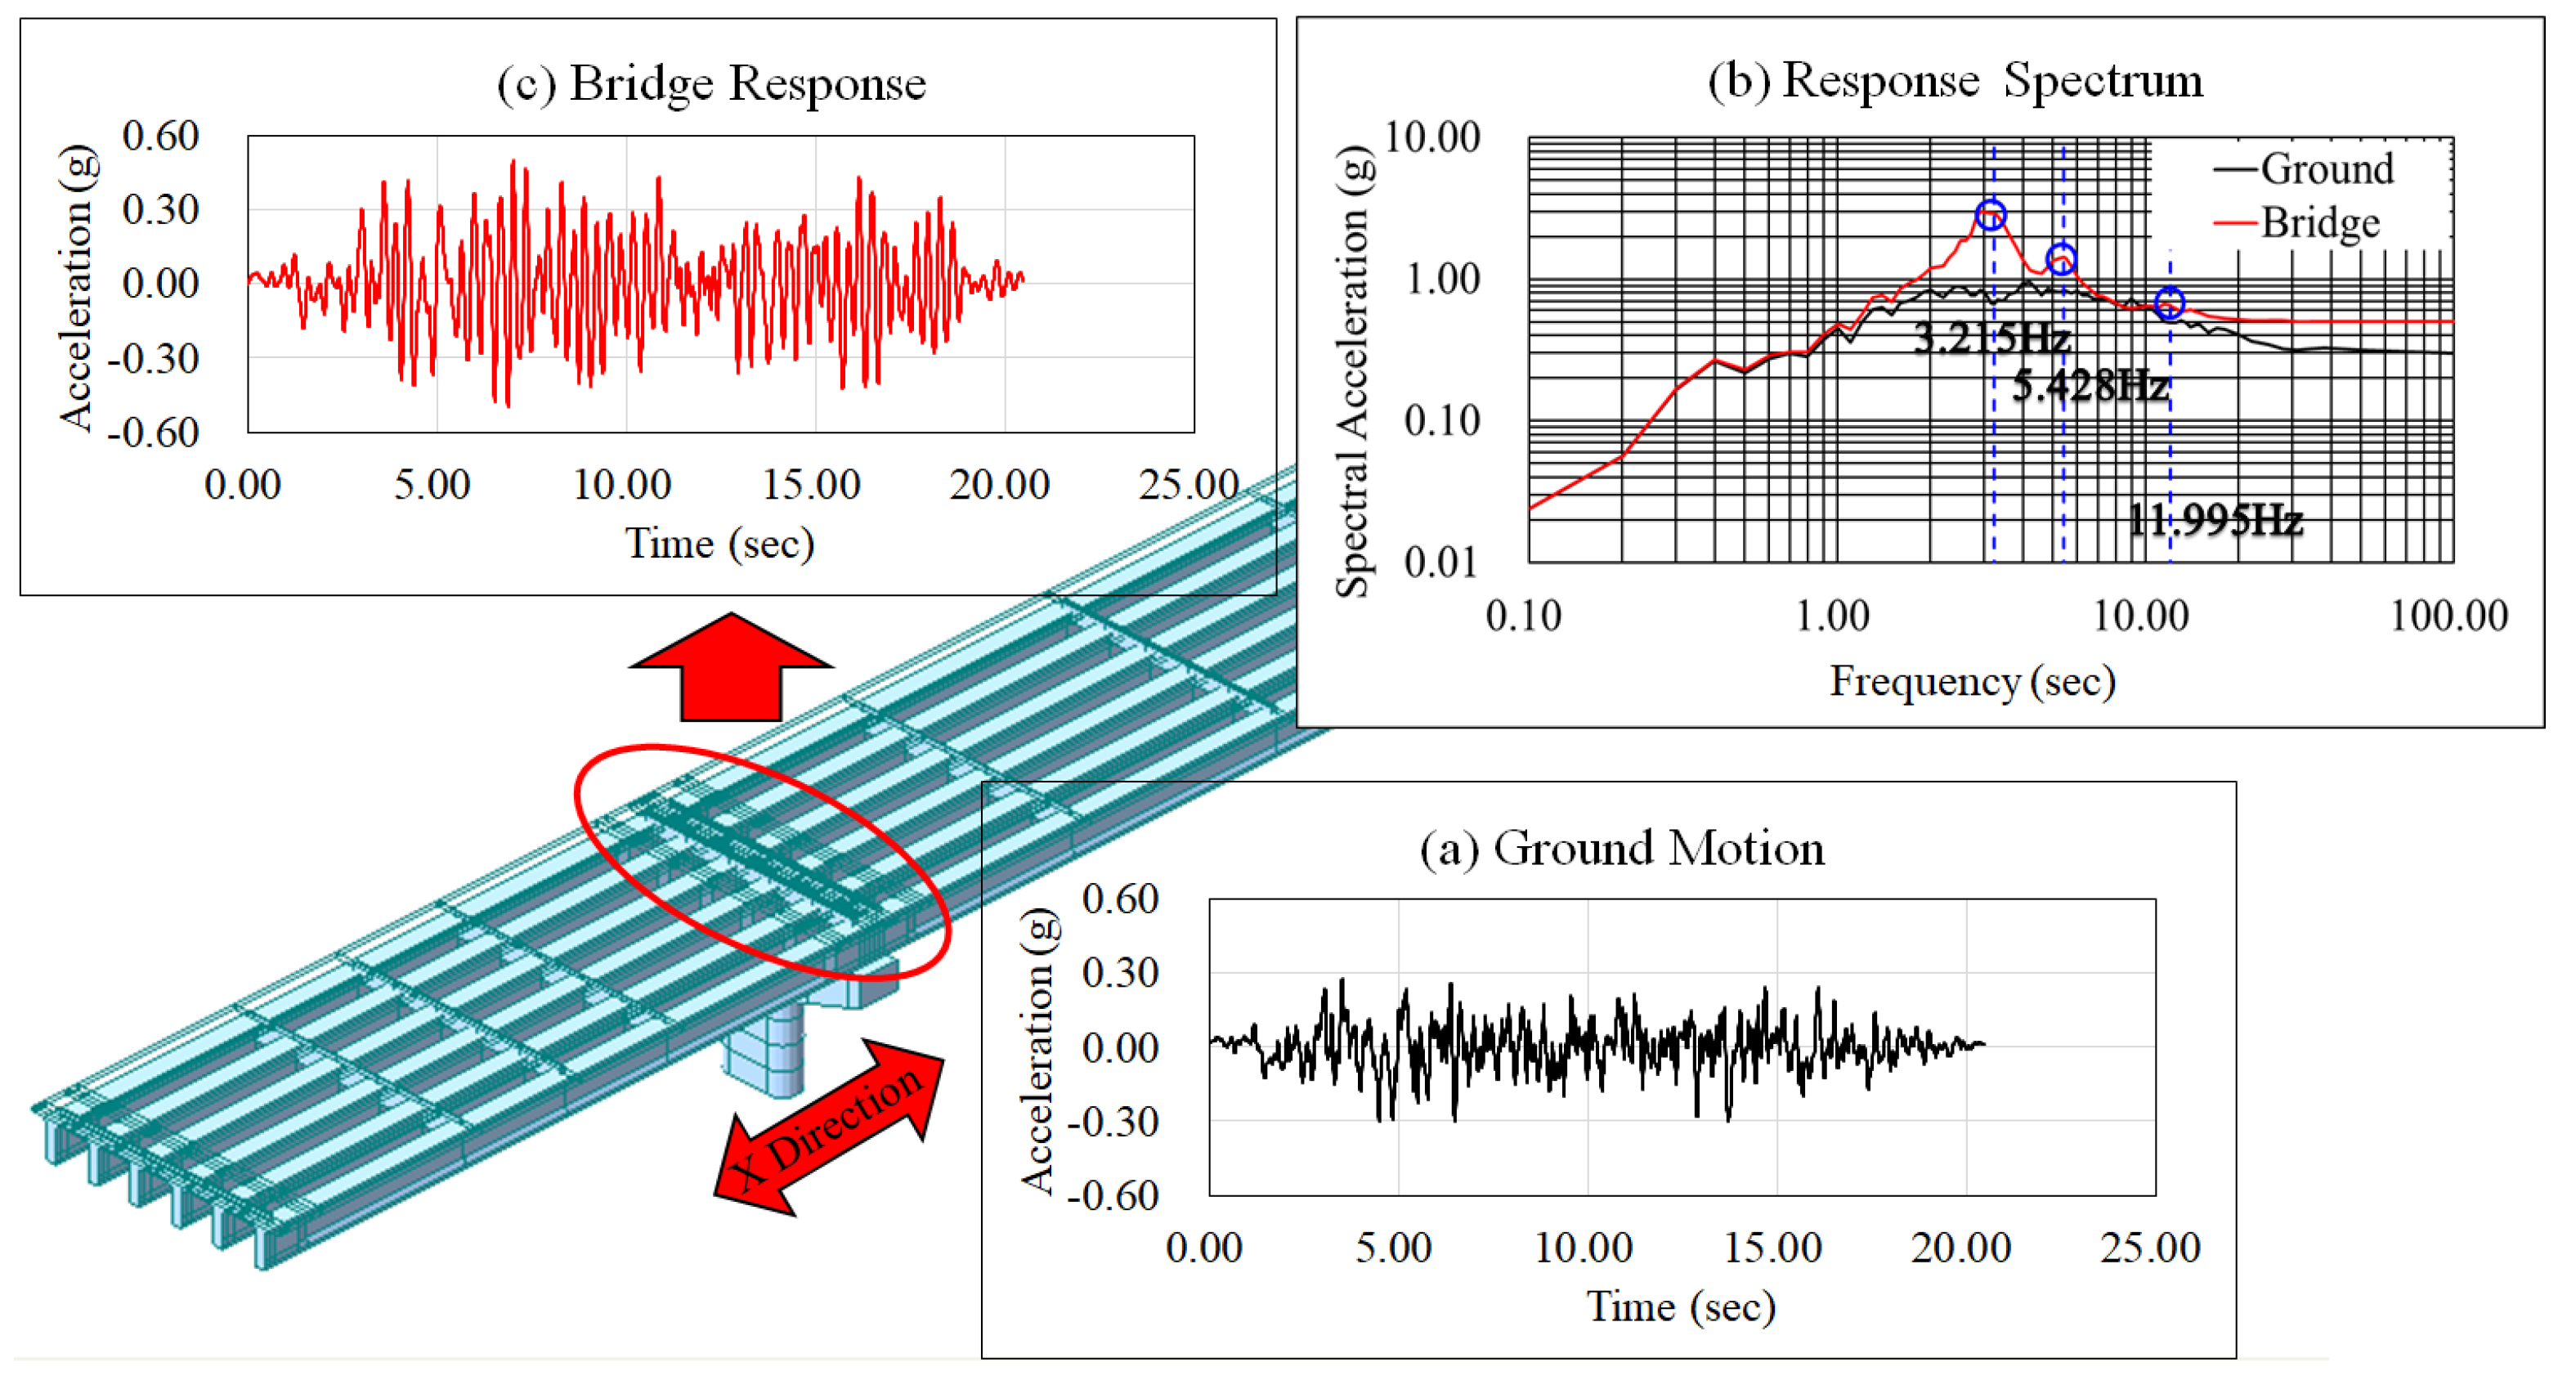
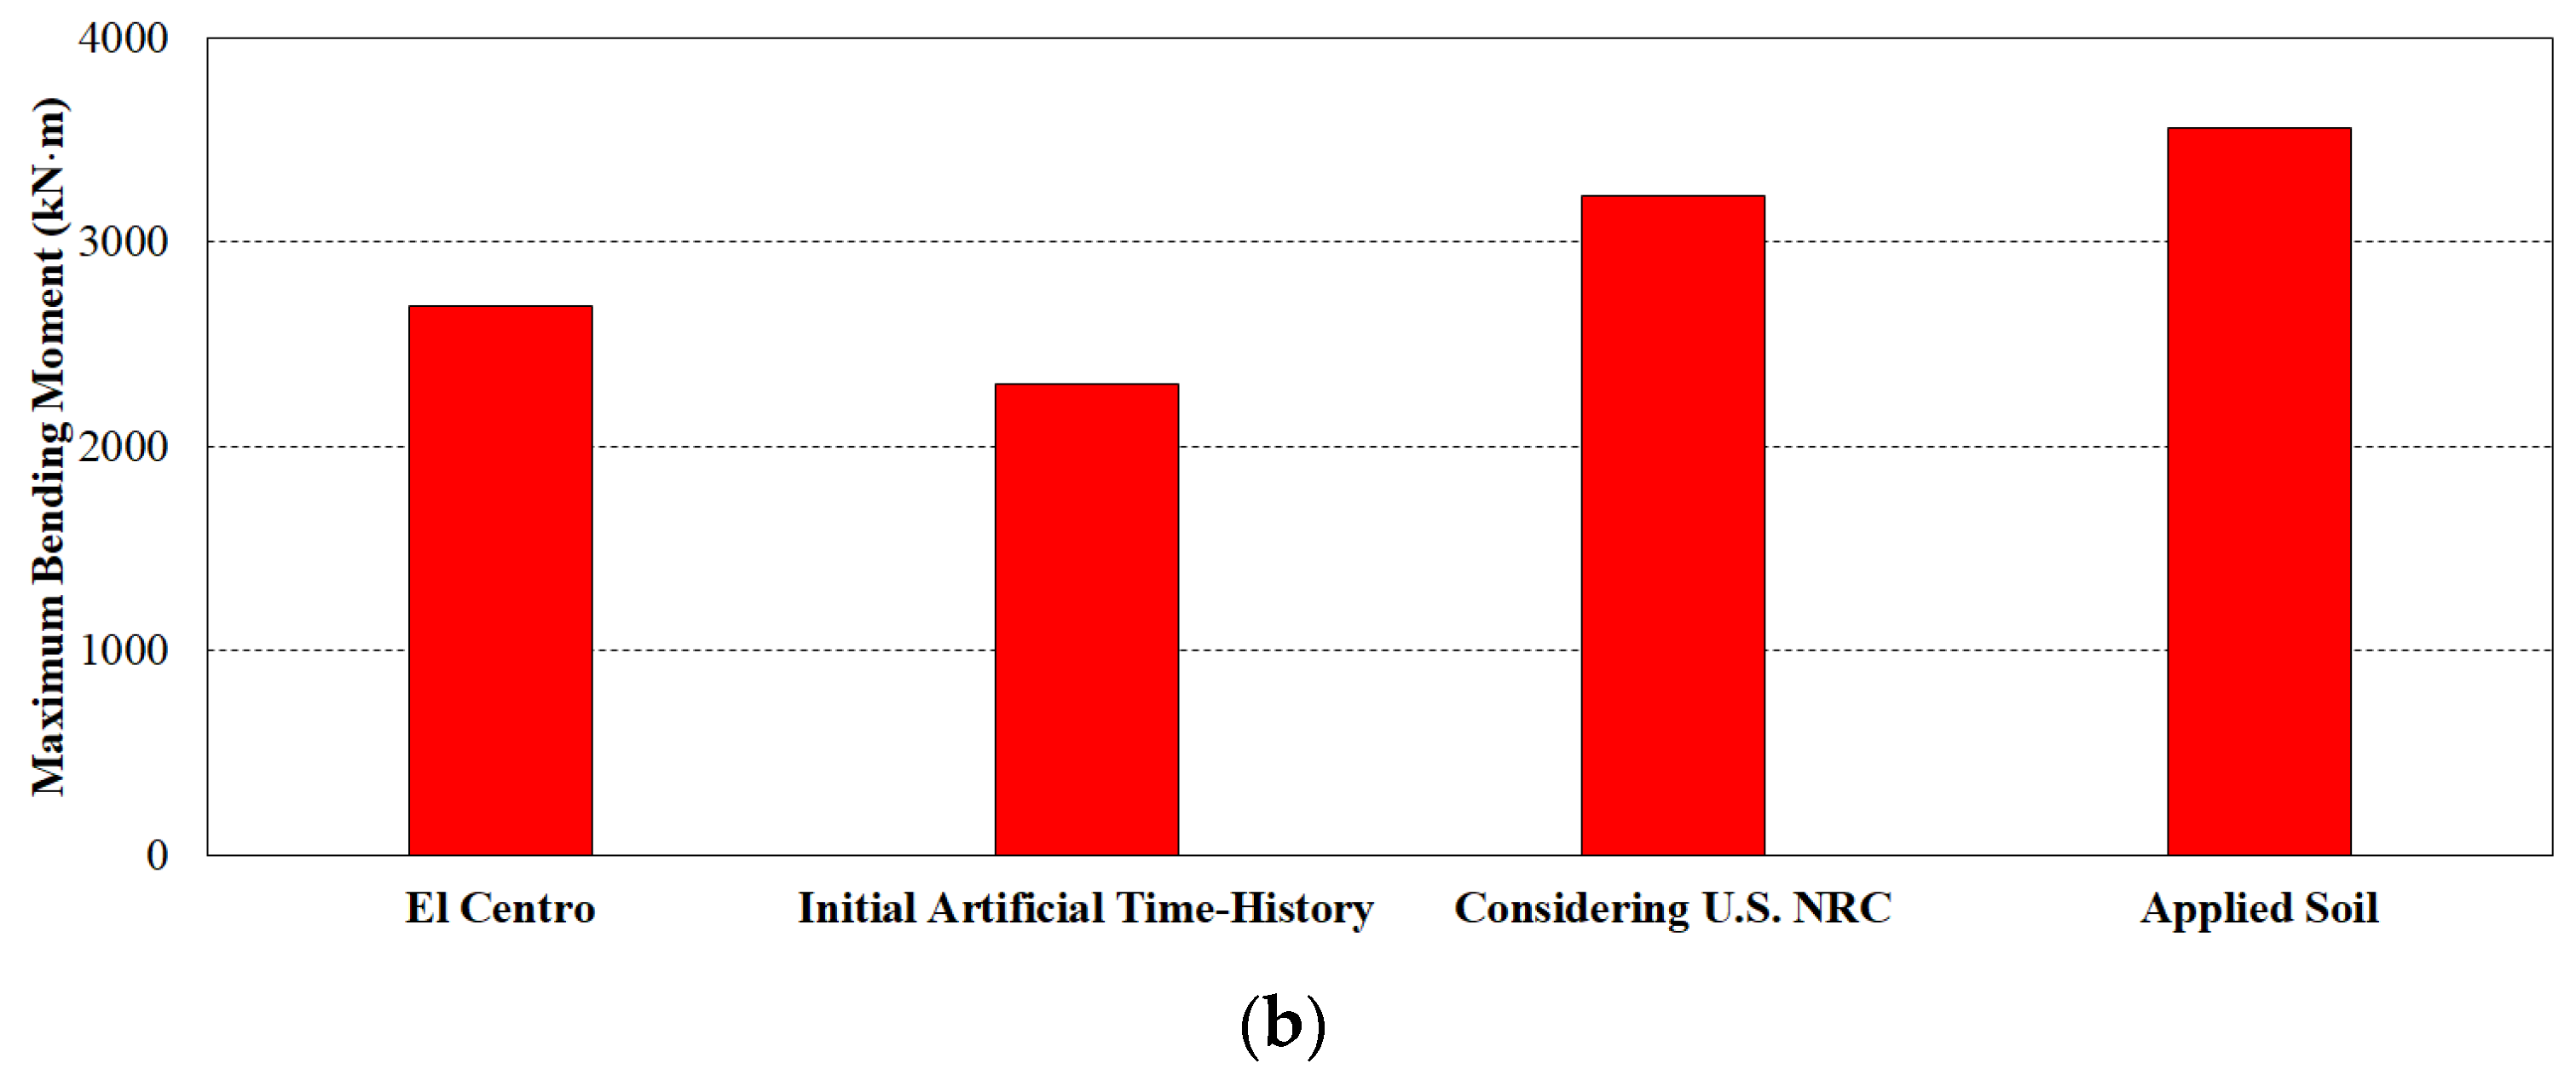
4.3. Seismic Response of the PSC Girder Bridge According to Seismic Properties
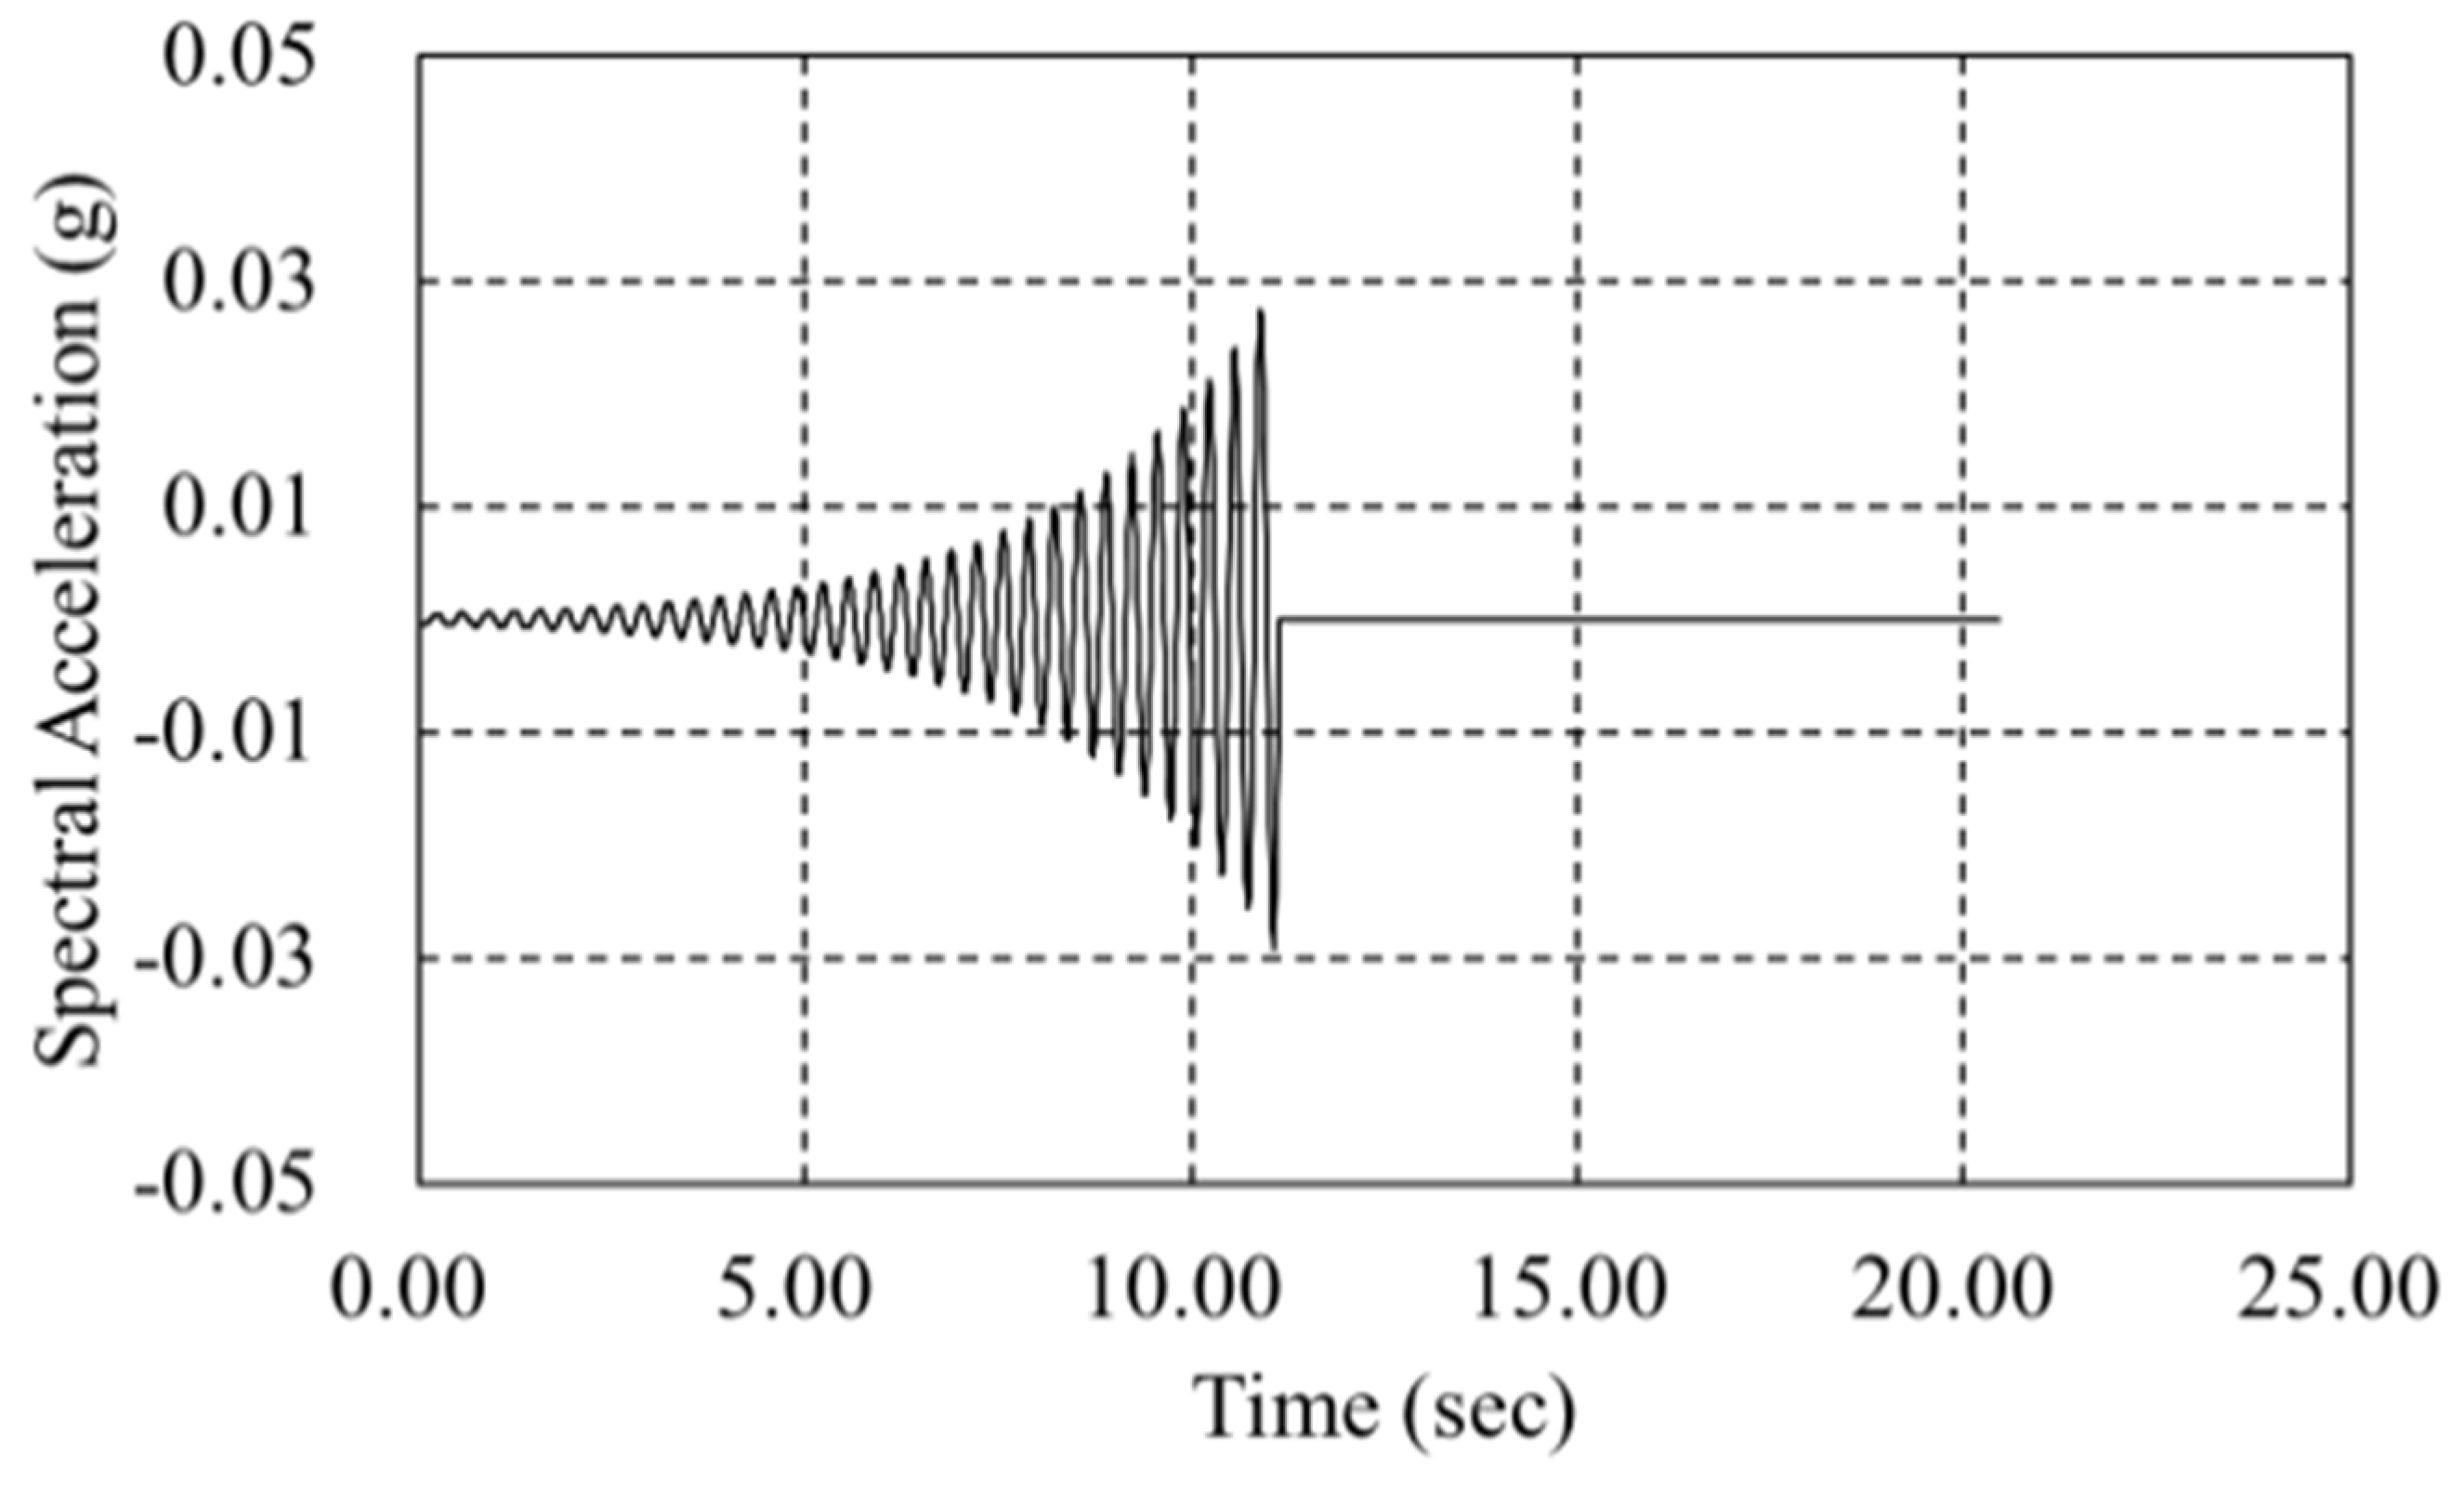
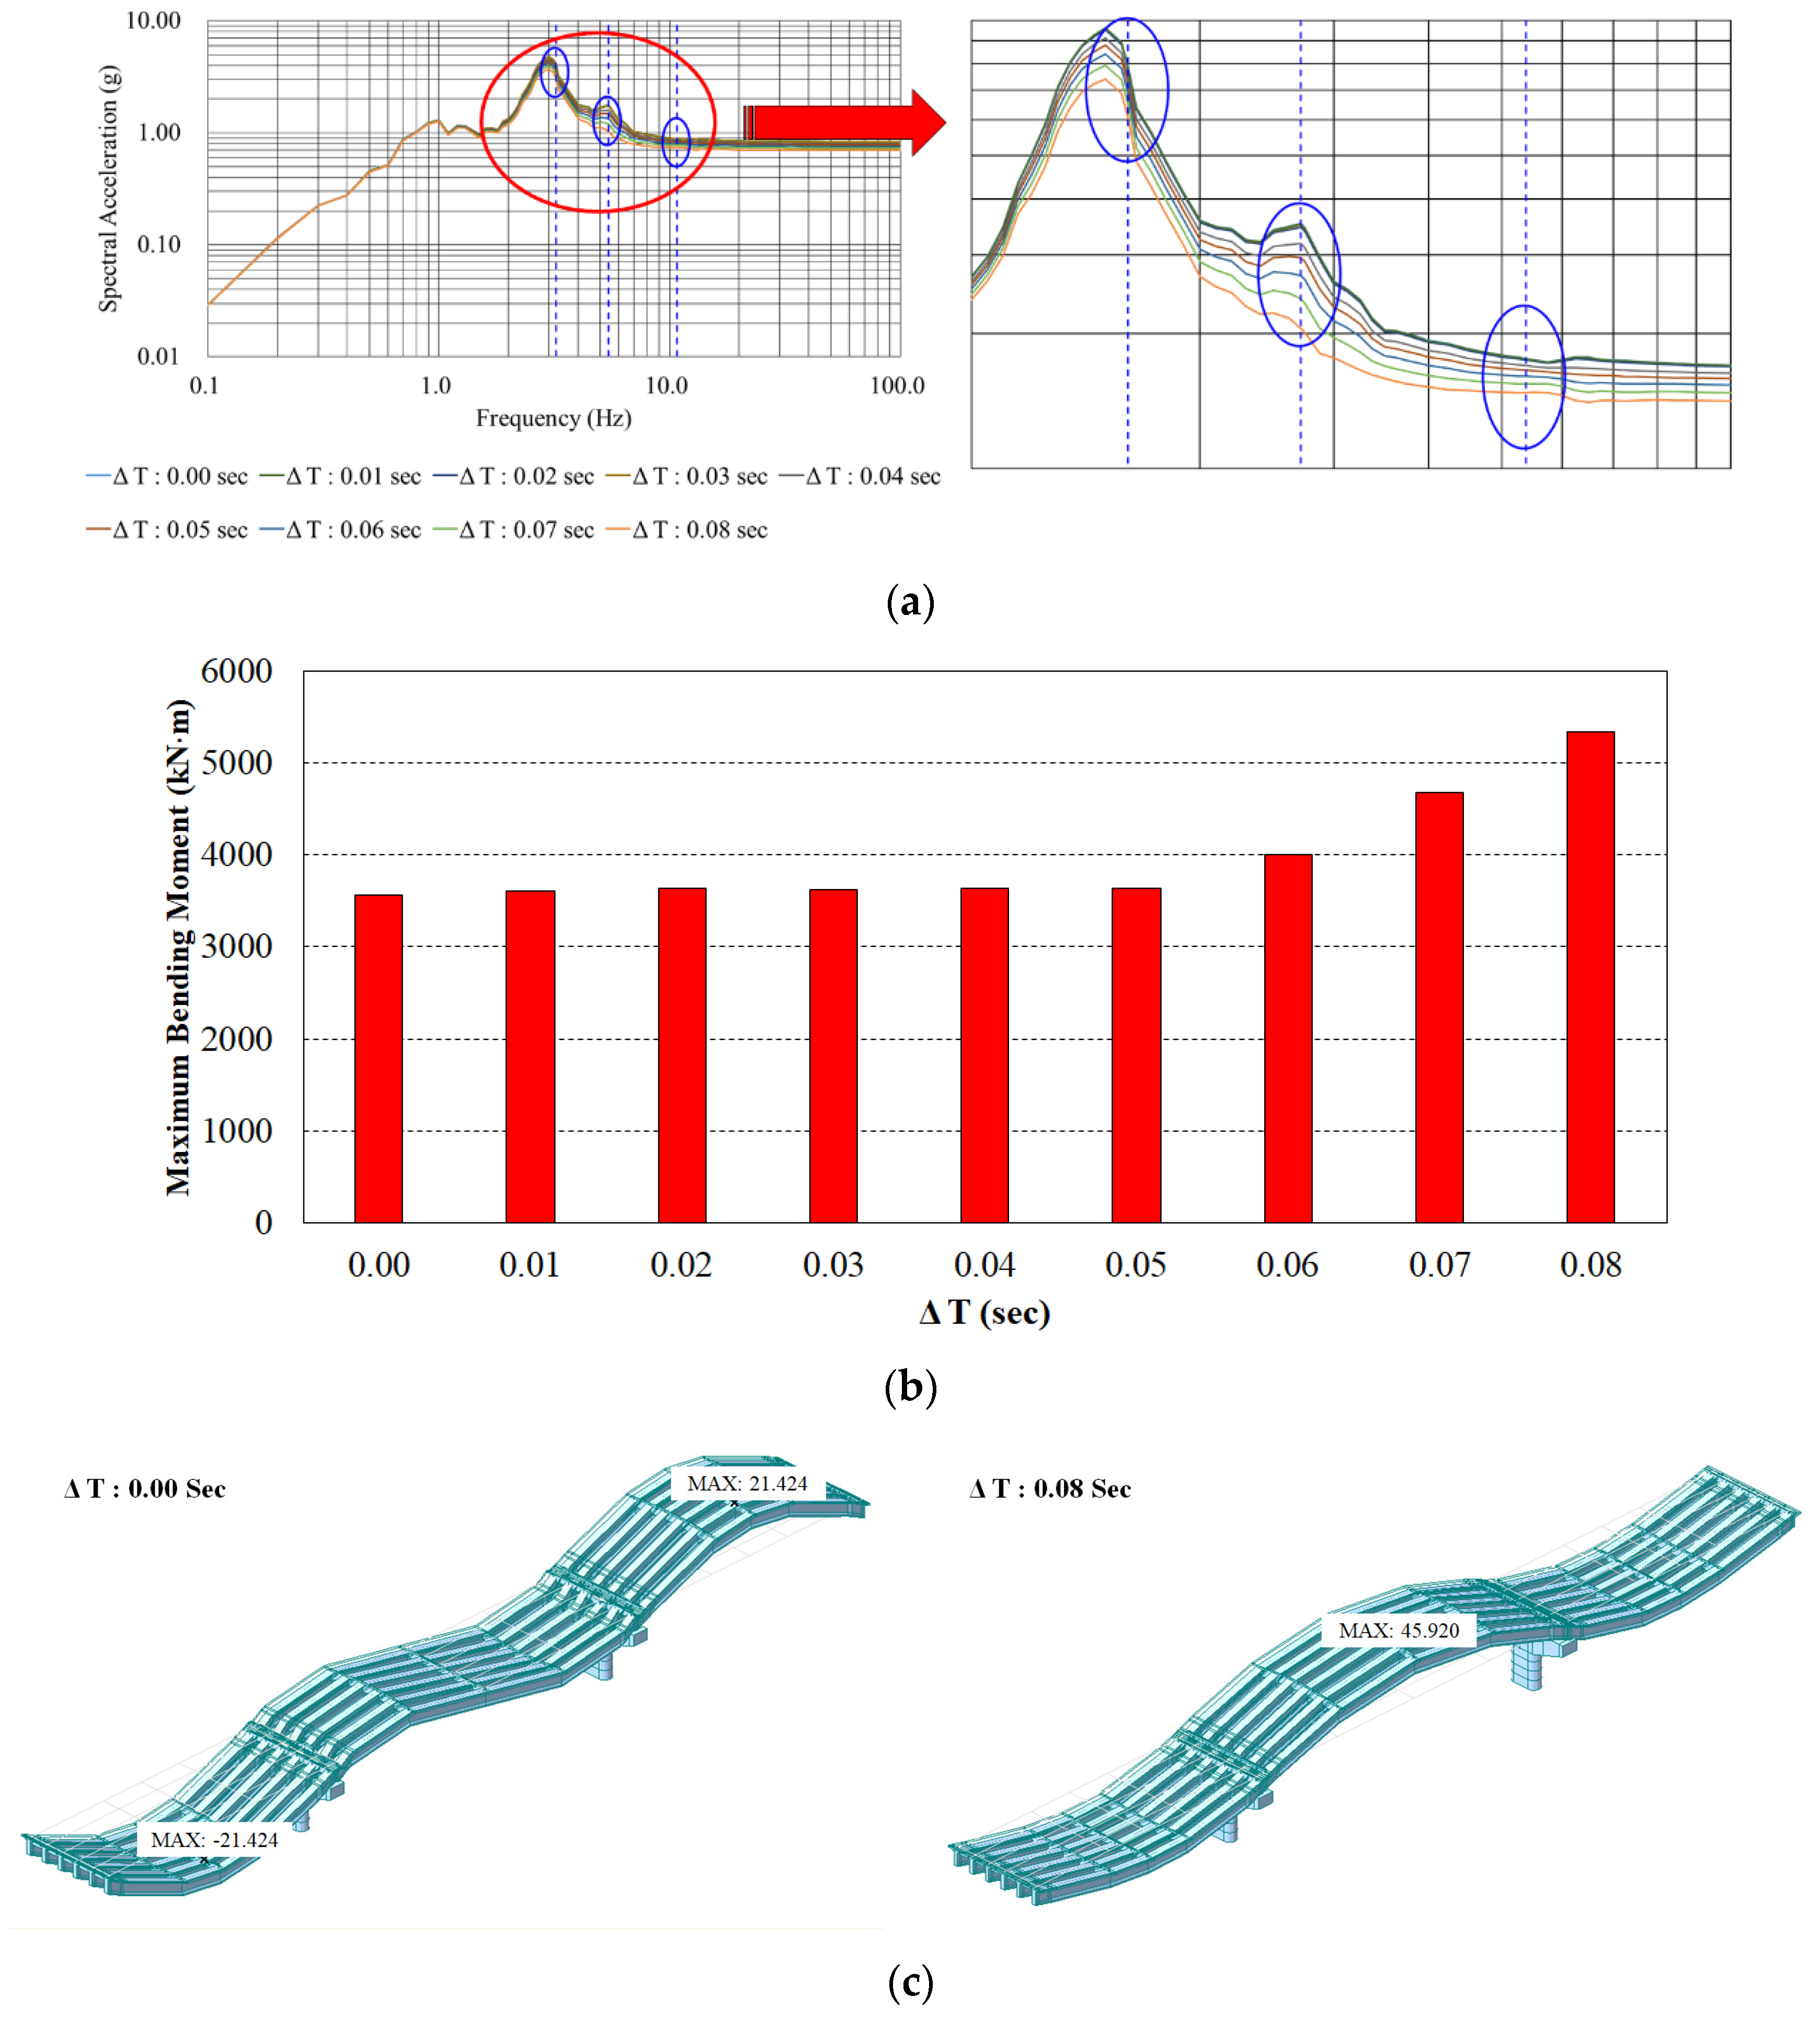
4.4. Seismic Response of the PSC Girder Bridge According to the Wave Passage Effect
5. Conclusions
Author Contributions
Funding
Institutional Review Board Statement
Data Availability Statement
Conflicts of Interest
References
- Kwon, H.-J.; Yang, K.-H.; Sim, J.-I. Proposals of Reliable Shapes of Supplementary V-Ties for Section Jacketing Method of Columns. J. Korea Inst. Build. Constr. 2018, 18, 99–107. [Google Scholar]
- Dong, J.-F.; Wang, Q.-Y.; Guan, Z.-W. Material properties of basalt fiber reinforced concrete made with recycled earthquake waste. J. Constr. Build. Mater. 2017, 130, 241–251. [Google Scholar] [CrossRef]
- Testuya, S.; Masayasu, O. Damage estimation of concrete canal due to earthquake effects by acoustic emission method. J. Constr. Build. Mater. 2014, 67, 186–191. [Google Scholar]
- Lee, K.-S.; Yi, W.-H.; Lew, H.-S. Nonlinear Seismic Analysis Method of Reinforced Concrete Buildings Including Their Pile Foundations. J. Earthq. Eng. Soc. Korea 2003, 7, 9–20. [Google Scholar]
- Abdel Raheem, S.E.; Ahmed, M.M.; Alazrak, T.M.A. Evaluation of soil–foundation–structure interaction effects on seismic response demands of multi-story MRF buildings on raft foundations. Int. J. Adv. Struct. Eng. 2014, 7, 11–30. [Google Scholar] [CrossRef] [Green Version]
- Wang, H.; Lou, M.; Chen, X.; Zhai, Y. Structure–soil–structure interaction between underground structure and ground structure. Soil Dyn. Earthq. Eng. 2013, 54, 31–38. [Google Scholar] [CrossRef]
- Lysmer, J.; Udaka, T.; Tsai, C.; Seed, H.B. FLUSH-A Computer Program for Approximate 3-D Analysis of Soil-Structure Interaction Problems; California University: Los Angeles, CA, USA, 1975. [Google Scholar]
- Wolf, J.P. Soil-structure-interaction analysis in time domain. In Structural Mechanics in Reactor Technology; IAEA: Vienna, Austria, 1987. [Google Scholar]
- Avilés, J.; Pérez-Rocha, L.E. Soil–Structure Interaction in Yielding Systems. Earthq. Eng. Struct. Dyn. 2003, 32, 1749–1771. [Google Scholar] [CrossRef]
- Wolf, J.P.; Song, C. Some Cornerstones of Dynamic Soil–Structure Interaction. Eng. Struct. 2002, 24, 13–28. [Google Scholar] [CrossRef]
- Jardine, R.J.; Potts, D.M.; Fourie, A.B.; Burland, J.B. Studies of the Influence of Non-Linear Stress–Strain Characteristics in Soil–Structure Interaction. Geotechnique 1986, 36, 377–396. [Google Scholar] [CrossRef]
- Mohanty, P.; Dan, X.; Biswal, S.; Bhattacharya, S. A shake table investigation of dynamic behavior of pile supported bridges in liquefiable soil deposits. Earthq. Eng. Eng. Vib. 2021, 20, 1–24. [Google Scholar] [CrossRef]
- Kwon, J.-S.; Paik, I.-Y.; Chang, S.-P. Dynamic Analysis of Floating Bridge subject to Earthquake Load Considering Multi-Support Excitation. J. Earthq. Eng. Soc. Korea 2004, 8, 27–33. [Google Scholar]
- Ohsaki, M. Sensitivity of Optimum Designs for Spatially Varying Ground Motions. J. Struct. Eng. 2001, 127, 1324–1329. [Google Scholar] [CrossRef]
- Ancheta, T.D.; Stewart, J.P.; Abramhamson, N.A. Engineering characterization of earthquake ground motion coherency and amplitude variability. In Proceedings of the 4th International Symposium on Effects of Surface Geology on Seismic Motion, University of California, Santa Barbara, CA, USA, 23–26 August 2011; IASPEI/IAEE: Santa Barbara, CA, USA, 2011. [Google Scholar]
- Kim, I.-T.; Han, J.-W.; Yun, S.; Park, D.-H. Prediction of Tunnel Response by Spatially Variable Ground Motion. J. Korean Geo-Environ. Soc. 2008, 9, 53–61. [Google Scholar]
- Kim, Y.-S.; Roesset, J.M. Effect of Nonlinear Soil Behavior on the Inelastic Seismic Response of a Structure. Int. J. Geomech. ASCE 2004, 4, 104–114. [Google Scholar] [CrossRef]
- Kim, Y.-S. Wave Passage Effect on the Seismic Response of a Building Considering Bedrock Shear Wave Velocity. J. Earthq. Eng. Soc. Korea 2014, 18, 89–94. [Google Scholar] [CrossRef] [Green Version]
- Shamsabadi, A.; Rollins, K.M.; Kapuskar, M. Nonlinear Soil–Abutment–Bridge Structure Interaction for Seismic Performance-Based Design. J. Geotech. Geoenviron. Eng. 2007, 133, 707–720. [Google Scholar] [CrossRef]
- Wang, Z.; Dueñas-Osorio, L.; Padgett, J.E. Seismic Response of a Bridge–Soil–Foundation System under the Combined Effect of Vertical and Horizontal Ground Motions. Earthq. Eng. Struct. Dyn. 2013, 42, 545–564. [Google Scholar] [CrossRef]
- Chen, W.; Huang, G. Seismic Wave Passage Effect on Dynamic Response of Submerged Floating Tunnels. Procedia Eng. 2010, 4, 217–224. [Google Scholar] [CrossRef] [Green Version]
- Adanur, S.; Altunışık, A.C.; Başağa, H.B.; Soyluk, K.; Dumanoğlu, A.A. Wave-Passage Effect on the Seismic Response of Suspension Bridges Considering Local Soil Conditions. Int. J. Steel Struct. 2017, 17, 501–513. [Google Scholar] [CrossRef]
- Bayraktar, A.; Hokelekli, E. Nonlinear soil deformability effects on the seismic damage mechanisms of brick and stone masonry arch bridge. Int. J. Damage Mech. 2021, 30, 431–452. [Google Scholar] [CrossRef]
- Ling, S.; Chigira, M. Characteristics and Triggers of Earthquake-Induced Landslides of Pyroclastic Fall Deposits: An Example from Hachinohe during the 1968 M7. 9 Tokachi-Oki Earthquake, Japan. Eng. Geol. 2020, 264, 105301. [Google Scholar] [CrossRef]
- Takao, T.; Kozawa, K.; Murakami, K.; Abe, I.; Ogasawara, T.; Shibaki, H.; Nakamura, Y. Impact on Dissolved Oxygen of Intermittent Deep Water Intrusion from the Outer Bay after the 2011 Tohoku Earthquake Tsunami in Ofunato Bay, Japan. In Proceedings of the ASIAN AND PACIFIC COASTS 2017: Proceedings of the 9th International Conference on APAC 2017; World Scientific: Pasay City, Philippines, 2018; pp. 882–893. [Google Scholar]
- Matsuoka, K.; Ikeda, Y.; Kaga, S.; Kaga, Y.; Ogata, T. Repercussions of the Great East Japan Earthquake Tsunami on Ellipsoidal Alexandrium Cysts (Dinophyceae) in Ofunato Bay, Japan. Mar. Environ. Res. 2018, 135, 123–135. [Google Scholar] [CrossRef] [PubMed]
- Amirchoupani, P.; Abdollahzadeh, G.; Hamidi, A. Improvement of energy damage index bounds for circular reinforced concrete bridge piers under dynamic analysis. Struct. Concr. 2021, 22, 3315–3335. [Google Scholar] [CrossRef]
- Park, G.; Hong, K.N.; Han, S.H.; Kim, J.S. Generation of Artificial Time History Covering Design Response Spectrum by Two Modification Functions. J. Korean Soc. Civ. Eng. 2016, 36, 1–11. [Google Scholar] [CrossRef] [Green Version]
- Lilhanand, K.; Tseng, W.S. Development and Application of Realistic Earthquake Time Histories Compatible with Multiple-Damping Design Spectra. In Proceedings of the 9th World Conference on Earthquake Engineering, Tokyo, Japan, 2–9 August 1988; Volume 2, pp. 819–824. [Google Scholar]
- Newmark, N.M.; Hall, W.J. Earthquake Spectra and Design. In Engineering Monographs on Earthquake Criteria; Earthquake Engineering Research Institute: Berkeley, CA, USA, 1982. [Google Scholar]
- Hudson, D.E. Reading and Interpreting Strong Motion Accelerograms; Earthquake Engineering Research Institute: Berkeley, CA, USA, 1979; Volume 1. [Google Scholar]
- Seed, H.B.; Ugas, C.; Lysmer, J. Site-Dependent Spectra for Earthquake-Resistant Design. Bull. Seismol. Soc. Am. 1976, 66, 221–243. [Google Scholar] [CrossRef]
- Hashash, Y.M.A.; Musgrove, M.I.; Harmon, J.A.; Okan, I.; Xing, G.; Numanoglu, O.; Groholski, D.R.; Phillips, C.A.; Park, D. DEEPSOIL 7.0, User Manual. Board of Trustees of University of Illinois at Urbana-Champaign: Urbana, IL, USA, 2020. Available online: http://deepsoil.cee.illinois.edu (accessed on 25 December 2021).
- Ancheta, D.T. Engineering Characterization of Spatially Variable Earthquake Ground Motions. Ph.D. Thesis, University of California, Los Angeles, CA, USA, 2010; 220p. [Google Scholar]
- Ahn, S.; Ahn, K.; Lee, C.; Lee, J.-D.; Jung, J. Evaluation of Dynamic Properties and Ground-Response Analysis of Soil Reinforced with Cement and Biopolymer. J. Korean Soc. Hazard Mitig. 2020, 20, 291–296. [Google Scholar] [CrossRef]


| Frequency Range (Hz) | Increment (Hz) | Frequency Range (Hz) | Increment (Hz) |
|---|---|---|---|
| 0.2~3.0 | 0.10 | 8.0~15.0 | 0.50 |
| 3.0~3.6 | 0.15 | 15.0~18.0 | 1.00 |
| 3.6~5.0 | 0.20 | 18.0~22.0 | 2.00 |
| 5.0~8.0 | 0.25 | 22.0~ | 3.00 |
| Compressive Strength (MPa) | Modulus of Elasticity (MPa) | Poisson’s Ratio | Weight Density (kN/m3) | |
|---|---|---|---|---|
| Girder | 35.0 | 29,755.0 | 0.18 | 24.5 |
| Cross-Beam | 24.0 | 26,964.0 | 0.18 | 24.5 |
| Pier | 21.0 | 26,094.0 | 0.18 | 24.5 |
| Mode No. | Natural Frequency (Hz) | Mass Participation (%) | ||
|---|---|---|---|---|
| X-Translation | Y-Translation | Z-Translation | ||
| 1 | 1.784 | 0.000 | 13.000 | 0.000 |
| 2 | 2.463 | 0.000 | 65.250 | 0.000 |
| 3 | 2.484 | 0.000 | 0.000 | 0.000 |
| 4 | 3.215 | 69.810 | 0.000 | 0.000 |
| 5 | 3.881 | 0.000 | 0.000 | 6.050 |
| 6 | 4.709 | 0.000 | 1.670 | 0.020 |
| 7 | 5.138 | 0.000 | 0.000 | 51.500 |
| 8 | 5.428 | 22.910 | 0.000 | 0.000 |
| 9 | 6.651 | 0.450 | 0.000 | 0.000 |
| 10 | 7.773 | 0.000 | 10.070 | 0.000 |
| 11 | 11.995 | 3.880 | 0.000 | 0.000 |
| 12 | 20.389 | 0.000 | 0.020 | 23.590 |
| Seismic Load | Peaked Acceleration | Spectral Acceleration | ||
|---|---|---|---|---|
| 1st Mode | 2nd Mode | 3rd Mode | ||
| El Centro | 0.357 | 0.732 | 0.739 | 0.561 |
| Initial Artificial Time–History | 0.300 | 0.670 | 0.823 | 0.581 |
| Considering U.S. NRC | 0.300 | 0.867 | 0.868 | 0.655 |
| Applied Soil | 0.406 | 1.009 | 0.728 | 0.464 |
| Seismic Load | Peaked Acceleration | Ratio (%) | Spectral Acceleration | Maximum Bending Moment (kN·m) | |||||
|---|---|---|---|---|---|---|---|---|---|
| 1st Mode | Ratio (%) | 2nd Mode | Ratio (%) | 3rd Mode | Ratio (%) | ||||
| El Centro | 0.609 | 170.588 | 3.387 | 462.705 | 1.268 | 171.583 | 0.615 | 109.626 | 2683.60 |
| Initial Artificial Time–History | 0.549 | 183.000 | 3.275 | 488.806 | 1.499 | 182.139 | 0.658 | 113.253 | 2308.36 |
| Considering U.S. NRC | 0.782 | 260.667 | 3.302 | 380.854 | 1.955 | 225.230 | 0.826 | 126.107 | 3223.90 |
| Applied Soil | 0.836 | 205.911 | 3.954 | 391.873 | 1.762 | 242.033 | 0.880 | 189.655 | 3561.83 |
| Wave Passage Effect | Peaked Acceleration | Spectral Acceleration | Max. Bending Moment (kN·m) | ||
|---|---|---|---|---|---|
| 1st Mode | 2nd Mode | 3rd Mode | |||
| ΔT: 0.00 s | 0.836 | 3.954 | 1.762 | 0.880 | 3561.83 |
| ΔT: 0.01 s | 0.835 | 3.950 | 1.757 | 0.879 | 3605.90 |
| ΔT: 0.02 s | 0.830 | 3.917 | 1.729 | 0.873 | 3638.98 |
| ΔT: 0.03 s | 0.833 | 3.936 | 1.746 | 0.877 | 3626.76 |
| ΔT: 0.04 s | 0.803 | 3.748 | 1.588 | 0.848 | 3635.79 |
| ΔT: 0.05 s | 0.782 | 3.614 | 1.479 | 0.828 | 3637.15 |
| ΔT: 0.06 s | 0.758 | 3.448 | 1.347 | 0.803 | 4009.57 |
| ΔT: 0.07 s | 0.730 | 3.253 | 1.196 | 0.773 | 4675.18 |
| ΔT: 0.08 s | 0.698 | 3.029 | 1.028 | 0.739 | 5344.66 |
Publisher’s Note: MDPI stays neutral with regard to jurisdictional claims in published maps and institutional affiliations. |
© 2022 by the authors. Licensee MDPI, Basel, Switzerland. This article is an open access article distributed under the terms and conditions of the Creative Commons Attribution (CC BY) license (https://creativecommons.org/licenses/by/4.0/).
Share and Cite
Park, G.; Yeon, Y.-M.; Hong, K.-N.; Lee, S. Influence of Seismic Loads Considering Soil Properties and Wave Passage Effect on the Seismic Response of a Multi-Span PSC Girder Bridge. Appl. Sci. 2022, 12, 1415. https://doi.org/10.3390/app12031415
Park G, Yeon Y-M, Hong K-N, Lee S. Influence of Seismic Loads Considering Soil Properties and Wave Passage Effect on the Seismic Response of a Multi-Span PSC Girder Bridge. Applied Sciences. 2022; 12(3):1415. https://doi.org/10.3390/app12031415
Chicago/Turabian StylePark, Gun, Yeong-Mo Yeon, Ki-Nam Hong, and Sugyu Lee. 2022. "Influence of Seismic Loads Considering Soil Properties and Wave Passage Effect on the Seismic Response of a Multi-Span PSC Girder Bridge" Applied Sciences 12, no. 3: 1415. https://doi.org/10.3390/app12031415
APA StylePark, G., Yeon, Y.-M., Hong, K.-N., & Lee, S. (2022). Influence of Seismic Loads Considering Soil Properties and Wave Passage Effect on the Seismic Response of a Multi-Span PSC Girder Bridge. Applied Sciences, 12(3), 1415. https://doi.org/10.3390/app12031415