Article

Deep Learning-Based Automatic Segmentation of Mandible and Maxilla in Multi-Center CT Images

1
Center for Bionics, Korea Institute of Science and Technology, Seoul 02792, Korea
2
Imagoworks, Inc., Seoul 06611, Korea
3
Department of Oral and Maxillofacial Surgery, School of Dentistry, Kyung Hee University, Seoul 02447, Korea
*
Authors to whom correspondence should be addressed.
Appl. Sci. 2022, 12(3), 1358; https://doi.org/10.3390/app12031358
Submission received: 10 December 2021 / Revised: 18 January 2022 / Accepted: 21 January 2022 / Published: 27 January 2022

Abstract

:
Sophisticated segmentation of the craniomaxillofacial bones (the mandible and maxilla) in computed tomography (CT) is essential for diagnosis and treatment planning for craniomaxillofacial surgeries. Conventional manual segmentation is time-consuming and challenging due to intrinsic properties of craniomaxillofacial bones and head CT such as the variance in the anatomical structures, low contrast of soft tissue, and artifacts caused by metal implants. However, data-driven segmentation methods, including deep learning, require a large consistent dataset, which creates a bottleneck in their clinical applications due to limited datasets. In this study, we propose a deep learning approach for the automatic segmentation of the mandible and maxilla in CT images and enhanced the compatibility for multi-center datasets. Four multi-center datasets acquired by various conditions were applied to create a scenario where the model was trained with one dataset and evaluated with the other datasets. For the neural network, we designed a hierarchical, parallel and multi-scale residual block to the U-Net (HPMR-U-Net). To evaluate the performance, segmentation with in-house dataset and with external datasets from multi-center were conducted in comparison to three other neural networks: U-Net, Res-U-Net and mU-Net. The results suggest that the segmentation performance of HPMR-U-Net is comparable to that of other models, with superior data compatibility.

1. Introduction

Segmentation of the craniomaxillofacial bones, such as the mandible and maxilla, in computed topography (CT) images is one of the crucial steps for generating three-dimensional (3D) models that are required for the diagnosis and treatment planning of craniomaxillofacial deformities, craniofacial tumor resection, or free flap reconstruction of the mandible [1,2]. Additionally, 3D segmentation of organs at risk (OARs) in head and neck (H&N) CT including the mandible is a critical step in radiotherapy planning for H&N cancer treatment [3].
The conventional segmentation task is performed manually using professional software, which is labor-intensive and time-consuming in clinical practice [4,5]. Additionally, manual segmentation has limitations such as low reproducibility and operator variability. Moreover, accurate segmentation of head CT is challenging owing to the complexity of the anatomical structures, the low contrast of soft tissue, artifacts caused by mental implants, and variations between individual patients [6]. In specific, weak and false edges of condyles appearing in CT images adversely affect the accurate segmentation of the mandible [7]. Figure 1 shows examples of the difficulties in segmenting the mandible and maxilla.
Automatic segmentation can improve efficiency and reliability, reducing segmentation time and clinician workload [7]. Numerous studies exist on automatic or semi-automatic segmentation of the mandible from CT scans, including OARs. In the Medical Image Computing and Computer-Assisted Intervention (MICCAI) 2015 Head and Neck Auto Segmentation Challenge [8], various approaches were proposed for the segmentation of OARs including the mandible. The use of public datasets, such as the Public Domain Database for Computational Anatomy (PDDCA) version 1.4.1, which was provided for the challenge, and how to evaluate the model performance have been a standard in head CT segmentation research. Most of these approaches utilize atlas-based methods [9] or model-based methods [10].
Atlas-based methods performs segmentation on novel data by image registration using the prior knowledge from the structures of interest [11]. Although atlas-based methods are popular and widely used for anatomy segmentation, they are sensitive to anatomical variations as they use a fixed set of atlases [12]. Moreover, they are computationally expansive and require many minutes to complete one registration task [13].
Statistical model-based methods utilize a statistical appearance model [14]. The models that best represent the shape or appearance variations in the structure of interest, which are obtained from training with a set of images and segmentations, are selected for a new patient image [15]. However, the shape or appearance described by the statistical model is limited to specific shapes, which gives it less flexibility unless large training sets are employed.
In some studies, atlas-based and statistical model-based methods have been combined with each other or with another method, leading to various other approaches for automatic mandible segmentation. Albrecht et al. [16] used a multi-atlas to obtain an initial segmentation of the OAR and an active shape model to refine the initial segmentation. Aghdasi et al. [17] employed anatomic landmarks and prior knowledge for segmentation. Chuang et al. [18] proposed a registration-based semi-automatic mandible segmentation pipeline that uses a nonlinear diffeomorphic method to register preprocessed test CT scans on the reference templates.
Recently, as convolutional neural networks (CNNs) have become more effective in computer vision, research on deep learning for medical image segmentation has increased exponentially [19]. The first deep learning-based algorithm utilizing a CNN for the segmentation of OARs in H&N CT was proposed by Ibragimov et al. [20], who employed a network with three convolution layers. Tong et al. [21] then incorporated a CNN with the pretrained shape representation model. Beyond simple CNNs, U-Net [22] has been one of the most popular CNNs for medical image segmentation. Compared with other CNNs, U-Net, with a simple and flexible structure, shows an outstanding performance in segmentation extracting image features by multi-scale recognition and fusion [23]. Several approaches have been developed by applying the U-Net structure as a baseline for mandible segmentation. Qiu et al. [1] used three U-Nets for orthogonal planes with dice loss to segment the mandible. AnatomyNet [13] was proposed to segment OARs from H&N CT, which was built on a 3D U-net architecture. A two-stage segmentation framework for OAR in CT was also proposed, which employs two 3D U-Nets for localization and segmentation [24].
Several studies have utilized U-Net with other structures together as well. Both a faster regional CNN and attention U-Net for localization and segmentation have been introduced by Lei et al. [24]. A recurrent segmentation CNN was proposed that embeds the CNN into a recurrent neural network for segmentation of the mandible from CT [7]. An attention mechanism, which has been advanced with deep learning models in computer vision, has been incorporated to U-Net for segmentation. Squeeze-and-excitation blocks were incorporated into U-Net for prostate zonal segmentation of multi-institutional MRI datasets, enhancing both intra- and cross-dataset generalization [25]. An attention gate model that can be integrated into CNN models was proposed to automatically learn to focus on target structures [26]. Focus U-Net with attention gate for spatial and channel-based attention was proposed for fast and accurate polyp segmentation [27].
However, there is an inevitable and considerable pitfall in data-driven methods including deep learning, which is the lack of data compatibility; that is, the method may fail to accurately segment images with varying properties, such as those acquired using different CT scanners and imaging protocols [28]. The compatibility of dataset in the models refers to the ability of models to inference the input images that have different distributions in the latent space from the multi-center training dataset [28]. In general, datasets are limited so that they cannot fully represent the general patient population in the clinic [29]. As a result, models trained on the specific center domain do not perform well on a different center domains with disparate data distribution [30]. This drawback is more significant when applying deep learning clinically on images from other institutions. For example, it is known that the Hounsfield units measurement varies between scanners [31]. The results of models targeted to CT can vary depending on the imaging parameters, the scanner type, calibration, or the scan date [29,32,33]. That is, multicenter data tend to have different data distributions, making trained neural network impractical. With consideration for this variability, it has been recently been required to test the artificial intelligence model with an external dataset [32]. From these limitations in clinical applications, data compatibility in deep learning for medical images has been an essential challenge to be addressed.
To solve this problem, research has been conducted to utilize multicenter data in neural network training [33,34]. Another potential solution to this problem is transfer learning [35,36,37], which trains with more easily obtained datasets from different domains to enhance performance [38]. However, these approaches have limitations for clinical use, as available medical data are scarce compared to natural images and are not sufficient for deep learning. Furthermore, labeling is more challenging with medical data.
In this study, we propose a framework for automated 3D segmentation of the mandible and maxilla using deep learning. We aim not only to accurately delineate the mandible and maxilla from CT, but also to improve the compatibility of multicenter data so that the model performs well on new domain data. To this end, we employed four multi-center datasets acquired by various conditions, with one used to train the models, and three used to evaluate the performance of the segmentation and the data compatibility. For the neural network, we applied residual connections [39] to U-Net, as it has been empirically and theoretically determined that the generalization is improved in residual networks compared with non-residual networks [40,41].

2. Materials and Methods

2.1. Data

We utilized four datasets: two of them from different centers (CenterA and CenterB) including mandible and maxilla segmentations and two public datasets (PDDCA and TCIA) for OAR segmentation in H&N CT. The CenterA dataset was randomly divided into training, validation, and test datasets, consisting of 146, 10, and 15 sets at the patient level, respectively. The training dataset was used to train the models, whereas the validation dataset was used to tune the hyperparameters of the models and check the validity of the training process. The test dataset from CenterA and other datasets were completely separated from the training and validation datasets, and were used for evaluating the performance of the models. Specifically, the PDDCA, TCIA, and CenterB datasets are external datasets that were used to evaluate the models for dataset compatibility. Detailed data characteristics of all datasets, including the number and size of slices, pixel spacing, and slice thicknesses, are presented in Table 1.
CenterA and CenterB datasets include CT images and the corresponding segmentation of the mandible and maxilla provided by the clinical experts of oral and maxillofacial surgery department and orthodontic department, respectively. Targets in CenterA datasets were delineated manually by an expert surgeon (B.Y.H.) from Kyung Hee University Hospital, Seoul, Korea. Ethical approval was received from the institutional review board (IRB) (approval number KH-DT19033) for CenterA dataset. CenterB dataset was built with 15 sets of dental CBCT (i-CAT 17-19TM, Imaging Science International) from Chungang University Hospital, Seoul, Korea (approval number 1922-007-362). Those CT images were segmented by two well-trained biomedical engineers supervised by a clinical expert.
The PDDCA dataset is a public dataset for OAR segmentation in the H&N region of CT images released at the 2015 MICCAI H&N radiotherapy OAR segmentation challenge [8] provided and maintained by Dr. Sharp at Harvard Medical School. The CT scans in the dataset are available via the Cancer Imaging Archive (TCIA) and are originally from the radiation therapy oncology group (RTOG) 0522 study, which includes multi-institutional clinical studies from patients with stage III or IV H&N carcinoma [42]. The dataset consists of 48 H&N CT images with nine OAR structures manually re-segmented by experts for uniform quality and consistency. In the challenge, the dataset was divided into 25 training sets, 10 off-site test sets, and 5 on-site test sets. In this study, we employed 15 test sets with mandible annotation.
The TCIA dataset [43] contains 31 CT scans from TCIA [44] and segmentations for 21 OARs, in which we only used mandible segmentation. They were delineated by an experienced radiographer, with additional peer arbitration by another radiographer and a radiation oncologist. Both the PDDCA and TCIA datasets include a selected part of the Head–Neck Cetuximab open source dataset [45]; owing to different selection criteria and different train/validation/test set division, there are five scans present in both PDDCA and TCIA test sets.
Examples of all datasets are illustrated in Figure 2. CenterA dataset is different from the PDDCA and TCIA datasets in terms of pixel spacing, slice thickness, and the scan range of the CT images. Comparatively, the PDDCA and TCIA datasets include a wider range of bodies that target OARs. CenterB uses cone beam CT (CBCT), which is fundamentally different from multidetector CT (MDCT) datasets, meaning the performance of a model trained with MDCT may be hindered when inferencing CBCT. Generally, seg mentation of CBCT is more laborious and time-consuming than MDCT as the edge of the image is more blurred and noisy. Additionally, CenterB dataset includes many cases with orthognathic surgery or orthodontics, which makes segmentation more difficult owing to the noise caused by surgery plates or orthodontic appliances (Figure 3). By externally testing using datasets, including PDDCA, TCIA, and CenterB datasets, with various characteristics, it was possible to evaluate the compatibility of the models.
All datasets were preprocessed using the same procedure. A threshold of −1000 and 2500 HU was employed for each scan and normalized between zero and one. Both CT scans and segmentation slices were cropped to fit the skull. All CT and segmentation volumes were resampled to be isotropic (512 × 512 × 512). For a fair evaluation, the predicted segmentations were conversely uncropped and resampled into the original spacing and thickness before the evaluation metrics were calculated. For the PDDCA and TCIA datasets, we only used the range of the mandible for the training dataset, while using the entire range of slices for the validation and testing.
Datasets were input to the models as 2.5D [46], in which the input was a volume of images consisting of the target slice and its adjacent slices, and the segmentation map corresponding to the center target slice was produced as an output of the model. This method enables the use of adjacent context information in 3D, whilst lowering the computational power required relative to 3D inputs. The proposed approach is applicable to mandible and maxilla segmentation as the adjacent upper and lower spatial information is important for distinguishing the mandible and maxilla in a slice that appears similar. In this study, the 11 slices, composed of one target slice and five upper and lower slices, were input for one slice of the segmentation map.

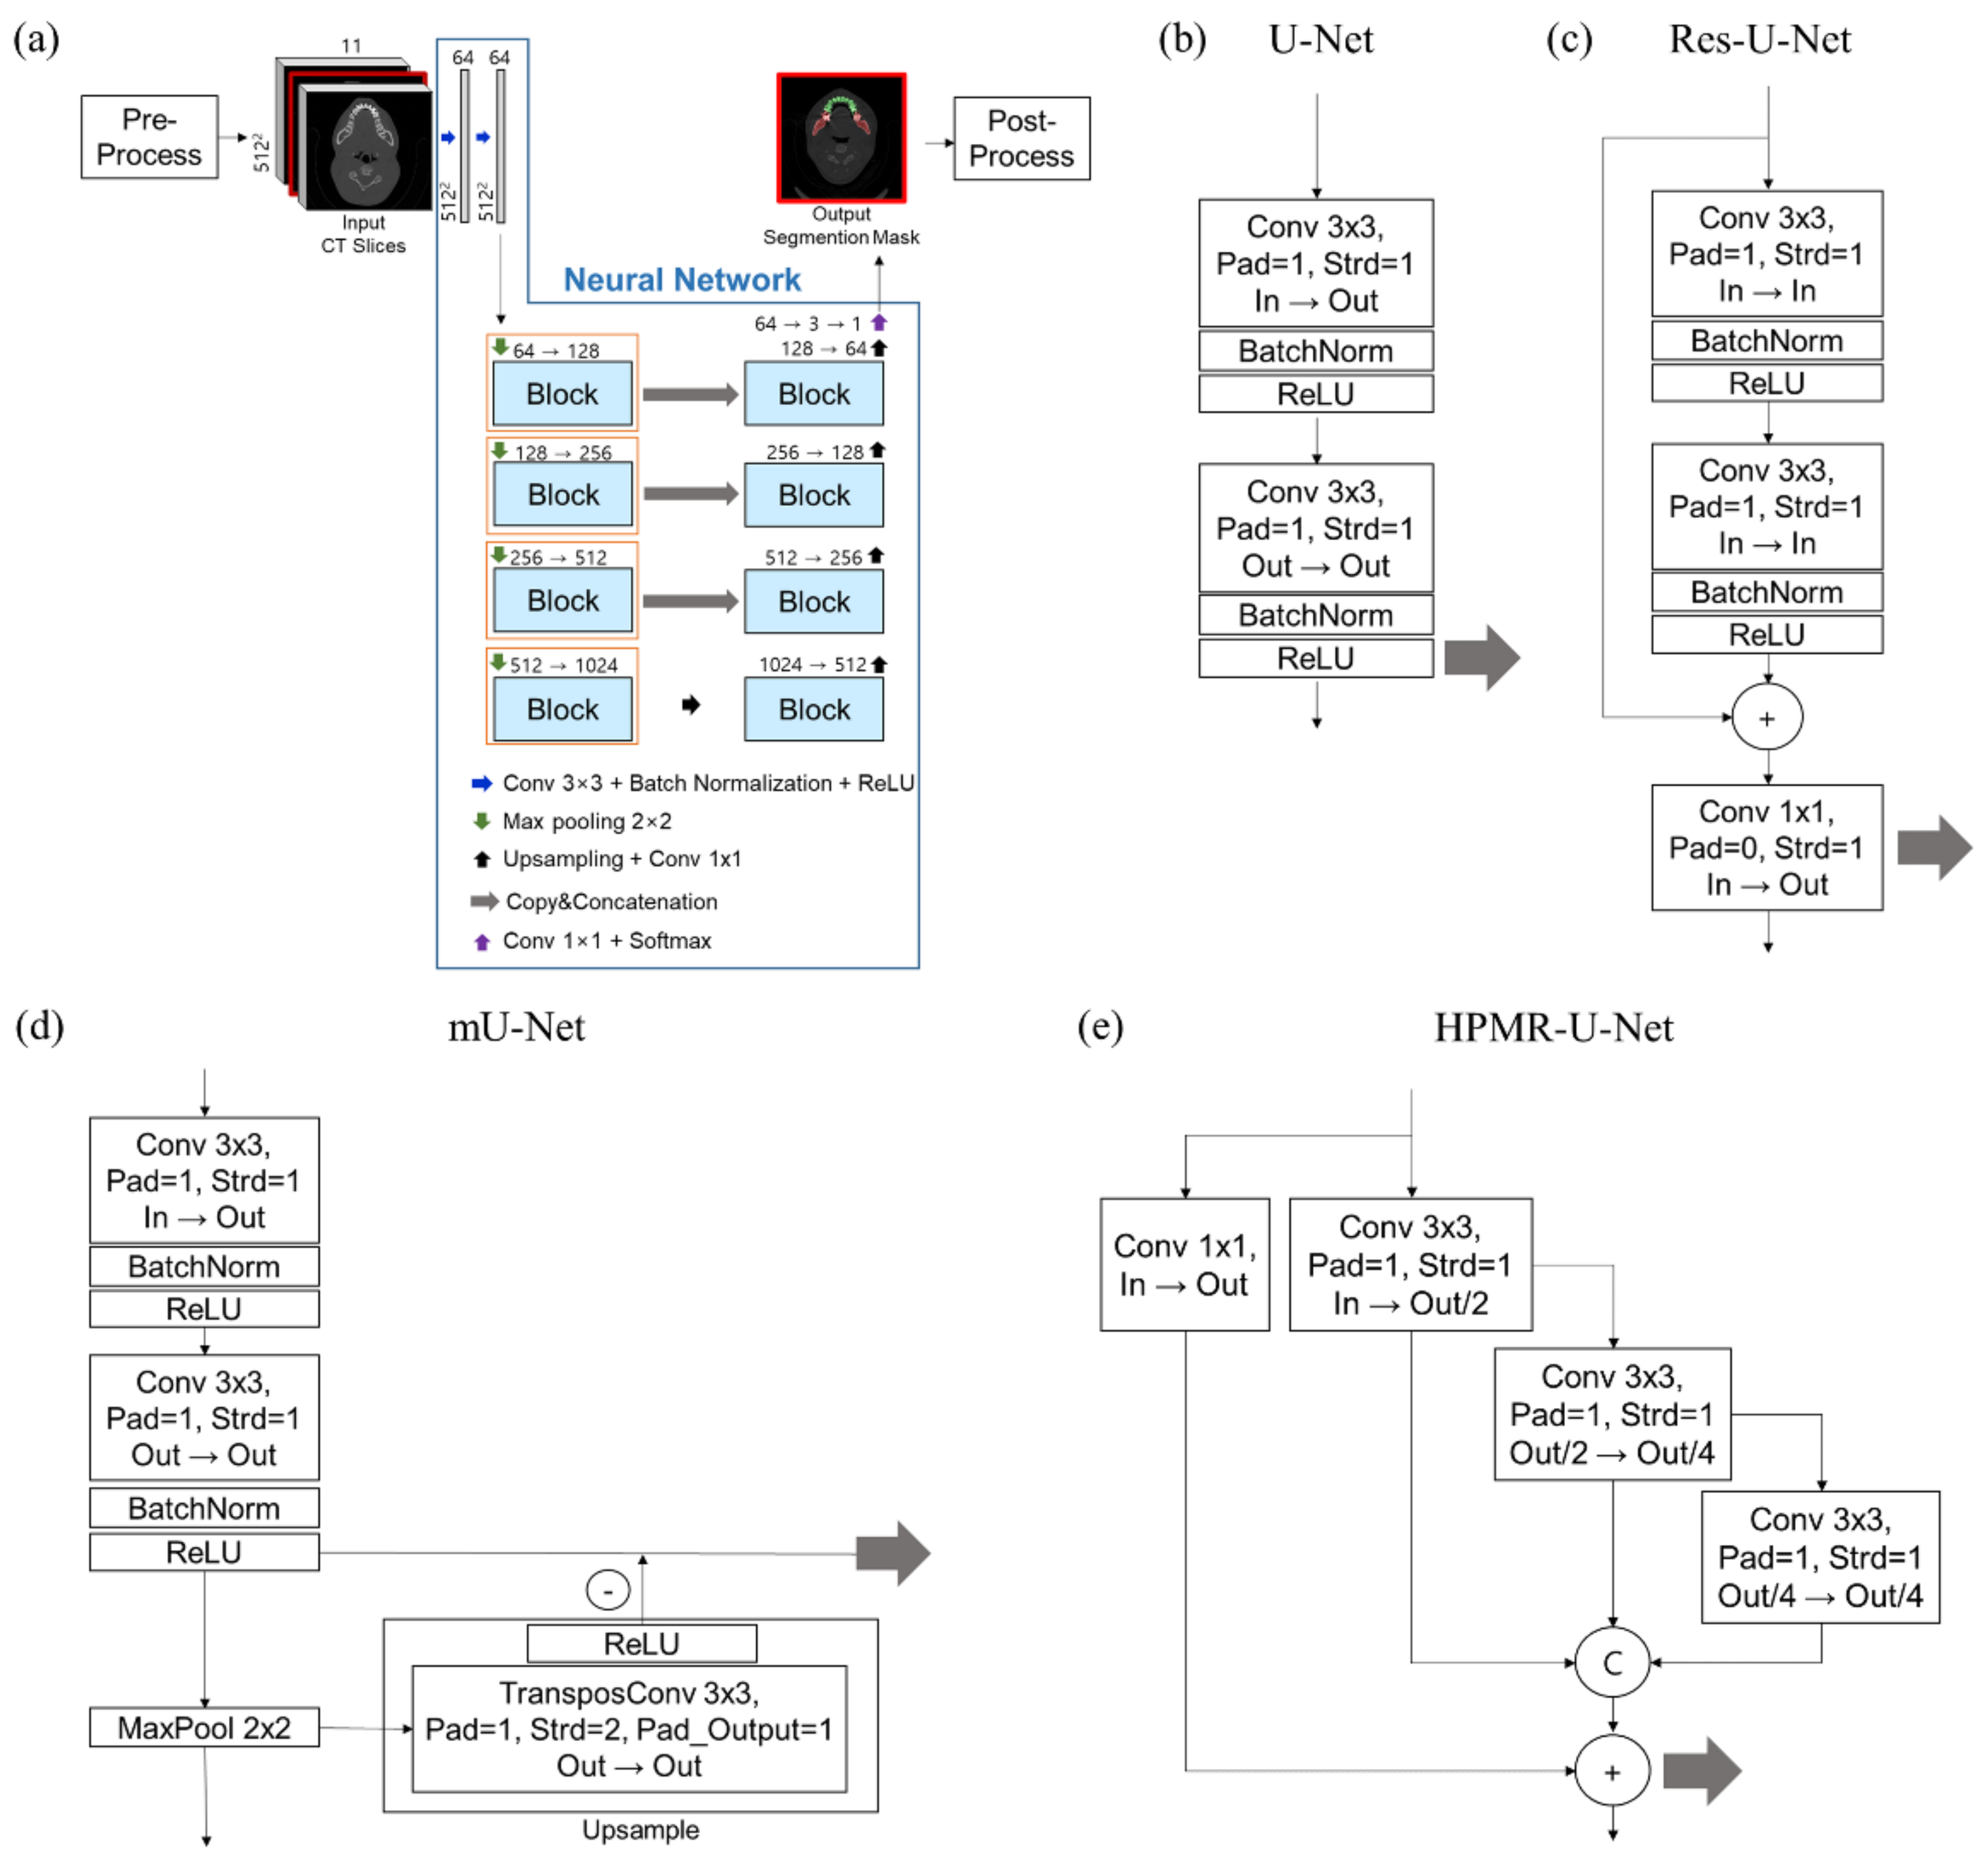
2.2. Framework and Network Architectures

The overall framework and detailed architectures of neural networks are displayed in Figure 4. Preprocessed CT scans are input to the neural network as 2.5D, which outputs one segmentation mask map for each target slice. This process was repeated for all slices in each patient scan. Afterwards, the segmented volume for each patient was post-processed.
For the neural network, we applied a hierarchical, parallel, and multi-scale residual (HPMR) block [47] to U-Net to enhance the data compatibility of the CNN model. This block was first designed to enhance the performance of a CNN for landmark localization with limited computational resources. The starting point of the architecture is a residual bottleneck block [39] that enables the stable optimization of a deeper model by assisting the propagation of information both forward and backward, improving performance. The other basis for the architecture is the inception block [48], which concatenates features from parallel paths with different receptive field sizes. Compared to the inception residual block, the HPMR block has a smaller number of parameters with the advantage of a parallel path. Compared to the existing research, we combined HPMR block to U-Net and showed its performance on the segmentation task. We used HPMR block for efficient learning to utilize advances of residual bottleneck block and parallel path with the lower number of parameters compared to using inception blocks.
We compared U-Net with HPMR blocks (HPMR-U-Net) to its base component architecture, U-Net, and U-Net with residual blocks (Res-U-Net) to verify the effects of HPMR blocks. Additionally, modified U-Net (mU-Net) [49] was selected as another state-of-the-art segmentation CNN model for comparison because it requires minimum increase of network parameters. Its residual block is composed of deconvolution and activation operations to pass features to the skip connection of the U-Net adaptively with the object size. mU-Net is designed not only to extract high-level features of large object edges, but also high-level global features of small objects. We hypothesized that the increase in the complexity of model, i.e., the increased number of parameters in the neural network, would hinder the data compatibility of the model. It is well known that overfitting, which impedes the data compatibility of a model, occurs when the number of parameters increases [50]. Therefore, we chose a simpler neural network with lower number of parameters than other state-of-the-art neural networks for comparison.
All networks were trained using PyTorch framework in Python under the same conditions for comparison. They were trained with a batch size of 10 for 30 epochs. We employed cross entropy loss as a loss function and Adam optimization with a learning rate of 10−5. Training and evaluation were performed on the computer hardware resources of a Nvidia GeForce RTX 3090 with 24 GB memory and 16 of DIMM DDR4 Synchronous 2666 MHz with 32 GiB in a Linux environment.

2.3. Performance Evaluation
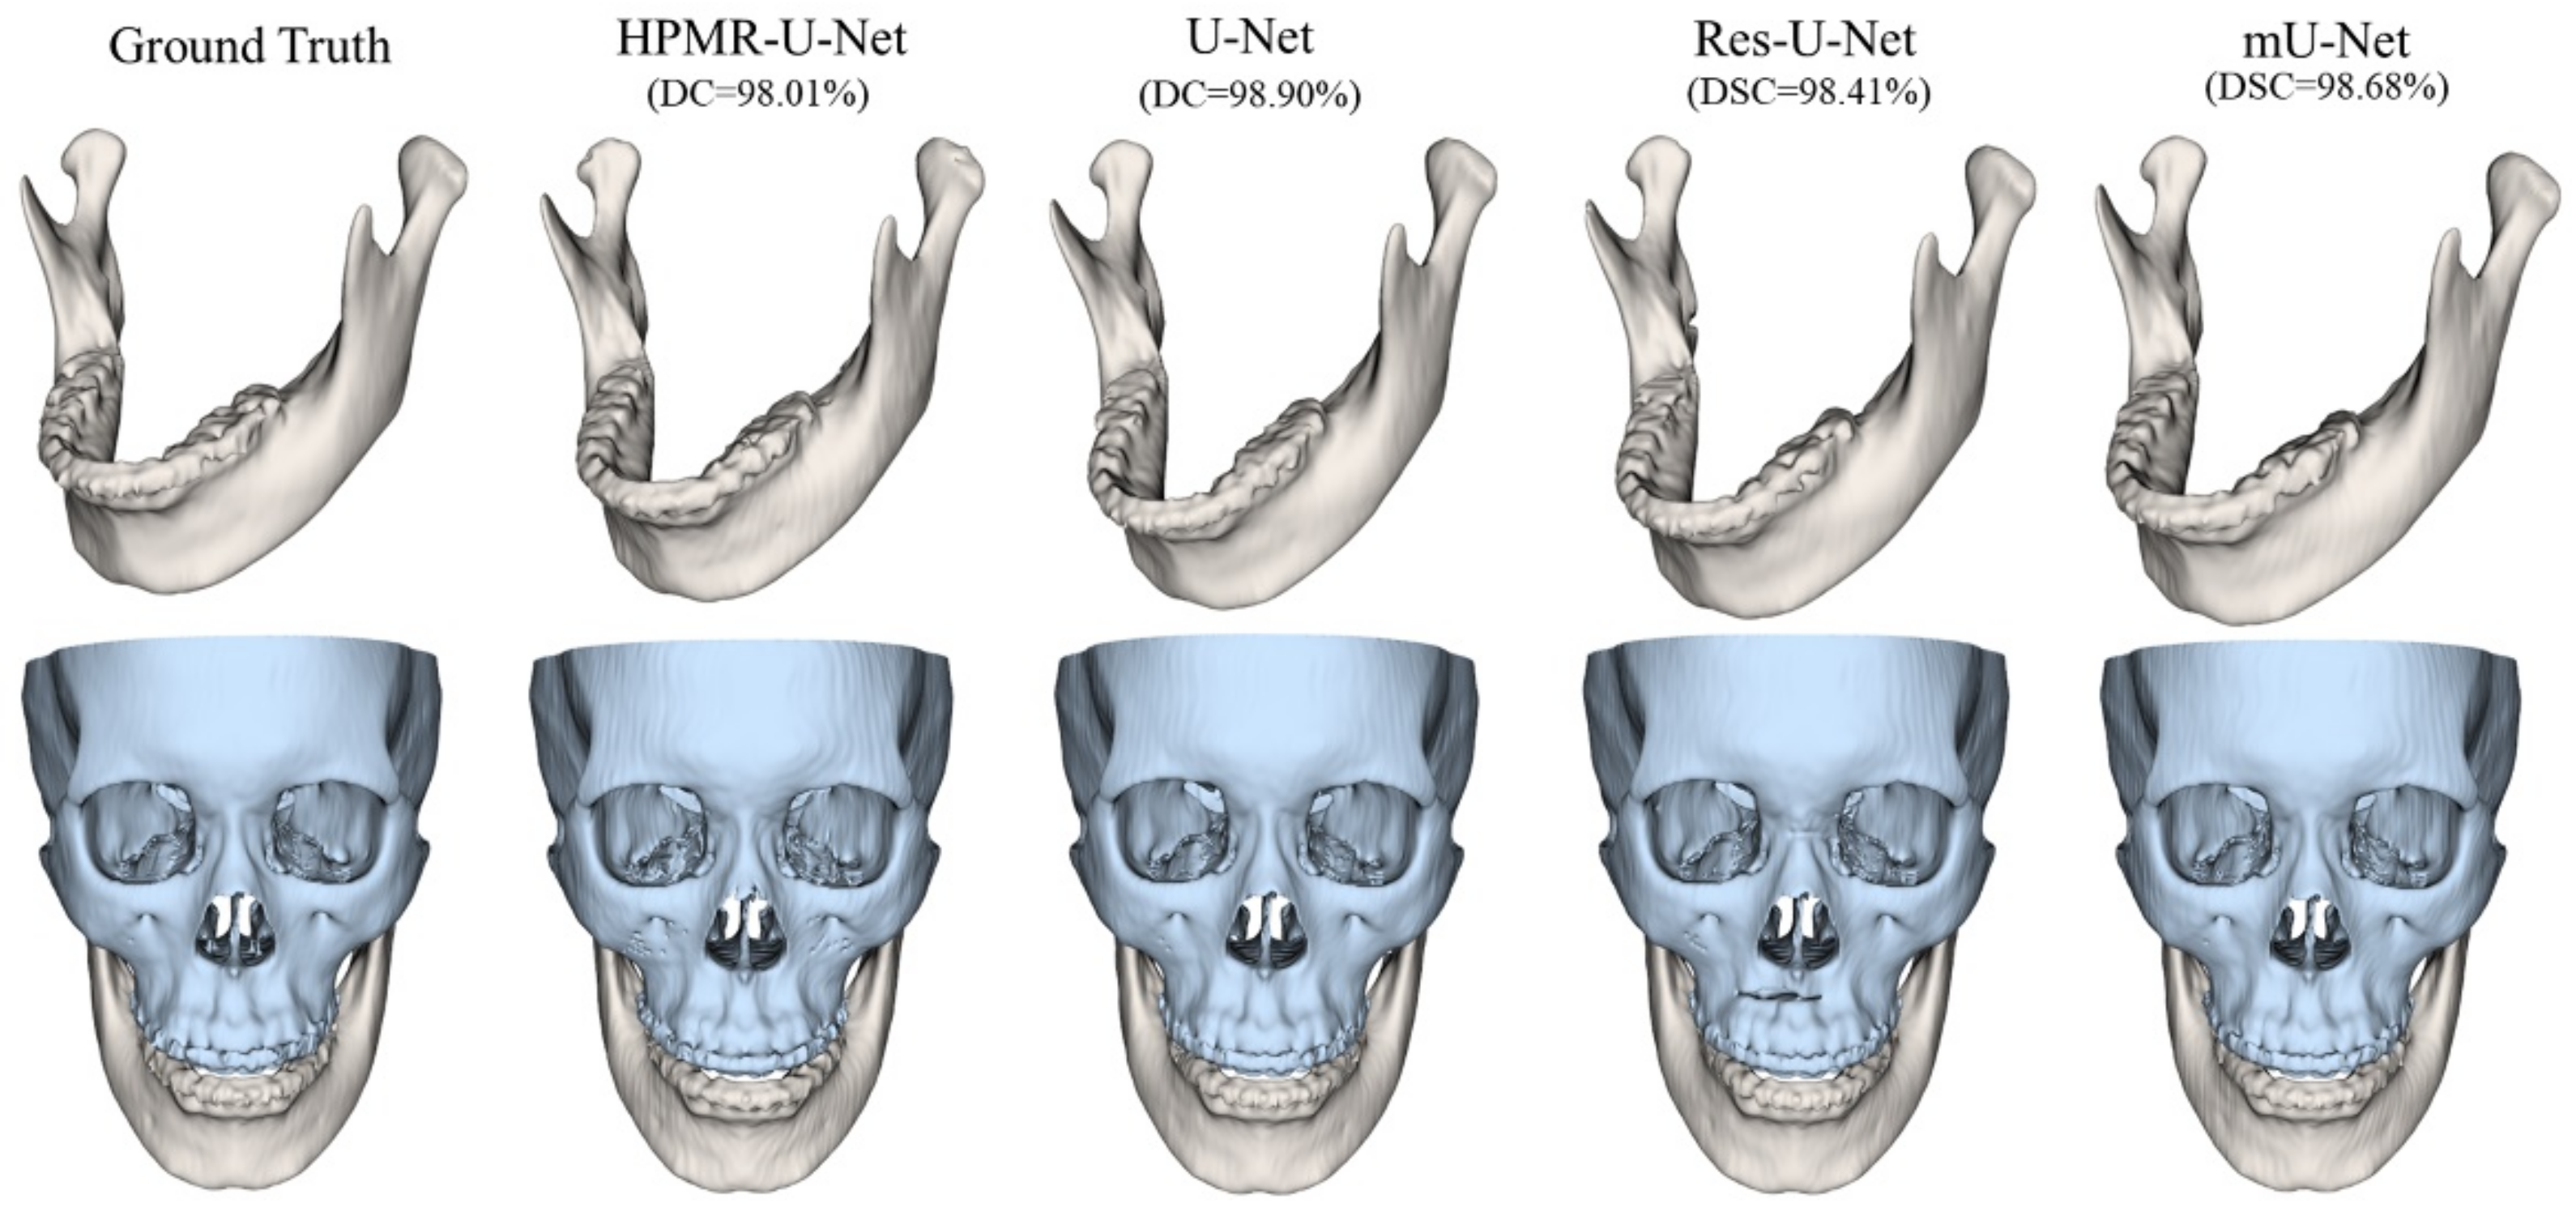
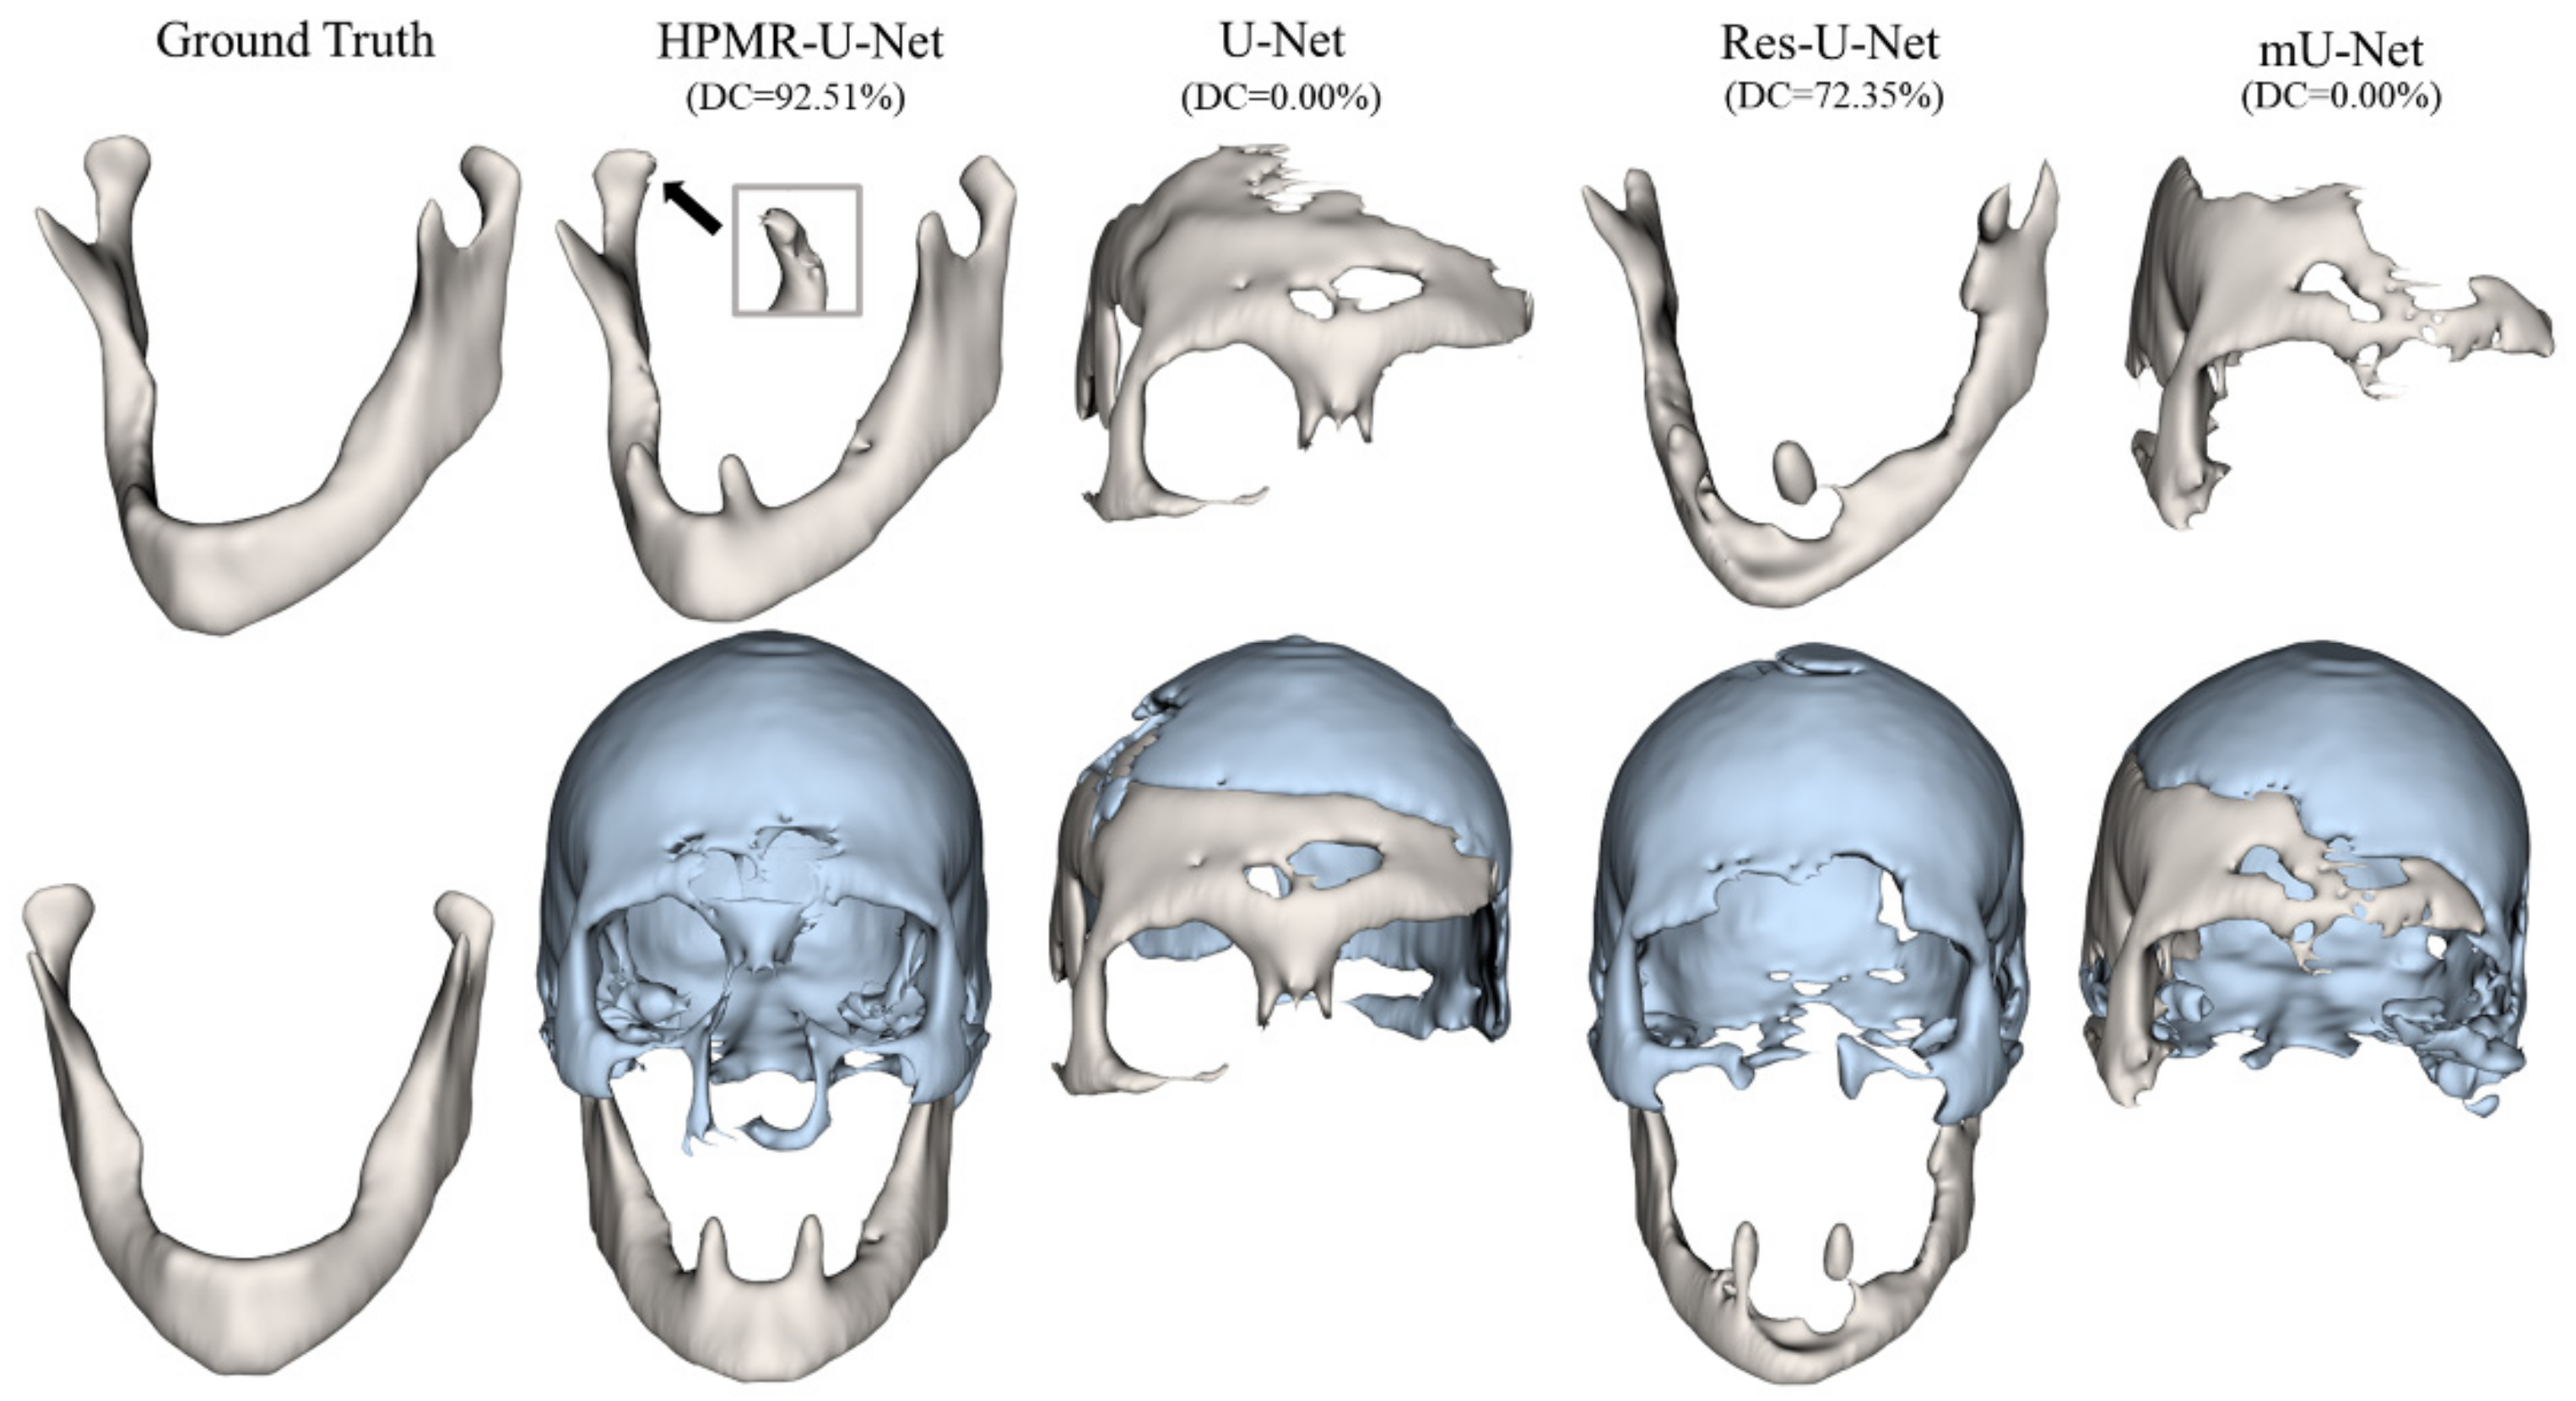
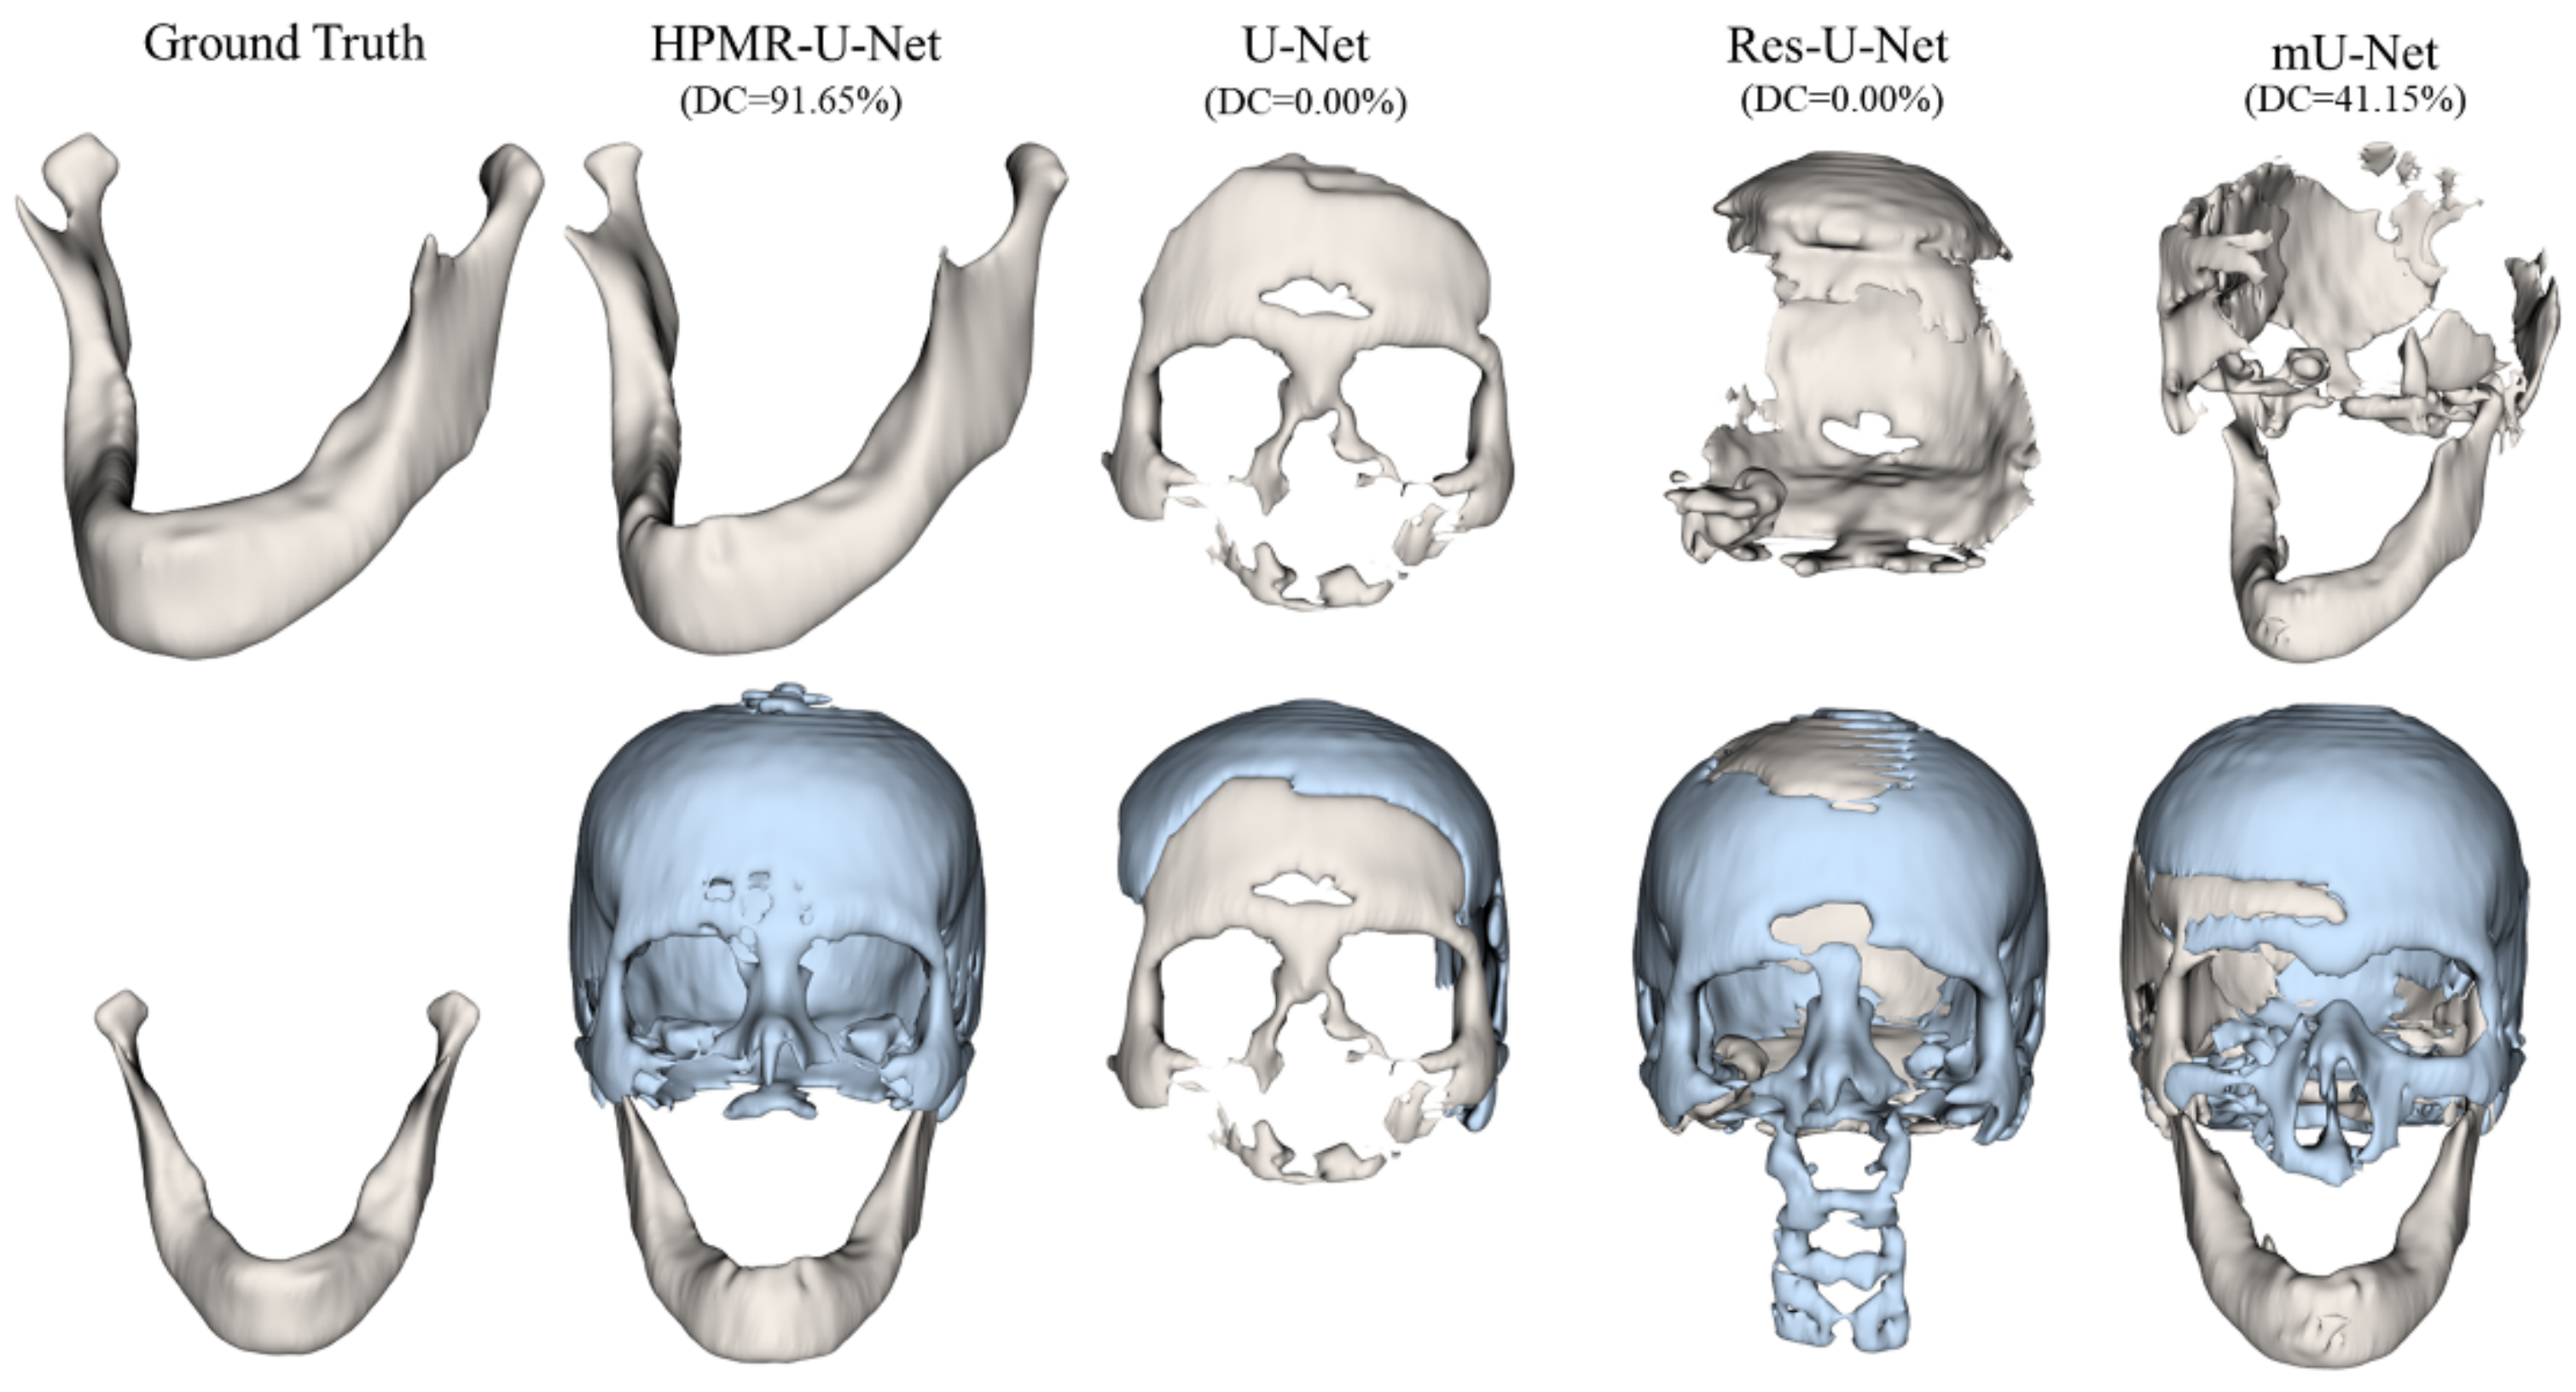
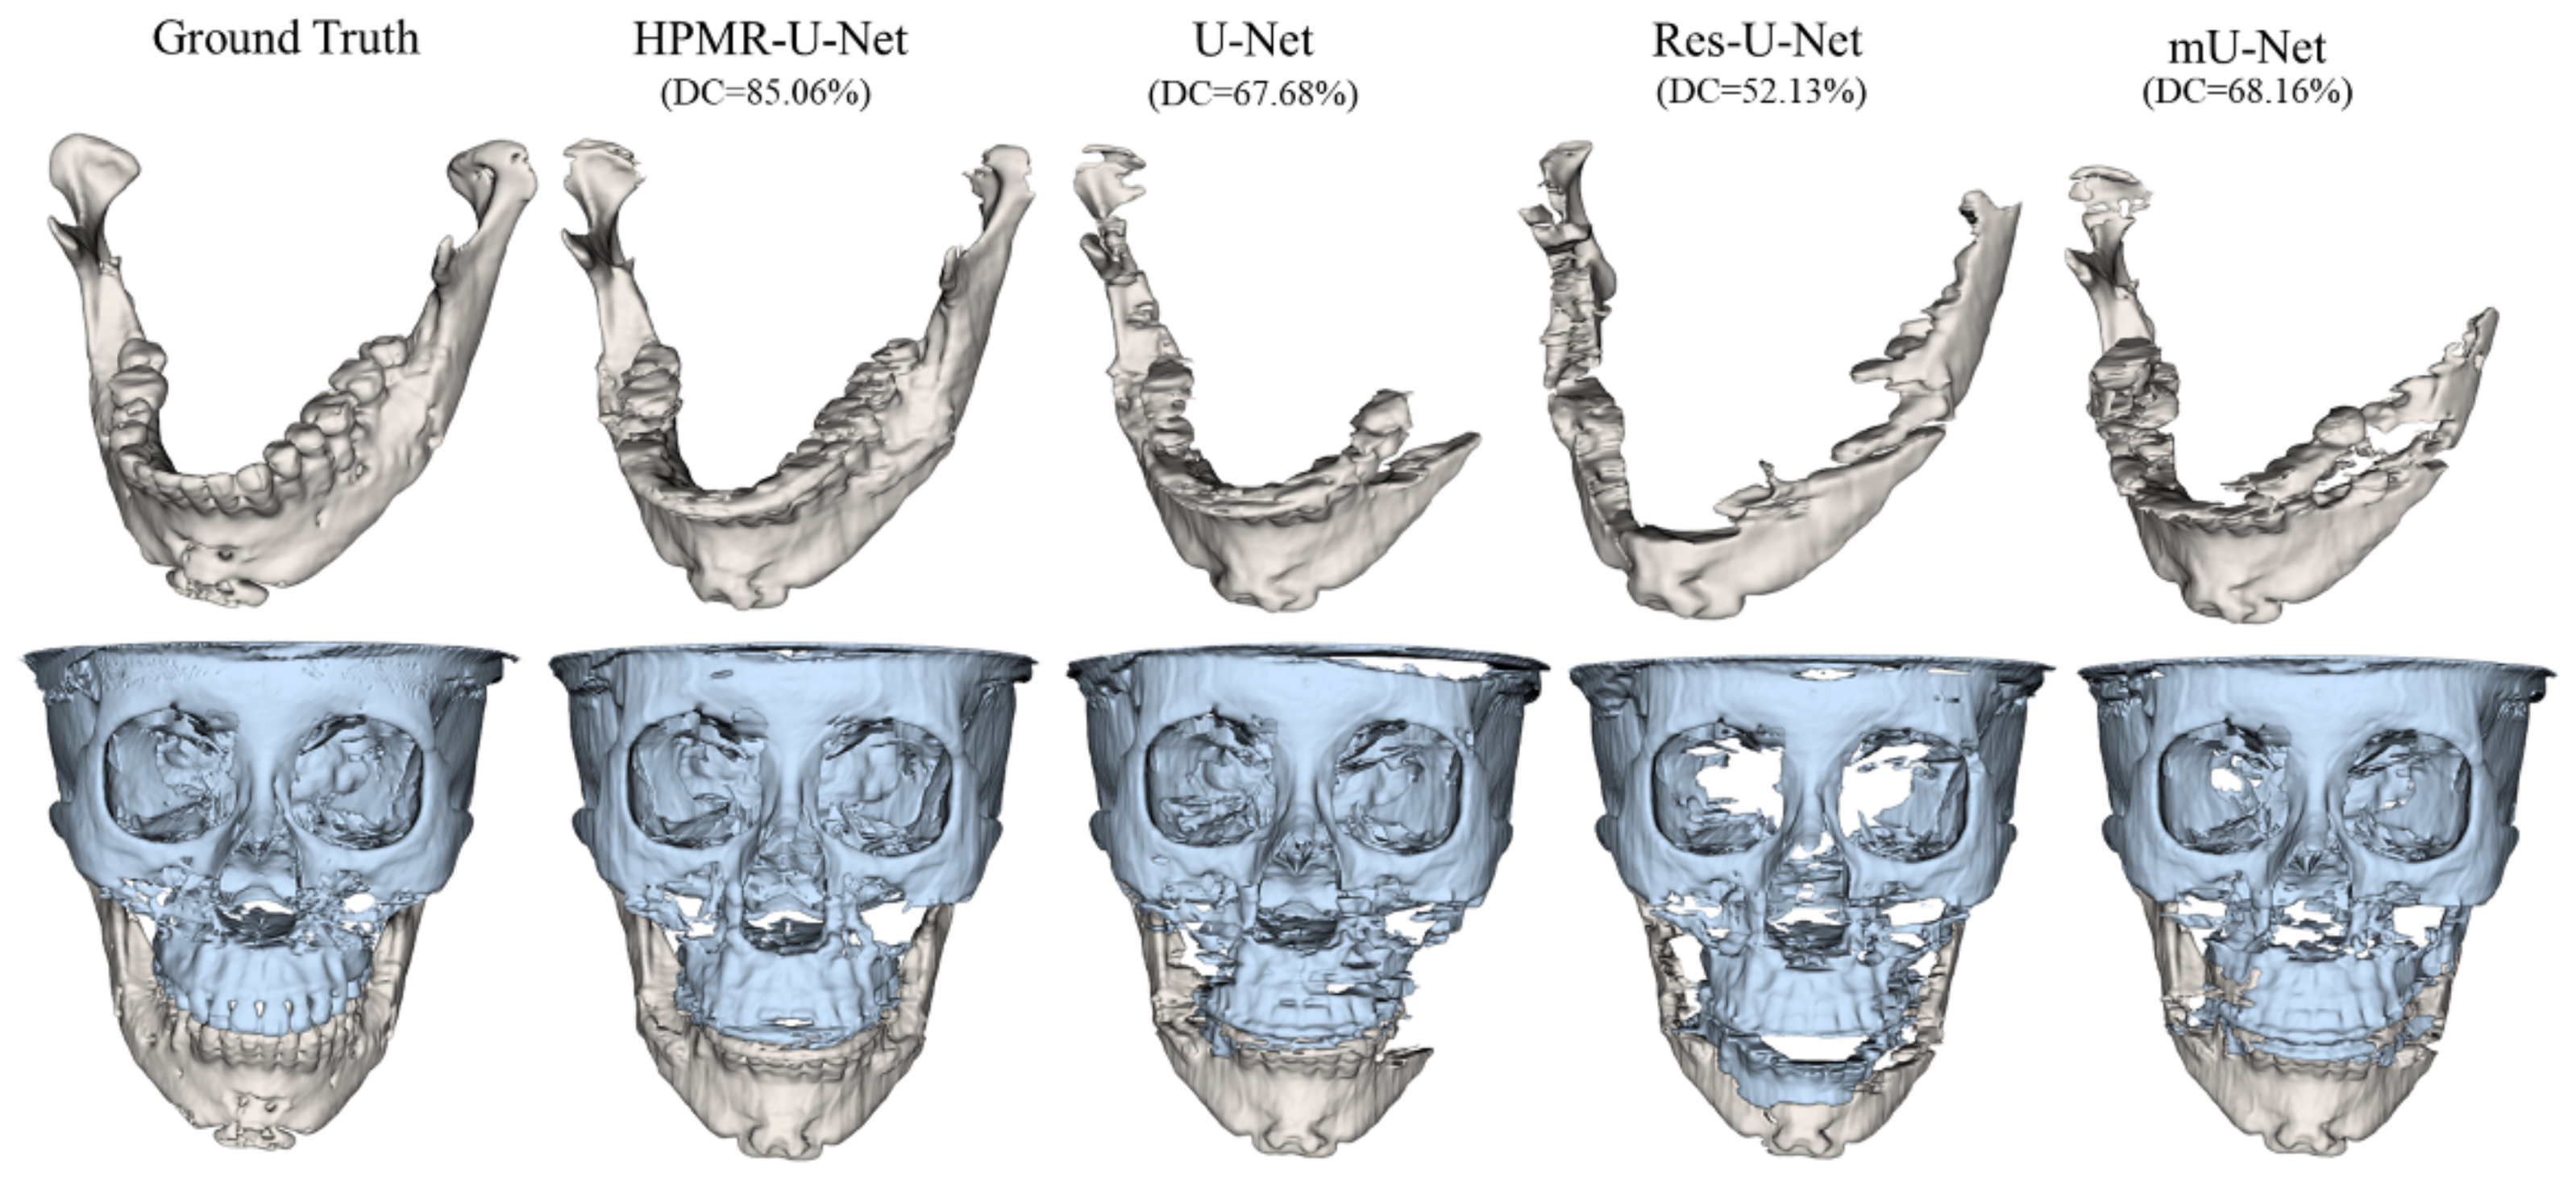
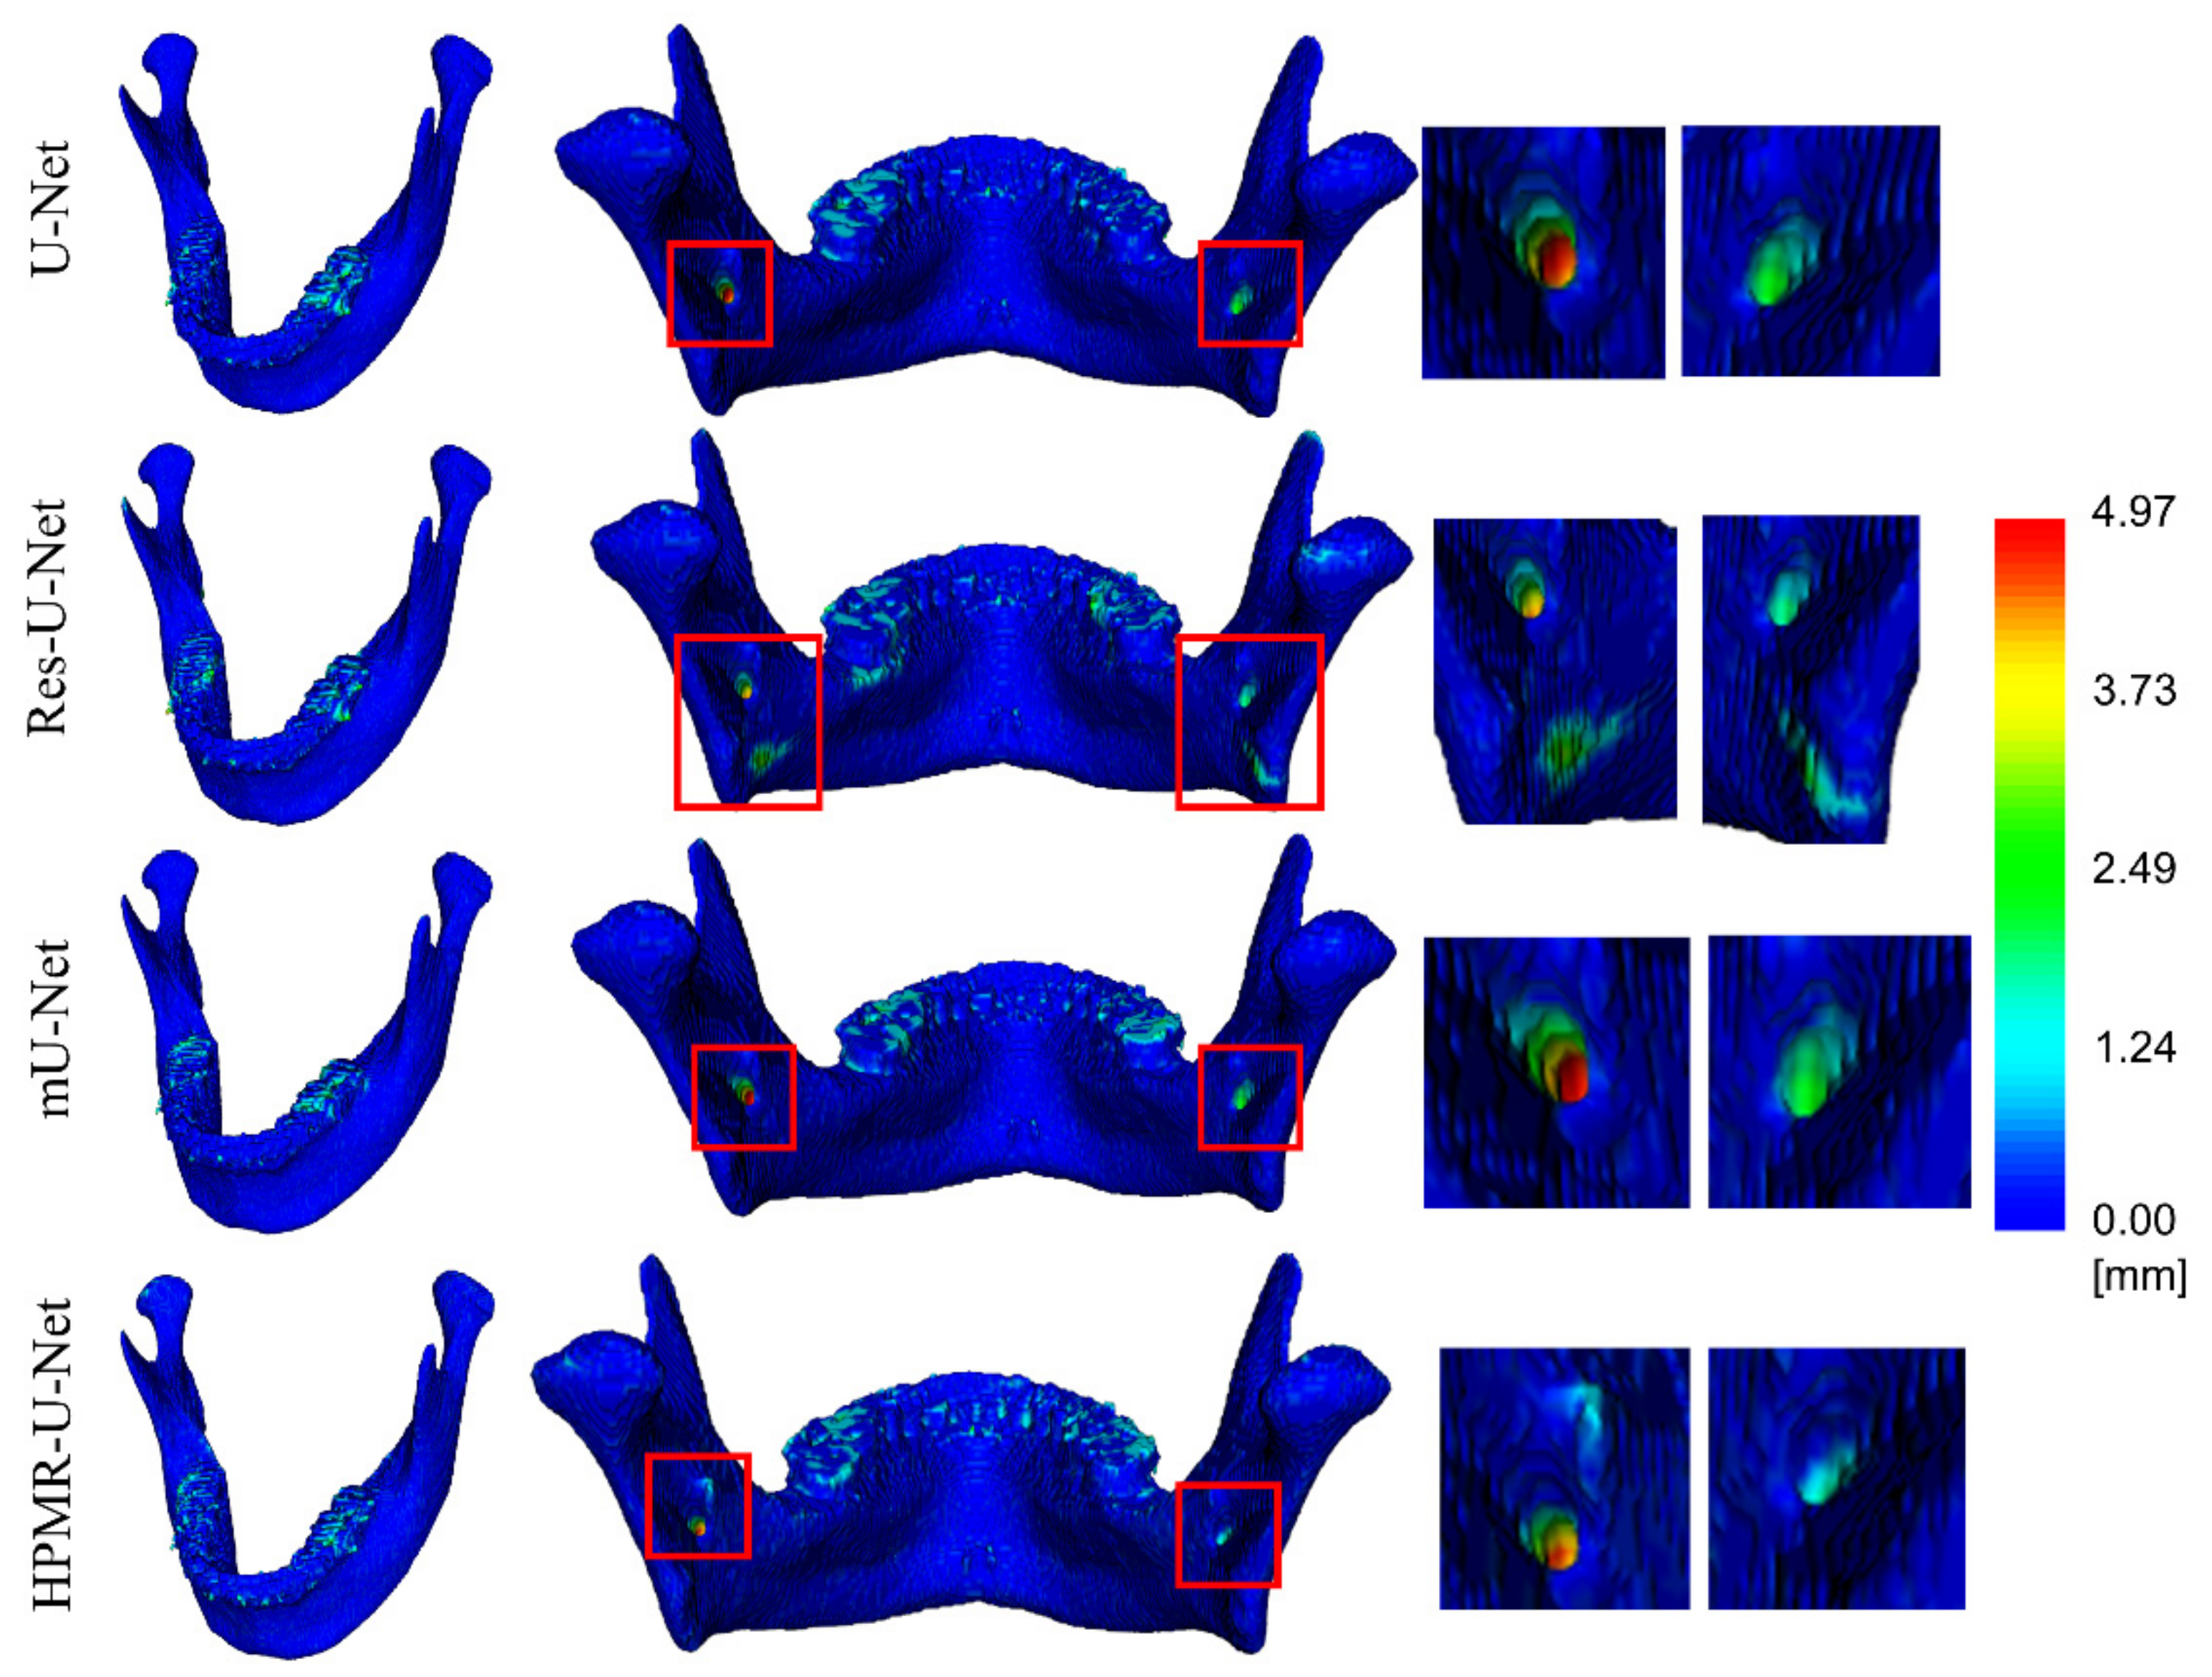
To evaluate the regular segmentation performance of the models, an in-house test was conducted with the separated test portion of CenterA dataset, with the ground truths and output segmentations from the models compared. Additionally, an external test was performed to evaluate the data compatibility in the models. Output segmentations for CT scans in external datasets (PDDCA, TCIA, and CenterB) were obtained and compared with the ground truths. The external test characterizes how the model can be utilized generally in varied data, which is common in clinical settings. In the absence of maxilla segmentations in the PDDCA and TCIA datasets, only mandible segmentations were considered. To quantitatively evaluate the segmentation performance of the models, we used the Dice coefficient (DC), 95% Hausdorff distance (95HD) and average surface distance (ASD) as evaluation metrics. Additionally, we qualitatively evaluated the segmentation results of the models by visualizing them in 3D.
The DC measures the degree of volumetric overlap between two volumes. It is defined as
DC = 2 GT OUT GT + OUT ,
where GT and OUT are the labeled voxel sets of the manual segmentation ground truth and output segmentation from the model, respectively.
The 95HD and ASD are distance-related metrics, with 95HD being the 95th percentile of the Hausdorff distance (HD) between the GT and OUT points. HD measures the distance of a point in the GT to the nearest point in the OUT. It is defined as
max gt GT   min out OUT gt out .
The 95th percentile is used to eliminate the impact of outliers from a small subset of inaccurate points when evaluating the overall segmentation performance. ASD measures the average distance between the GT and the OUT, defined as:
ASD   = 1 2 out OUT d out ,   GT OUT + gt GT d gt ,   OUT GT ,
where d out , GT is the minimum distance of a voxel on OUT to the voxels on GT, and d gt , OUT is the minimum distance of voxel gt on GT to the voxels on OUT.

3. Results

Table 2 and Table 3 display the calculated evaluation metrics between the ground truths and the model outputs for the in-house and external tests. In the in-house test with the CenterA dataset, although the scores of HPMR-U-Net were not the best among the models, the score differences were lower compared to those for the other datasets. From the result, it can be inferred that the performance of HPMR-U-Net for the CenterA dataset was comparable to that of the other models. In the external tests, the scores of HPMR-U-Net ranked first for all external datasets. The results indicate that HPMR-U-Net has the highest performance among the models in this study for the external datasets. Comparing results among external datasets, the differences in scores were the largest in the CenterB dataset, where CenterB dataset may have the largest characteristic difference in the image obtained by CBCT as compared to CenterA dataset acquired by MDCT.
Figure 5, Figure 6, Figure 7 and Figure 8 show 3D rendered ground truths and the highest DC cases of the output segmentations converted to isosurfaces from volumes for each dataset. Corresponding to the results of the quantitative tests, the ground truth and the outputs for the CenterA dataset are similar for all models, as shown in Figure 5. By contrast, for the external datasets, there are visually noticeable differences in the output segmentations of HPMR-U-Net and other models.
There were prominent decreases in quality of segmentations from other models for the external datasets. For the PDDCA dataset in Figure 6, the DC scores for the mandible of U-Net and mU-Net were 0.0%, as the model could not find the mandible at all, that is, they were unable to distinguish between the mandible and the maxilla. There were also many losses in the segmentations of the mandible and maxilla in the outputs of Res-U-Net. By contrast, the outputs of HPMR-U-Net were more intact and closer to the ground truth. As the teeth were included in the CenterA dataset segmentations that were used in training, the teeth were also segmented, despite not being in the ground truth. The results for the TCIA dataset in Figure 7 are also similar to those of the PDDCA dataset. U-Net and Res-U-Net failed to segment the mandible, which resulted in a 0.0% DC. Additionally, mU-Net included many portions of the maxilla in the mandible output and lost a large portion of the segmentations. However, HPMR-U-Net exhibited high performance with a DC of 91.7%. As displayed in Figure 8 for the CenterB dataset, HPMR-U-Net also showed the highest performance among the models, with many lost sections in the other models. Furthermore, the other models were more unable to accurately separate the mandible and maxilla compared to HPMR-U-Net.
Figure 9 shows rendered color maps in 3D for the distance from the ground truths to the output segmentations of the best DC case for the mandible in CenterA dataset to thoroughly examine the differences among the model outputs for this dataset. There were no significant differences, but the distances in the mandibular foramen were slightly different. This part is challenging to segment accurately owing to its small size, and the distance was less in the outputs of HPMR-U-Net than the other models.

4. Discussion & Conclusions

The four neural networks compared in this research exhibited similar performance in the CenterA dataset, which was the domain used for training. Among other neural networks, U-Net and Res-U-Net were considered for the comparison because U-Net is a basic component of HPMR-U-Net, in which showing a difference would represent that HPMR block is effective compared to other basic architectures. Additionally, mU-Net was selected for the comparison as a state-of-the-art neural network for segmentation. We chose comparably simple neural networks because we hypothesized that the data compatibility of the more complex model with larger number of parameters would be worse because of overfitting. CenterA dataset was set as the train dataset because it was MDCT datasets in which easier to make ground truths than CBCT. With training with a dataset easier to constitute, we aimed to show the performance for other institutional MDCTs and CBCTs.
PDDCA and TCIA datasets were used for examples of MDCT and CenterB dataset for CBCT. For the external datasets of PDDCA, TCIA, and CenterB, HPMR-U-Net displayed significantly higher performance compared to the U-Net, Res-U-Net, and mU-Net models in both quantitative and qualitative evaluations.
All networks produced comparable results for data from the same cohort of the training dataset; however, they exhibited different results for data from out of the training dataset cohort. While the performances of other networks were degraded in the external datasets, HPMR-U-Net produced segmentation of the mandible and maxilla similar to the ground truths. From these results, HPMR-U-Net infers a high data compatibility for mandible and maxilla features in CT images.
The assumed differences in the data cohorts were reflected in the results. For the PDDCA and TCIA datasets, the performance degraded significantly, and the mandible and maxilla were not classified accurately. This is due to their slice thickness being different from that of CenterA dataset, even though they are MDCT. The inter-slice information is important to classify a pixel in a slice as the mandible or maxilla. The results for CenterB dataset were the worst among the external datasets for all models. The segmentation of CenterB dataset is more challenging as it is CBCT, which is not only different from the in-house dataset, but also contains more noise. Additionally, CenterB dataset contains variances in anatomical structure caused by surgeries and noise from surgical plates, orthodontic device, and dental implants (Figure 3). It is remarkable that the score difference between HPMR-U-Net and other models is significant for CenterB. For CBCT, which is a different image protocol than MDCT that was used to train, there was a significant degradation of performance in other models, but minimal degradation in HPMR-U-Net. This demonstrates that HPMR-U-Net is more robust than other models to various data domains that may be different from the training data.
We assume that one of the reasons for the better performance of HPMR-U-Net compared to Res-U-Net is the number of parameters. The higher the complexity of the hypothesis space of the deep neural network, the worse is the generalizability, according to the principle of Occam’s razor [51]. The number of parameters in HPMR-U-Net is 12,042,179, which is smaller than Res-U-Net with 17,118,019, U-Net with 28,959,299, and mU-Net with 35,230,019. The HPMR block could efficiently decrease the overall number of parameters, which as a result could enhance the generalizability of the model while maintaining its segmentation performance.
In future work, an attempt will be made to improve the performance in external datasets for actual clinical applications when the neural network is trained with only one data domain. Additionally, the structure of the neural network with residual connections and HPMR block can be analyzed theoretically to establish the reason for the greater generalizability, which may lead to the design of a stronger neural network for generalization.
In this study, we applied deep learning to accurately segment the mandible and maxilla from CT and improve the compatibility in the segmentation model. To achieve this, we utilized HPMR-U-Net and compared its results with those of U-Net, Res-U-Net, and mU-Net with in-house and external tests. The results show that the segmentation performance of HPMR-U-Net in the in-house test dataset was comparable to that of the other models. In particular, the data compatibility of HPMR-U-Net was superior to other models in the external datasets of PDDCA, TCIA, and CenterB, which have varying properties such as image protocol, pixel spacing, slice thickness, and target range.

Author Contributions

Conceptualization, S.P., E.S., Y.K., J.-W.L. and H.S.; methodology, S.P., H.K. and H.S.; software, S.P., H.K. and E.S.; validation, S.P.; formal analysis, S.P.; investigation, S.P.; resources, Y.K. and H.S.; data curation, B.-Y.H. and J.-W.L.; writing—original draft preparation, S.P.; writing—review and editing, S.P., H.K., Y.K., J.-W.L. and H.S.; visualization, S.P. and H.K.; supervision, Y.K., J.-W.L. and H.S.; project administration, Y.K., J.-W.L. and H.S.; funding acquisition, Y.K., J.-W.L. and H.S. All authors have read and agreed to the published version of the manuscript.

Funding

This research was supported by KIST Institutional Program (grant number: 2E31158) and the Korea Medical Device Development Fund grant funded by the Korea government (the Ministry of Science and ICT, the Ministry of Trade, Industry and Energy, the Ministry of Health & Welfare, the Ministry of Food and Drug Safety) (Project Number: 9991006675, 202011A02, KMDF_PR_20200901_0002). In addition, this research was supported by a grant of the Korea Health Technology R&D Project through the Korea Health Industry Development Institute (KHIDI), funded by the Ministry of Health & Welfare, Republic of Korea (grant number: HI18C1224).

Institutional Review Board Statement

The study was approved by the Institutional Review Board of Chungang University Hospital, Seoul, Korea (1922-007-362) and Kyung Hee University Hospital, Seoul, Korea (KH-DT19033).

Informed Consent Statement

Patient consent was waived because it was stated that the data can be used retrospectively without DICOM tags in IRB approval.

Data Availability Statement

Data sharing is not applicable to this article.

Acknowledgments

The authors wish to express their thanks for the support of Uilyong Lee (Department Oral and maxillofacial Surgery, Chung-Ang University) in the collection of datasets.

Conflicts of Interest

The authors declare no conflict of interest.

References

  1. Qiu, B.; Guo, J.; Kraeima, J.; Glas, H.H.; Borra, R.J.; Witjes, M.J.; van Ooijen, P.M. Automatic Segmentation of the Mandible from Computed Tomography Scans for 3D Virtual Surgical Planning Using the Convolutional Neural Network. Phys. Med. Biol. 2019, 64, 175020. [Google Scholar] [CrossRef] [PubMed]
  2. Wang, L.; Chen, K.C.; Gao, Y.; Shi, F.; Liao, S.; Li, G.; Shen, S.G.; Yan, J.; Lee, P.K.; Chow, B. Automated Bone Segmentation from Dental CBCT Images Using Patch-based Sparse Representation and Convex Optimization. Med. Phys. 2014, 41, 043503. [Google Scholar] [CrossRef] [PubMed] [Green Version]
  3. Kodym, O.; Španěl, M.; Herout, A. Segmentation of Head and Neck Organs at Risk Using Cnn with Batch Dice Loss. In Proceedings of the German Conference on Pattern Recognition; Springer: Stuttgart, Germany, 2018; pp. 105–114. [Google Scholar]
  4. Byrne, N.; Velasco Forte, M.; Tandon, A.; Valverde, I.; Hussain, T. A Systematic Review of Image Segmentation Methodology, Used in the Additive Manufacture of Patient-Specific 3D Printed Models of the Cardiovascular System. JRSM Cardiovasc. Dis. 2016, 5, 2048004016645467. [Google Scholar] [CrossRef] [PubMed] [Green Version]
  5. Huff, T.J.; Ludwig, P.E.; Zuniga, J.M. The Potential for Machine Learning Algorithms to Improve and Reduce the Cost of 3-Dimensional Printing for Surgical Planning. Expert Rev. Med. Devices 2018, 15, 349–356. [Google Scholar] [CrossRef]
  6. Wang, Z.; Wei, L.; Wang, L.; Gao, Y.; Chen, W.; Shen, D. Hierarchical Vertex Regression-Based Segmentation of Head and Neck CT Images for Radiotherapy Planning. IEEE Trans. Image Process. 2017, 27, 923–937. [Google Scholar] [CrossRef]
  7. Qiu, B.; Guo, J.; Kraeima, J.; Glas, H.H.; Borra, R.J.; Witjes, M.J.; Ooijen, P.M.V. Recurrent Convolutional Neural Networks for Mandible Segmentation from Computed Tomography. arXiv 2020, arXiv:2003.06486. [Google Scholar]
  8. Raudaschl, P.F.; Zaffino, P.; Sharp, G.C.; Spadea, M.F.; Chen, A.; Dawant, B.M.; Albrecht, T.; Gass, T.; Langguth, C.; Lüthi, M. Evaluation of Segmentation Methods on Head and Neck CT: Auto-segmentation Challenge 2015. Med. Phys. 2017, 44, 2020–2036. [Google Scholar] [CrossRef]
  9. Chen, A.; Dawant, B. A Multi-Atlas Approach for the Automatic Segmentation of Multiple Structures in Head and Neck CT Images. MIDAS J. 2015. [Google Scholar] [CrossRef]
  10. Mannion-Haworth, R.; Bowes, M.; Ashman, A.; Guillard, G.; Brett, A.; Vincent, G. Fully Automatic Segmentation of Head and Neck Organs Using Active Appearance Models. MIDAS J. 2015. [Google Scholar] [CrossRef]
  11. Han, X.; Hoogeman, M.S.; Levendag, P.C.; Hibbard, L.S.; Teguh, D.N.; Voet, P.; Cowen, A.C.; Wolf, T.K. Atlas-Based Auto-Segmentation of Head and Neck CT Images; Springer: Berlin/Heidelberg, Germany, 2008; pp. 434–441. [Google Scholar]
  12. Linares, O.C.; Bianchi, J.; Raveli, D.; Neto, J.B.; Hamann, B. Mandible and Skull Segmentation in Cone Beam Computed Tomography Using Super-Voxels and Graph Clustering. Vis. Comput. 2019, 35, 1461–1474. [Google Scholar]
  13. Zhu, W.; Huang, Y.; Zeng, L.; Chen, X.; Liu, Y.; Qian, Z.; Du, N.; Fan, W.; Xie, X. AnatomyNet: Deep Learning for Fast and Fully Automated Whole-volume Segmentation of Head and Neck Anatomy. Med. Phys. 2019, 46, 576–589. [Google Scholar] [CrossRef] [PubMed] [Green Version]
  14. Cootes, T.F.; Edwards, G.J.; Taylor, C.J. Active Appearance Models. IEEE Trans. Pattern Anal. Mach. Intell. 2001, 23, 681–685. [Google Scholar] [CrossRef] [Green Version]
  15. Fritscher, K.D.; Peroni, M.; Zaffino, P.; Spadea, M.F.; Schubert, R.; Sharp, G. Automatic Segmentation of Head and Neck CT Images for Radiotherapy Treatment Planning Using Multiple Atlases, Statistical Appearance Models, and Geodesic Active Contours. Med. Phys. 2014, 41, 051910. [Google Scholar] [CrossRef] [PubMed]
  16. Albrecht, T.; Gass, T.; Langguth, C.; Lüthi, M. Multi Atlas Segmentation with Active Shape Model Refinement for Multi-Organ Segmentation in Head and Neck Cancer Radiotherapy Planning. MIDAS J. 2015. [Google Scholar] [CrossRef]
  17. Aghdasi, N.; Li, Y.; Berens, A.; Moe, K.; Hannaford, B. Automatic Mandible Segmentation on CT Images Using Prior Anatomical Knowledge. MIDAS J. 2016. [Google Scholar] [CrossRef]
  18. Chuang, Y.J.; Doherty, B.M.; Adluru, N.; Chung, M.K.; Vorperian, H.K. A Novel Registration-Based Semi-Automatic Mandible Segmentation Pipeline Using Computed Tomography Images to Study Mandibular Development. J. Comput. Assist. Tomogr. 2018, 42, 306. [Google Scholar] [CrossRef]
  19. Shen, D.; Wu, G.; Suk, H.-I. Deep Learning in Medical Image Analysis. Annu. Rev. Biomed. Eng. 2017, 19, 221–248. [Google Scholar] [CrossRef] [Green Version]
  20. Ibragimov, B.; Xing, L. Segmentation of Organs-at-risks in Head and Neck CT Images Using Convolutional Neural Networks. Med. Phys. 2017, 44, 547–557. [Google Scholar] [CrossRef] [Green Version]
  21. Tong, N.; Gou, S.; Yang, S.; Ruan, D.; Sheng, K. Fully Automatic Multi-organ Segmentation for Head and Neck Cancer Radiotherapy Using Shape Representation Model Constrained Fully Convolutional Neural Networks. Med. Phys. 2018, 45, 4558–4567. [Google Scholar] [CrossRef] [Green Version]
  22. Ronneberger, O.; Fischer, P.; Brox, T. U-Net: Convolutional Networks for Biomedical Image Segmentation; Springer: Berlin/Heidelberg, Germany, 2015; pp. 234–241. [Google Scholar]
  23. Liu, L.; Cheng, J.; Quan, Q.; Wu, F.-X.; Wang, Y.-P.; Wang, J. A Survey on U-Shaped Networks in Medical Image Segmentations. Neurocomputing 2020, 409, 244–258. [Google Scholar] [CrossRef]
  24. Wang, Y.; Zhao, L.; Wang, M.; Song, Z. Organ at Risk Segmentation in Head and Neck Ct Images Using a Two-Stage Segmentation Framework Based on 3D U-Net. IEEE Access 2019, 7, 144591–144602. [Google Scholar] [CrossRef]
  25. Rundo, L.; Han, C.; Nagano, Y.; Zhang, J.; Hataya, R.; Militello, C.; Tangherloni, A.; Nobile, M.S.; Ferretti, C.; Besozzi, D.; et al. USE-Net: Incorporating Squeeze-and-Excitation Blocks into U-Net for Prostate Zonal Segmentation of Multi-Institutional MRI Datasets. Neurocomputing 2019, 365, 31–43. [Google Scholar] [CrossRef] [Green Version]
  26. Schlemper, J.; Oktay, O.; Schaap, M.; Heinrich, M.; Kainz, B.; Glocker, B.; Rueckert, D. Attention Gated Networks: Learning to Leverage Salient Regions in Medical Images. Med. Image Anal. 2019, 53, 197–207. [Google Scholar] [CrossRef] [PubMed]
  27. Yeung, M.; Sala, E.; Schönlieb, C.-B.; Rundo, L. Focus U-Net: A Novel Dual Attention-Gated CNN for Polyp Segmentation during Colonoscopy. Comput. Biol. Med. 2021, 137, 104815. [Google Scholar] [CrossRef] [PubMed]
  28. Liang, X.; Nguyen, D.; Jiang, S.B. Generalizability Issues with Deep Learning Models in Medicine and Their Potential Solutions: Illustrated with Cone-Beam Computed Tomography (CBCT) to Computed Tomography (CT) Image Conversion. Mach. Learn. Sci. Technol. 2020, 2, 015007. [Google Scholar] [CrossRef]
  29. Qiu, B.; van der Wel, H.; Kraeima, J.; Glas, H.H.; Guo, J.; Borra, R.J.H.; Witjes, M.J.H.; van Ooijen, P.M.A. Automatic Segmentation of Mandible from Conventional Methods to Deep Learning—A Review. J. Pers. Med. 2021, 11, 629. [Google Scholar] [CrossRef]
  30. Hesse, L.S.; Kuling, G.; Veta, M.; Martel, A.L. Intensity Augmentation to Improve Generalizability of Breast Segmentation Across Different MRI Scan Protocols. IEEE Trans. Biomed. Eng. 2021, 68, 759–770. [Google Scholar] [CrossRef]
  31. Bosniak, M.A. The Current Radiological Approach to Renal Cysts. Radiology 1986, 158, 1–10. [Google Scholar] [CrossRef]
  32. Bluemke, D.A.; Moy, L.; Bredella, M.A.; Ertl-Wagner, B.B.; Fowler, K.J.; Goh, V.J.; Halpern, E.F.; Hess, C.P.; Schiebler, M.L.; Weiss, C.R. Assessing Radiology Research on Artificial Intelligence: A Brief Guide for Authors, Reviewers, and Readers—From the Radiology Editorial Board. Radiology 2020, 294, 487–489. [Google Scholar] [CrossRef] [Green Version]
  33. Kim, H.; Shim, E.; Park, J.; Kim, Y.-J.; Lee, U.; Kim, Y. Web-Based Fully Automated Cephalometric Analysis by Deep Learning. Comput. Methods Programs Biomed. 2020, 194, 105513. [Google Scholar] [CrossRef]
  34. Tao, Q.; Yan, W.; Wang, Y.; Paiman, E.H.M.; Shamonin, D.P.; Garg, P.; Plein, S.; Huang, L.; Xia, L.; Sramko, M.; et al. Deep Learning–Based Method for Fully Automatic Quantification of Left Ventricle Function from Cine MR Images: A Multivendor, Multicenter Study. Radiology 2019, 290, 81–88. [Google Scholar] [CrossRef] [PubMed] [Green Version]
  35. B, S.; R, N. Transfer Learning Based Automatic Human Identification Using Dental Traits- An Aid to Forensic Odontology. J. Forensic Leg. Med. 2020, 76, 102066. [Google Scholar] [CrossRef] [PubMed]
  36. Ghafoorian, M.; Mehrtash, A.; Kapur, T.; Karssemeijer, N.; Marchiori, E.; Pesteie, M.; Guttmann, C.R.G.; de Leeuw, F.-E.; Tempany, C.M.; van Ginneken, B.; et al. Transfer Learning for Domain Adaptation in MRI: Application in Brain Lesion Segmentation. In International Conference on Medical Image Computing and Computer-Assisted Intervention; Springer: Berlin/Heidelberg, Germany, 2017; pp. 516–524. [Google Scholar] [CrossRef] [Green Version]
  37. Lee, K.-S.; Jung, S.-K.; Ryu, J.-J.; Shin, S.-W.; Choi, J. Evaluation of Transfer Learning with Deep Convolutional Neural Networks for Screening Osteoporosis in Dental Panoramic Radiographs. J. Clin. Med. 2020, 9, 392. [Google Scholar] [CrossRef] [PubMed] [Green Version]
  38. Weiss, K.; Khoshgoftaar, T.M.; Wang, D. A Survey of Transfer Learning. J. Big Data 2016, 3, 9. [Google Scholar] [CrossRef] [Green Version]
  39. He, K.; Zhang, X.; Ren, S.; Sun, J. Deep Residual Learning for Image Recognition. In Proceedings of the IEEE Conference on Computer Vision and Pattern Recognition, Las Vegas, NV, USA, 27–30 June 2016; pp. 770–778. [Google Scholar]
  40. Frei, S.; Cao, Y.; Gu, Q. Algorithm-Dependent Generalization Bounds for Overparameterized Deep Residual Networks. arXiv 2019, arXiv:1910.02934. [Google Scholar]
  41. Huang, K.; Tao, M.; Wang, Y.; Zhao, T. Why Do Deep Residual Networks Generalize Better than Deep Feedforward Networks? — A Neural Tangent Kernel Perspective. 2020, 12. arXiv 2020, arXiv:2002.06262. [Google Scholar]
  42. Ang, K.K.; Zhang, Q.; Rosenthal, D.I.; Nguyen-Tan, P.F.; Sherman, E.J.; Weber, R.S.; Galvin, J.M.; Bonner, J.A.; Harris, J.; El-Naggar, A.K. Randomized Phase III Trial of Concurrent Accelerated Radiation plus Cisplatin with or without Cetuximab for Stage III to IV Head and Neck Carcinoma: RTOG 0522. J. Clin. Oncol. 2014, 32, 2940. [Google Scholar] [CrossRef]
  43. Nikolov, S.; Blackwell, S.; Zverovitch, A.; Mendes, R.; Livne, M.; De Fauw, J.; Patel, Y.; Meyer, C.; Askham, H.; Romera-Paredes, B. Deep Learning to Achieve Clinically Applicable Segmentation of Head and Neck Anatomy for Radiotherapy. arXiv 2018, arXiv:1809.04430. [Google Scholar]
  44. Clark, K.; Vendt, B.; Smith, K.; Freymann, J.; Kirby, J.; Koppel, P.; Moore, S.; Phillips, S.; Maffitt, D.; Pringle, M. The Cancer Imaging Archive (TCIA): Maintaining and Operating a Public Information Repository. J. Digit. Imaging 2013, 26, 1045–1057. [Google Scholar] [CrossRef] [Green Version]
  45. Bosch, W.R.; Straube, W.L.; Matthews, J.W.; Purdy, J.A. Data from Head-Neck_cetuximab. Cancer Imaging Arch. 2015, 10, K9. [Google Scholar]
  46. Han, X. Automatic Liver Lesion Segmentation Using A Deep Convolutional Neural Network Method. Med. Phys. 2017, 44, 1408–1419. [Google Scholar] [CrossRef] [PubMed] [Green Version]
  47. Bulat, A.; Tzimiropoulos, G. Binarized Convolutional Landmark Localizers for Human Pose Estimation and Face Alignment with Limited Resources. In Proceedings of the IEEE International Conference on Computer Vision, Venice, Italy, 22–29 October 2017; pp. 3706–3714. [Google Scholar]
  48. Szegedy, C.; Liu, W.; Jia, Y.; Sermanet, P.; Reed, S.; Anguelov, D.; Erhan, D.; Vanhoucke, V.; Rabinovich, A. Going Deeper with Convolutions. In Proceedings of the Proceedings of the IEEE Conference on Computer Vision and Pattern Recognition, Boston, MA, USA, 7–12 June 2015; pp. 1–9. [Google Scholar]
  49. Seo, H.; Huang, C.; Bassenne, M.; Xiao, R.; Xing, L. Modified U-Net (MU-Net) with Incorporation of Object-Dependent High Level Features for Improved Liver and Liver-Tumor Segmentation in CT Images. IEEE Trans. Med. Imaging 2019, 39, 1316–1325. [Google Scholar] [CrossRef] [PubMed] [Green Version]
  50. Gupta, S.; Gupta, R.; Ojha, M.; Singh, K.P. A Comparative Analysis of Various Regularization Techniques to Solve Overfitting Problem in Artificial Neural Network. In Proceedings of the Data Science and Analytics; Panda, B., Sharma, S., Roy, N.R., Eds.; Springer: Singapore, 2018; pp. 363–371. [Google Scholar]
  51. He, F.; Liu, T.; Tao, D. Why ResNet Works? Residuals Generalize. arXiv 2019, arXiv:1904.01367. [Google Scholar]
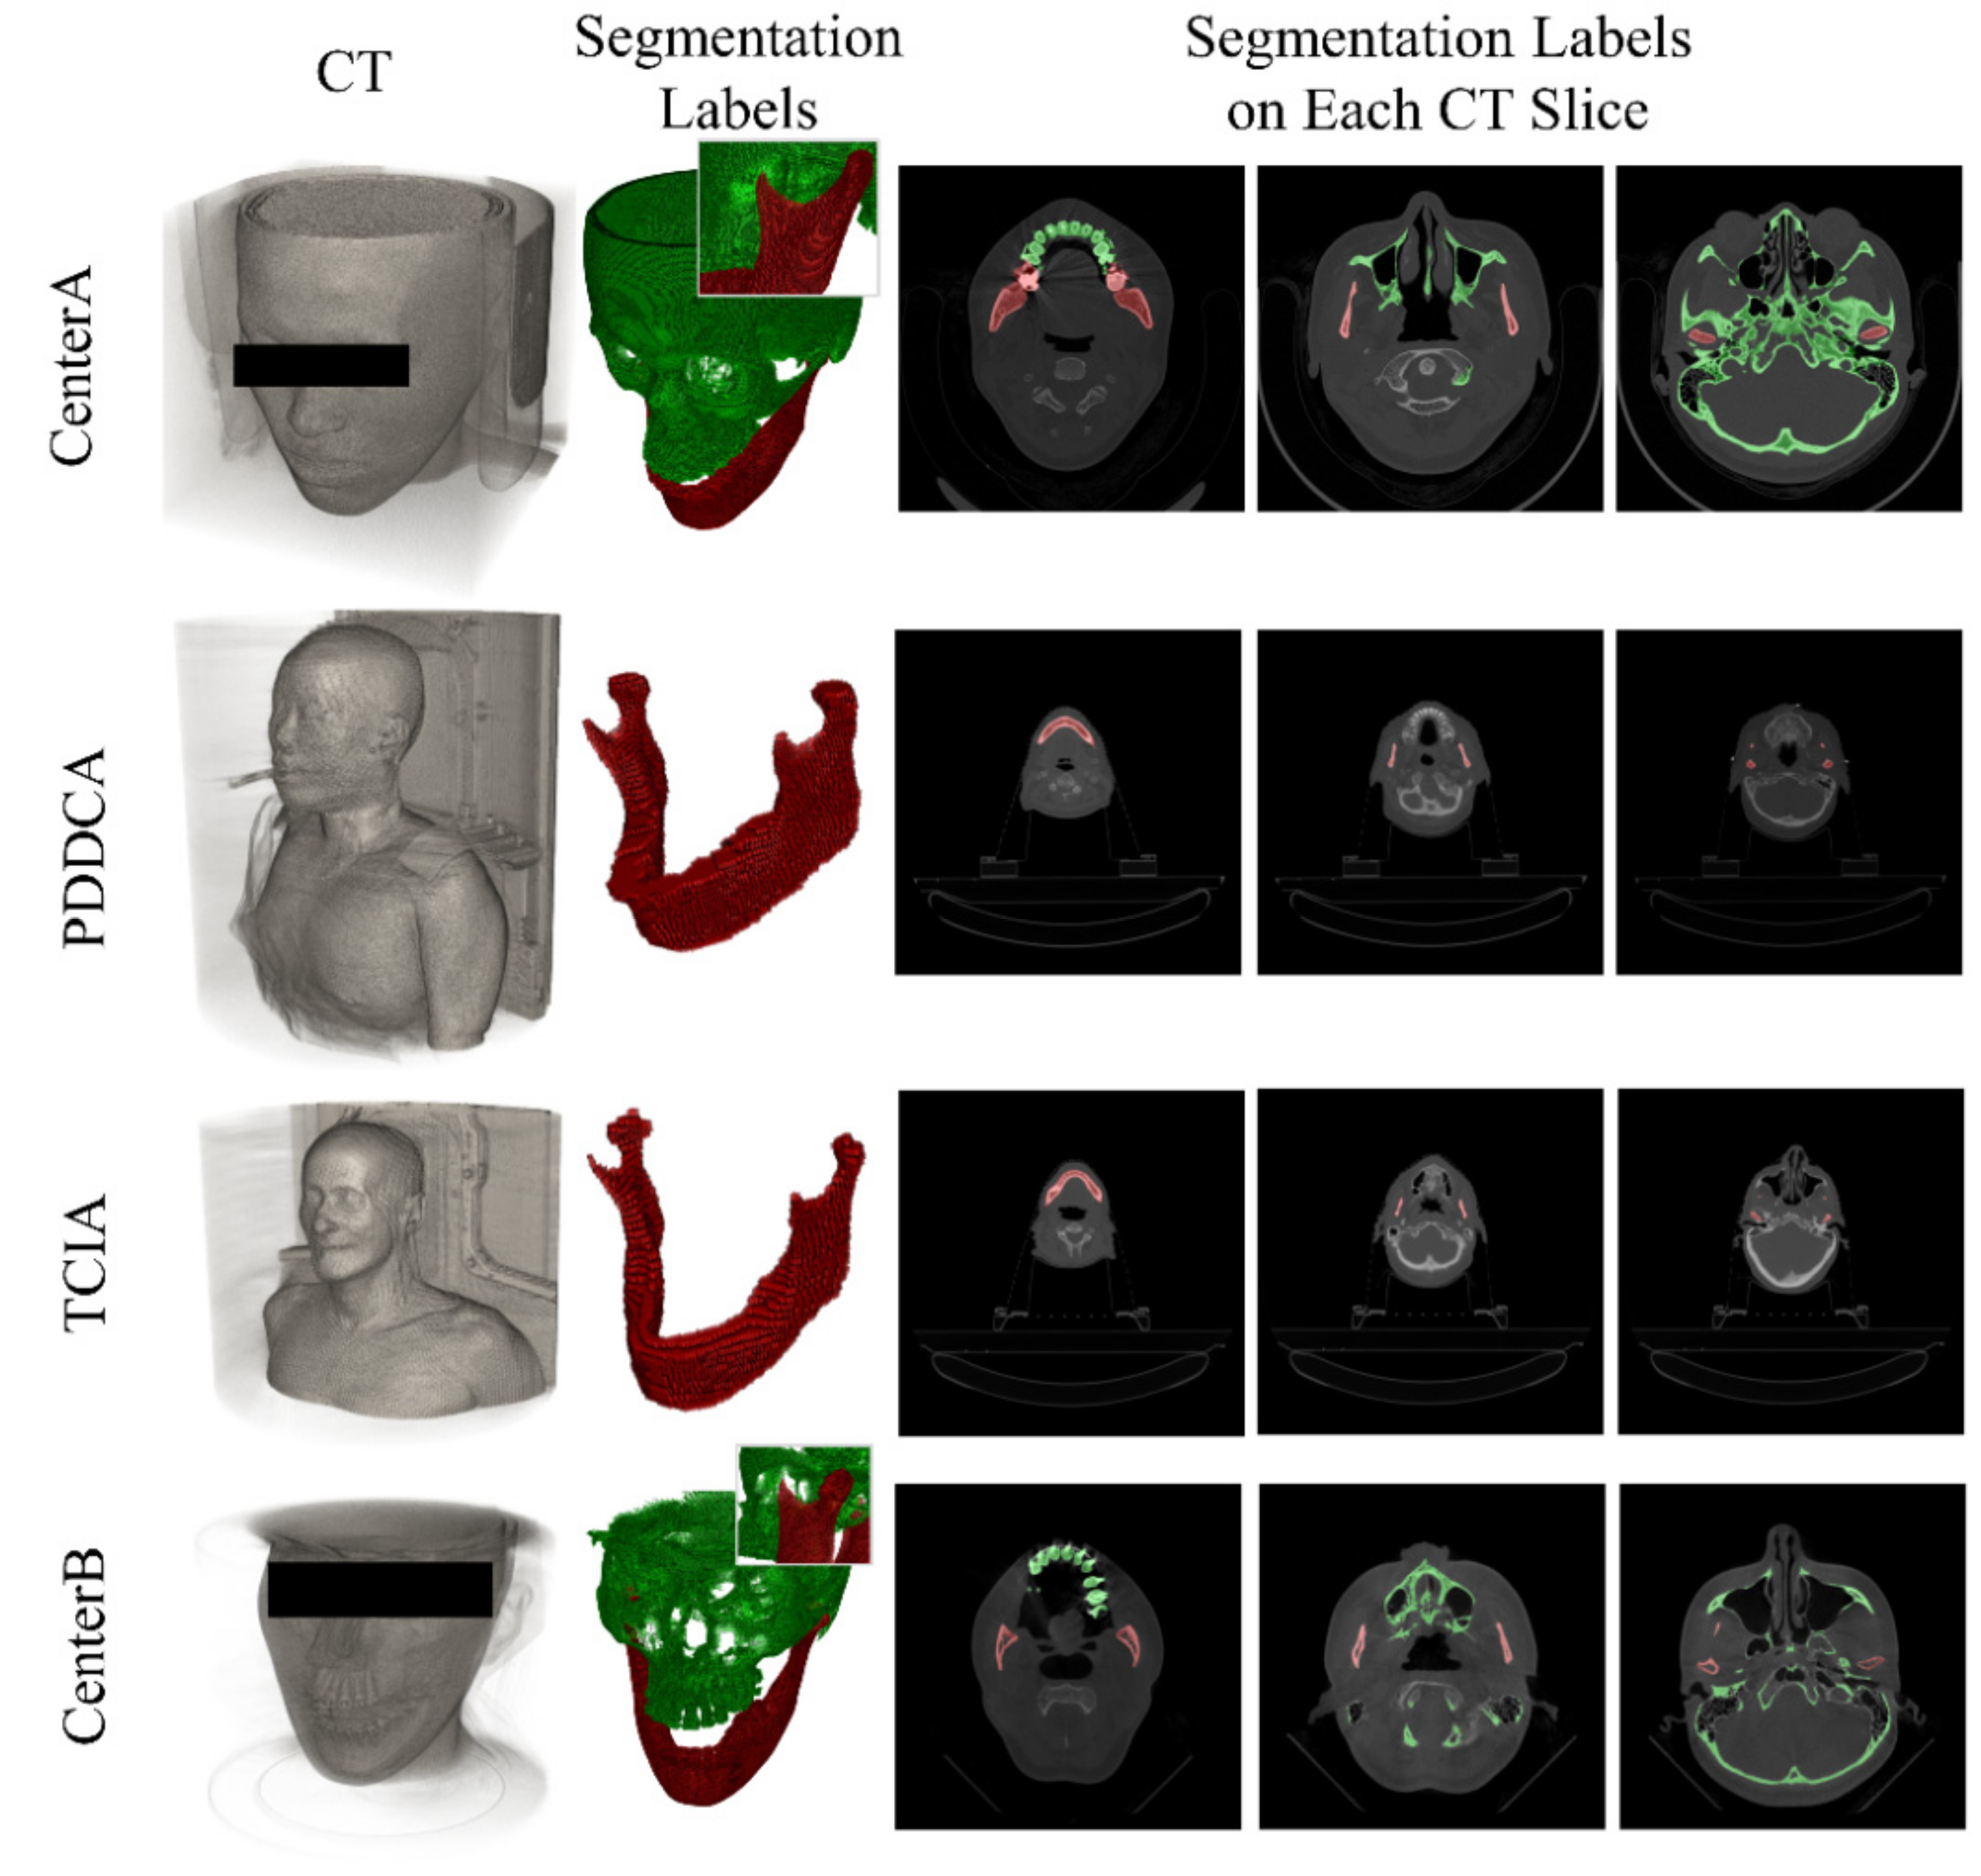
Figure 1. Difficulties in mandible and maxilla segmentation. (a) Metal artifacts caused by dental implants (b) Difficulty in distinguishing mandibular and maxillary teeth, or mandible and midface (c) Low intensity and thin edges in condyle (d) Inter-patient anatomical variance.
Applsci 12 01358 g001
Figure 2. Example cases of the datasets.
Applsci 12 01358 g002
Figure 3. Examples of noises caused by surgical plates, orthodontic device, and dental implants in CenterB dataset, which make it more challenging to delineate the CT images.
Applsci 12 01358 g003
Figure 4. Overall framework and block architectures of neural networks. (a) Overall framework. The numbers above the boxes refer to the channel number of the feature maps. The orange boxes for each neural network are represented in (be), with (b) block architecture of U-Net, (c) block architecture of Res-U-Net, (d) block architecture of mU-Net, and (e) block architecture of HPMR-U-Net.
Applsci 12 01358 g004
Figure 5. Sample case in the CenterA dataset. White and blue indicate the mandible and maxilla, respectively.
Applsci 12 01358 g005
Figure 6. Sample case in the PDDCA dataset. White and blue indicate the mandible and maxilla, respectively. PDDCA has no maxilla ground truth.
Applsci 12 01358 g006
Figure 7. Sample case in the TCIA dataset. White and blue indicate mandible and maxilla, respectively. TCIA has no maxilla ground truth.
Applsci 12 01358 g007
Figure 8. Sample case in CenterB dataset. White and blue indicate the mandible and maxilla, respectively.
Applsci 12 01358 g008
Figure 9. Color maps of surface distance from the ground truths to the output segmentations of the best dice coefficient case in the CenterA dataset for the mandible. The pieces of images on the right side are enlargement of mandibular foramen.
Applsci 12 01358 g009
Table 1. Properties of the datasets.
DatasetCenterAPDDCA †TCIA †CenterB
No. of sets171
(Train: 146, Validation: 10,
Test: 15)
152815
Acquisition typeMDCTMDCTMDCTCBCT
Target structureMandible & MaxillaOARsOARsMandible & Maxilla
No. of slices166–450,
208 ± 32
109–263,
154 ± 36
61–110,
93 ± 12
432
Slice size [pixel]512576512512
Pixel spacing [mm]0.36–0.49,
0.44 ± 0.03
0.98–1.27, 1.11 ± 0.100.94–1.27, 1.04 ± 0.100.40
Slice thickness [mm]0.50–1.04,
0.99 ± 0.07
2.0–3.0, 2.73 ± 0.312.500.40
† denotes the public dataset. ‘No. of slices’, ‘Pixel spacing’, and ‘Slice thickness’ are indicated as the range, the average, and the standard deviation across the cases or the exact value if they are all same.
Table 2. Results of in-house and external tests for mandible segmentation. The best case is bolded.
In-House TestExternal Test
CenterAPDDCATCIACenterB
DC
[%]
95HD [mm]ASD [mm]DC
[%]
95HD [mm]ASD [mm]DC
[%]
95HD [mm]ASD [mm]DC
[%]
95HD [mm]ASD [mm]
U-Net98.3
± 0.4
0.4
± 0.1
0.0
± 0.0
63.4
± 20.2
7.3
± 5.8
1.8
± 3.5
62.8
± 26.3
9.6
± 11.8
3.2
± 7.9
61.2
± 17.9
33.7
± 26.1
4.1
± 4.0
Res-U-Net98.2
± 0.4
0.4
± 0.1
0.1
± 0.0
51.3
± 20.1
13.5
± 12.3
2.0
± 1.8
46.3
± 25.5
18.0
± 19.8
6.5
± 13.5
48.5
± 13.1
28.8
± 20.6
4.1
± 3.3
mU-Net98.4
± 0.3
0.4
± 0.0
0.0
± 0.0
72.3
± 21.6
5.6
± 6.4
1.5
± 3.5
71.4
± 27.8
8.4
± 12.9
2.5
± 5.0
63.6
± 14.7
22.5
± 18.9
2.6
± 2.2
HPMR-U-Net97.4
± 0.4
0.4
± 0.1
0.1
± 0.0
86.5
± 3.9
1.8
± 1.3
0.2
± 0.1
86.4
± 6.2
2.8
± 7.7
0.3
± 0.7
77.7
± 4.1
3.4
± 0.6
0.7
± 0.2
Table 3. Results of in-house and external tests for maxilla segmentation. The best case is bolded.
In-House TestExternal Test
CenterACenterB
DC
[%]
95HD [mm]ASD [mm]DC
[%]
95HD [mm]ASD [mm]
U-Net96.5
± 0.8
0.4
± 0.1
0.1
± 0.0
75.0
± 5.7
9.0
± 8.8
1.1
± 0.8
Res-U-Net96.2
± 0.8
0.4
± 0.1
0.1
± 0.0
67.6
± 12.3
17.1
± 18.1
2.5
± 3.4
mU-Net96.5
± 0.7
0.4
± 0.0
0.1
± 0.0
75.9
± 5.1
8.6
± 7.9
1.0
± 0.7
HPMR-U-Net90.2
± 19.5
0.5
± 0.1
0.1
± 0.0
82.8
± 3.2
2.7
± 1.6
0.4
± 0.2
Publisher’s Note: MDPI stays neutral with regard to jurisdictional claims in published maps and institutional affiliations.

