
A Systematic Review of Explainable Artificial Intelligence in Terms of Different Application Domains and Tasks


Abstract
:1. Introduction
- To investigate and present the application domains and tasks for which various XAI methods have been explored and exploited;
- To investigate and present the XAI methods, validation metrics and the type of explanations that can be generated to increase the acceptability of the expert systems to general users;
- To sort out the open issues and future research directions in terms of various domains and application tasks from the methodological perspective of XAI.
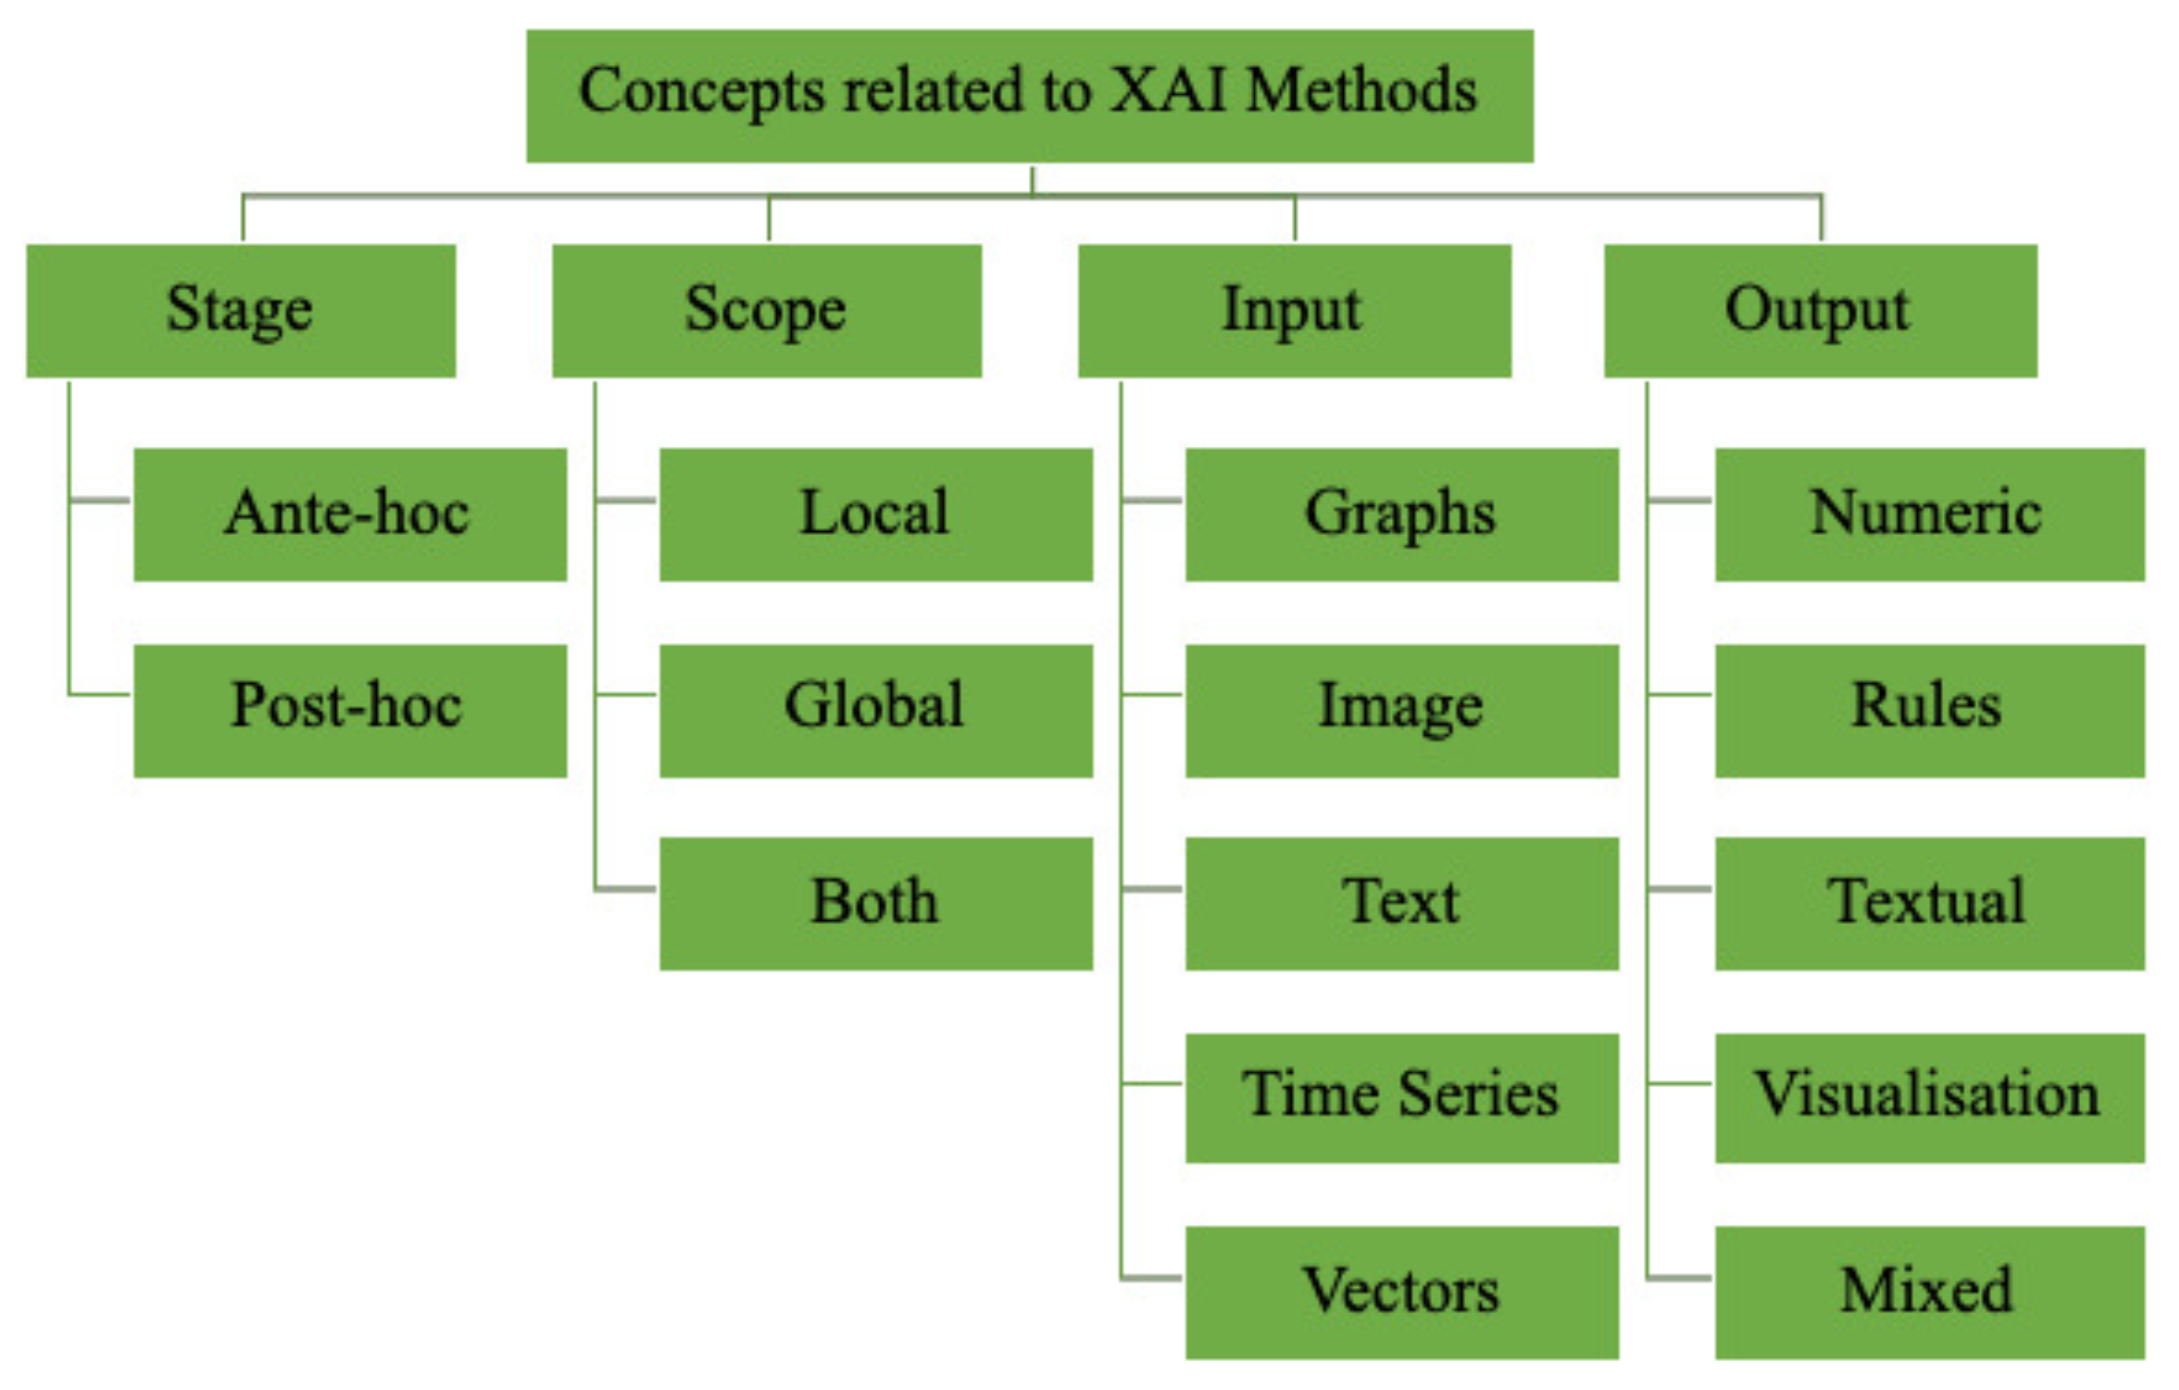
2. Theoretical Background
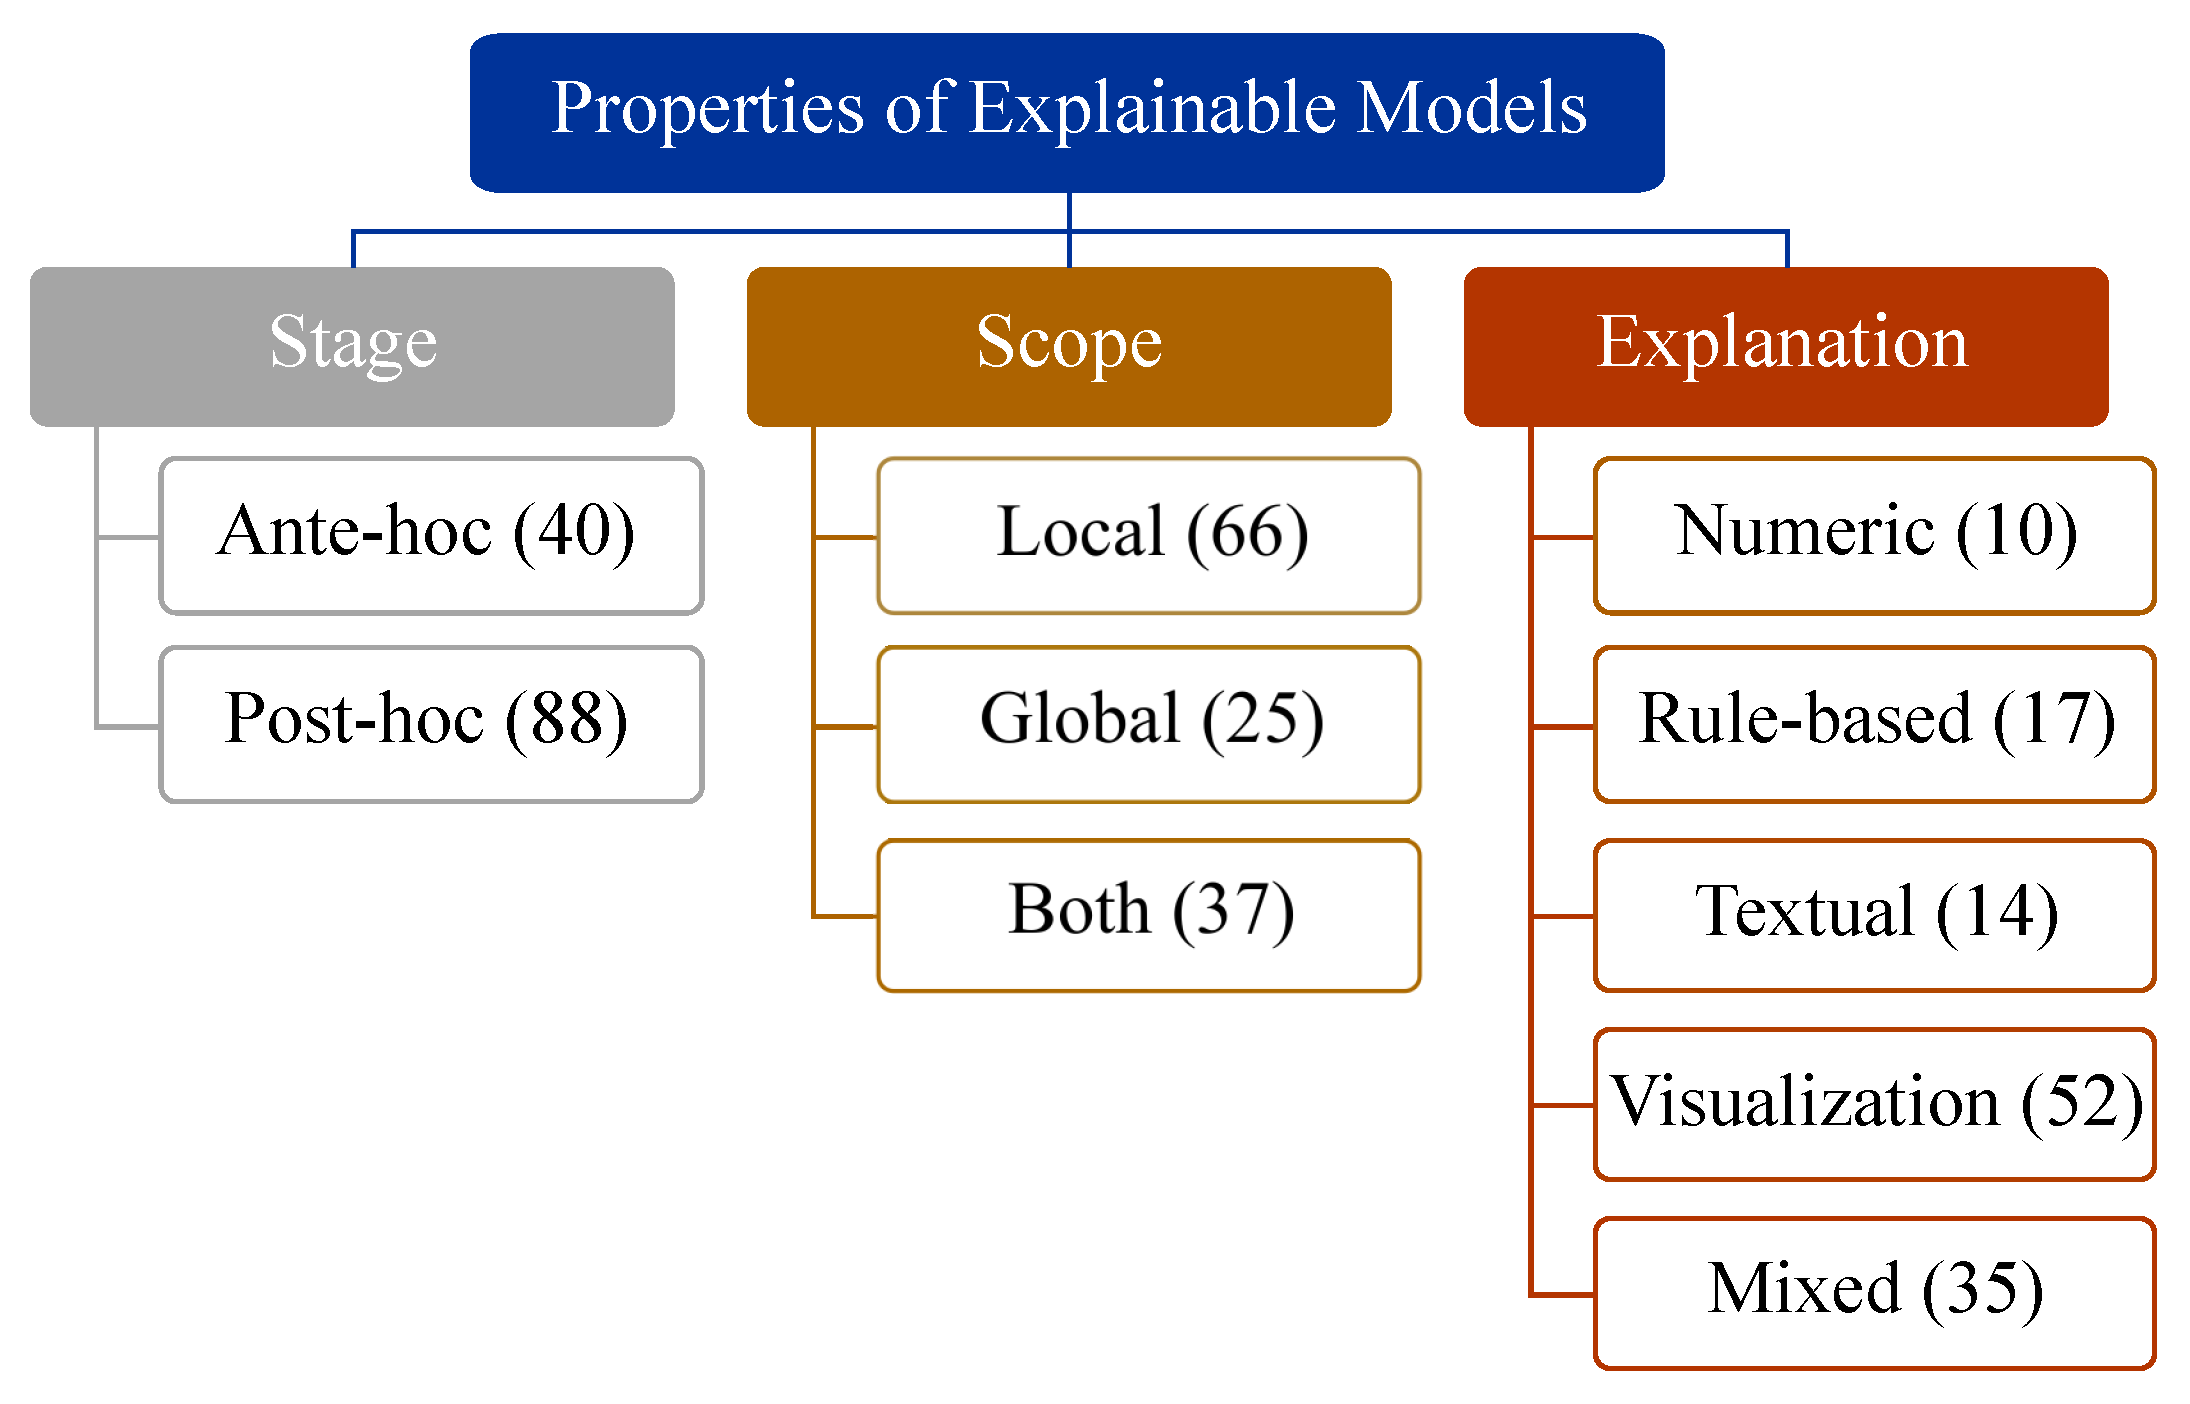
2.1. Stage of Explainability
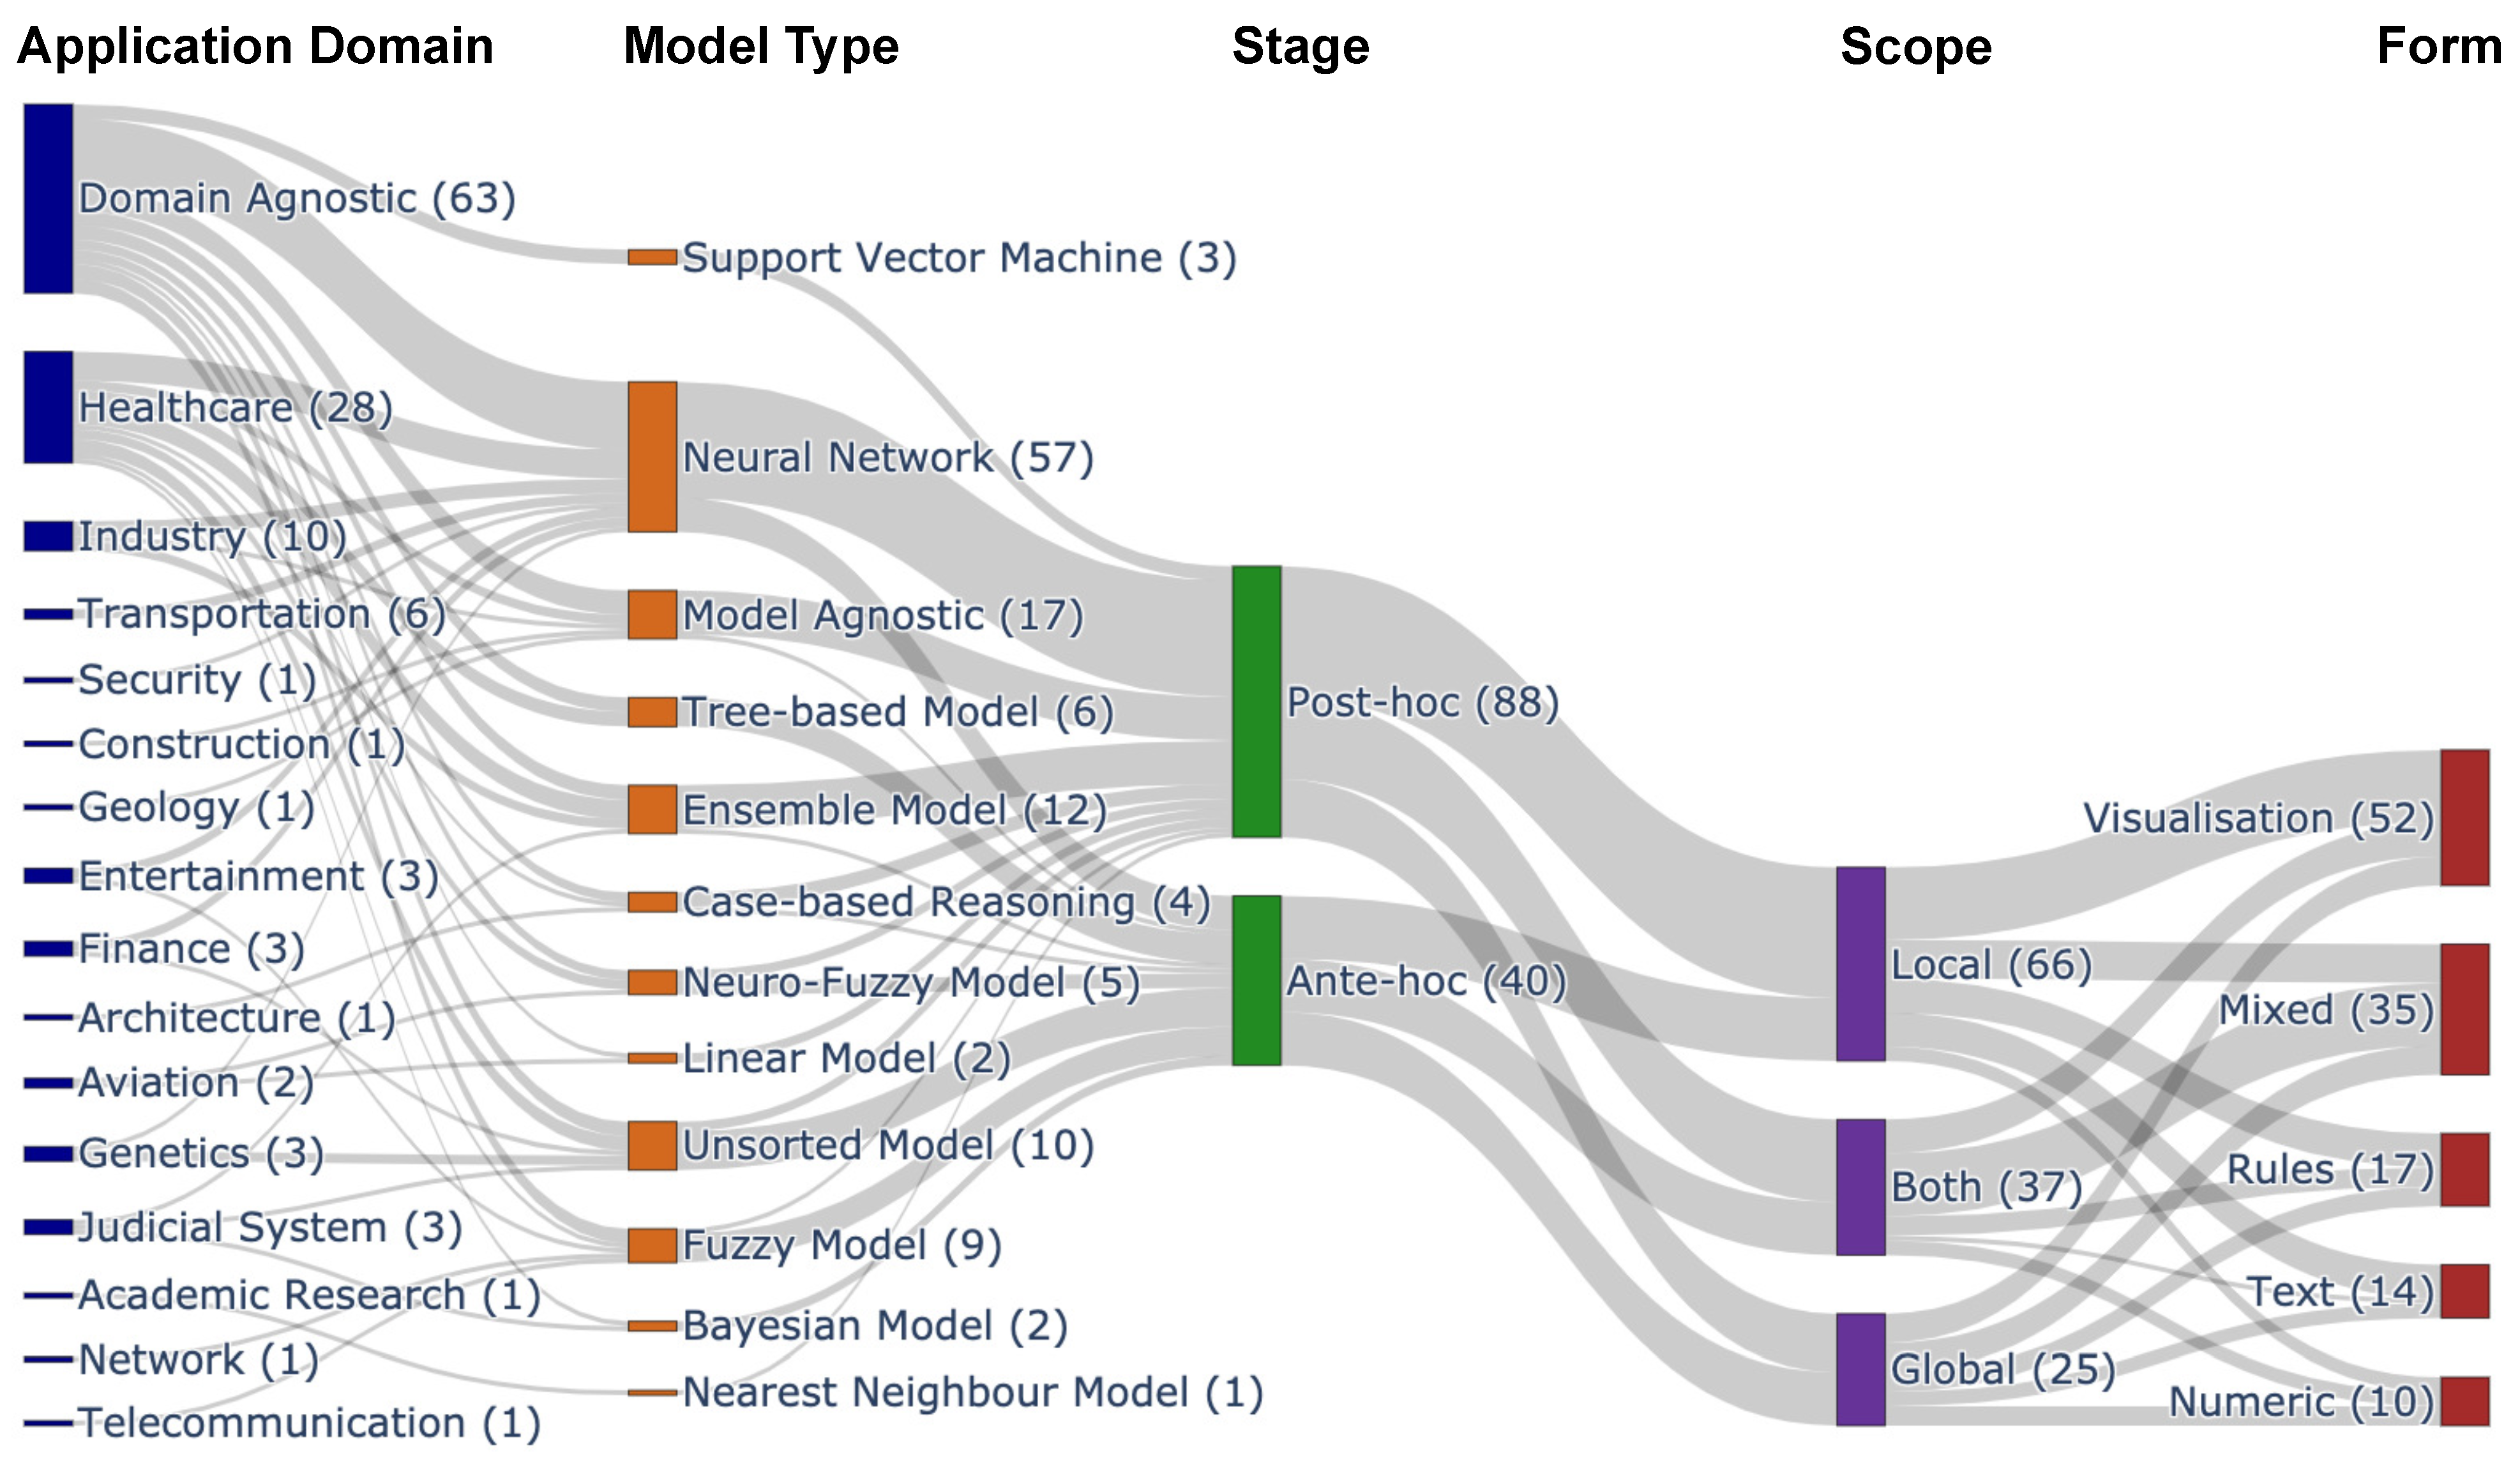
- Ante hoc methods generally consider generating the explanation for the decision from the very beginning of the training on the data while aiming to achieve optimal performance. Mostly, explanations are generated using these methods for transparent models, such as fuzzy models and tree-based models;
- Post hoc methods comprise an external or surrogate model and the base model. The base model remains unchanged, and the external model mimics the base model’s behaviour to generate an explanation for the users. Generally, these methods are associated with the models in which the inference mechanism remains unknown to users, e.g., support vector machines and neural networks. Moreover, the post hoc methods are again divided into two categories: model-agnostic and model-specific. The model-agnostic methods apply to any AI/ML model, whereas the model-specific methods are confined to particular models.
2.2. Scope of Explainability
2.3. Input and Output
3. Related Studies
4. SLR Methodology
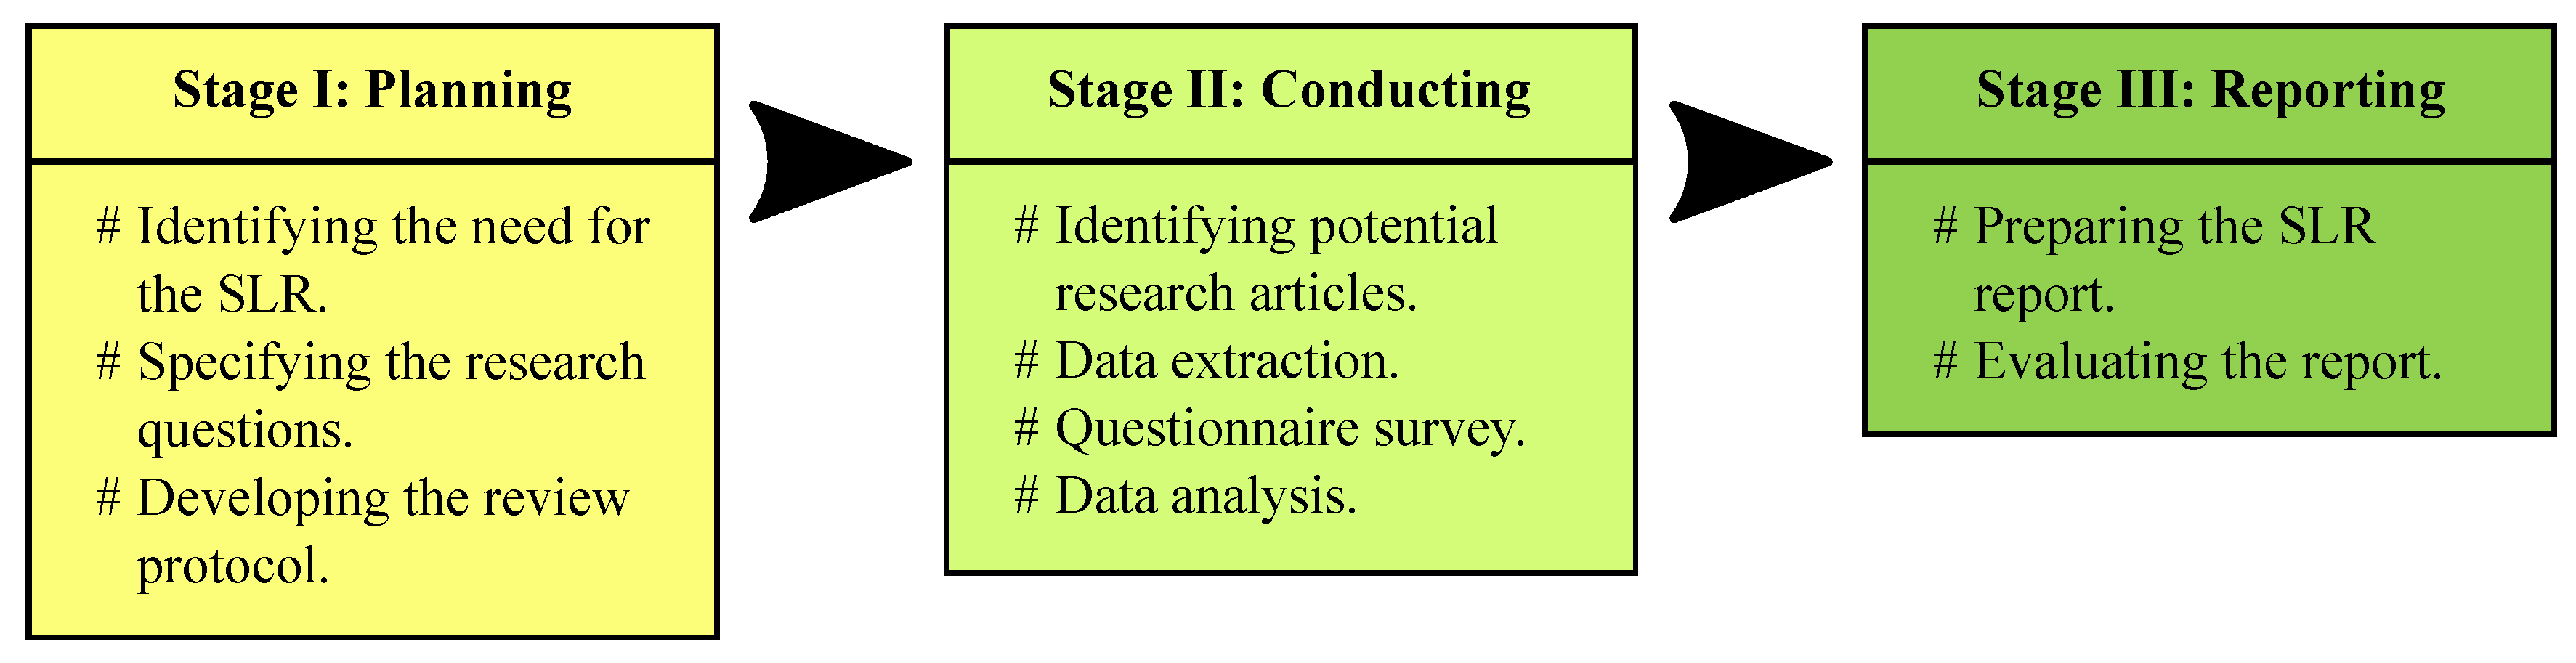
4.1. Planning the SLR
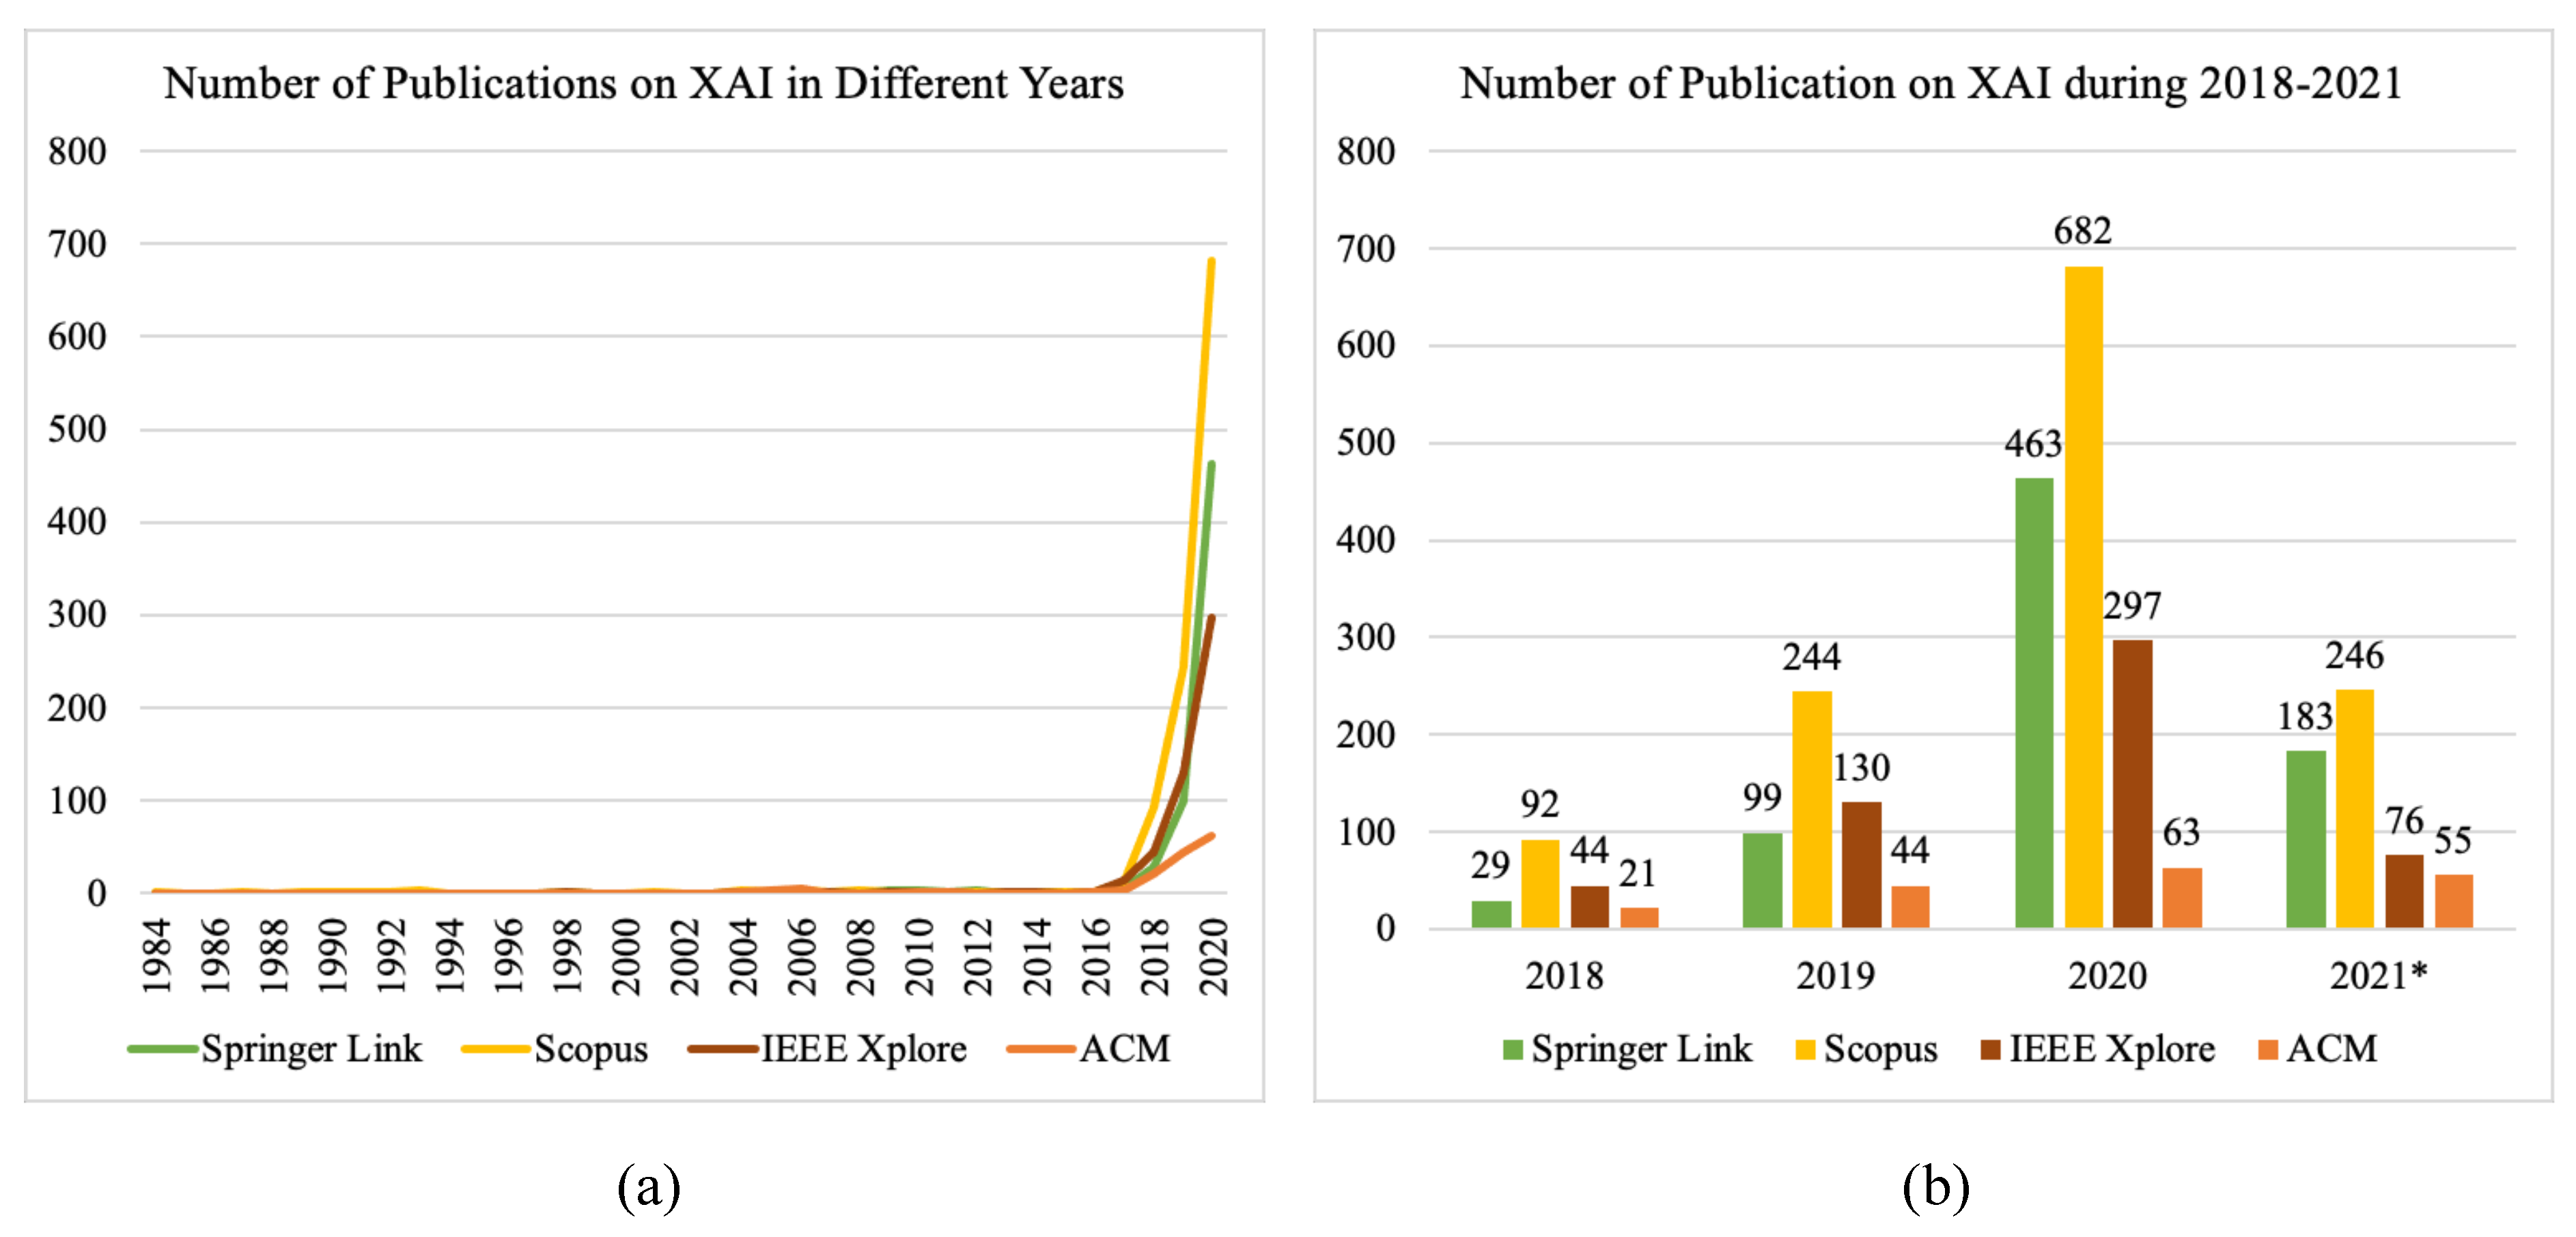
4.1.1. Identifying the Need for Conducting the SLR
4.1.2. Research Questions
- RQ1: What are the application domains and tasks in which XAI is being explored and exploited?
- -
- RQ1.1: What are the XAI methods that have been used in the identified application domains and tasks?
- -
- RQ1.2: What are the different forms of providing explanations?
- -
- RQ1.3: What are the evaluation metrics for XAI methods used in different application domains and tasks?
4.1.3. SLR Protocol
4.2. Conducting the SLR
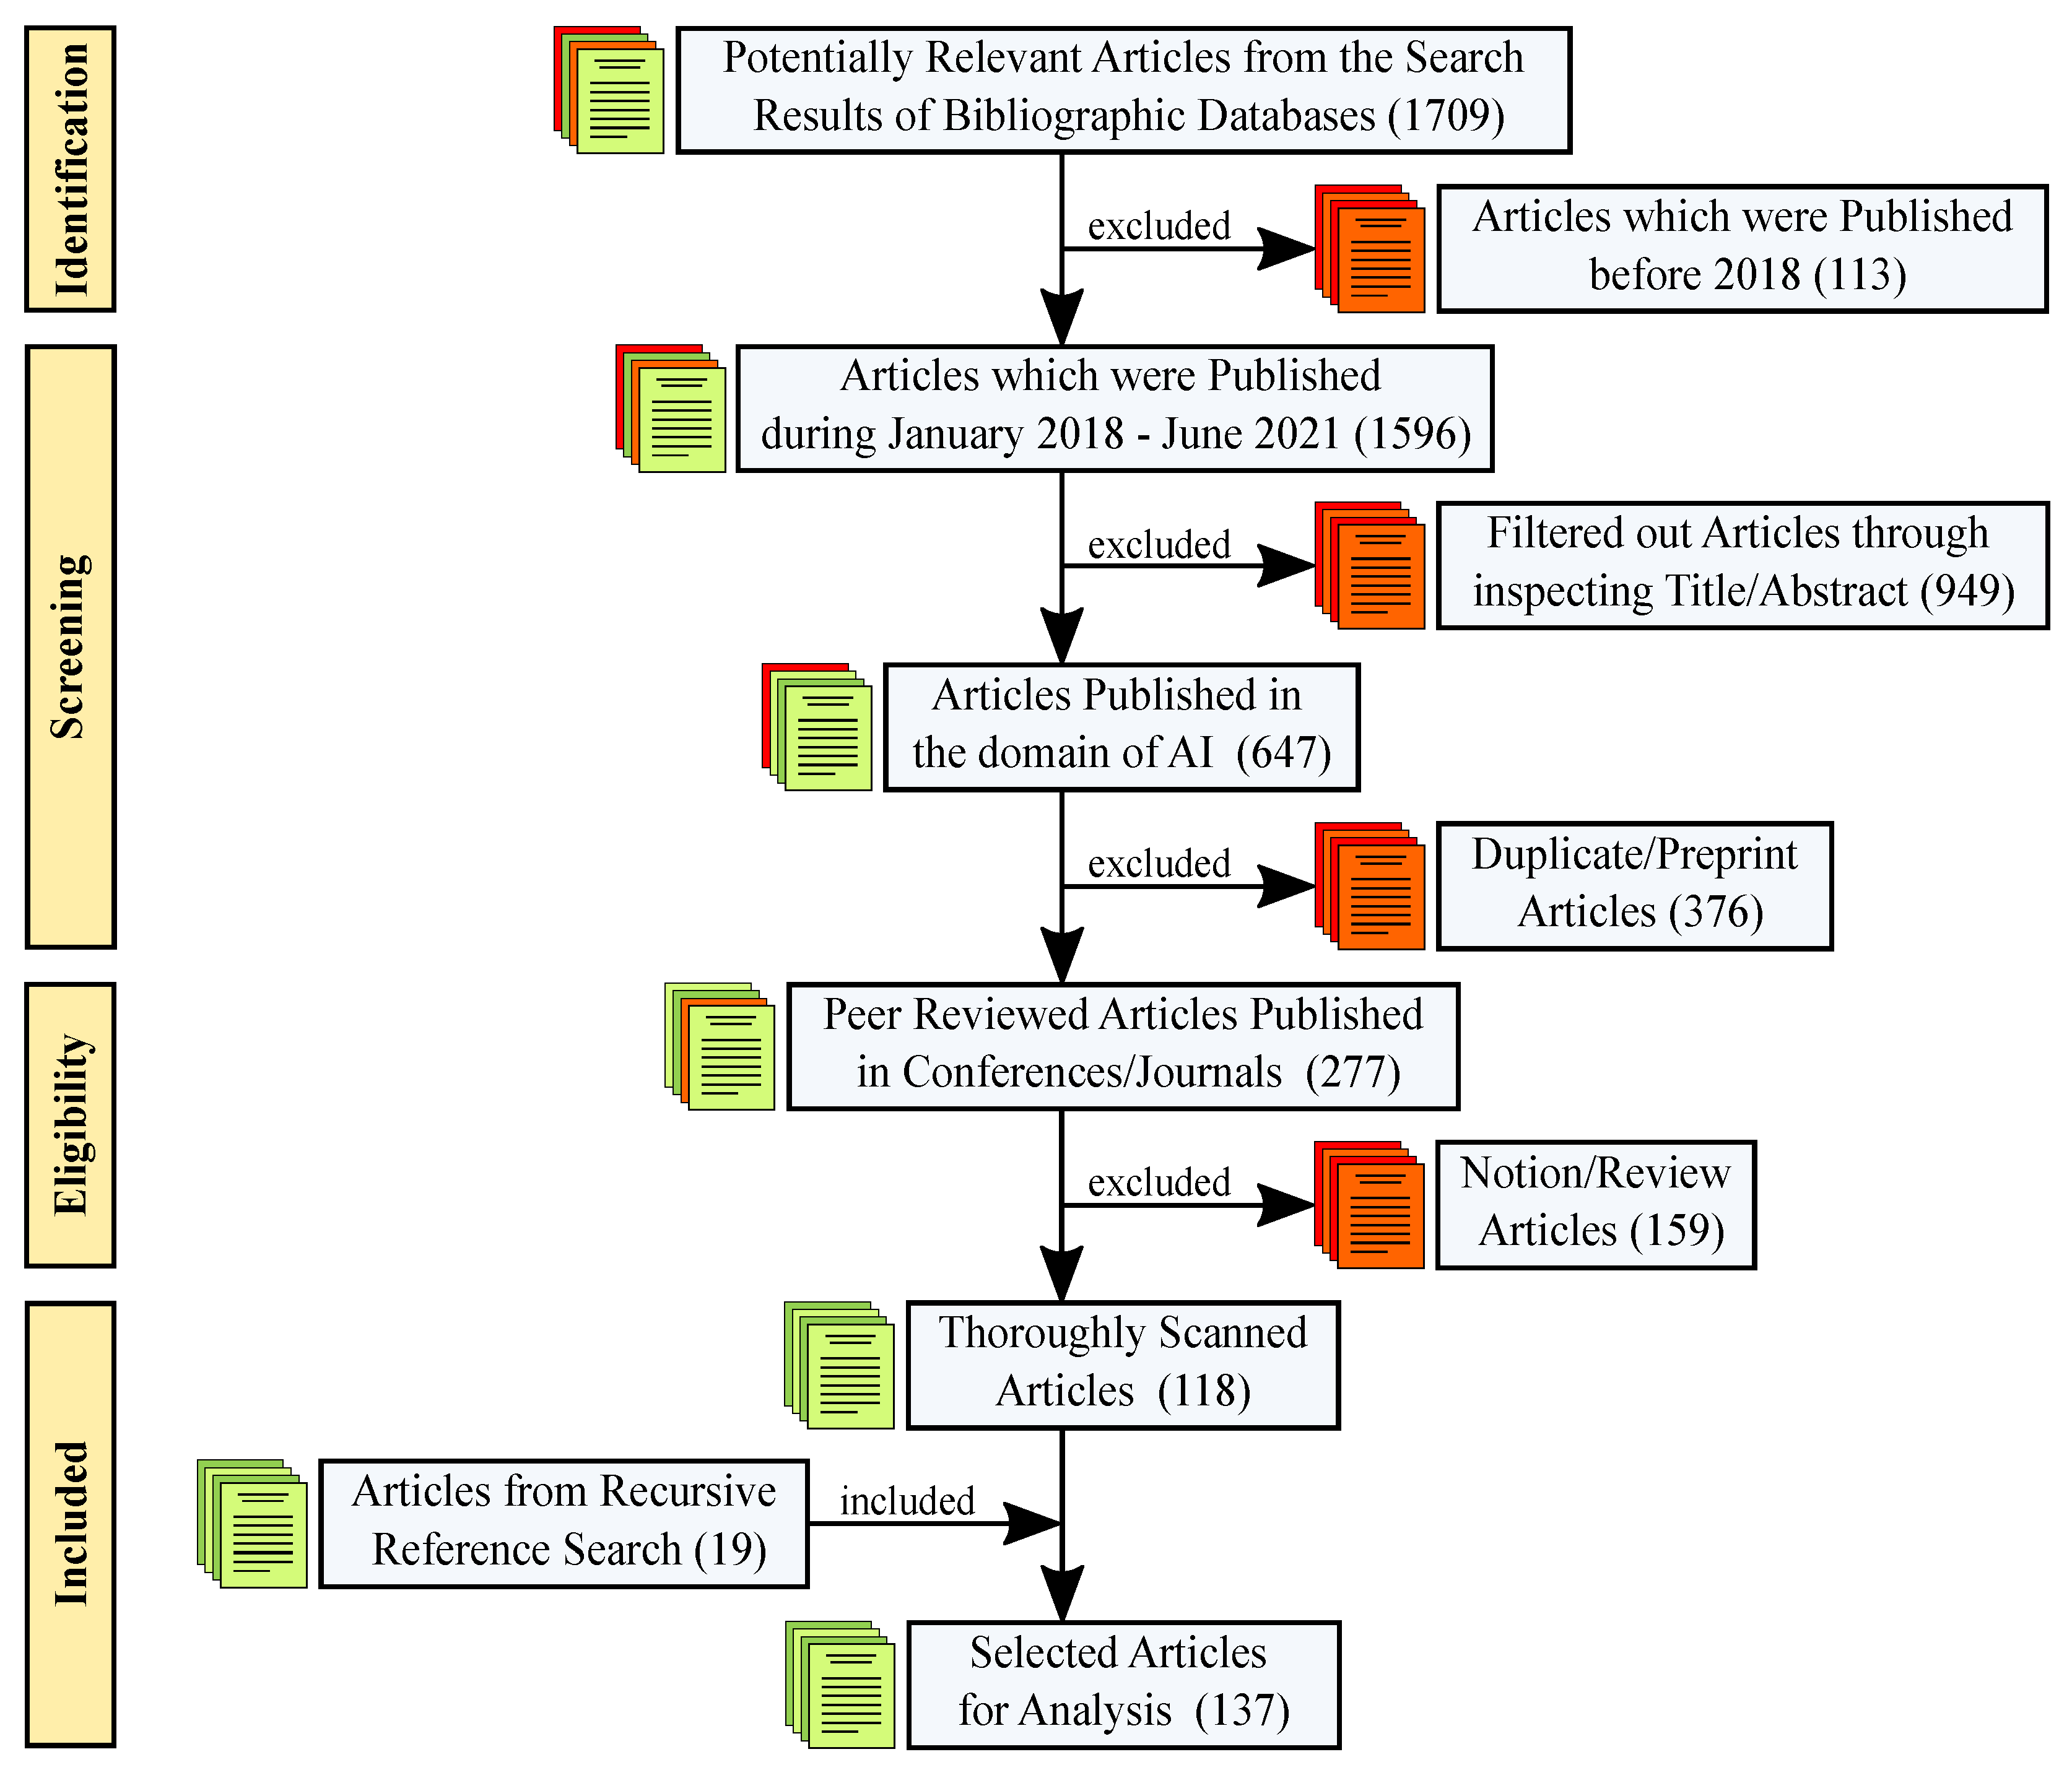
4.2.1. Identifying Potential Research Articles
4.2.2. Data Collection
Feature Extraction
Questionnaire Survey
4.2.3. Data Analysis
5. Results
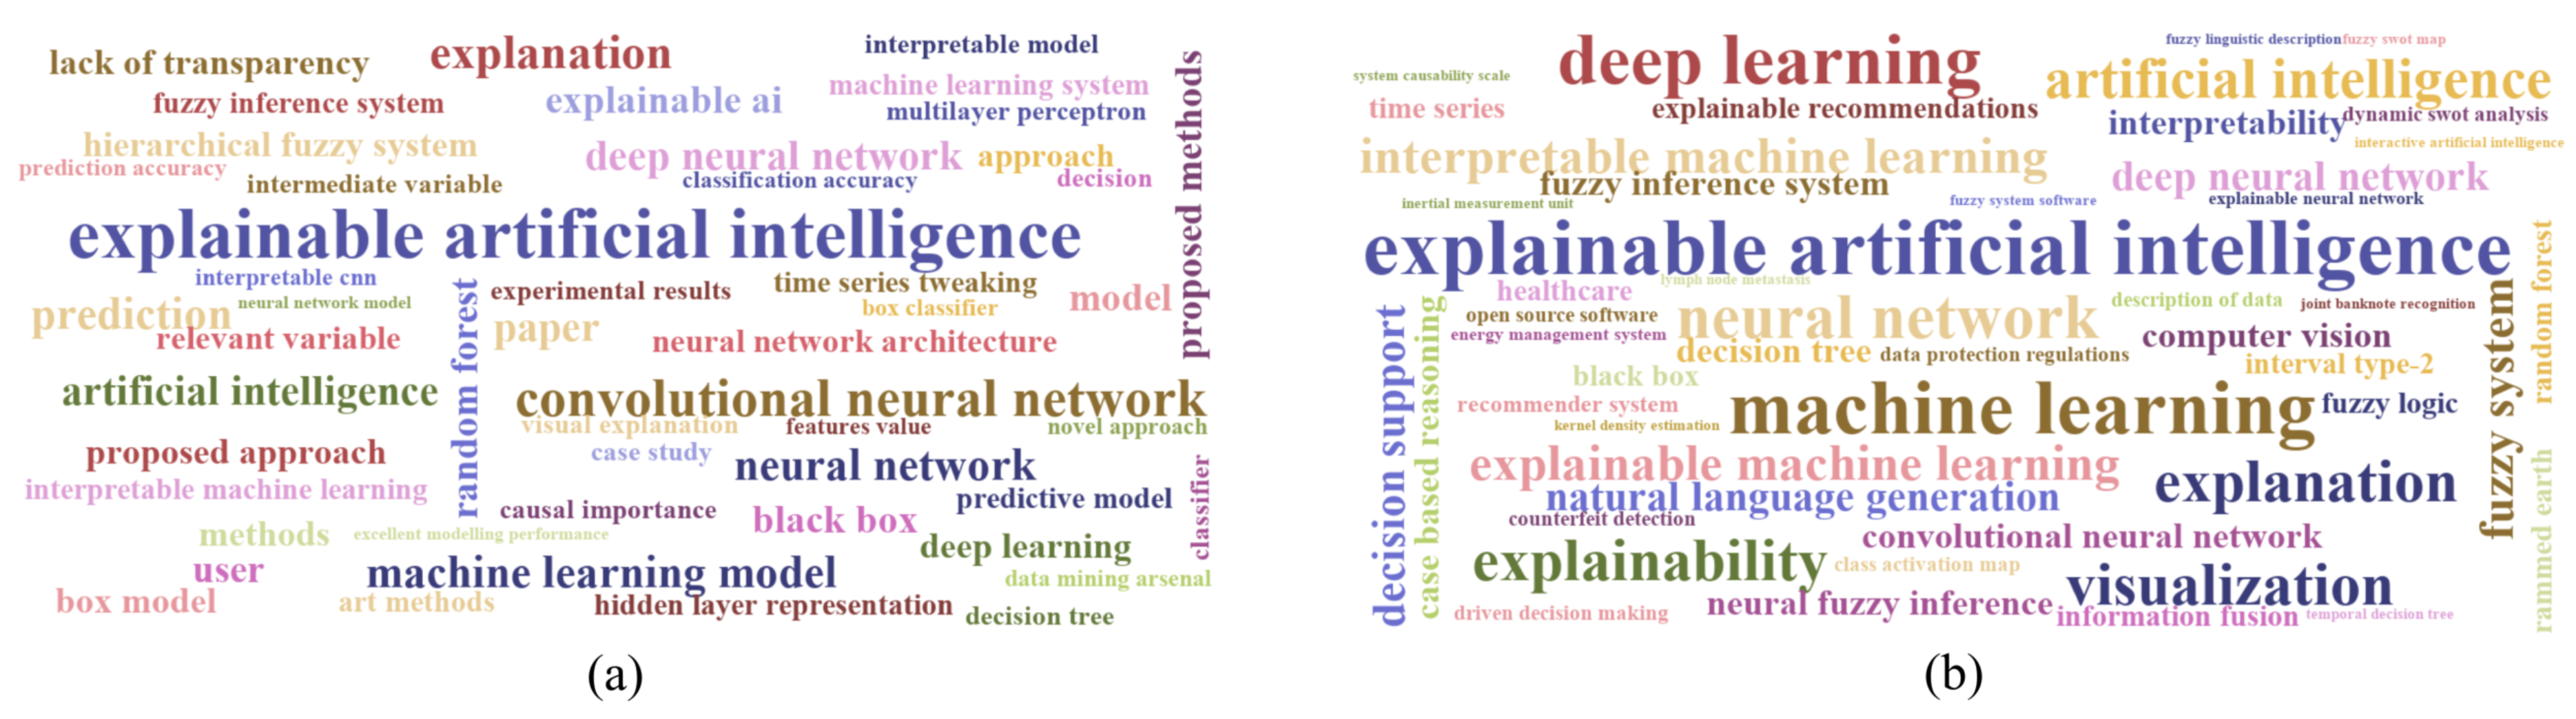
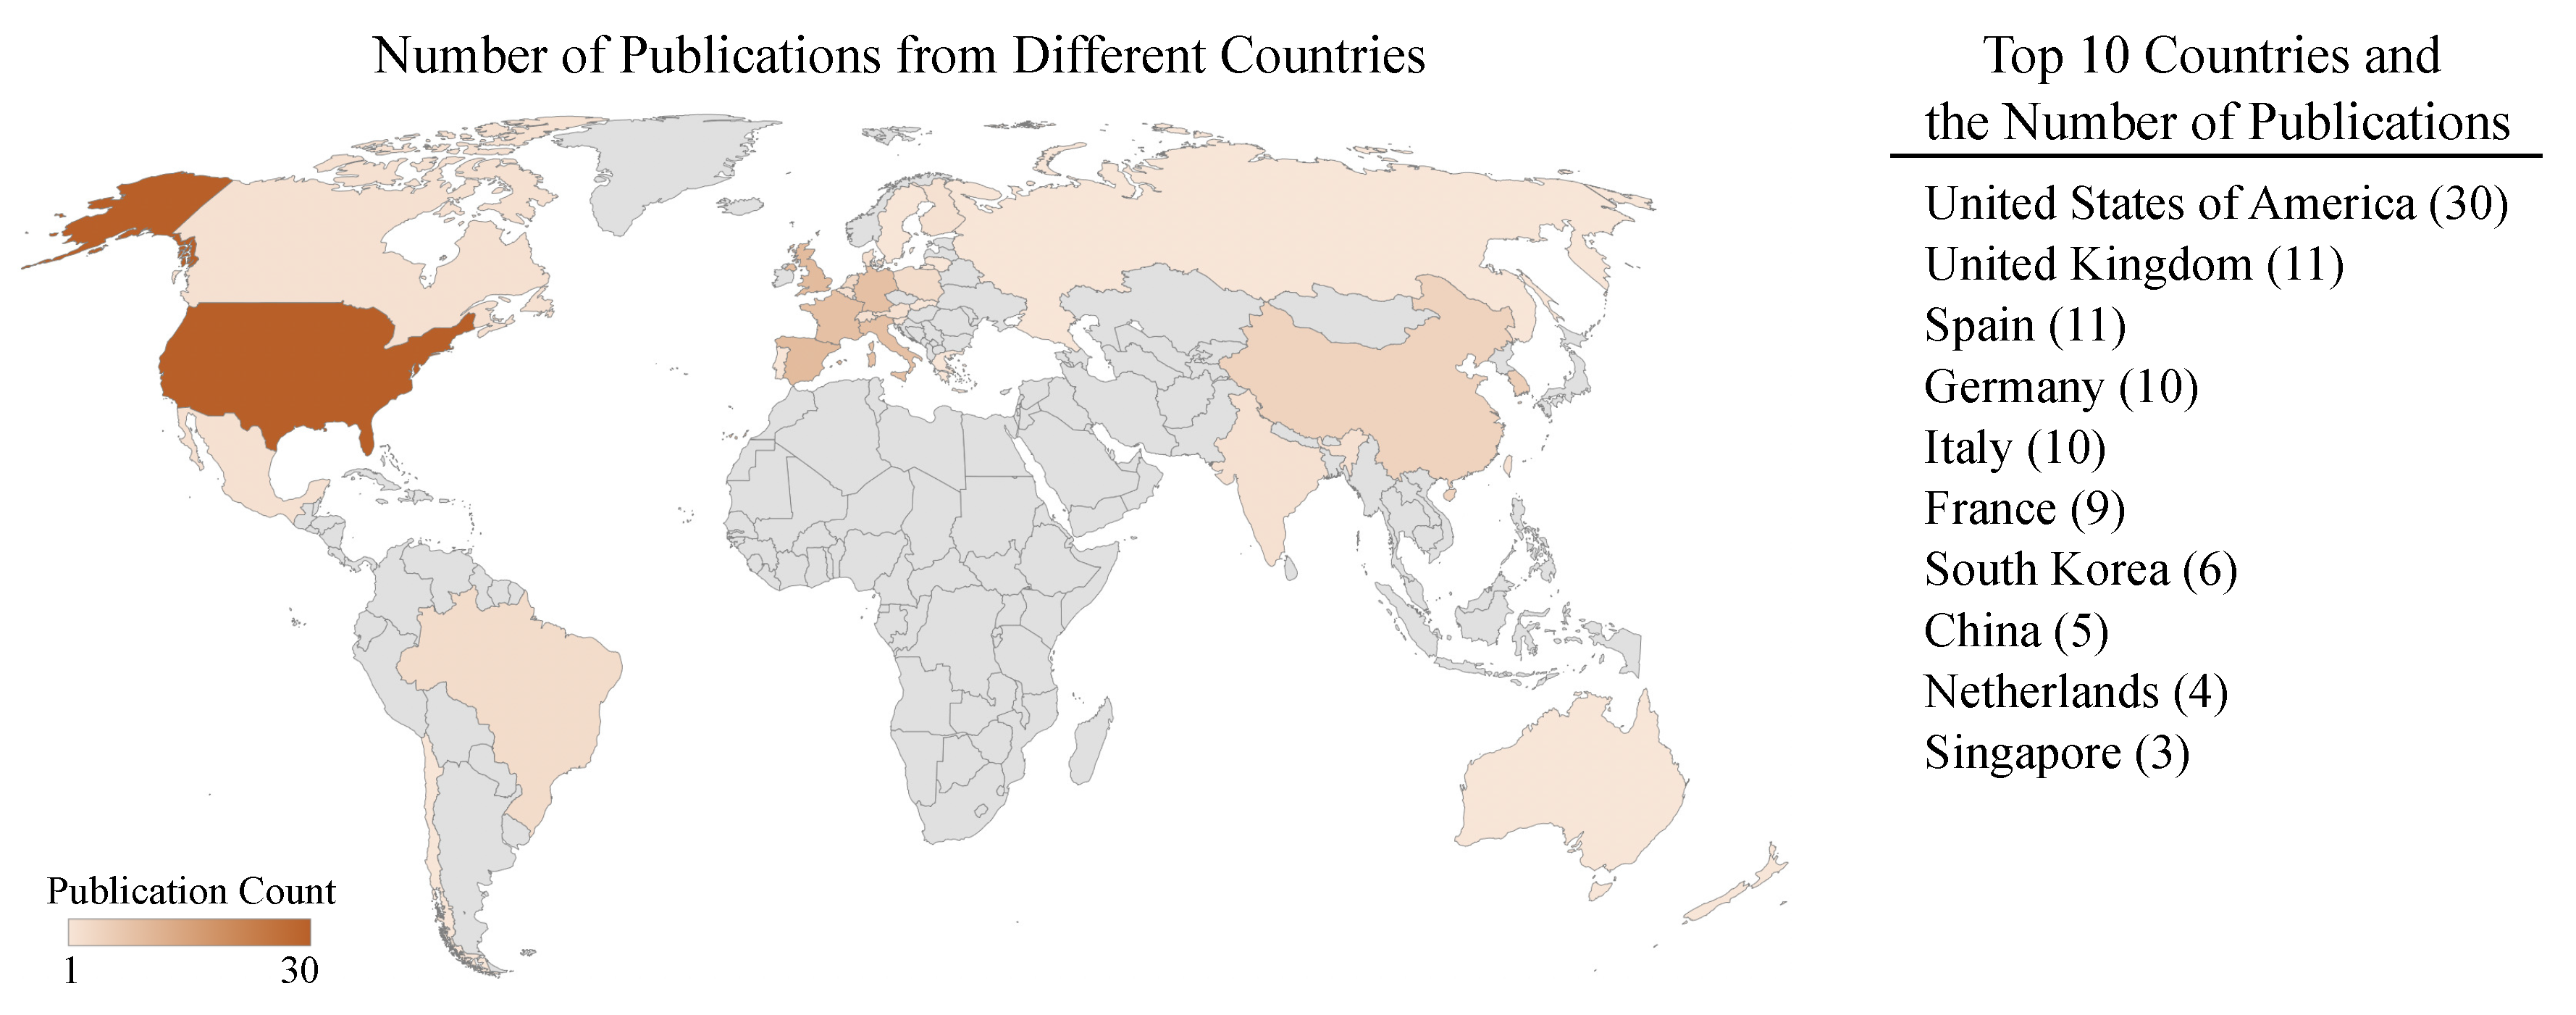
5.1. Metadata
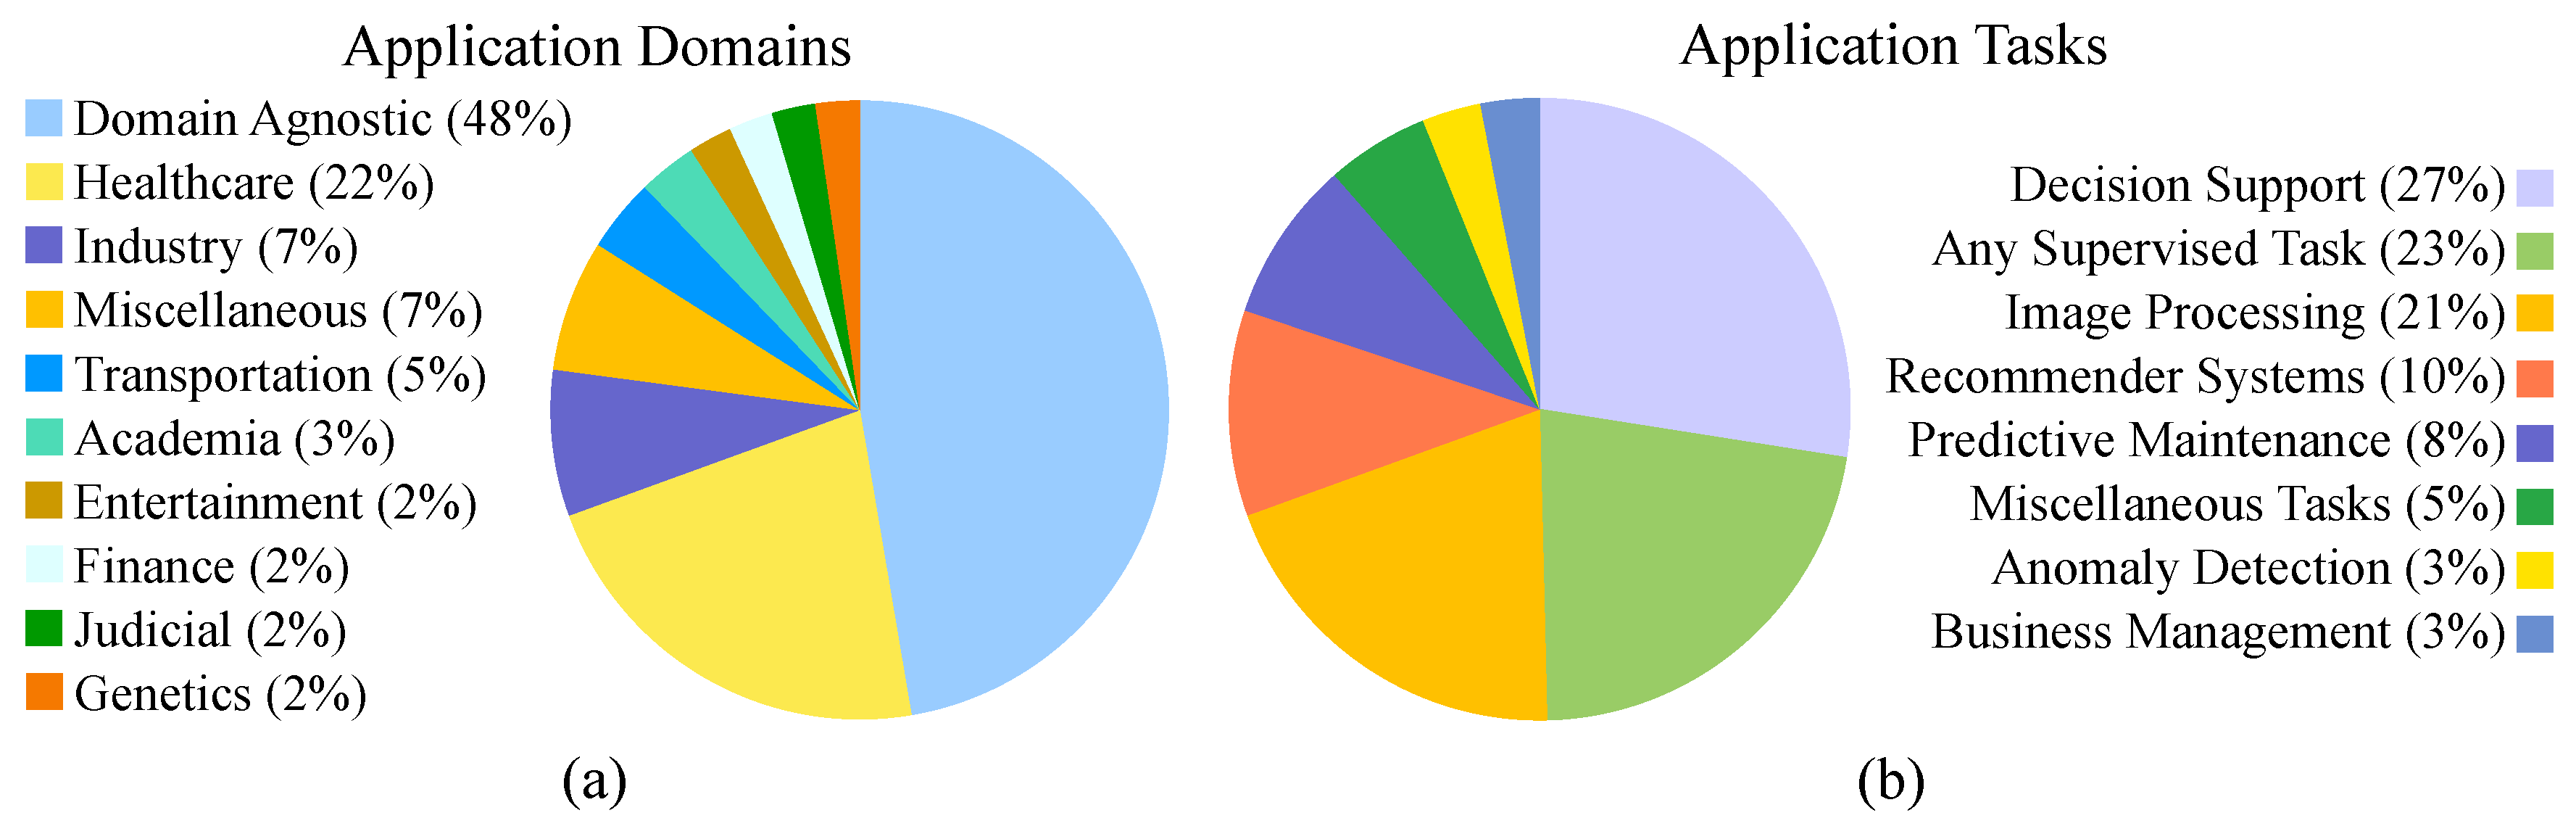
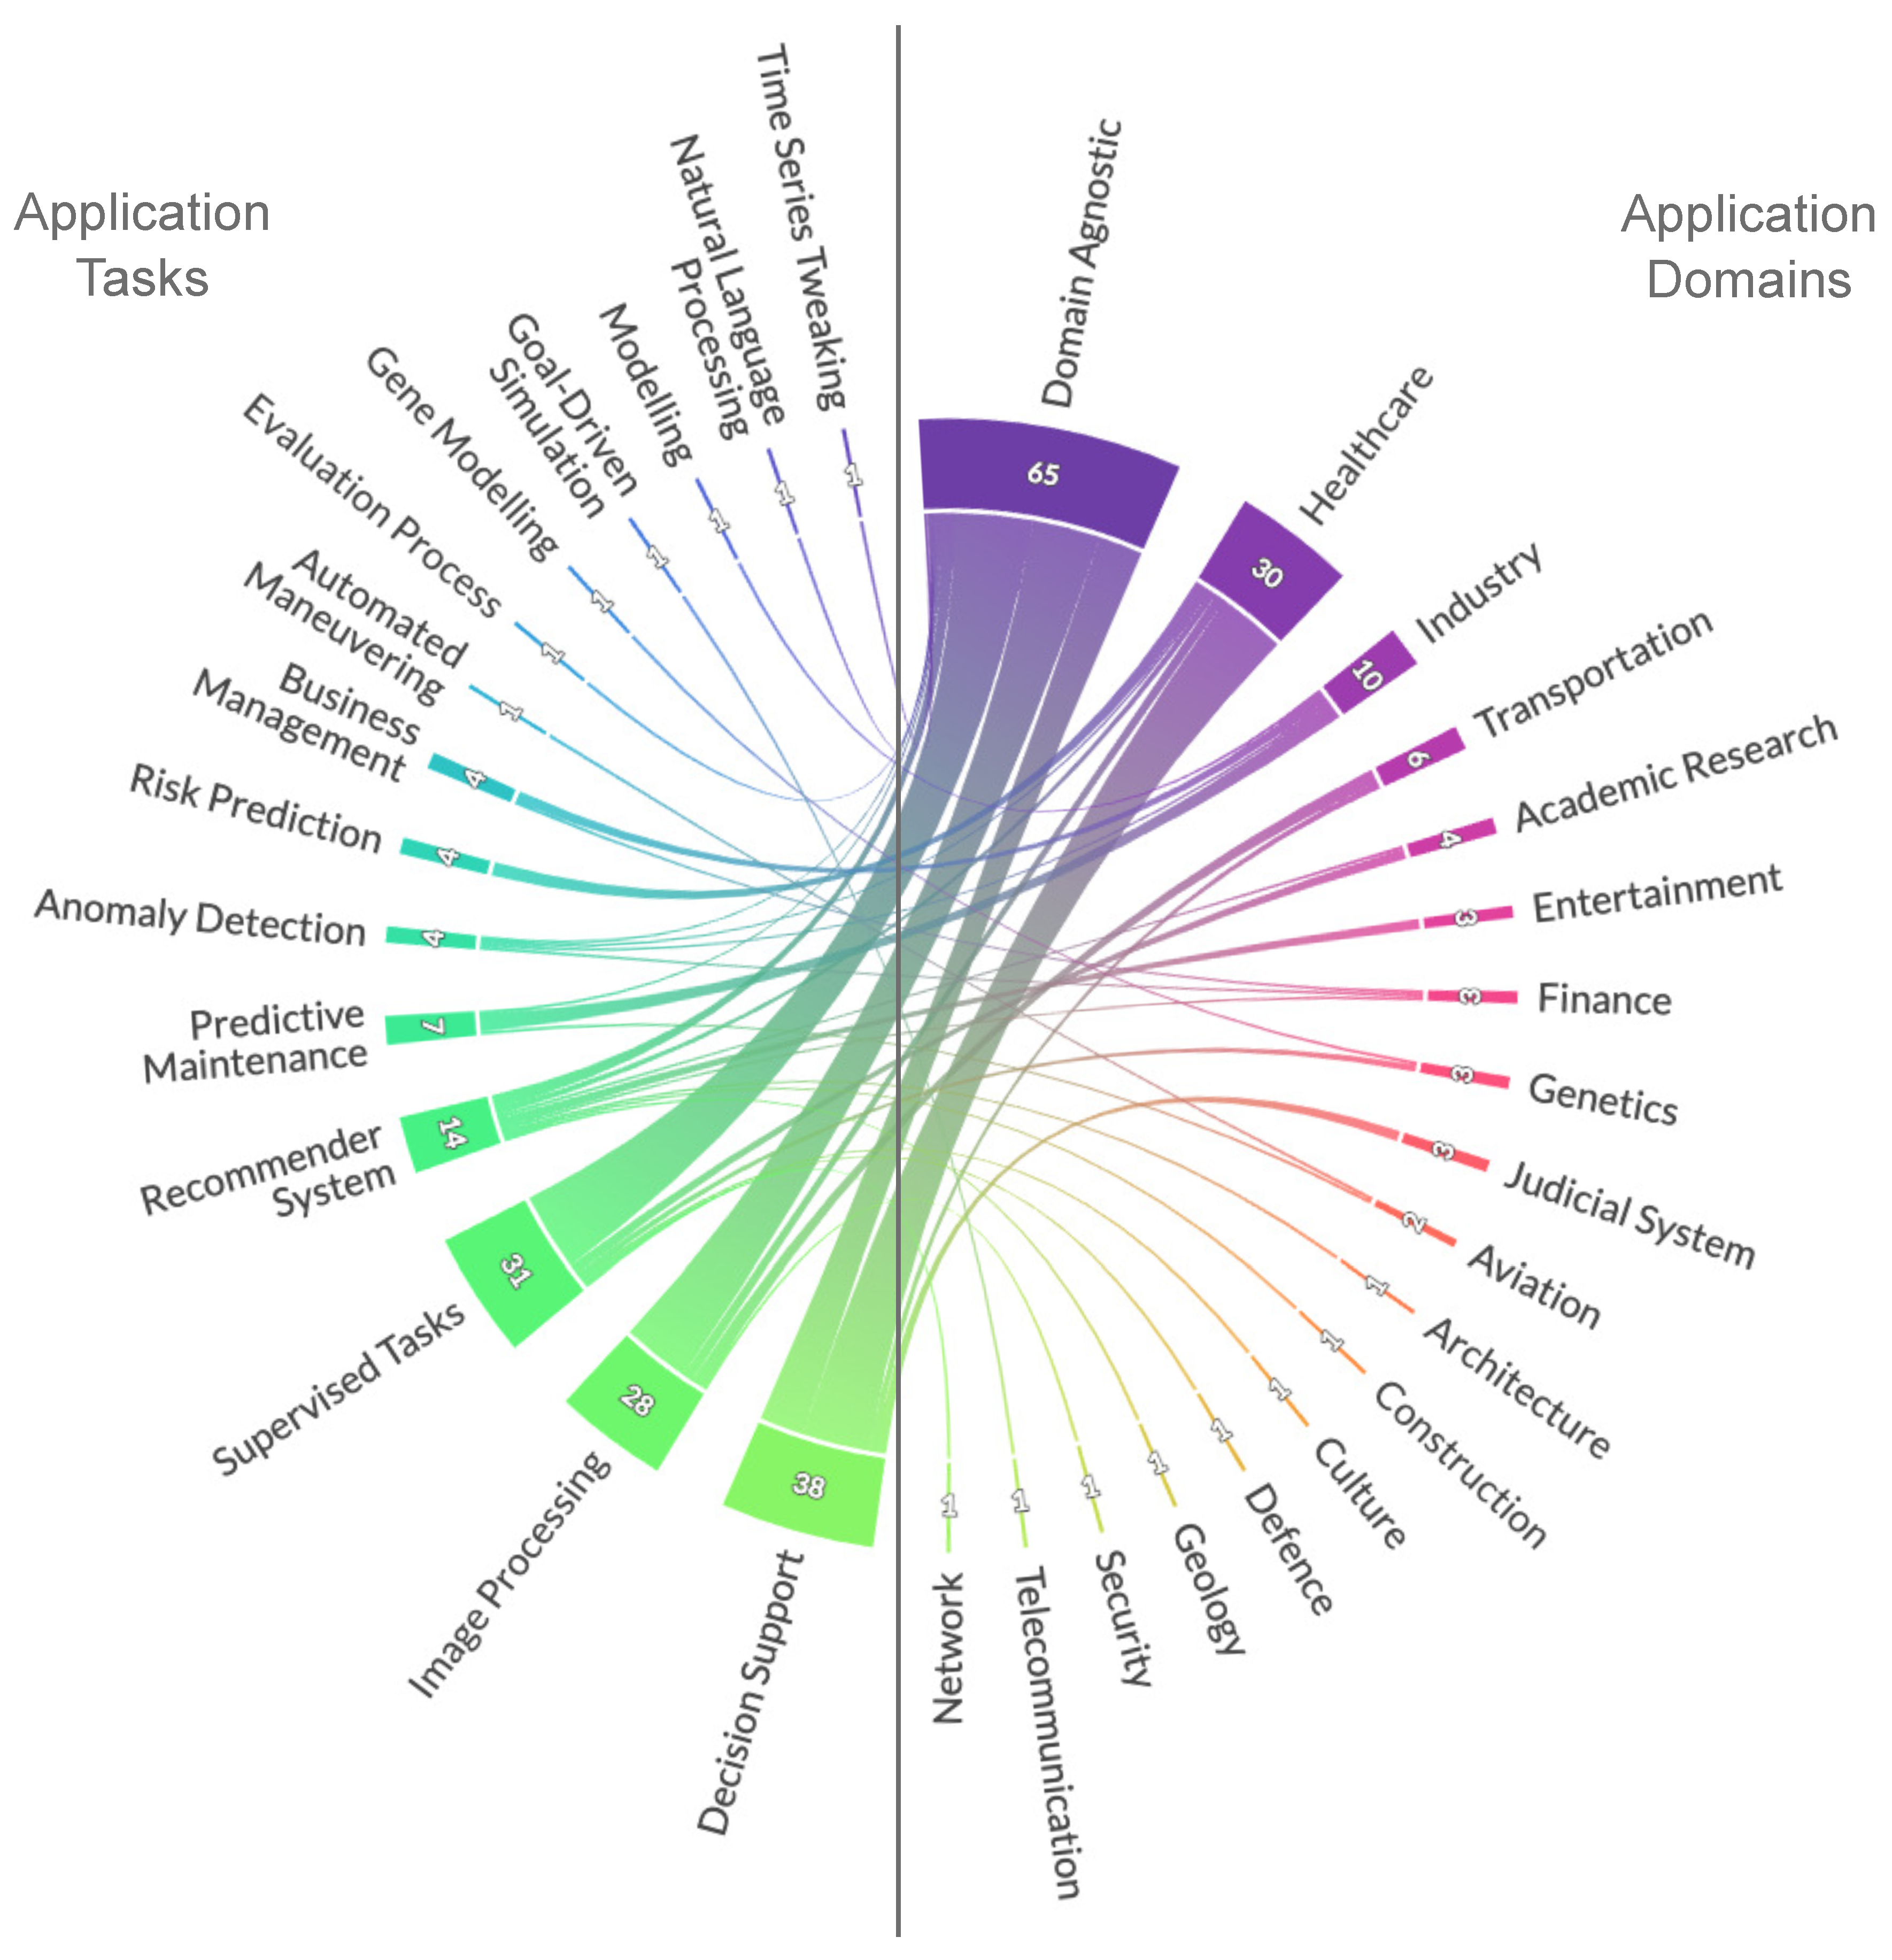
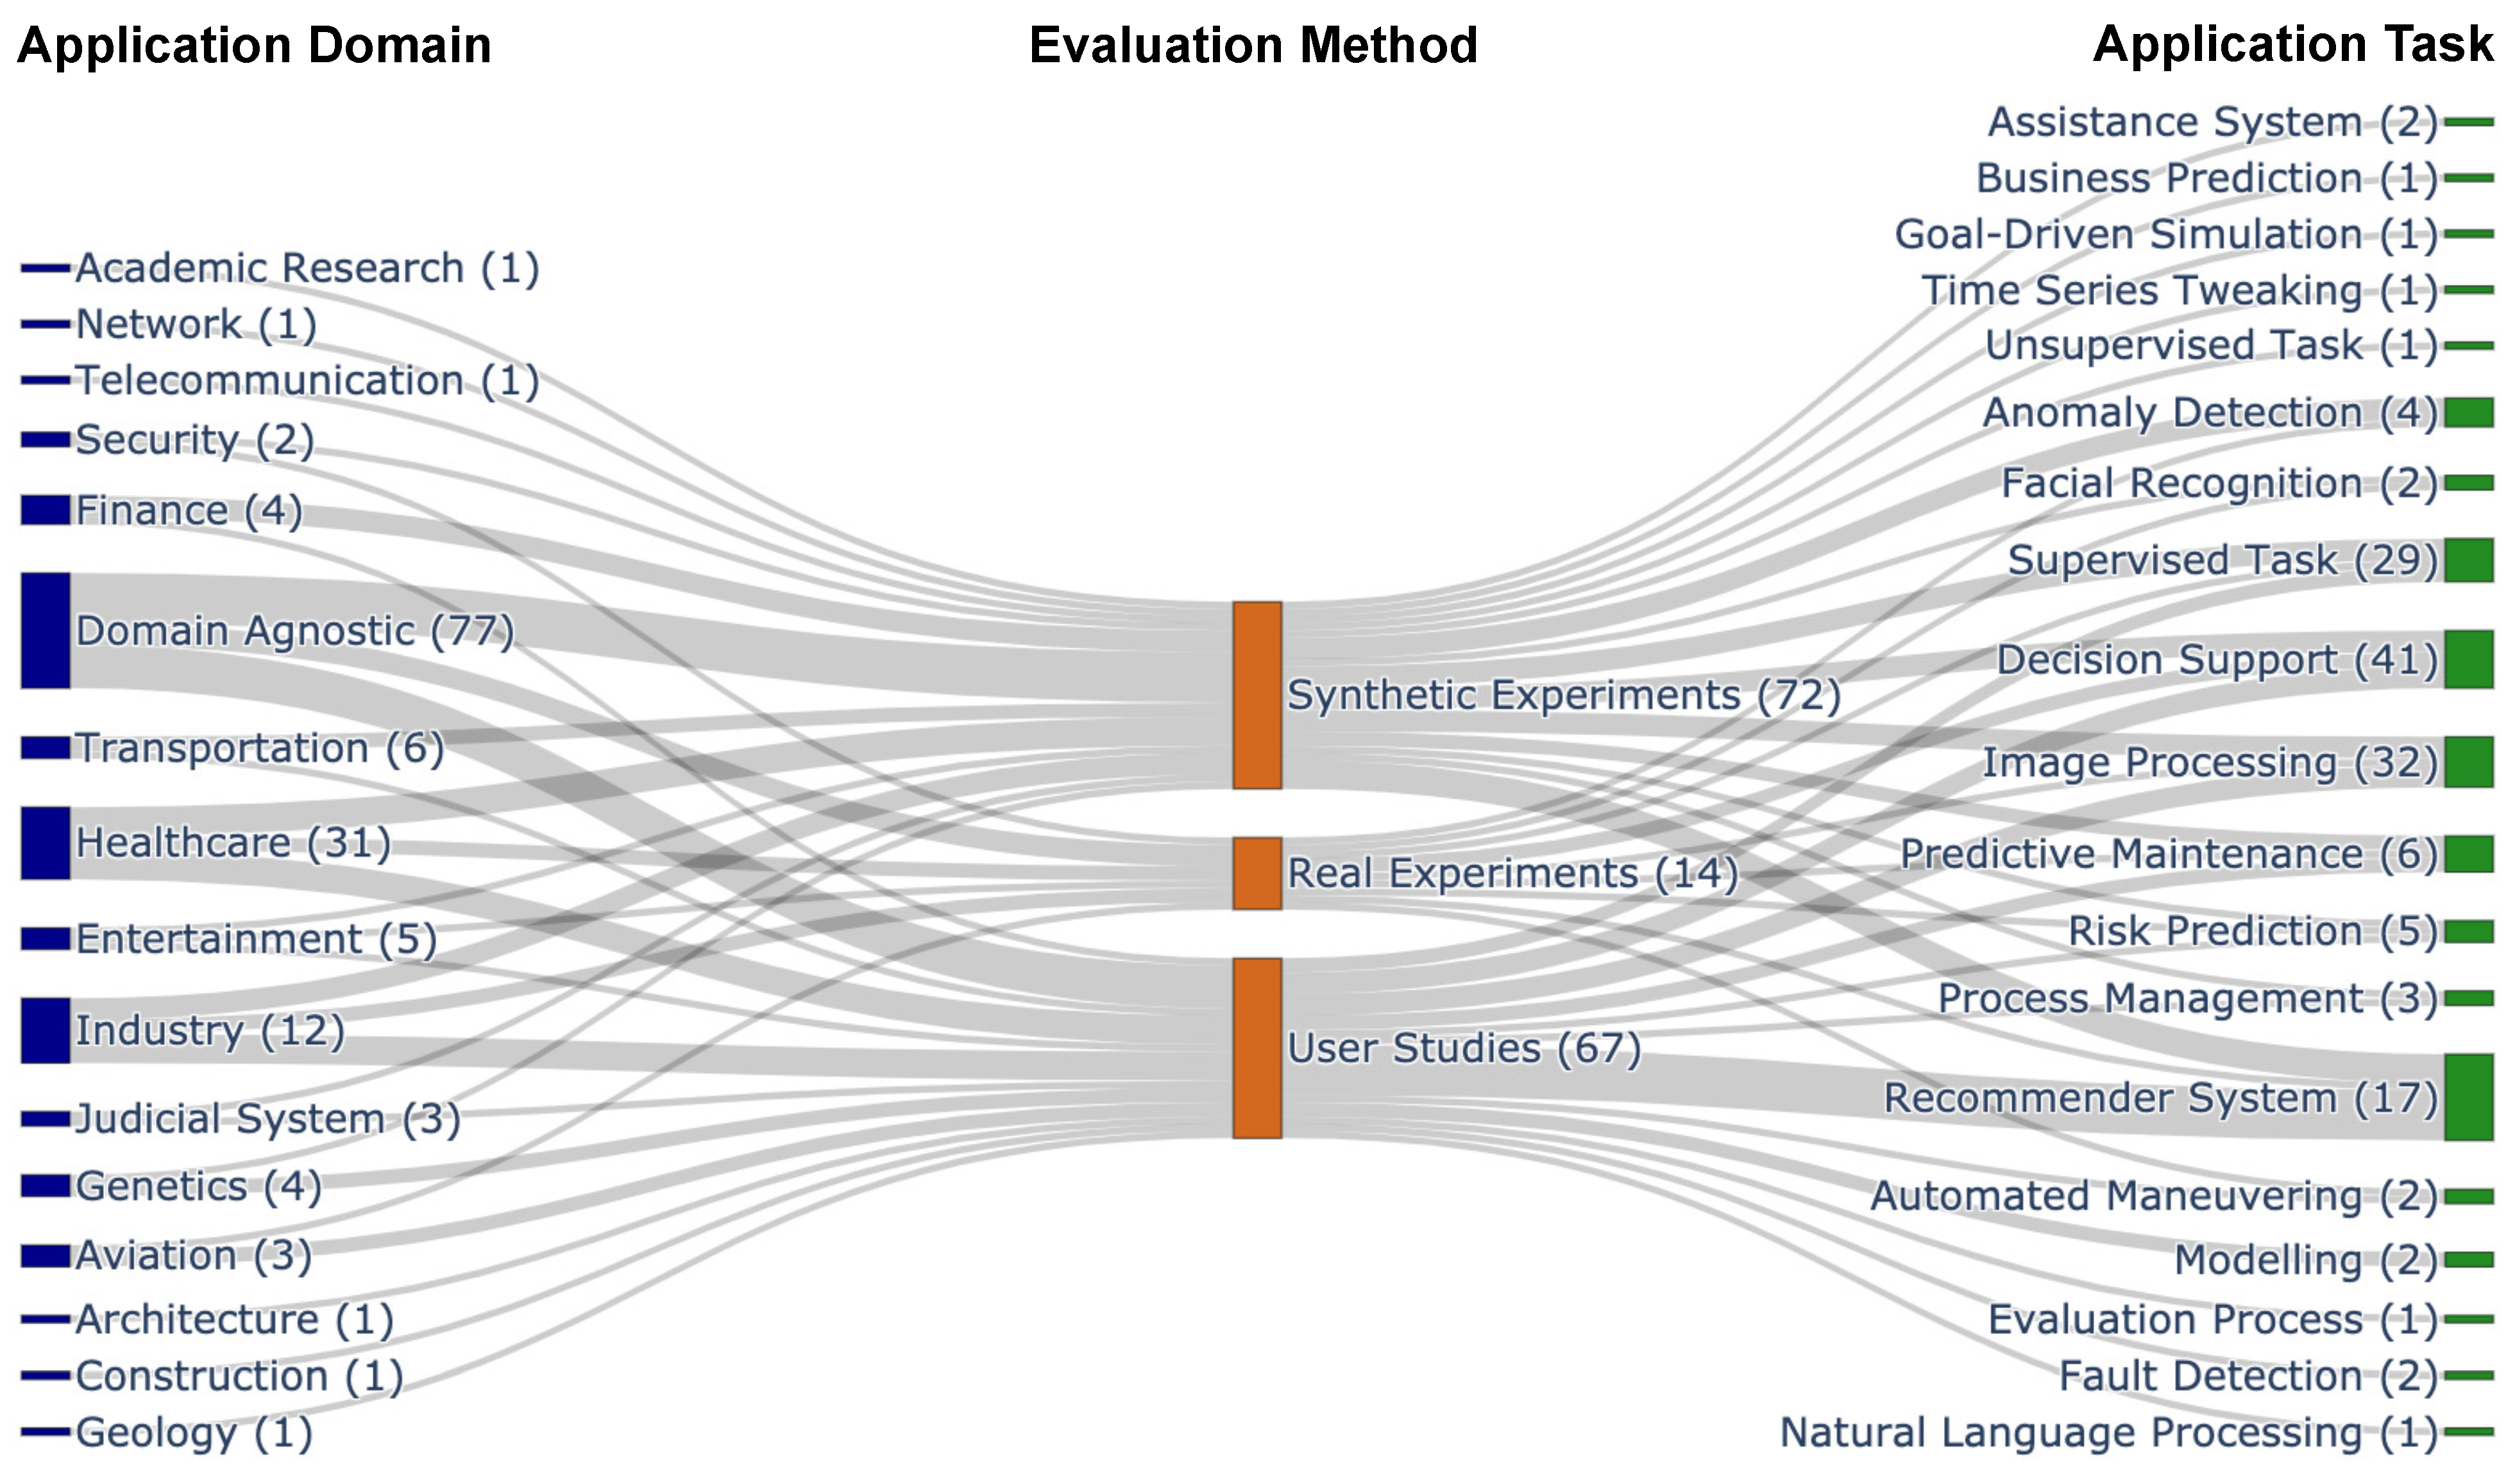
5.2. Application Domains and Tasks

| Domain | Application/Task | Study Count | References |
|---|---|---|---|
| Domain agnostic | Supervised tasks | 23 | [46,47,48,49,50,51,52,53,54,55,56,57,58,59,60,61,62,63,64,65,66,67,68] |
| Image processing | 20 | [25,69,70,71,72,73,74,75,76,77,78,79,80,81,82,83,84,85,86,87] | |
| Decision support | 13 | [7,12,23,88,89,90,91,92,93,94,95,96,97] | |
| Recommender system | 4 | [98,99,100,101] | |
| Anomaly detection | 1 | [102] | |
| Evaluation process | 1 | [103] | |
| Natural language processing | 1 | [104] | |
| Predictive maintenance | 1 | [105] | |
| Time series tweaking | 1 | [106] | |
| Healthcare | Decision support | 20 | [107,108,109,110,111,112,113,114,115,116,117,118,119,120,121,122,123,124,125,126] |
| Risk prediction | 4 | [127,128,129,130] | |
| Image processing | 3 | [131,132,133] | |
| Recommender system | 2 | [134,135] | |
| Anomaly detection | 1 | [136] | |
| Industry | Predictive maintenance | 5 | [137,138,139,140,141] |
| Business management | 3 | [142,143,144] | |
| Anomaly detection | 1 | [145] | |
| Modelling | 1 | [146] | |
| Transportation | Image processing | 4 | [147,148,149,150] |
| Assistance system | 2 | [151,152] | |
| Academia | Evaluation | 3 | [153,154,155] |
| Recommender system | 1 | [156] | |
| Entertainment | Recommender system | 3 | [157,158,159] |
| Finance | Anomaly detection | 1 | [160] |
| Business management | 1 | [161] | |
| Recommender system | 1 | [162] | |
| Judicial system | Decision support | 3 | [163,164,165] |
| Genetics | Prediction | 2 | [166,167] |
| Modelling gene relationship | 1 | [168] | |
| Aviation | Automated manoeuvring | 1 | [169] |
| Predictive maintenance | 1 | [170] | |
| Architecture | Recommender system | 1 | [171] |
| Construction | Recommender system | 1 | [172] |
| Culture | Recommender system | 1 | [173] |
| Defence | Simulation | 1 | [174] |
| Geology | Recommender system | 1 | [175] |
| Network | Supervised tasks | 1 | [176] |
| Security | Facial recognition | 1 | [177] |
| Telecommunication | Goal-driven simulation | 1 | [178] |
5.3. Development of XAI in Different Application Domains
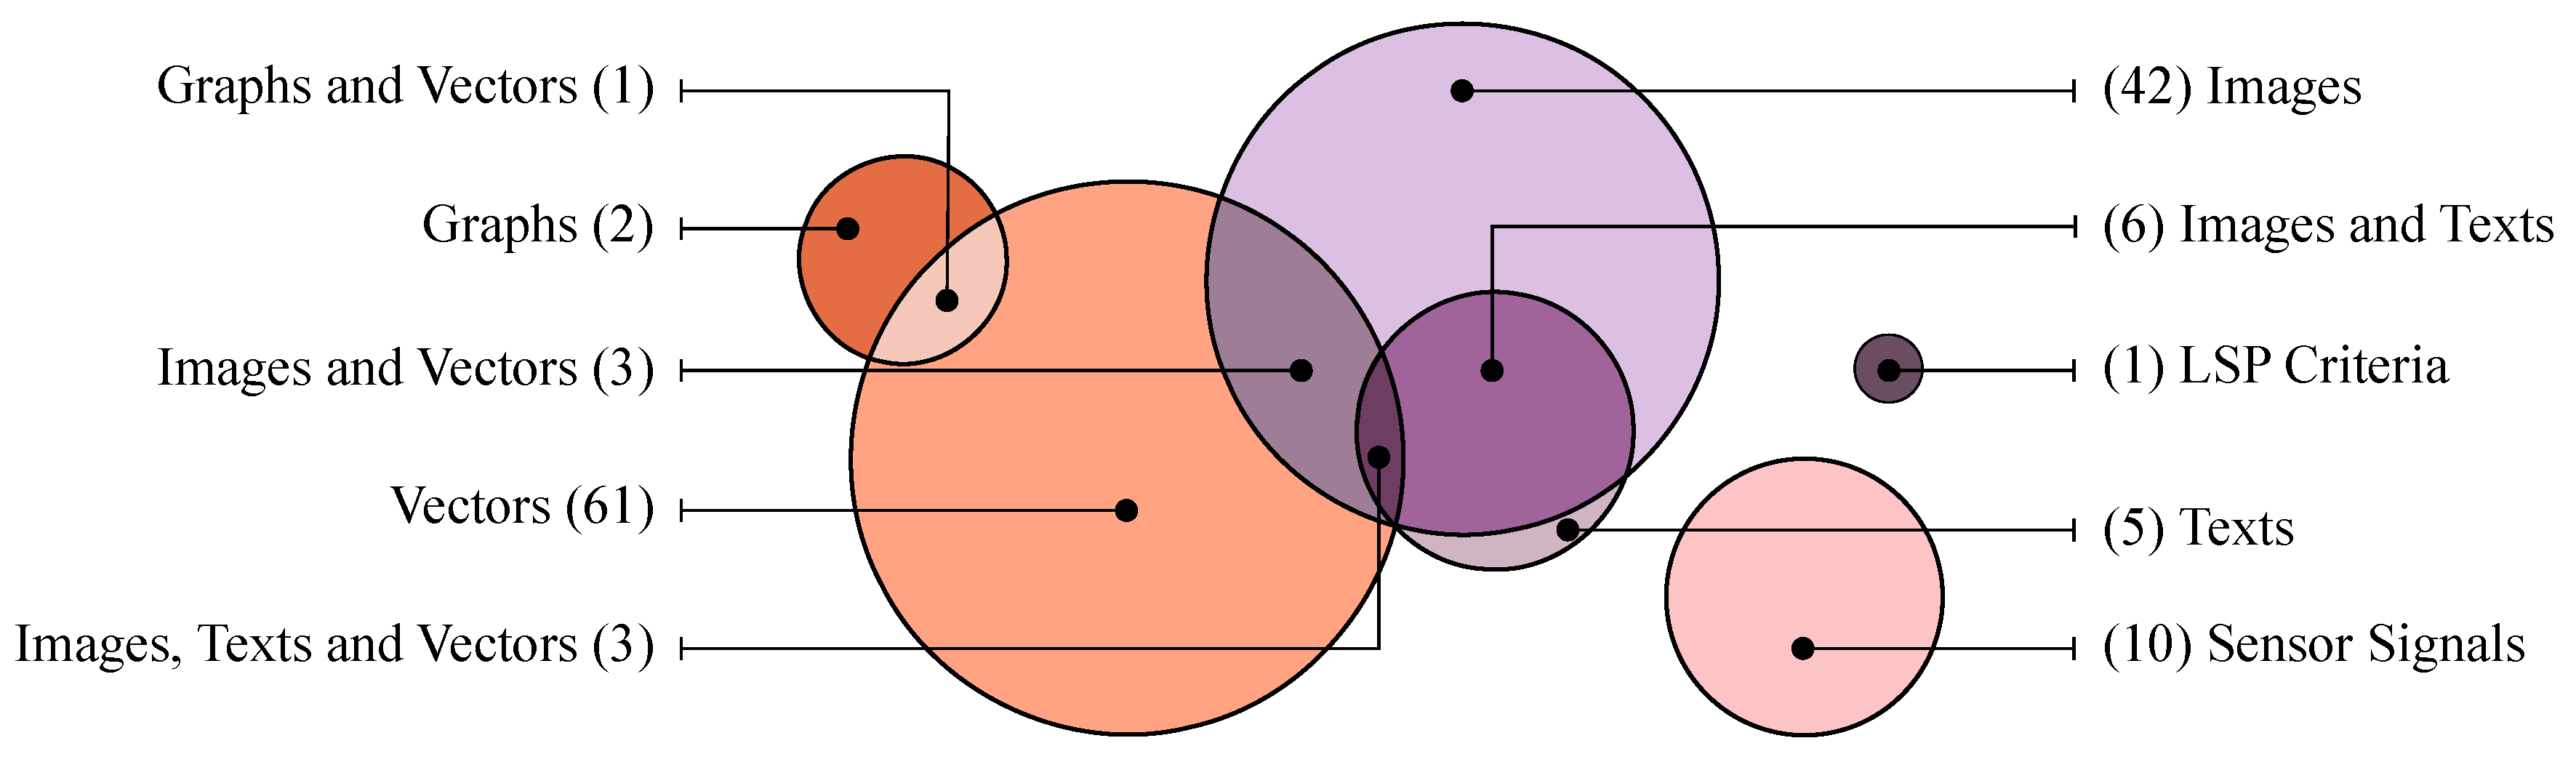
5.3.1. Input Data
5.3.2. Models for Primary Tasks
| Model Types | Models | Count | References |
|---|---|---|---|
| Neural Networks (NNs) | ApparentFlow-net; Convolutional Neural Network (CNN); Deep Neural Network (DNN); Deep Reinforcement Learning (DRL); Explainable Deep Neural Network (xDNN); Explainable Neural Network (ExNN); Global–Local Capsule Networks (GLCapsNet); GoogleLeNet; Gramian Angular Summation Field CNN (GASF-CNN); Hopfield Neural Networks (HNN); Knowledge-Aware Path Recurrent Network; Knowledge-Shot Learning (KSL); LeNet-5; Locally Guided Neural Networks (LGNN); Long/Short-Term Memory (LSTM); LVRV-net; MatConvNet; Multilayer Perceptrons (MLP); Nilpotent Neural Network (NNN); Recurrent Neural Network (RNN); Region-Based CNN (RCNN); RestNet; ROI-Net; Temporal Convolutional Netwrok (TCN); VGG-19; YOLO | 63 | [7,23,25,49,51,58,60,66,68,69,70,71,73,74,76,78,79,80,81,83,84,85,86,87,89,93,98,101,108,109,110,111,115,117,119,120,124,128,132,133,135,137,140,141,143,144,147,149,150,151,152,156,158,159,160,161,170,172,177] |
| Ensemble Models (EMs) | Adaptive Boosting (AdaBoost); Explainable Unsupervised Decision Trees (eUD3.5); eXtreme Gradient Boosting (XGBoost); Gradient Boosting Machines (GBM); Isolation Forest (IF); Random Forest (RF); Random Shapelet Forest (RSF) | 21 | [23,47,48,49,50,55,63,65,102,106,111,112,114,123,130,139,142,145,163,170,172] |
| Tree-Based Models (TB) | Classification and Regression Tree (CART); Conditional Inference Tree (CTree); Decision Tree (DT); Fast and Frugal Trees (FFTs); Fuzzy Hoeffding Decision Tree (FHDT); J48; One-Class Tree (OCTree); Multi-Operator Temporal Decision Tree (MTDT); Recursive Partitioning and Regression Trees (RPART) | 10 | [12,52,54,88,105,108,127,128,136,172] |
| Fuzzy Models (FMs) | Big Bang–Big Crunch Interval Type-2 Fuzzy Logic System (BB-BC IT2FLS); Constrained Interval Type-2 Fuzzy System (CIT2FS); Cumulative Fuzzy Class Membership Criterion (CFCMC); Fuzzy Unordered Rule Induction Algorithm (FURIA); Hierarchical Fuzzy Systems (HFS); Multi-Objective Evolutionary Fuzzy Classifiers (MOEFC); Wang–Mendal Algorithm of Fuzzy Rule Generation (WM Algorithm) | 09 | [52,61,64,95,104,134,157,178] |
| Support Vector Machines (SVMs) | SVM with Linear and Radial Basis Function (RBF) Kernels | 08 | [12,23,47,48,49,63,87,128,139,170,176] |
| Unsorted Models (UMs) | Cartesian Genetic Programming (CGP); Computational Argumentation (CA); Logic Scoring of Preferences (LSP); Preference Learning (PL); Probabilistic Soft Logic (PSL); Sequential Rule Mining (SRM); TriRank | 07 | [100,103,113,122,162,164,168] |
| Linear Models (LMs) | Linear Discriminant Analysis (LDA); Logistic Regression (LgR); Linear Regression (LnR) | 06 | [12,99,124,128,172] |
| Nearest Neighbours Models (NNMs) | k-Nearest Neighbours (kNN); Distance-Weighted kNN (WkNN) | 06 | [12,106,128,139,156,170] |
| Neuro-Fuzzy Models (NFMs) | Adaptive Network-Based Fuzzy Inference System (ANFIS); Improved Choquet Integral Multilayer Perceptron (iChIMP); LeNet with Fuzzy Classifier; Mamdani Fuzzy Model; Sugeno-Type Fuzzy Inference System; Zero-Order Autonomous Learning Multiple-Model (ALMMo-0*) | 05 | [82,90,116,118,169] |
| Case-Based Reasoning (CBR) | CBR-kNN; CBR-WkNN; CBR-PRVC (Pattern Recognition, Validation and Contextualisation) Methodology | 04 | [92,97,121,171] |
| Bayesian Models (BM) | Bayesian Network (BN); Bayesian Rule List (BRL); Gaussian Naive Bayes Classifier/Regressor (GNBC/GNBR) | 03 | [126,139,165] |
5.3.3. Methods for Explainability
5.3.4. Forms of Explanation
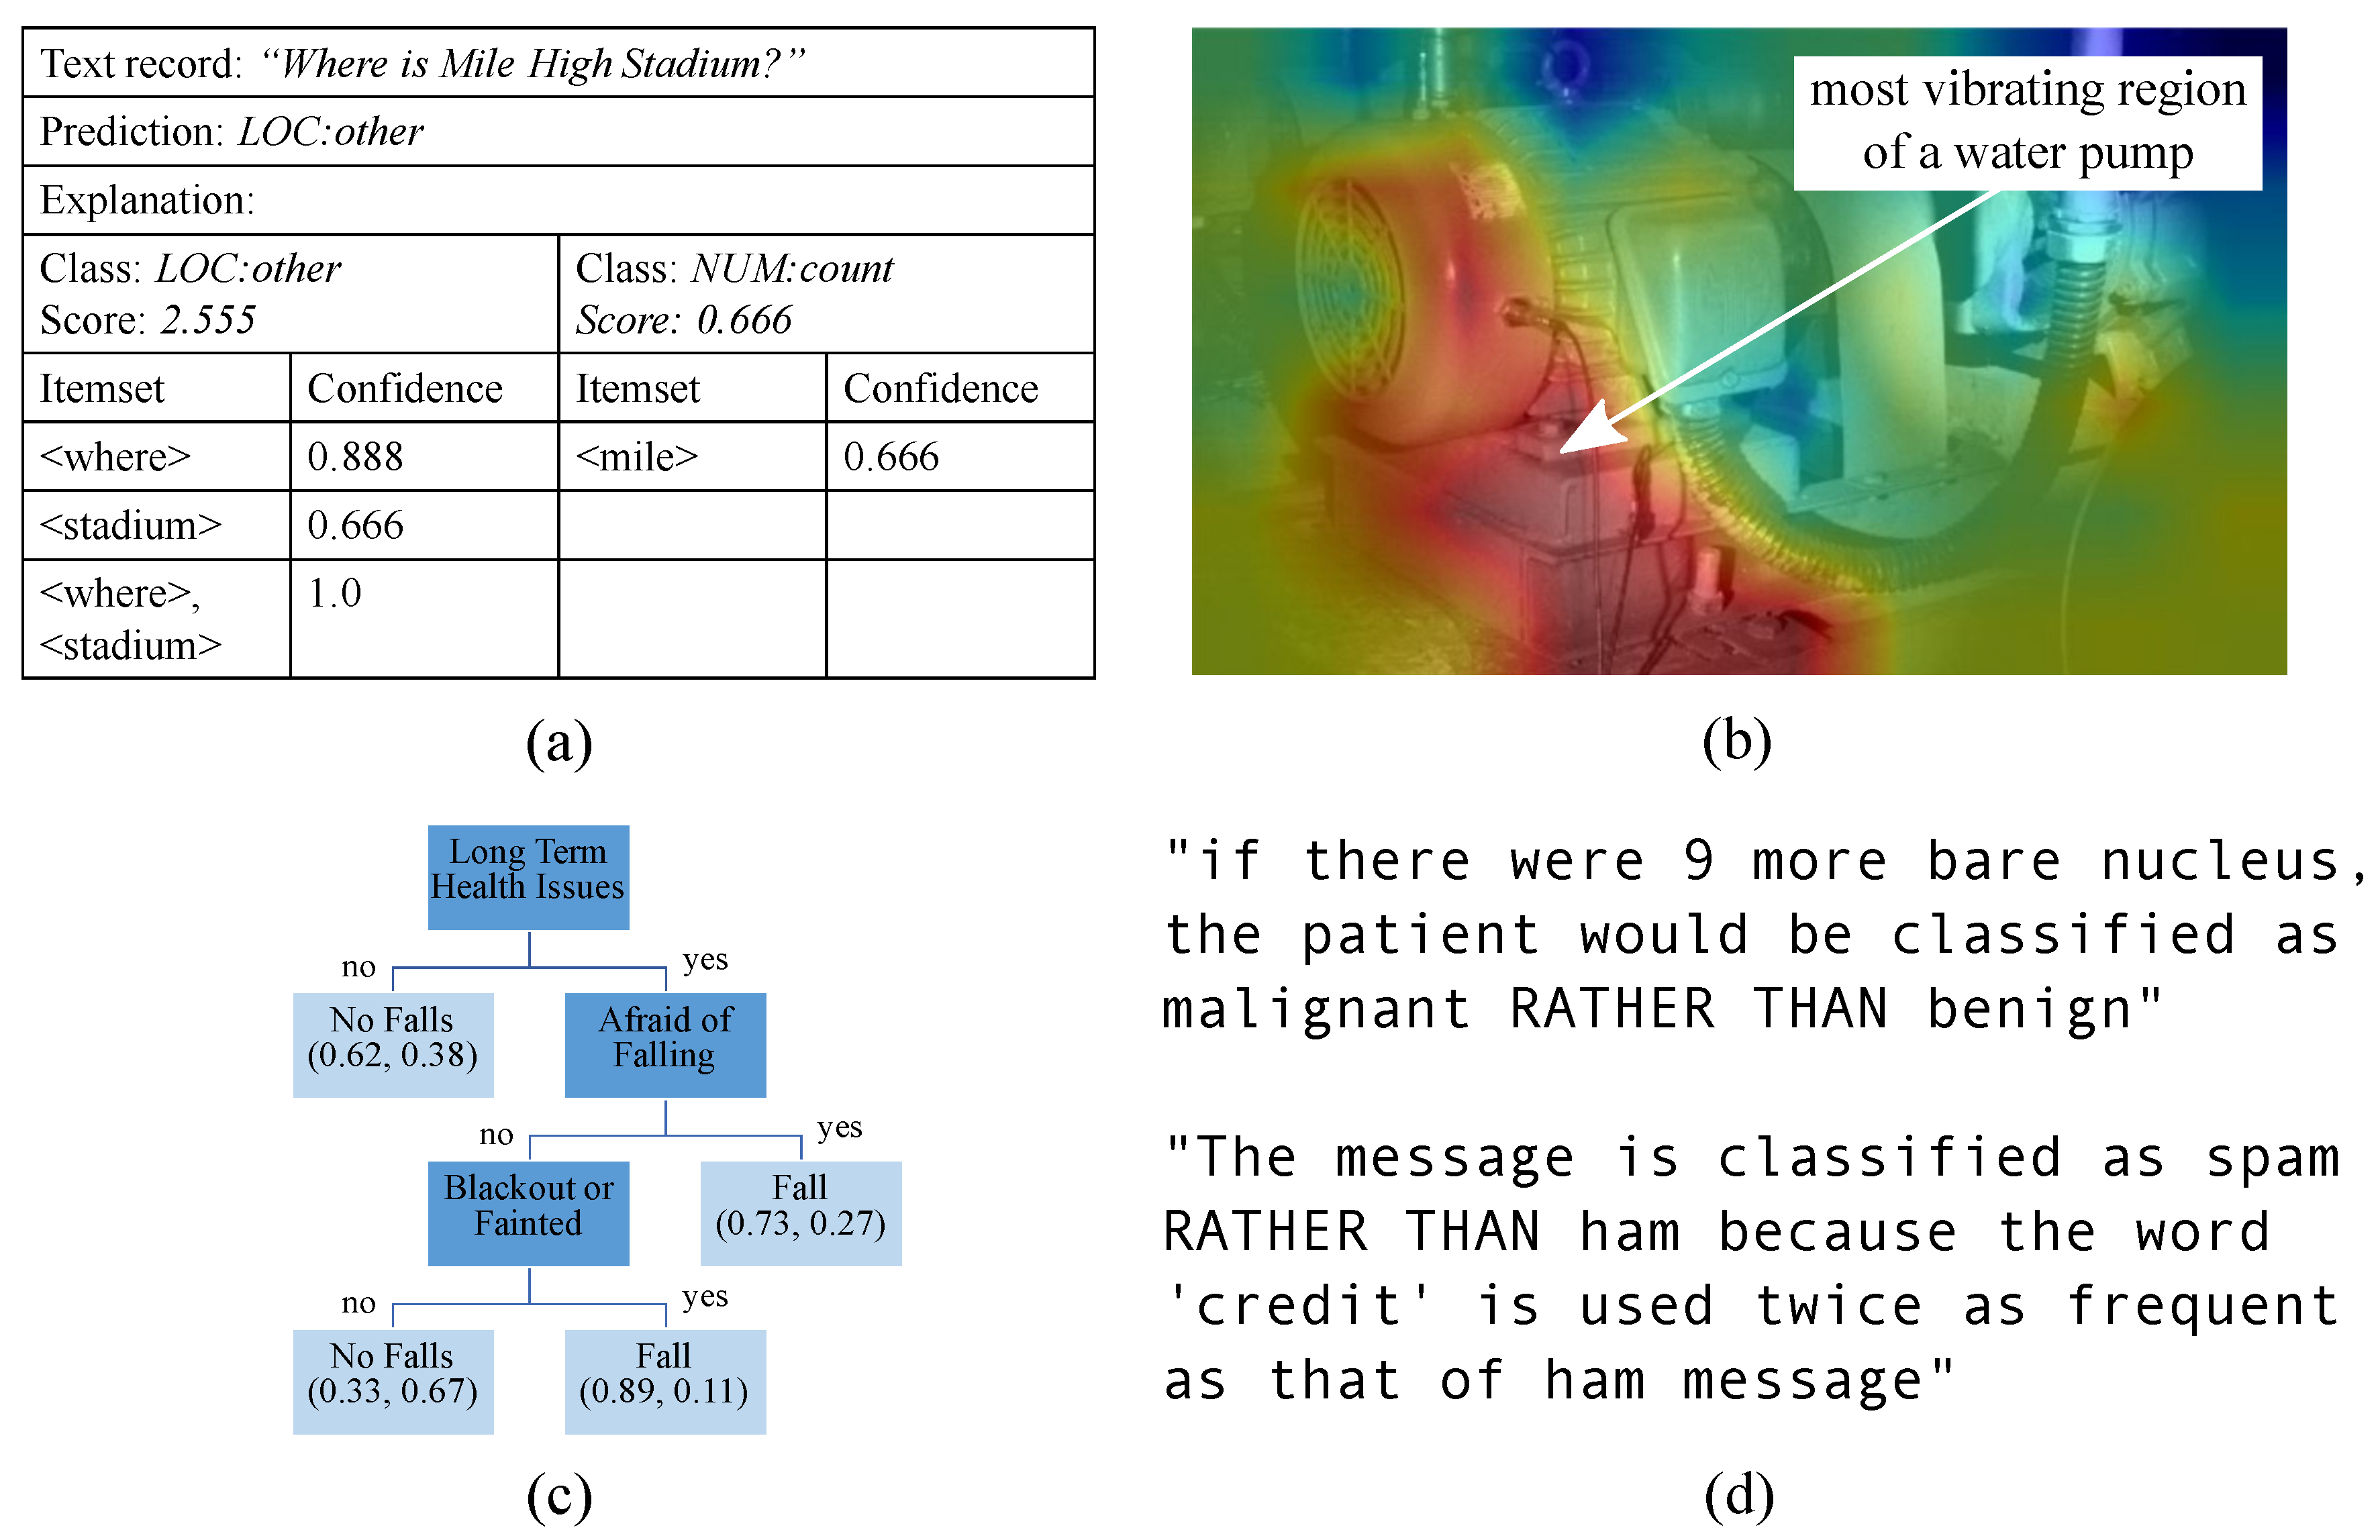
Numeric Explanations
Rule-Based Explanations
Textual Explanations
Visual Explanations
| Methods for Explainability | References | Stage | Scope | Form | Models for Primary Task | |||||
|---|---|---|---|---|---|---|---|---|---|---|
| Ah | Ph | L | G | N | R | T | V | |||
| Ada-WHIPS | [112] | ✓ | ✓ | ✓ | EM | |||||
| ALMMo-0* | [116] | ✓ | ✓ | ✓ | ✓ | NFM | ||||
| Anchors | [96] | ✓ | ✓ | ✓ | ✓ | ✓ | ✓ | ✓ | MA | |
| ANFIS | [66,118,137,169] | ✓ | ✓ | ✓ | ✓ | ✓ | ✓ | ✓ | FM; GA; NN; | |
| ApparentFlow-net | [124] | ✓ | ✓ | ✓ | NN | |||||
| Attention Maps | [79,149,151,152] | ✓ | ✓ | ✓ | NN | |||||
| BB-BC IT2FLS | [178] | ✓ | ✓ | ✓ | ✓ | ✓ | FM | |||
| BEN | [69] | ✓ | ✓ | ✓ | NN | |||||
| BN | [71,165] | ✓ | ✓ | ✓ | ✓ | BM | ||||
| BRL | [126] | ✓ | ✓ | ✓ | BM | |||||
| CAM | [140,141] | ✓ | ✓ | ✓ | NN | |||||
| Candlestick Plots | [161] | ✓ | ✓ | ✓ | NN | |||||
| CART | [127] | ✓ | ✓ | ✓ | TM | |||||
| CASTLE | [47] | ✓ | ✓ | ✓ | ✓ | ✓ | MA | |||
| Causal Importance | [68] | ✓ | ✓ | ✓ | NN | |||||
| CFCMC | [61] | ✓ | ✓ | ✓ | FM | |||||
| CGP | [122] | ✓ | ✓ | ✓ | UM | |||||
| CIE | [49] | ✓ | ✓ | ✓ | ✓ | ✓ | EM; NN; SVM | |||
| CIT2FS | [134] | ✓ | ✓ | ✓ | ✓ | FM | ||||
| Concept Attribution | [132] | ✓ | ✓ | ✓ | ✓ | NN | ||||
| Counterfactual Sets | [7,55] | ✓ | ✓ | ✓ | EM; NN | |||||
| CTree | [108,127] | ✓ | ✓ | ✓ | TM | |||||
| DeconvNet | [83] | ✓ | ✓ | ✓ | ✓ | NN | ||||
| Decision Tree | [54,75] | ✓ | ✓ | ✓ | ✓ | NN; TM | ||||
| Deep-SHAP | [143] | ✓ | ✓ | ✓ | ✓ | ✓ | MA | |||
| DTD | [85] | ✓ | ✓ | ✓ | NN | |||||
| DIFFI | [145] | ✓ | ✓ | ✓ | EM | |||||
| ELI5 | [139,142] | ✓ | ✓ | ✓ | ✓ | ✓ | MA | |||
| Encoder–Decoder | [133] | ✓ | ✓ | ✓ | NN | |||||
| eUD3.5 | [102] | ✓ | ✓ | ✓ | ✓ | EM | ||||
| ExNN | [60] | ✓ | ✓ | ✓ | ✓ | NN | ||||
| FACE | [78] | ✓ | ✓ | ✓ | NN | |||||
| FDE | [170] | ✓ | ✓ | ✓ | ✓ | EM; NN; NNM; SVM | ||||
| Feature Importance | [67,128,144,172] | ✓ | ✓ | ✓ | ✓ | ✓ | ✓ | MA | ||
| Feature Pattern | [163] | ✓ | ✓ | ✓ | EM | |||||
| FFT | [127] | ✓ | ✓ | ✓ | TM | |||||
| FINGRAM | [88] | ✓ | ✓ | ✓ | TM | |||||
| FormuCaseViz | [97] | ✓ | ✓ | ✓ | CBR | |||||
| FURIA | [52] | ✓ | ✓ | ✓ | FM | |||||
| Fuzzy LeNet | [82] | ✓ | ✓ | ✓ | FM | |||||
| Fuzzy Relations | [64,104] | ✓ | ✓ | ✓ | FM | |||||
| gbt-HIPS | [50] | ✓ | ✓ | ✓ | ✓ | EM | ||||
| Generation | [159] | ✓ | ✓ | ✓ | NN | |||||
| GLAS | [77] | ✓ | ✓ | ✓ | MA | |||||
| GRACE | [58] | ✓ | ✓ | ✓ | NN | |||||
| Grad-CAM | [53,72,80,109,117,137,146] | ✓ | ✓ | ✓ | NN | |||||
| Growing Spheres | [63] | ✓ | ✓ | ✓ | ✓ | EM; SVM | ||||
| HFS | [95] | ✓ | ✓ | ✓ | ✓ | FM | ||||
| iChIMP | [90] | ✓ | ✓ | ✓ | ✓ | NFM | ||||
| ICM | [92] | ✓ | ✓ | ✓ | CBR | |||||
| iNNvestigate | [135] | ✓ | ✓ | ✓ | ✓ | NN | ||||
| Interpretable Filters | [25] | ✓ | ✓ | ✓ | NN | |||||
| J48 | [52,127,166] | ✓ | ✓ | ✓ | ✓ | TM | ||||
| Knowledge Graph | [158] | ✓ | ✓ | ✓ | ✓ | NN | ||||
| KSL | [110] | ✓ | ✓ | ✓ | ✓ | NN | ||||
| LEWIS | [46] | ✓ | ✓ | ✓ | ✓ | ✓ | MA | |||
| LGNN | [81] | ✓ | ✓ | ✓ | NN | |||||
| LIME | [12,111,119,139,146] | ✓ | ✓ | ✓ | ✓ | ✓ | MA | |||
| LORE | [23,123] | ✓ | ✓ | ✓ | EM; NN; SVM | |||||
| LPS | [76] | ✓ | ✓ | ✓ | NN | |||||
| LRP | [87] | ✓ | ✓ | ✓ | NN; SVM | |||||
| LRCN | [86] | ✓ | ✓ | ✓ | NN; | |||||
| LSP | [103] | ✓ | ✓ | ✓ | ✓ | UM | ||||
| MAPLE | [65] | ✓ | ✓ | ✓ | ✓ | ✓ | MA | |||
| MTDT | [105] | ✓ | ✓ | ✓ | TM | |||||
| Mutual Importance | [99] | ✓ | ✓ | ✓ | LM | |||||
| MWC, MWP | [93] | ✓ | ✓ | ✓ | ✓ | NN | ||||
| Nilpotent Logic Operators | [98] | ✓ | ✓ | ✓ | ✓ | ✓ | NN | |||
| NLG | [51] | ✓ | ✓ | ✓ | ✓ | ✓ | NN | |||
| NMF | [25] | ✓ | ✓ | ✓ | NN | |||||
| OC-Tree | [136] | ✓ | ✓ | ✓ | TM | |||||
| Ontological Perturbation | [115] | ✓ | ✓ | ✓ | NN | |||||
| PAES-RCS | [176] | ✓ | ✓ | ✓ | FM | |||||
| PASTLE | [48] | ✓ | ✓ | ✓ | ✓ | ✓ | MA | |||
| pGrad-CAM | [160] | ✓ | ✓ | ✓ | NN | |||||
| Prescience | [130] | ✓ | ✓ | ✓ | EM | |||||
| PRVC | [171] | ✓ | ✓ | ✓ | ✓ | ✓ | ✓ | CBR | ||
| PSL | [100] | ✓ | ✓ | ✓ | ✓ | UM | ||||
| QMC | [177] | ✓ | ✓ | ✓ | NN | |||||
| QSAR | [167] | ✓ | ✓ | ✓ | NN | |||||
| RAVA | [175] | ✓ | ✓ | ✓ | MA | |||||
| RBIA | [113,121] | ✓ | ✓ | ✓ | ✓ | CBR | ||||
| RetainVis | [120] | ✓ | ✓ | ✓ | ✓ | ✓ | ✓ | NN | ||
| RISE | [148] | ✓ | ✓ | ✓ | NN | |||||
| RPART | [108] | ✓ | ✓ | ✓ | TM | |||||
| RuleMatrix | [94] | ✓ | ✓ | ✓ | MA | |||||
| Saliency | [68] | ✓ | ✓ | ✓ | NN | |||||
| SHAP | [84,107,114,123,138,139,150] | ✓ | ✓ | ✓ | ✓ | ✓ | MA | |||
| Shapelet Tweaking | [106] | ✓ | ✓ | ✓ | EM | |||||
| SLRP | [70] | ✓ | ✓ | ✓ | NN | |||||
| SRM | [168] | ✓ | ✓ | ✓ | ✓ | UM | ||||
| SurvLIME-KS | [57] | ✓ | ✓ | ✓ | ✓ | ✓ | MA | |||
| TCBR | [156] | ✓ | ✓ | ✓ | CBR | |||||
| Template-Based Natural Language Generation | [164] | ✓ | ✓ | ✓ | UM | |||||
| Time-Varying Neighbourhood | [101] | ✓ | ✓ | ✓ | ✓ | NN | ||||
| TreeExplainer | [84] | ✓ | ✓ | ✓ | ✓ | ✓ | MA | |||
| TREPAN | [89] | ✓ | ✓ | ✓ | NN | |||||
| Tripartite Graph | [162] | ✓ | ✓ | ✓ | ✓ | UM | ||||
| WM Algorithm | [157] | ✓ | ✓ | ✓ | FM | |||||
| xDNN | [116] | ✓ | ✓ | ✓ | NN | |||||
| XRAI | [147] | ✓ | ✓ | ✓ | NN | |||||
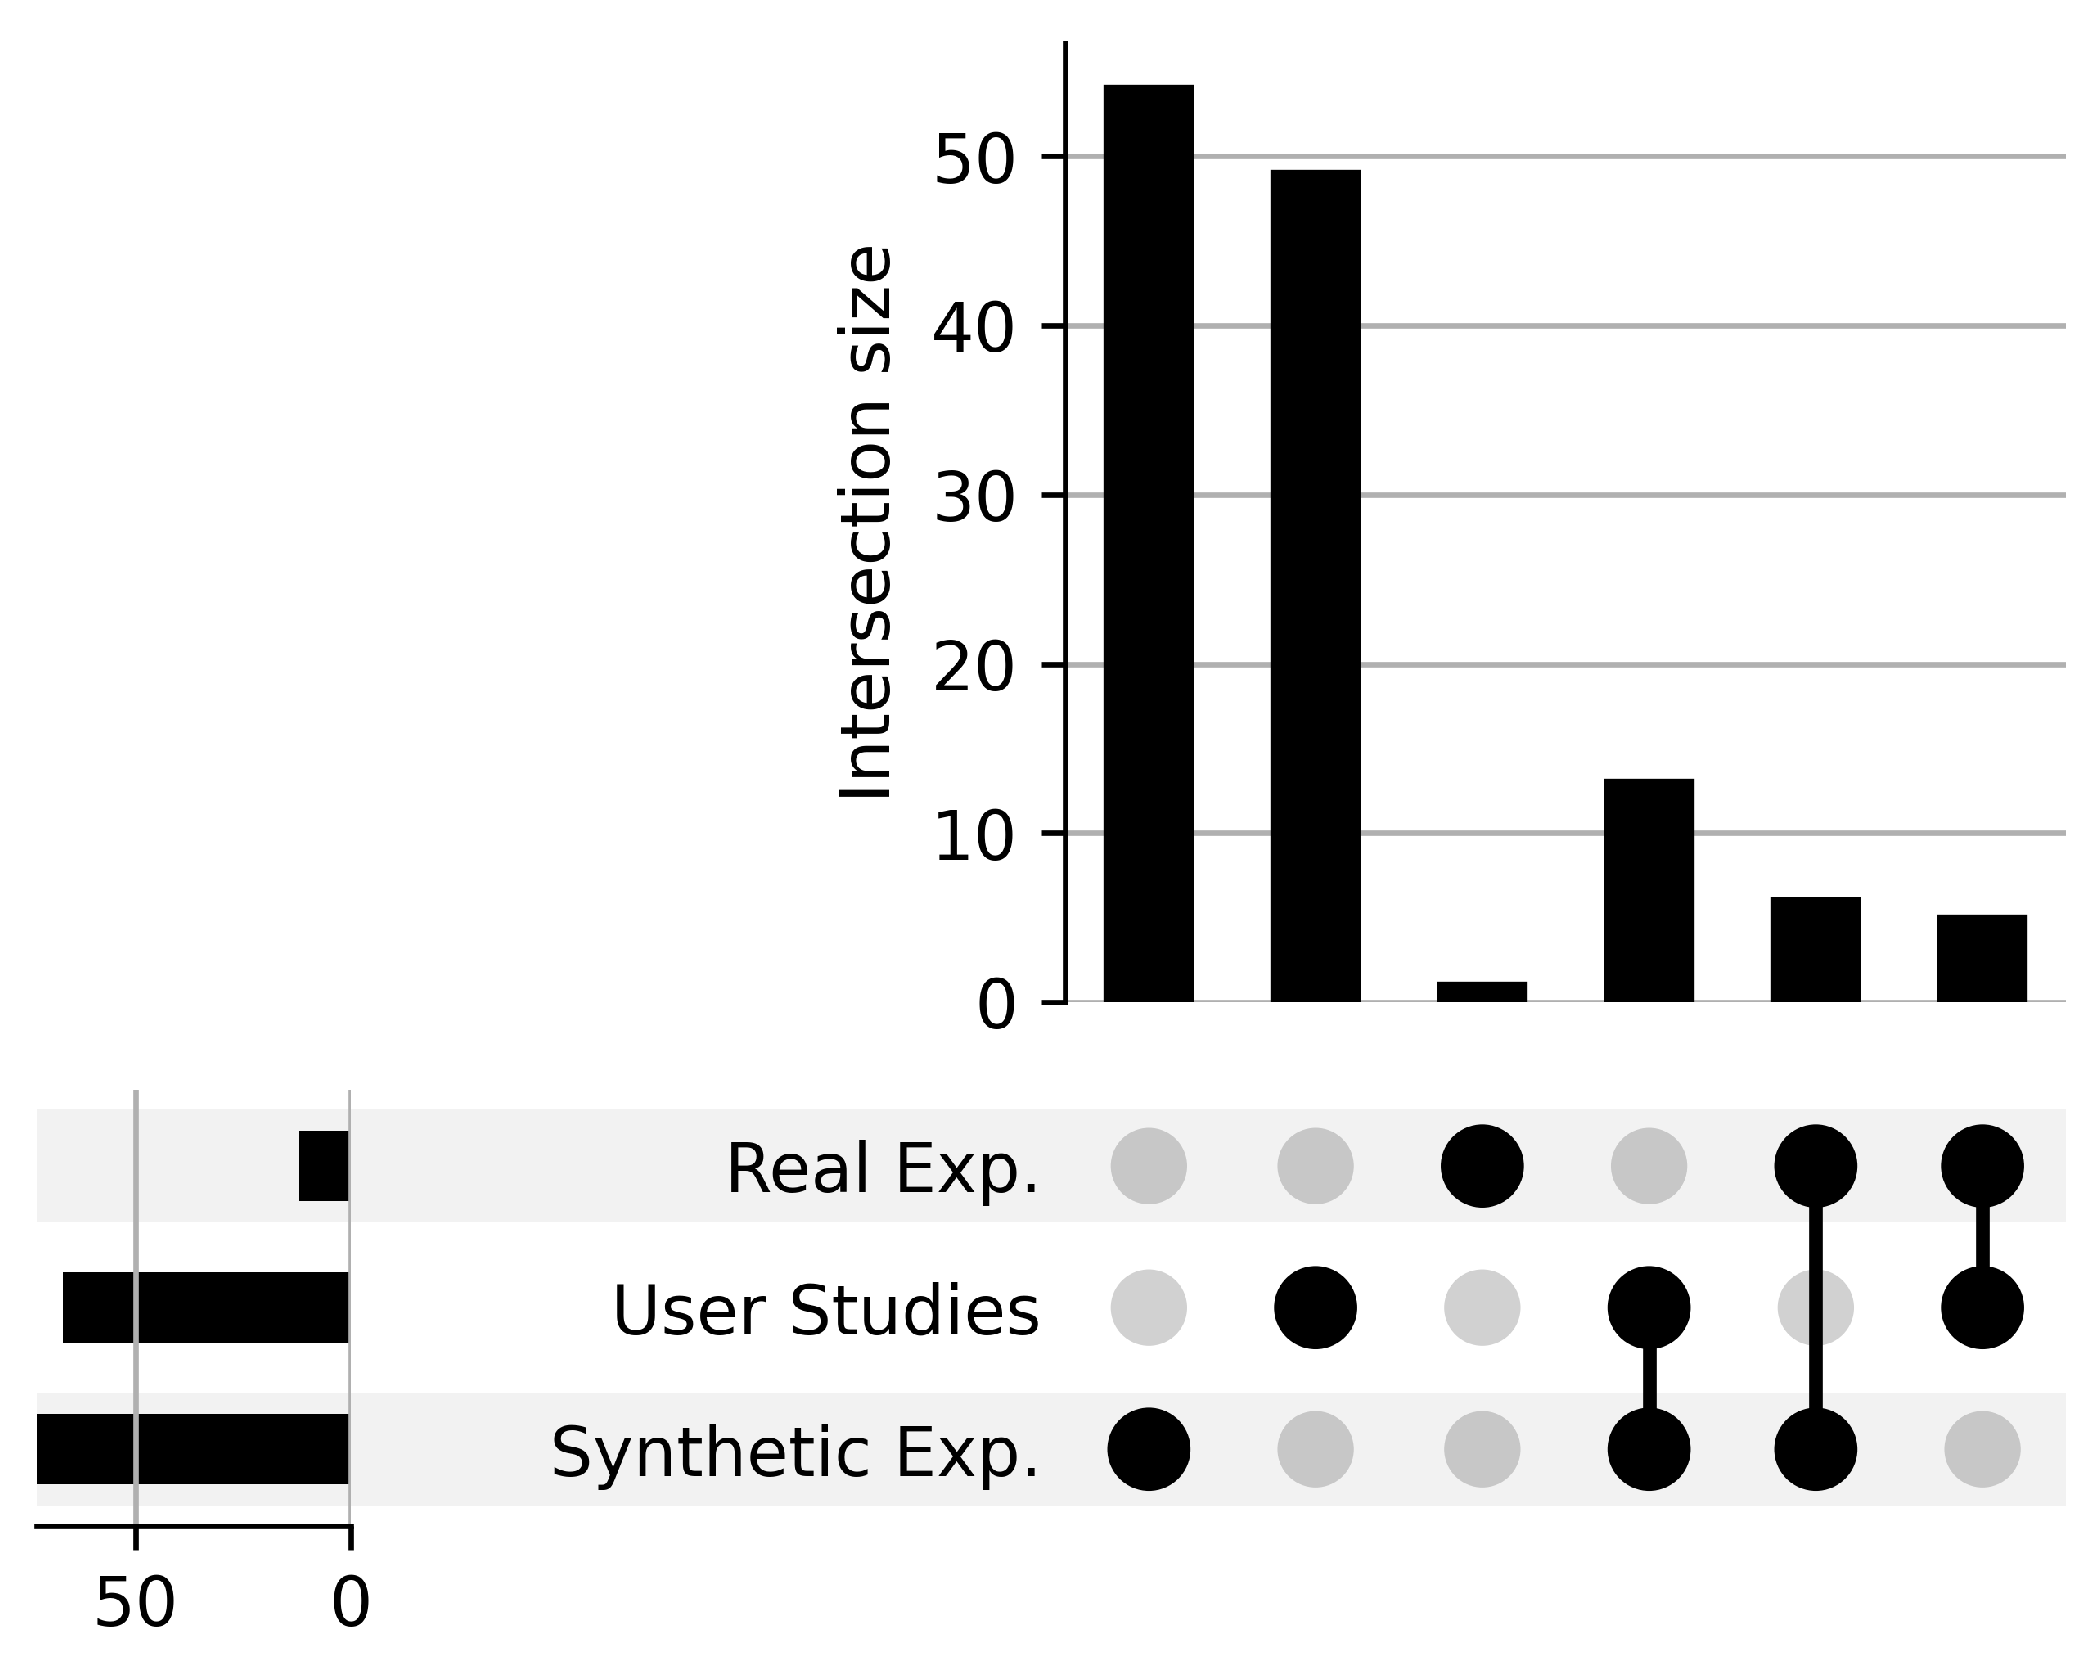
5.3.5. Evaluation of Explainability
6. Discussion
6.1. Input Data and Models for Primary Task
6.2. Development of Explainable Models in Different Application Domains
6.2.1. Application Domains and Tasks
6.2.2. Explainable Models
6.2.3. Forms of Explanation
6.3. Evaluation Metrics for Explainable Models
6.4. Open Issues and Future Research Direction
- It is evident in the findings of the study that safety-critical domains and associated tasks are most facilitated with the development of XAI. However, less investigation was performed for other sensitive domains, such as the judicial system, finance and academia, in contrast with the domains of healthcare and industry. Further exploitation of the methods can be performed for the less developed domains in terms of XAI;
- One of the promising research areas in the domain of networking is the Internet of Things (IoT). The literature indicates that several applications such as anomaly detection [183] and building information systems [184,185] for IoT have been facilitated by agent-based algorithms. These applications can be further associated with XAI methods to make them more acceptable to end-users;
- The impact of the dataset (particularly the effect of dataset imbalance, feature dimensionality, different types of bias problems in data acquisition and dataset, etc.) on developing an explainable model can be assessed through studies;
- It was observed that most of the works were performed done for neural networks and through post hoc methods, explanations were generated at the local scope. Similar cases were also observed for other models, such as SVM and ensemble models, since their inference mechanism remains unclear to users. Although several studies have shown approaches to produce explanations at a global scope by mimicking the models’ behaviour, they lack performance accuracy. More investigations can be carried out to produce an explanation in a global scope without compromising the models’ performance for the base task;
- The major challenge of evaluating an explanation is to develop a method that can deal with the different levels of expertise and understanding of users. Generally, these two characteristics of users vary from person to person. Substantial research is needed to establish a proper methodology for evaluating the explanations based on the intended users’ expertise and capacity;
- User studies were invoked to validate explanations based on natural language, in short, textual explanations. Automated evaluation metrics for textual explanations are not yet prominent in the research works;
- Evaluating the quality of heatmaps as a form of visualisation is still undiscovered beyond the visual assessment technique. In addition to heatmaps, evaluation metrics for other visualisation techniques, e.g., saliency maps, are yet to be defined.
7. Conclusions
Author Contributions
Funding
Institutional Review Board Statement
Informed Consent Statement
Data Availability Statement
Conflicts of Interest
References
- Rai, A. Explainable AI: From Black Box to Glass Box. J. Acad. Mark. Sci. 2020, 48, 137–141. [Google Scholar] [CrossRef] [Green Version]
- Guidotti, R.; Monreale, A.; Ruggieri, S.; Turini, F.; Giannotti, F.; Pedreschi, D. A Survey of Methods for Explaining Black Box Models. ACM Comput. Surv. 2018, 51, 1–42. [Google Scholar] [CrossRef] [Green Version]
- Loyola-González, O. Black-Box vs. White-Box: Understanding Their Advantages and Weaknesses From a Practical Point of View. IEEE Access 2019, 7, 154096–154113. [Google Scholar] [CrossRef]
- Neches, R.; Swartout, W.; Moore, J. Enhanced Maintenance and Explanation of Expert Systems Through Explicit Models of Their Development. IEEE Trans. Softw. Eng. 1985, SE-11, 1337–1351. [Google Scholar] [CrossRef]
- Gunning, D.; Aha, D. DARPA’s Explainable Artificial Intelligence (XAI) Program. AI Mag. 2019, 40, 44–58. [Google Scholar]
- Xu, F.; Uszkoreit, H.; Du, Y.; Fan, W.; Zhao, D.; Zhu, J. Explainable AI: A Brief Survey on History, Research Areas, Approaches and Challenges. In Natural Language Processing and Chinese Computing; Tang, J., Kan, M.Y., Zhao, D., Li, S., Zan, H., Eds.; Springer International Publishing: Berlin/Heidelberg, Germany, 2019; Volume 11839, pp. 563–574. [Google Scholar] [CrossRef]
- Wachter, S.; Mittelstadt, B.; Russell, C. Counterfactual Explanations Without Opening the Black Box: Automated Decisions and the GDPR. Harv. J. Law Technol. 2018, 31, 841–887. [Google Scholar] [CrossRef] [Green Version]
- Vilone, G.; Longo, L. Explainable Artificial Intelligence: A Systematic Review. arXiv 2020, arXiv:2006.00093. [Google Scholar]
- Vilone, G.; Longo, L. Classification of Explainable Artificial Intelligence Methods through Their Output Formats. Mach. Learn. Knowl. Extr. 2021, 3, 615–661. [Google Scholar] [CrossRef]
- Lacave, C.; Diéz, F.J. A Review of Explanation Methods for Bayesian Networks. Knowl. Eng. Rev. 2002, 17, 107–127. [Google Scholar] [CrossRef]
- Ribeiro, M.T.; Singh, S.; Guestrin, C. Model-Agnostic Interpretability of Machine Learning. In Proceedings of the ICML Workshop on Human Interpretability in Machine Learning, New York, NY, USA, 23 June 2016; Available online: https://arxiv.org/abs/1606.05386 (accessed on 30 June 2021).
- Ribeiro, M.T.; Singh, S.; Guestrin, C. “Why Should I Trust You?” Explaining the Predictions of Any Classifier. In Proceedings of the 22nd ACM SIGKDD International Conference on Knowledge Discovery and Data Mining, San Francisco, CA, USA, 13–17 August 2016; ACM: New York, NY, USA, 2016; pp. 1135–1144. [Google Scholar] [CrossRef]
- Alonso, J.M.; Castiello, C.; Mencar, C. A Bibliometric Analysis of the Explainable Artificial Intelligence Research Field. In Information Processing and Management of Uncertainty in Knowledge-Based Systems. Theory and Foundations; Medina, J., Ojeda-Aciego, M., Verdegay, J.L., Pelta, D.A., Cabrera, I.P., Bouchon-Meunier, B., Yager, R.R., Eds.; Springer International Publishing: Berlin/Heidelberg, Germany, 2018; Volume 853, pp. 3–15. [Google Scholar] [CrossRef]
- Goebel, R.; Chander, A.; Holzinger, K.; Lecue, F.; Akata, Z.; Stumpf, S.; Kieseberg, P.; Holzinger, A. Explainable AI: The New 42? In Machine Learning and Knowledge Extraction; Holzinger, A., Kieseberg, P., Tjoa, A.M., Weippl, E., Eds.; Springer: Cham, Switzerland, 2018; Volume 11015, pp. 295–303. [Google Scholar] [CrossRef] [Green Version]
- Rudin, C. Stop Explaining Black Box Machine Learning Models for High Stakes Decisions and Use Interpretable Models Instead. Nat. Mach. Intell. 2019, 1, 206–215. [Google Scholar] [CrossRef] [Green Version]
- Dosilovic, F.K.; Brcic, M.; Hlupic, N. Explainable Artificial Intelligence: A Survey. In Proceedings of the 41st International Convention on Information and Communication Technology, Electronics and Microelectronics (MIPRO 2018), Opatija, Croatia, 21–25 May 2018; pp. 0210–0215. [Google Scholar] [CrossRef]
- Mittelstadt, B.; Russell, C.; Wachter, S. Explaining Explanations in AI. In Proceedings of the Conference on Fairness, Accountability, and Transparency (FAT* 2019), Atlanta, GA, USA, 29–31 January 2019; ACM Press: New York, NY, USA, 2019; pp. 279–288. [Google Scholar] [CrossRef]
- Samek, W.; Müller, K.R. Towards Explainable Artificial Intelligence. In Explainable AI: Interpreting, Explaining and Visualizing Deep Learning; Samek, W., Montavon, G., Vedaldi, A., Hansen, L.K., Müller, K.R., Eds.; Springer International Publishing: Berlin/Heidelberg, Germany, 2019; Volume 1, pp. 5–22. [Google Scholar] [CrossRef] [Green Version]
- Preece, A.; Harborne, D.; Braines, D.; Tomsett, R.; Chakraborty, S. Stakeholders in Explainable AI. In Proceedings of the AAAI FSS-18: Artificial Intelligence in Government and Public Sector, Arlington, VA, USA, 18–20 October 2018; Available online: https://arxiv.org/abs/1810.00184 (accessed on 30 June 2021).
- Barredo Arrieta, A.; Díaz-Rodríguez, N.; Del Ser, J.; Bennetot, A.; Tabik, S.; Barbado, A.; Garcia, S.; Gil-Lopez, S.; Molina, D.; Benjamins, R.; et al. Explainable Explainable Artificial Intelligence (XAI): Concepts, Taxonomies, Opportunities and Challenges toward Responsible AI. Inf. Fusion 2020, 58, 82–115. [Google Scholar] [CrossRef] [Green Version]
- Longo, L.; Goebel, R.; Lecue, F.; Kieseberg, P.; Holzinger, A. Explainable Artificial Intelligence: Concepts, Applications, Research Challenges and Visions. In Machine Learning and Knowledge Extraction; Holzinger, A., Kieseberg, P., Tjoa, A.M., Weippl, E., Eds.; Springer International Publishing: Berlin/Heidelberg, Germany, 2020; Volume 12279, pp. 1–16. [Google Scholar] [CrossRef]
- Adadi, A.; Berrada, M. Peeking Inside the Black-Box: A Survey on Explainable Artificial Intelligence (XAI). IEEE Access 2018, 6, 52138–52160. [Google Scholar] [CrossRef]
- Guidotti, R.; Monreale, A.; Giannotti, F.; Pedreschi, D.; Ruggieri, S.; Turini, F. Factual and Counterfactual Explanations for Black Box Decision Making. IEEE Intell. Syst. 2019, 34, 14–23. [Google Scholar] [CrossRef]
- Robnik-Šikonja, M.; Bohanec, M. Perturbation-Based Explanations of Prediction Models. In Human and Machine Learning; Zhou, J., Chen, F., Eds.; Springer International Publishing: Berlin/Heidelberg, Germany, 2018; pp. 159–175. [Google Scholar] [CrossRef]
- Zhang, Q.; Wu, Y.N.; Zhu, S.C. Interpretable Convolutional Neural Networks. In Proceedings of the 2018 IEEE/CVF Conference on Computer Vision and Pattern Recognition, Salt Lake City, UT, USA, June 19–21 2018; pp. 8827–8836. [Google Scholar] [CrossRef] [Green Version]
- Dağlarli, E. Explainable Artificial Intelligence (xAI) Approaches and Deep Meta-Learning Models. In Advances and Applications in Deep Learning; Aceves-Fernandez, M.A., Ed.; InTechOpen: London, UK, 2020. [Google Scholar] [CrossRef]
- Vilone, G.; Longo, L. Notions of explainability and evaluation approaches for explainable artificial intelligence. Inf. Fusion 2021, 76, 89–106. [Google Scholar] [CrossRef]
- Holzinger, A.; Langs, G.; Denk, H.; Zatloukal, K.; Müller, H. Causability and Explainability of Artificial Intelligence in Medicine. WIREs Data Min. Knowl. Discov. 2019, 9, 1–13. [Google Scholar] [CrossRef] [Green Version]
- Mathews, S.M. Explainable Artificial Intelligence Applications in NLP, Biomedical, and Malware Classification: A Literature Review. In Intelligent Computing; Arai, K., Bhatia, R., Kapoor, S., Eds.; Springer International Publishing: Berlin/Heidelberg, Germany, 2019; Volume 998, pp. 1269–1292. [Google Scholar] [CrossRef]
- Fellous, J.M.; Sapiro, G.; Rossi, A.; Mayberg, H.; Ferrante, M. Explainable Artificial Intelligence for Neuroscience: Behavioral Neurostimulation. Front. Neurosci. 2019, 13, 1–14. [Google Scholar] [CrossRef] [Green Version]
- Jiménez-Luna, J.; Grisoni, F.; Schneider, G. Drug Discovery with Explainable Artificial Intelligence. Nat. Mach. Intell. 2020, 2, 573–584. [Google Scholar] [CrossRef]
- Payrovnaziri, S.N.; Chen, Z.; Rengifo-Moreno, P.; Miller, T.; Bian, J.; Chen, J.H.; Liu, X.; He, Z. Explainable Artificial Intelligence Models using Real-world Electronic Health Record Data: A Systematic Scoping Review. J. Am. Med Inform. Assoc. 2020, 27, 1173–1185. [Google Scholar] [CrossRef]
- Ahmed, M.U.; Barua, S.; Begum, S. Artificial Intelligence, Machine Learning and Reasoning in Health Informatics—Case Studies. In Signal Processing Techniques for Computational Health Informatics. Intelligent Systems Reference Library; Ahad, M.A.R., Ahmed, M.U., Eds.; Springer International Publishing: Berlin/Heidelberg, Germany, 2021; Volume 192, pp. 261–291. [Google Scholar] [CrossRef]
- Gulum, M.A.; Trombley, C.M.; Kantardzic, M. A Review of Explainable Deep Learning Cancer Detection Models in Medical Imaging. Appl. Sci. 2021, 11, 4573. [Google Scholar] [CrossRef]
- Gade, K.; Geyik, S.C.; Kenthapadi, K.; Mithal, V.; Taly, A. Explainable AI in Industry. In Proceedings of the 25th ACM SIGKDD International Conference on Knowledge Discovery & Data Mining, Anchorage, AK, USA, 4–8 August 2019; ACM: New York, NY, USA, 2019; pp. 3203–3204. [Google Scholar] [CrossRef] [Green Version]
- Dam, H.K.; Tran, T.; Ghose, A. Explainable Software Analytics. In Proceedings of the 40th International Conference on Software Engineering New Ideas and Emerging Results–ICSE-NIER ’18, Gothenburg, Sweden, 27 May–3 June 2018; ACM Press: New York, NY, USA, 2018; pp. 53–56. [Google Scholar] [CrossRef] [Green Version]
- Chaczko, Z.; Kulbacki, M.; Gudzbeler, G.; Alsawwaf, M.; Thai-Chyzhykau, I.; Wajs-Chaczko, P. Exploration of Explainable AI in Context of Human–Machine Interface for the Assistive Driving System. In Intelligent Information and Database Systems; Nguyen, N.T., Jearanaitanakij, K., Selamat, A., Trawiński, B., Chittayasothorn, S., Eds.; Springer International Publishing: Berlin/Heidelberg, Germany, 2020; Volume 12034, pp. 507–516. [Google Scholar] [CrossRef]
- Kitchenham, B.; Charters, S. Guidelines for Performing Systematic Literature Reviews in Software Engineering; Technical Report; Keele University: Keele, UK; Durham University: Durham, UK, 2007. [Google Scholar]
- García-Holgado, A.; Marcos-Pablos, S.; García-Peñalvo, F. Guidelines for Performing Systematic Research Projects Reviews. Int. J. Interact. Multimed. Artif. Intell. 2020, 6, 9. [Google Scholar] [CrossRef]
- Moher, D.; Liberati, A.; Tetzlaff, J.; Altman, D.G.; The PRISMA Group. Preferred Reporting Items for Systematic Reviews and Meta-Analyses: The PRISMA Statement. PLoS Med. 2009, 6, e1000097. [Google Scholar] [CrossRef] [PubMed] [Green Version]
- Da’u, A.; Salim, N. Recommendation System based on Deep Learning Methods: A Systematic Review and New Directions. Artif. Intell. Rev. 2020, 53, 2709–2748. [Google Scholar] [CrossRef]
- Genc-Nayebi, N.; Abran, A. A Systematic Literature Review: Opinion Mining Studies from Mobile App Store User Reviews. J. Syst. Softw. 2017, 125, 207–219. [Google Scholar] [CrossRef]
- Wohlin, C. Guidelines for Snowballing in Systematic Literature Studies and a Replication in Software Engineering. In Proceedings of the 18th International Conference on Evaluation and Assessment in Software Engineering–EASE ’14, London, UK, 13–14 May 2014; ACM Press: New York, NY, USA, 2014; pp. 1–10. [Google Scholar] [CrossRef]
- Helbich, M.; Hagenauer, J.; Leitner, M.; Edwards, R. Exploration of Unstructured Nrrative Crime Reports: An Unsupervised Neural Network and Point Pattern Analysis Approach. Cartogr. Geogr. Inf. Sci. 2013, 40, 326–336. [Google Scholar] [CrossRef] [Green Version]
- Tintarev, N.; Rostami, S.; Smyth, B. Knowing the unknown: Visualising consumption blind-spots in recommender systems. In Proceedings of the 33rd Annual ACM Symposium on Applied Computing (SAC’18), Pau, France, 9–13 April 2018; ACM: New York, NY, USA, 2018; pp. 1396–1399. [Google Scholar] [CrossRef] [Green Version]
- Galhotra, S.; Pradhan, R.; Salimi, B. Explaining Black-Box Algorithms Using Probabilistic Contrastive Counterfactuals. In Proceedings of the 2021 International Conference on Management of Data, Virtual Event, 20–25 June 2021; pp. 577–590. [Google Scholar] [CrossRef]
- La Gatta, V.; Moscato, V.; Postiglione, M.; Sperlì, G. CASTLE: Cluster-Aided Space Transformation for Local Explanations. Expert Syst. Appl. 2021, 179, 115045. [Google Scholar] [CrossRef]
- La Gatta, V.; Moscato, V.; Postiglione, M.; Sperlì, G. PASTLE: Pivot-Aided Space Transformation for Local Explanations. Pattern Recognit. Lett. 2021, 149, 67–74. [Google Scholar] [CrossRef]
- Moradi, M.; Samwald, M. Post-hoc Explanation of Black-box Classifiers using Confident Itemsets. Expert Syst. Appl. 2021, 165, 113941. [Google Scholar] [CrossRef]
- Hatwell, J.; Gaber, M.M.; Muhammad Atif Azad, R. Gbt-hips: Explaining the classifications of gradient boosted tree ensembles. Appl. Sci. 2021, 11, 2511. [Google Scholar] [CrossRef]
- Rubio-Manzano, C.; Segura-Navarrete, A.; Martinez-Araneda, C.; Vidal-Castro, C. Explainable hopfield neural networks using an automatic video-generation system. Appl. Sci. 2021, 11, 5771. [Google Scholar] [CrossRef]
- Alonso, J.M.; Toja-Alamancos, J.; Bugarin, A. Experimental Study on Generating Multi-modal Explanations of Black-box Classifiers in terms of Gray-box Classifiers. In Proceedings of the 2020 IEEE International Conference on Fuzzy Systems (FUZZ-IEEE), Glasgow, UK, 19–24 July 2020; pp. 1–8. [Google Scholar] [CrossRef]
- Biswas, R.; Barz, M.; Sonntag, D. Towards Explanatory Interactive Image Captioning Using Top-Down and Bottom-Up Features, Beam Search and Re-ranking. KI-Künstliche Intell. 2020, 34, 571–584. [Google Scholar] [CrossRef]
- Cao, H.; Sarlin, R.; Jung, A. Learning Explainable Decision Rules via Maximum Satisfiability. IEEE Access 2020, 8, 218180–218185. [Google Scholar] [CrossRef]
- Fernández, R.R.; Martín de Diego, I.; Aceña, V.; Fernández-Isabel, A.; Moguerza, J.M. Random Forest Explainability using Counterfactual Sets. Inf. Fusion 2020, 63, 196–207. [Google Scholar] [CrossRef]
- Holzinger, A.; Carrington, A.; Müller, H. Measuring the Quality of Explanations: The System Causability Scale (SCS). KI-Künstliche Intell. 2020, 34, 193–198. [Google Scholar] [CrossRef] [PubMed] [Green Version]
- Kovalev, M.S.; Utkin, L.V. A Robust Algorithm for Explaining Unreliable Machine Learning Survival Models using Kolmogorov–Smirnov Bounds. Neural Netw. 2020, 132, 1–18. [Google Scholar] [CrossRef] [PubMed]
- Le, T.; Wang, S.; Lee, D. GRACE: Generating Concise and Informative Contrastive Sample to Explain Neural Network Model’s Prediction. In Proceedings of the 26th ACM SIGKDD International Conference on Knowledge Discovery & Data Mining, Virtual Event, 23–27 August 2020; ACM: New York, NY, USA, 2020; pp. 238–248. [Google Scholar] [CrossRef]
- Lundberg, S.M.; Erion, G.; Chen, H.; DeGrave, A.; Prutkin, J.M.; Nair, B.; Katz, R.; Himmelfarb, J.; Bansal, N.; Lee, S.I. From Local Explanations to Global Understanding with Explanable AI for Trees. Nat. Mach. Intell. 2020, 2, 56–67. [Google Scholar] [CrossRef]
- Yang, Z.; Zhang, A.; Sudjianto, A. Enhancing Explainability of Neural Networks Through Architecture Constraints. IEEE Trans. Neural Netw. Learn. Syst. 2020, 6, 2610–2621. [Google Scholar] [CrossRef]
- Sabol, P.; Sinčák, P.; Magyar, J.; Hartono, P. Semantically Explainable Fuzzy Classifier. Int. J. Pattern Recognit. Artif. Intell. 2019, 33, 2051006. [Google Scholar] [CrossRef]
- Chander, A.; Srinivasan, R. Evaluating Explanations by Cognitive Value. In Machine Learning and Knowledge Extraction; Holzinger, A., Kieseberg, P., Tjoa, A.M., Weippl, E., Eds.; Springer International Publishing: Berlin/Heidelberg, Germany, 2018; pp. 314–328. [Google Scholar] [CrossRef]
- Laugel, T.; Lesot, M.J.; Marsala, C.; Renard, X.; Detyniecki, M. Comparison-Based Inverse Classification for Interpretability in Machine Learning. In Information Processing and Management of Uncertainty in Knowledge-Based Systems. Theory and Foundations; Medina, J., Ojeda-Aciego, M., Verdegay, J.L., Pelta, D.A., Cabrera, I.P., Bouchon-Meunier, B., Yager, R.R., Eds.; Springer International Publishing: Berlin/Heidelberg, Germany, 2018; Volume 853, pp. 100–111. [Google Scholar] [CrossRef] [Green Version]
- Pierrard, R.; Poli, J.P.; Hudelot, C. Learning Fuzzy Relations and Properties for Explainable Artificial Intelligence. In Proceedings of the 2018 IEEE International Conference on Fuzzy Systems (FUZZ-IEEE), Rio de Janeiro, Brazil, 8–13 July 2018; pp. 1–8. [Google Scholar] [CrossRef] [Green Version]
- Plumb, G.; Molitor, D.; Talwalkar, A. Model Agnostic Supervised Local Explanations. In Proceedings of the 32nd International Conference on Neural Information Processing Systems (NIPS ’18), Montreal, QC, Canada, 3–8 December 2018; pp. 2520–2529. [Google Scholar]
- Bonanno, D.; Nock, K.; Smith, L.; Elmore, P.; Petry, F. An Apporach to Explainable Deep Learning using Fuzzy Inference. In Next-Generation Analyst V; Hanratty, T.P., Llinas, J., Eds.; SPIE: Bellingham, WA, USA, 2017; Volume 10207. [Google Scholar] [CrossRef]
- Štrumbelj, E.; Kononenko, I. Explaining Prediction Models and Individual Predictions with Feature Contributions. Knowl. Inf. Syst. 2014, 41, 647–665. [Google Scholar] [CrossRef]
- Féraud, R.; Clérot, F. A Methodology to Explain Neural Network Classification. Neural Netw. 2002, 15, 237–246. [Google Scholar] [CrossRef]
- Chandrasekaran, J.; Lei, Y.; Kacker, R.; Richard Kuhn, D. A Combinatorial Approach to Explaining Image Classifiers. In Proceedings of the 2021 IEEE International Conference on Software Testing, Verification and Validation Workshops (ICSTW), Virtual Event, 12–16 April 2021; pp. 35–43. [Google Scholar] [CrossRef]
- Jung, Y.J.; Han, S.H.; Choi, H.J. Explaining CNN and RNN Using Selective Layer-Wise Relevance Propagation. IEEE Access 2021, 9, 18670–18681. [Google Scholar] [CrossRef]
- Yang, S.H.; Vong, W.; Sojitra, R.; Folke, T.; Shafto, P. Mitigating Belief Projection in Explainable Artificial Intelligence via Bayesian Teaching. Sci. Rep. 2021, 11, 9863. [Google Scholar] [CrossRef] [PubMed]
- Schorr, C.; Goodarzi, P.; Chen, F.; Dahmen, T. Neuroscope: An Explainable AI Toolbox for Semantic Segmentation and Image Classification of Convolutional Neural Nets. Appl. Sci. 2021, 11, 2199. [Google Scholar] [CrossRef]
- Angelov, P.; Soares, E. Towards Explainable Deep Neural Networks (xDNN). Neural Netw. 2020, 130, 185–194. [Google Scholar] [CrossRef] [PubMed]
- Apicella, A.; Isgrò, F.; Prevete, R.; Tamburrini, G. Middle-Level Features for the Explanation of Classification Systems by Sparse Dictionary Methods. Int. J. Neural Syst. 2020, 30, 2050040. [Google Scholar] [CrossRef] [PubMed]
- Dutta, V.; Zielińska, T. An Adversarial Explainable Artificial Intelligence (XAI) based Approach for Action Forecasting. J. Autom. Mob. Robot. Intell. Syst. 2020, 14, 3–10. [Google Scholar] [CrossRef]
- Murray, B.J.; Anderson, D.T.; Havens, T.C.; Wilkin, T.; Wilbik, A. Information Fusion-2-Text: Explainable Aggregation via Linguistic Protoforms. In Information Processing and Management of Uncertainty in Knowledge-Based Systems; Lesot, M.J., Vieira, S., Reformat, M.Z., Carvalho, J.P., Wilbik, A., Bouchon-Meunier, B., Yager, R.R., Eds.; Springer International Publishing: Berlin/Heidelberg, Germany, 2020; Volume 1239, pp. 114–127. [Google Scholar] [CrossRef]
- Oh, K.; Kim, S.; Oh, I.S. Salient Explanation for Fine-Grained Classification. IEEE Access 2020, 8, 61433–61441. [Google Scholar] [CrossRef]
- Poyiadzi, R.; Sokol, K.; Santos-Rodriguez, R.; De Bie, T.; Flach, P. FACE: Feasible and Actionable Counterfactual Explanations. In Proceedings of the AAAI/ACM Conference on AI, Ethics, and Society, New York, NY, USA, 7–8 February 2020; ACM: New York, NY, USA, 2020; pp. 344–350. [Google Scholar] [CrossRef] [Green Version]
- Riquelme, F.; De Goyeneche, A.; Zhang, Y.; Niebles, J.C.; Soto, A. Explaining VQA Predictions using Visual Grounding and a Knowledge Base. Image Vis. Comput. 2020, 101, 103968. [Google Scholar] [CrossRef]
- Selvaraju, R.R.; Cogswell, M.; Das, A.; Vedantam, R.; Parikh, D.; Batra, D. Grad-CAM: Visual Explanations from Deep Networks via Gradient-Based Localization. Int. J. Comput. Vis. 2020, 128, 336–359. [Google Scholar] [CrossRef] [Green Version]
- Tan, R.; Khan, N.; Guan, L. Locality Guided Neural Networks for Explainable Artificial Intelligence. In Proceedings of the 2020 International Joint Conference on Neural Networks (IJCNN), Glasgow, UK, 19–24 July 2020; pp. 1–8. [Google Scholar] [CrossRef]
- Yeganejou, M.; Dick, S.; Miller, J. Interpretable Deep Convolutional Fuzzy Classifier. IEEE Trans. Fuzzy Syst. 2020, 28, 1407–1419. [Google Scholar] [CrossRef]
- Oramas M., J.; Wang, K.; Tuytelaars, T. Visual Explanation by Interpretation: Improving Visual Feedback Capabilities of Deep Neural Networks. In Proceedings of the International Conference on Learning Representations (ICLR 2019), New Orleans, LA, USA, 6–9 May 2019. [Google Scholar]
- Lundberg, S.M.; Lee, S.I. A Unified Approach to Interpreting Model Predictions. In Proceedings of the 31st International Conference on Neural Information Processing Systems (NIPS’17), Long Beach, CA, USA, 4–9 December 2017; pp. 4766–4775. [Google Scholar]
- Montavon, G.; Lapuschkin, S.; Binder, A.; Samek, W.; Müller, K.R. Explaining Nonlinear Classification Decisions with Deep Taylor Decomposition. Pattern Recognit. 2017, 65, 211–222. [Google Scholar] [CrossRef]
- Hendricks, L.A.; Akata, Z.; Rohrbach, M.; Donahue, J.; Schiele, B.; Darrell, T. Generating Visual Explanations. In Computer Vision–ECCV 2016; Leibe, B., Matas, J., Sebe, N., Welling, M., Eds.; Lecture Notes in Computer Science; Springer International Publishing: Cham, Switzerland, 2016; Volume 9908, pp. 3–19. [Google Scholar] [CrossRef] [Green Version]
- Bach, S.; Binder, A.; Montavon, G.; Klauschen, F.; Müller, K.R.; Samek, W. On Pixel-Wise Explanations for Non-Linear Classifier Decisions by Layer-Wise Relevance Propagation. PLoS ONE 2015, 10, e0130140. [Google Scholar] [CrossRef] [PubMed] [Green Version]
- Alonso, J.M.; Ducange, P.; Pecori, R.; Vilas, R. Building Explanations for Fuzzy Decision Trees with the ExpliClas Software. In Proceedings of the 2020 IEEE International Conference on Fuzzy Systems (FUZZ-IEEE), Glasgow, UK, 19–24 July 2020; pp. 1–8. [Google Scholar] [CrossRef]
- De, T.; Giri, P.; Mevawala, A.; Nemani, R.; Deo, A. Explainable AI: A Hybrid Approach to Generate Human-Interpretable Explanation for Deep Learning Prediction. Procedia Comput. Sci. 2020, 168, 40–48. [Google Scholar] [CrossRef]
- Islam, M.A.; Anderson, D.T.; Pinar, A.; Havens, T.C.; Scott, G.; Keller, J.M. Enabling Explainable Fusion in Deep Learning with Fuzzy Integral Neural Networks. IEEE Trans. Fuzzy Syst. 2020, 28, 1291–1300. [Google Scholar] [CrossRef] [Green Version]
- Meskauskas, Z.; Jasinevicius, R.; Kazanavicius, E.; Petrauskas, V. XAI-Based Fuzzy SWOT Maps for Analysis of Complex Systems. In Proceedings of the 2020 IEEE International Conference on Fuzzy Systems (FUZZ-IEEE), Glasgow, UK, 19–24 July 2020; pp. 1–8. [Google Scholar] [CrossRef]
- Waa, J.V.D.; Schoonderwoerd, T.; Diggelen, J.V.; Neerincx, M. Interpretable Confidence Measures for Decision Support Systems. Int. J. Hum.-Comput. Stud. 2020, 144, 102493. [Google Scholar] [CrossRef]
- Garcia-Magarino, I.; Muttukrishnan, R.; Lloret, J. Human-Centric AI for Trustworthy IoT Systems With Explainable Multilayer Perceptrons. IEEE Access 2019, 7, 125562–125574. [Google Scholar] [CrossRef]
- Ming, Y.; Qu, H.; Bertini, E. RuleMatrix: Visualizing and Understanding Classifiers with Rules. IEEE Trans. Vis. Comput. Graph. 2019, 25, 342–352. [Google Scholar] [CrossRef] [Green Version]
- Magdalena, L. Designing Interpretable Hierarchical Fuzzy Systems. In Proceedings of the 2018 IEEE International Conference on Fuzzy Systems (FUZZ-IEEE), Rio de Janeiro, Brazil, 8–13 July 2018; pp. 1–8. [Google Scholar] [CrossRef]
- Ribeiro, M.T.; Singh, S.; Guestrin, C. Anchors: High-precision Model-agnostic Explanations. In Proceedings of the 32nd AAAI Conference on Artificial Intelligence, (AAAI-18), New Orleans, LA, USA, 2–7 February 2018; pp. 1527–1535. [Google Scholar]
- Massie, S.; Craw, S.; Wiratunga, N. A Visualisation Tool to Explain Case-Base Reasoning Solutions for Tablet Formulation. In Applications and Innovations in Intelligent Systems XII; Springer: London, UK, 2004; pp. 222–234. [Google Scholar] [CrossRef]
- Csiszár, O.; Csiszár, G.; Dombi, J. Interpretable Neural Networks based on Continuous-valued Logic and Multicriteria Decision Operators. Knowl.-Based Syst. 2020, 199, 105972. [Google Scholar] [CrossRef]
- Jung, A.; Nardelli, P.H.J. An Information-Theoretic Approach to Personalized Explainable Machine Learning. IEEE Signal Process. Lett. 2020, 27, 825–829. [Google Scholar] [CrossRef]
- Kouki, P.; Schaffer, J.; Pujara, J.; O’Donovan, J.; Getoor, L. Generating and Understanding Personalized Explanations in Hybrid Recommender Systems. ACM Trans. Interact. Intell. Syst. 2020, 10, 1–40. [Google Scholar] [CrossRef]
- Bharadhwaj, H.; Joshi, S. Explanations for Temporal Recommendations. KI-Künstliche Intell. 2018, 32, 267–272. [Google Scholar] [CrossRef] [Green Version]
- Loyola-González, O.; Gutierrez-Rodriguez, A.E.; Medina-Perez, M.A.; Monroy, R.; Martinez-Trinidad, J.F.; Carrasco-Ochoa, J.A.; Garcia-Borroto, M. An Explainable Artificial Intelligence Model for Clustering Numerical Databases. IEEE Access 2020, 8, 52370–52384. [Google Scholar] [CrossRef]
- Dujmovic, J. Interpretability and Explainability of LSP Evaluation Criteria. In Proceedings of the 2020 IEEE International Conference on Fuzzy Systems (FUZZ-IEEE), Glasgow, UK, 19–24 July 2020; pp. 1–8. [Google Scholar] [CrossRef]
- Ramos-Soto, A.; Pereira-Fariña, M. Reinterpreting Interpretability for Fuzzy Linguistic Descriptions of Data. In Information Processing and Management of Uncertainty in Knowledge-Based Systems. Theory and Foundations.; Medina, J., Ojeda-Aciego, M., Verdegay, J.L., Pelta, D.A., Cabrera, I.P., Bouchon-Meunier, B., Yager, R.R., Eds.; Springer: Cham, Switzerland, 2018; Volume 853, pp. 40–51. [Google Scholar] [CrossRef] [Green Version]
- Shalaeva, V.; Alkhoury, S.; Marinescu, J.; Amblard, C.; Bisson, G. Multi-operator Decision Trees for Explainable Time-Series Classification. In Information Processing and Management of Uncertainty in Knowledge-Based Systems. Theory and Foundations; Medina, J., Ojeda-Aciego, M., Verdegay, J.L., Pelta, D.A., Cabrera, I.P., Bouchon-Meunier, B., Yager, R.R., Eds.; Springer: Cham, Switzerland, 2018; Volume 853, pp. 86–99. [Google Scholar] [CrossRef]
- Karlsson, I.; Rebane, J.; Papapetrou, P.; Gionis, A. Locally and Globally Explainable Time Series Tweaking. Knowl. Inf. Syst. 2020, 62, 1671–1700. [Google Scholar] [CrossRef] [Green Version]
- Hu, Z.; Beyeler, M. Explainable AI for Retinal Prostheses: Predicting Electrode Deactivation from Routine Clinical Measures. In Proceedings of the 10th International IEEE EMBS Conference on Neural Engineering (NER ’21), Virtual Event, 4–6 May 2021; pp. 792–796. [Google Scholar] [CrossRef]
- Porto, R.; Molina, J.M.; Berlanga, A.; Patricio, M.A. Minimum relevant features to obtain explainable systems for predicting cardiovascular disease using the statlog data set. Appl. Sci. 2021, 11, 1285. [Google Scholar] [CrossRef]
- Brunese, L.; Mercaldo, F.; Reginelli, A.; Santone, A. Explainable Deep Learning for Pulmonary Disease and Coronavirus COVID-19 Detection from X-rays. Comput. Methods Programs Biomed. 2020, 196, 105608. [Google Scholar] [CrossRef] [PubMed]
- Chou, Y.h.; Hong, S.; Zhou, Y.; Shang, J.; Song, M.; Li, H. Knowledge-shot Learning: An Interpretable Deep Model For Classifying Imbalanced Electrocardiography Data. Neurocomputing 2020, 417, 64–73. [Google Scholar] [CrossRef]
- Dindorf, C.; Teufl, W.; Taetz, B.; Bleser, G.; Fröhlich, M. Interpretability of Input Representations for Gait Classification in Patients after Total Hip Arthroplasty. Sensors 2020, 20, 4385. [Google Scholar] [CrossRef]
- Hatwell, J.; Gaber, M.M.; Atif Azad, R.M. Ada-WHIPS: Explaining AdaBoost Classification with Applications in the Health Sciences. BMC Med. Inform. Decis. Mak. 2020, 20, 250. [Google Scholar] [CrossRef] [PubMed]
- Lamy, J.B.; Sedki, K.; Tsopra, R. Explainable Decision Support through the Learning and Visualization of Preferences from a Formal Ontology of Antibiotic Treatments. J. Biomed. Inform. 2020, 104, 103407. [Google Scholar] [CrossRef]
- Lin, Z.; Lyu, S.; Cao, H.; Xu, F.; Wei, Y.; Hui, P.; Samet, H.; Li, Y. HealthWalks: Sensing Fine-grained Individual Health Condition via Mobility Data. Proc. ACM Interact. Mob. Wearable Ubiquitous Technol. 2020, 4, 26. [Google Scholar] [CrossRef]
- Panigutti, C.; Perotti, A.; Pedreschi, D. Doctor XAI An Ontology-based Approach to Black-box Sequential Data Classification Explanations. In Proceedings of the 2020 Conference on Fairness, Accountability, and Transparency (FAT* 2020), Barcelona, Spain, 27–30 January 2020; pp. 629–639. [Google Scholar] [CrossRef]
- Soares, E.; Angelov, P.; Gu, X. Autonomous Learning Multiple-Model Zero-order Classifier for Heart Sound Classification. Appl. Soft Comput. J. 2020, 94, 106449. [Google Scholar] [CrossRef]
- Tabik, S.; Gomez-Rios, A.; Martin-Rodriguez, J.; Sevillano-Garcia, I.; Rey-Area, M.; Charte, D.; Guirado, E.; Suarez, J.; Luengo, J.; Valero-Gonzalez, M.; et al. COVIDGR Dataset and COVID-SDNet Methodology for Predicting COVID-19 Based on Chest X-Ray Images. IEEE J. Biomed. Health Inform. 2020, 24, 3595–3605. [Google Scholar] [CrossRef] [PubMed]
- Aghamohammadi, M.; Madan, M.; Hong, J.K.; Watson, I. Predicting Heart Attack Through Explainable Artificial Intelligence. In Computational Science–ICCS 2019; Rodrigues, J.M.F., Cardoso, P.J.S., Monteiro, J., Lam, R., Krzhizhanovskaya, V.V., Lees, M.H., Dongarra, J.J., Sloot, P.M., Eds.; Springer International Publishing: Berlin/Heidelberg, Germany, 2019; Volume 11537, pp. 633–645. [Google Scholar] [CrossRef]
- Palatnik de Sousa, I.; Maria Bernardes Rebuzzi Vellasco, M.; Costa da Silva, E. Local Interpretable Model-Agnostic Explanations for Classification of Lymph Node Metastases. Sensors 2019, 19, 2969. [Google Scholar] [CrossRef] [PubMed] [Green Version]
- Kwon, B.C.; Choi, M.J.; Kim, J.T.; Choi, E.; Kim, Y.B.; Kwon, S.; Sun, J.; Choo, J. RetainVis: Visual Analytics with Interpretable and Interactive Recurrent Neural Networks on Electronic Medical Records. IEEE Trans. Vis. Comput. Graph. 2019, 25, 299–309. [Google Scholar] [CrossRef] [PubMed] [Green Version]
- Lamy, J.B.; Sekar, B.; Guezennec, G.; Bouaud, J.; Séroussi, B. Explainable Artificial Intelligence for Breast Cancer: A Visual Case-Based Reasoning Approach. Artif. Intell. Med. 2019, 94, 42–53. [Google Scholar] [CrossRef] [PubMed]
- Senatore, R.; Della Cioppa, A.; Marcelli, A. Automatic Diagnosis of Neurodegenerative Diseases: An Evolutionary Approach for Facing the Interpretability Problem. Information 2019, 10, 30. [Google Scholar] [CrossRef] [Green Version]
- Wang, D.; Yang, Q.; Abdul, A.; Lim, B.Y. Designing Theory-Driven User-Centric Explainable AI. In Proceedings of the 2019 CHI Conference on Human Factors in Computing Systems (CHI 2019), Glasgow, UK, 4–9 May 2019; ACM Press: New York, NY, USA, 2019; pp. 1–15. [Google Scholar] [CrossRef]
- Zheng, Q.; Delingette, H.; Ayache, N. Explainable Cardiac Pathology Classification on Cine MRI with Motion Characterization by Semi-supervised Learning of Apparent Flow. Med. Image Anal. 2019, 56, 80–95. [Google Scholar] [CrossRef] [Green Version]
- Lage, I.; Chen, E.; He, J.; Narayanan, M.; Kim, B.; Gershman, S.J.; Doshi-Velez, F. An Evaluation of the Human-Interpretability of Explanation. In Proceedings of the 32st International Conference on Neural Information Processing Systems (NIPS’18), Montreal, QC, Canada, 3–8 December 2018. [Google Scholar]
- Letham, B.; Rudin, C.; McCormick, T.H.; Madigan, D. Interpretable Classifiers using Rules and Bayesian Analysis: Building a Better Stroke Prediction Model. Ann. Appl. Stat. 2015, 9, 1350–1371. [Google Scholar] [CrossRef]
- Lindsay, L.; Coleman, S.; Kerr, D.; Taylor, B.; Moorhead, A. Explainable Artificial Intelligence for Falls Prediction. In Advances in Computing and Data Sciences; Communications in Computer and Information Science; Singh, M., Gupta, P.K., Tyagi, V., Flusser, J., Ören, T., Valentino, G., Eds.; Springer: Singapore, 2020; Volume 1244, pp. 76–84. [Google Scholar] [CrossRef]
- Pintelas, E.; Liaskos, M.; Livieris, I.E.; Kotsiantis, S.; Pintelas, P. Explainable Machine Learning Framework for Image Classification Problems: Case Study on Glioma Cancer Prediction. J. Imaging 2020, 6, 37. [Google Scholar] [CrossRef]
- Prifti, E.; Chevaleyre, Y.; Hanczar, B.; Belda, E.; Danchin, A.; Clément, K.; Zucker, J.D. Interpretable and Accurate Prediction Models for Metagenomics Data. GigaScience 2020, 9, giaa010. [Google Scholar] [CrossRef] [Green Version]
- Lundberg, S.M.; Nair, B.; Vavilala, M.S.; Horibe, M.; Eisses, M.J.; Adams, T.; Liston, D.E.; Low, D.K.W.; Newman, S.F.; Kim, J.; et al. Explainable Machine Learning Predictions to Help Anesthesiologists Prevent Hypoxemia During Surgery. Nat. Biomed. Eng. 2018, 2, 749–760. [Google Scholar] [CrossRef]
- Muddamsetty, S.; Jahromi, M.; Moeslund, T. Expert Level Evaluations for Explainable AI (XAI) Methods in the Medical Domain. In Proceedings of the 25th International Conference on Pattern Recognition Workshops (ICPR 2020), Virtual Event, 10–15 January 2021; Springer Science and Business Media Deutschland GmbH: Berlin/Heidelberg, Germany, 2021; Volume 12663. [Google Scholar] [CrossRef]
- Graziani, M.; Andrearczyk, V.; S., M.M.; Müller, H. Concept Attribution: Explaining CNN Decisions to Physicians. Comput. Biol. Med. 2020, 123, 103865. [Google Scholar] [CrossRef]
- Rio-Torto, I.; Fernandes, K.; Teixeira, L.F. Understanding the Decisions of CNNs: An In-model Approach. Pattern Recognit. Lett. 2020, 133, 373–380. [Google Scholar] [CrossRef]
- D’Alterio, P.; Garibaldi, J.M.; John, R.I. Constrained Interval Type-2 Fuzzy Classification Systems for Explainable AI (XAI). In Proceedings of the 2020 IEEE International Conference on Fuzzy Systems (FUZZ-IEEE), Glasgow, UK, 19–24 July 2020; pp. 1–8. [Google Scholar] [CrossRef]
- Lauritsen, S.M.; Kristensen, M.; Olsen, M.V.; Larsen, M.S.; Lauritsen, K.M.; Jørgensen, M.J.; Lange, J.; Thiesson, B. Explainable Artificial Intelligence Model to Predict Acute Critical Illness from Electronic Health Records. Nat. Commun. 2020, 11, 3852. [Google Scholar] [CrossRef] [PubMed]
- Itani, S.; Lecron, F.; Fortemps, P. A One-class Classification Decision Tree based on Kernel Density Estimation. Appl. Soft Comput. J. 2020, 91, 106250. [Google Scholar] [CrossRef] [Green Version]
- Chen, H.Y.; Lee, C.H. Vibration Signals Analysis by Explainable Artificial Intelligence (XAI) Approach: Application on Bearing Faults Diagnosis. IEEE Access 2020, 8, 134246–134256. [Google Scholar] [CrossRef]
- Hong, C.; Lee, C.; Lee, K.; Ko, M.S.; Kim, D.; Hur, K. Remaining Useful Life Prognosis for Turbofan Engine Using Explainable Deep Neural Networks with Dimensionality Reduction. Sensors 2020, 20, 6626. [Google Scholar] [CrossRef]
- Serradilla, O.; Zugasti, E.; Cernuda, C.; Aranburu, A.; de Okariz, J.R.; Zurutuza, U. Interpreting Remaining Useful Life Estimations Combining Explainable Artificial Intelligence and Domain Knowledge in Industrial Machinery. In Proceedings of the 2020 IEEE International Conference on Fuzzy Systems (FUZZ-IEEE), Glasgow, UK, 19–24 July 2020; pp. 1–8. [Google Scholar] [CrossRef]
- Sun, K.H.; Huh, H.; Tama, B.A.; Lee, S.Y.; Jung, J.H.; Lee, S. Vision-Based Fault Diagnostics Using Explainable Deep Learning With Class Activation Maps. IEEE Access 2020, 8, 129169–129179. [Google Scholar] [CrossRef]
- Assaf, R.; Schumann, A. Explainable Deep Neural Networks for Multivariate Time Series Predictions. In Proceedings of the Twenty-Eighth International Joint Conference on Artificial Intelligence (IJCAI 2019), Macao, 10–16 August 2019; Number 2. pp. 6488–6490. [Google Scholar] [CrossRef] [Green Version]
- Sarp, S.; Knzlu, M.; Cali, U.; Elma, O.; Guler, O. An Interpretable Solar Photovoltaic Power Generation Forecasting Approach using an Explainable Artificial Intelligence Tool. In Proceedings of the 2021 IEEE Power & Energy Society Innovative Smart Grid Technologies Conference (ISGT), Virtual Event, 15–17 September 2021. [Google Scholar] [CrossRef]
- Zhang, K.; Zhang, J.; Xu, P.; Gao, T.; Gao, D. Explainable AI in Deep Reinforcement Learning Models for Power System Emergency Control. IEEE Trans. Comput. Soc. Syst. 2021, 1–9. [Google Scholar] [CrossRef]
- Rehse, J.R.; Mehdiyev, N.; Fettke, P. Towards Explainable Process Predictions for Industry 4.0 in the DFKI-Smart-Lego-Factory. KI-Künstliche Intell. 2019, 33, 181–187. [Google Scholar] [CrossRef]
- Carletti, M.; Masiero, C.; Beghi, A.; Susto, G.A. Explainable Machine Learning in Industry 4.0: Evaluating Feature Importance in Anomaly Detection to Enable Root Cause Analysis. In Proceedings of the 2019 IEEE International Conference on Systems, Man and Cybernetics (SMC), Bari, Italy, 6–9 October 2019; pp. 21–26. [Google Scholar] [CrossRef]
- Schönhof, R.; Werner, A.; Elstner, J.; Zopcsak, B.; Awad, R.; Huber, M. Feature Visualization within an Automated Design Assessment Leveraging Explainable Artificial Intelligence Methods. In Procedia CIRP; Elsevier B.V.: Amsterdam, The Netherlands, 2021; Volume 100, pp. 331–336. [Google Scholar] [CrossRef]
- Lorente, M.P.S.; Lopez, E.M.; Florez, L.A.; Espino, A.L.; Martínez, J.A.I.; de Miguel, A.S. Explaining deep learning-based driver models. Appl. Sci. 2021, 11, 3321. [Google Scholar] [CrossRef]
- Li, Y.; Wang, H.; Dang, L.; Nguyen, T.; Han, D.; Lee, A.; Jang, I.; Moon, H. A Deep Learning-based Hybrid Framework for Object Detection and Recognition in Autonomous Driving. IEEE Access 2020, 8, 194228–194239. [Google Scholar] [CrossRef]
- Martinez-Cebrian, J.; Fernandez-Torres, M.A.; Diaz-De-Maria, F. Interpretable Global-Local Dynamics for the Prediction of Eye Fixations in Autonomous Driving Scenarios. IEEE Access 2020, 8, 217068–217085. [Google Scholar] [CrossRef]
- Ponn, T.; Kröger, T.; Diermeyer, F. Identification and Explanation of Challenging Conditions for Camera-Based Object Detection of Automated Vehicles. Sensors 2020, 20, 3699. [Google Scholar] [CrossRef] [PubMed]
- Nowak, T.; Nowicki, M.R.; Cwian, K.; Skrzypczynski, P. How to Improve Object Detection in a Driver Assistance System Applying Explainable Deep Learning. In Proceedings of the 30th IEEE Intelligent Vehicles Symposium (IV19), Paris, France, 9–12 June 2019; pp. 226–231. [Google Scholar] [CrossRef]
- Kim, J.; Canny, J. Interpretable Learning for Self-Driving Cars by Visualizing Causal Attention. In Proceedings of the 2017 IEEE International Conference on Computer Vision (ICCV), Venice, Italy, 22–29 October 2017; pp. 2961–2969. [Google Scholar] [CrossRef] [Green Version]
- Amparore, E.; Perotti, A.; Bajardi, P. To trust or not to trust an explanation: Using LEAF to evaluate local linear XAI methods. PeerJ Comput. Sci. 2021, 7, 1–26. [Google Scholar] [CrossRef] [PubMed]
- van der Waa, J.; Nieuwburg, E.; Cremers, A.; Neerincx, M. Evaluating XAI: A comparison of rule-based and example-based explanations. Artif. Intell. 2021, 291, 03404. [Google Scholar] [CrossRef]
- Sokol, K.; Flach, P. Explainability Fact Sheets: A Framework for Systematic Assessment of Explainable Approaches. In Proceedings of the 2020 Conference on Fairness, Accountability, and Transparency (FAT* 2020), Barcelona, Spain, 27–30 January 2020; ACM: New York, NY, USA, 2020; pp. 56–67. [Google Scholar] [CrossRef] [Green Version]
- Weber, R.O.; Johs, A.J.; Li, J.; Huang, K. Investigating Textual Case-Based XAI. In Case-Based Reasoning Research and Development; Cox, M.T., Funk, P., Begum, S., Eds.; Springer International Publishing: Berlin/Heidelberg, Germany, 2018; Volume 11156, pp. 431–447. [Google Scholar] [CrossRef]
- Rutkowski, T.; Łapa, K.; Nielek, R. On Explainable Fuzzy Recommenders and their Performance Evaluation. Int. J. Appl. Math. Comput. Sci. 2019, 29, 595–610. [Google Scholar] [CrossRef] [Green Version]
- Wang, X.; Wang, D.; Xu, C.; He, X.; Cao, Y.; Chua, T.S. Explainable Reasoning over Knowledge Graphs for Recommendation. In Proceedings of the AAAI Conference on Artificial Intelligence, (AAAI-19), Honolulu, HI, USA, 27 January–1 February 2019; Volume 33, pp. 5329–5336. [Google Scholar] [CrossRef] [Green Version]
- Zhao, G.; Fu, H.; Song, R.; Sakai, T.; Chen, Z.; Xie, X.; Qian, X. Personalized Reason Generation for Explainable Song Recommendation. ACM Trans. Intell. Syst. Technol. 2019, 10, 1–21. [Google Scholar] [CrossRef]
- Han, M.; Kim, J. Joint Banknote Recognition and Counterfeit Detection Using Explainable Artificial Intelligence. Sensors 2019, 19, 3607. [Google Scholar] [CrossRef] [Green Version]
- Chen, J.H.; Chen, S.Y.C.; Tsai, Y.C.; Shur, C.S. Explainable Deep Convolutional Candlestick Learner. In Proceedings of the Thirty Second International Conference on Software Engineering and Knowledge Engineering (SEKE 2020), Pittsburgh, PA, USA, 9–11 July 2020; Volume PartF16244, pp. 234–237. [Google Scholar]
- He, X.; Chen, T.; Kan, M.Y.; Chen, X. TriRank: Review-aware Explainable Recommendation by Modeling Aspects. In Proceedings of the 24th ACM International Conference on Information and Knowledge Management (CIKM ’15), Melbourne, Australia, 18–23 October 2015; ACM Press: New York, NY, USA, 2015; pp. 1661–1670. [Google Scholar] [CrossRef]
- Loyola-González, O. Understanding the Criminal Behavior in Mexico City through an Explainable Artificial Intelligence Model. In Advances in Soft Computing; Martínez-Villaseñor, L., Batyrshin, I., Marín-Hernández, A., Eds.; Springer: Cham, Switzerland, 2019; Volume 11835, pp. 136–149. [Google Scholar] [CrossRef]
- Zhong, Q.; Fan, X.; Luo, X.; Toni, F. An Explainable Multi-attribute Decision Model based on Argumentation. Expert Syst. Appl. 2019, 117, 42–61. [Google Scholar] [CrossRef] [Green Version]
- Vlek, C.S.; Prakken, H.; Renooij, S.; Verheij, B. A Method for Explaining Bayesian Networks for Legal Evidence with Scenarios. Artif. Intell. Law 2016, 24, 285–324. [Google Scholar] [CrossRef] [Green Version]
- Bonidia, R.; MacHida, J.; Negri, T.; Alves, W.; Kashiwabara, A.; Domingues, D.; De Carvalho, A.; Paschoal, A.; Sanches, D. A Novel Decomposing Model with Evolutionary Algorithms for Feature Selection in Long Non-coding RNAs. IEEE Access 2020, 8, 181683–181697. [Google Scholar] [CrossRef]
- Huang, L.C.; Yeung, W.; Wang, Y.; Cheng, H.; Venkat, A.; Li, S.; Ma, P.; Rasheed, K.; Kannan, N. Quantitative Structure–Mutation–Activity Relationship Tests (QSMART) Model for Protein Kinase Inhibitor Response Prediction. BMC Bioinform. 2020, 21, 520. [Google Scholar] [CrossRef] [PubMed]
- Anguita-Ruiz, A.; Segura-Delgado, A.; Alcalá, R.; Aguilera, C.M.; Alcalá-Fdez, J. eXplainable Artificial Intelligence (XAI) for the Identification of Biologically Relevant Gene Expression Patterns in Longitudinal Human Studies, Insights from Obesity Research. PLoS Comput. Biol. 2020, 16, e1007792. [Google Scholar] [CrossRef] [PubMed]
- Keneni, B.M.; Kaur, D.; Al Bataineh, A.; Devabhaktuni, V.K.; Javaid, A.Y.; Zaientz, J.D.; Marinier, R.P. Evolving Rule-Based Explainable Artificial Intelligence for Unmanned Aerial Vehicles. IEEE Access 2019, 7, 17001–17016. [Google Scholar] [CrossRef]
- Ten Zeldam, S.; De Jong, A.; Loendersloot, R.; Tinga, T.; ten Zeldam, S.; de Jong, A.; Loendersloot, R.; Tinga, T. Automated Failure Diagnosis in Aviation Maintenance Using Explainable Artificial Intelligence (XAI). In Proceedings of the 4th European Conference of the PHM Society (PHME 2018), Utrecht, The Netherlands, 3–6 July 2018; pp. 1–11. [Google Scholar]
- Eisenstadt, V.; Espinoza-Stapelfeld, C.; Mikyas, A.; Althoff, K.D. Explainable Distributed Case-Based Support Systems: Patterns for Enhancement and Validation of Design Recommendations. In Case-Based Reasoning Research and Development; Cox, M.T., Funk, P., Begum, S., Eds.; Springer International Publishing: Berlin/Heidelberg, Germany, 2018; Volume 11156, pp. 78–94. [Google Scholar] [CrossRef]
- Anysz, H.; Brzozowski, Ł.; Kretowicz, W.; Narloch, P. Feature Importance of Stabilised Rammed Earth Components Affecting the Compressive Strength Calculated with Explainable Artificial Intelligence Tools. Materials 2020, 13, 2317. [Google Scholar] [CrossRef]
- Díaz-Rodríguez, N.; Pisoni, G. Accessible Cultural Heritage through Explainable Artificial Intelligence. In Proceedings of the 28th ACM Conference on User Modeling, Adaptation and Personalization (UMAP 2020), Genoa, Italy, 12-18 July 2020; ACM: New York, NY, USA, 2020; pp. 317–324. [Google Scholar] [CrossRef]
- Van Lent, M.; Fisher, W.; Mancuso, M. An Explainable Artificial Intelligence System for Small-unit Tactical Behavior. In Proceedings of the National Conference on Artificial Intelligence, San Jose, CA, USA, 25–29 July 2004; pp. 900–907. [Google Scholar]
- Segura, V.; Brandão, B.; Fucs, A.; Vital Brazil, E. Towards Explainable AI Using Similarity: An Analogues Visualization System. In Design, User Experience, and Usability. User Experience in Advanced Technological Environments; Marcus, A., Wang, W., Eds.; Springer Nature Switzerland: Orlando, FL, USA, 2019; pp. 389–399. [Google Scholar] [CrossRef]
- Callegari, C.; Ducange, P.; Fazzolari, M.; Vecchio, M. Explainable internet traffic classification. Appl. Sci. 2021, 11, 4697. [Google Scholar] [CrossRef]
- Sarathy, N.; Alsawwaf, M.; Chaczko, Z. Investigation of an Innovative Approach for Identifying Human Face-Profile Using Explainable Artificial Intelligence. In Proceedings of the 18th IEEE International Symposium on Intelligent Systems and Informatics (SISY 2020), Subotica, Serbia, 17–19 September 2020; IEEE: Subotica, Serbia, 2020; pp. 155–160. [Google Scholar] [CrossRef]
- Ferreyra, E.; Hagras, H.; Kern, M.; Owusu, G. Depicting Decision-Making: A Type-2 Fuzzy Logic Based Explainable Artificial Intelligence System for Goal-Driven Simulation in the Workforce Allocation Domain. In Proceedings of the 2019 IEEE International Conference on Fuzzy Systems (FUZZ-IEEE), New Orleans, LA, USA, 23-26 June 2019; pp. 1–6. [Google Scholar] [CrossRef]
- Kovalev, M.S.; Utkin, L.V.; Kasimov, E.M. SurvLIME: A Method for Explaining Machine Learning Survival Models. Knowl.-Based Syst. 2020, 203, 106164. [Google Scholar] [CrossRef]
- Albaum, G. The Likert Scale Revisited. Mark. Res. Soc J. 1997, 39, 1–21. [Google Scholar] [CrossRef]
- Samek, W.; Binder, A.; Montavon, G.; Lapuschkin, S.; Müller, K.R. Evaluating the Visualization of What a Deep Neural Network Has Learned. IEEE Trans. Neural Netw. Learn. Syst. 2017, 28, 2660–2673. [Google Scholar] [CrossRef] [Green Version]
- Spinner, T.; Schlegel, U.; Schafer, H.; El-Assady, M. explAIner: A Visual Analytics Framework for Interactive and Explainable Machine Learning. IEEE Trans. Vis. Comput. Graph. 2019, 26, 1064–1074. [Google Scholar] [CrossRef] [Green Version]
- Forestiero, A. Metaheuristic Algorithm for Anomaly Detection in Internet of Things leveraging on a Neural-driven Multiagent System. Knowl.-Based Syst. 2021, 228, 107241. [Google Scholar] [CrossRef]
- Forestiero, A.; Mastroianni, C.; Spezzano, G. Reorganization and Discovery of Grid Information with Epidemic Tuning. Future Gener. Comput. Syst. 2008, 24, 788–797. [Google Scholar] [CrossRef]
- Forestiero, A.; Papuzzo, G. Agents-Based Algorithm for a Distributed Information System in Internet of Things. IEEE Internet Things J. 2021, 8, 16548–16558. [Google Scholar] [CrossRef]


| Inclusion Criteria | Exclusion Criteria |
|---|---|
| Describing the methods of XAI | Describing the methods in different contexts than AI |
| Peer reviewed | Describing the concept/philosophy of XAI |
| Published in conferences/journals | Preprints and duplicates |
| Published from 2018 to June 2021 | Published in workshops |
| Written in English | Technical reports |
| Perspective | Quality Questions |
|---|---|
| Design | Are the aims clearly stated? |
| If the study involves assessing a methodology, is the methodology clearly defined? | |
| Are the measures used in the study fully defined? | |
| Conduct | Was outcome assessment blind to treatment group? |
| If two methodologies are being compared, were they treated similarly within the study? | |
| Analysis | Do the researchers explain the form of data (numbers, images, etc.)? |
| Do the numbers add up across different tables and methodologies? | |
| Conclusion | Are all study questions answered? |
| How do results compare with previous reports? | |
| Do the researchers explain the consequences of any problems with the validity of their measures? |
| Viewpoint | Feature | Description |
|---|---|---|
| Metadata | Source | Name of the conference/journal where the article was published. |
| Keywords | Prominent words from the abstract and keywords sections that represents the concept of the article. | |
| Domain | The targeted domain for which the study was performed. | |
| Application | Specific application that was developed or enhanced. | |
| Primary task | Data | The form of data that was used to develop a model, e.g., images, texts. |
| Model | AI/ML model that was used for performing the primary task of classification/regression. | |
| Performance | The performance of the models for the defined tasks. | |
| Explainability | Stage | The stage of generating explanation—during the training of a model (ante hoc) or after the training ends (post hoc). |
| Scope | Whether the explanation is on the whole model, on a specific inference instance, i.e., global, local or both. | |
| Level | The level for which explanation is generated, i.e., feature, decision or both. | |
| Explanation | Method | The procedure of generating explanations. |
| Type | The form of explanations generated for the models or the outcomes. | |
| Evaluation | Approach | The technique of evaluating the explanation and the method of generating explanation. |
| Metrics | The criteria of measuring the quality of the explanations. |
Publisher’s Note: MDPI stays neutral with regard to jurisdictional claims in published maps and institutional affiliations. |
© 2022 by the authors. Licensee MDPI, Basel, Switzerland. This article is an open access article distributed under the terms and conditions of the Creative Commons Attribution (CC BY) license (https://creativecommons.org/licenses/by/4.0/).
Share and Cite
Islam, M.R.; Ahmed, M.U.; Barua, S.; Begum, S. A Systematic Review of Explainable Artificial Intelligence in Terms of Different Application Domains and Tasks. Appl. Sci. 2022, 12, 1353. https://doi.org/10.3390/app12031353
Islam MR, Ahmed MU, Barua S, Begum S. A Systematic Review of Explainable Artificial Intelligence in Terms of Different Application Domains and Tasks. Applied Sciences. 2022; 12(3):1353. https://doi.org/10.3390/app12031353
Chicago/Turabian StyleIslam, Mir Riyanul, Mobyen Uddin Ahmed, Shaibal Barua, and Shahina Begum. 2022. "A Systematic Review of Explainable Artificial Intelligence in Terms of Different Application Domains and Tasks" Applied Sciences 12, no. 3: 1353. https://doi.org/10.3390/app12031353
APA StyleIslam, M. R., Ahmed, M. U., Barua, S., & Begum, S. (2022). A Systematic Review of Explainable Artificial Intelligence in Terms of Different Application Domains and Tasks. Applied Sciences, 12(3), 1353. https://doi.org/10.3390/app12031353