Abstract
Chocolate-coated fruit is becoming more and more popular as a tasty snack. The subjects of the research were freeze-dried strawberries and dark and milk chocolate-coated freeze-dried strawberries. The DSC curves, sorption isotherms, and glass transition temperature were determined. The state diagrams of the freeze-dried strawberries and dark and milk chocolate-coated freeze-dried strawberries were investigated. The modulated differential scanning calorimetry (MDSC) technique was used to determine the glass transition temperature. The DSC diagrams of the studied samples showed differences in shape and course. The sorption isotherms of the freeze-dried strawberries and dark and milk chocolate-coated strawberries belonged to type II according to BET classification. A coating of milk or dark chocolate resulted in a significant reduction in the hygroscopic behaviour of the freeze-dried strawberries and could be considered a promising way to improve the shelf life of the product and improve the nutritional value for commercial production purposes.
1. Introduction
New products that act as snacks are in great demand in the snack market. The development of novel snacks with nutritious ingredients has an effective role in improving diet quality. Eating between the main meals or snacking are popular behaviours throughout the world and are especially appreciated by children [1]. Therefore, the nutritional quality of such snacks has to be greatly considered [2]. Consumption of fruit-based snacks increases the intake of nutrients and phytochemicals, which leads to positive health effects [3,4]. Fruit snacks may be prepared so they are comprised of a core portion coated with an outer shell. A wide range of edible ingredients could be used as cores and coatings. Nowadays, natural ingredients such as fruits have gained interest as a suitable material for core formulation [5,6].
Chocolates and confectionery items are food products favoured by many people, especially children. Confectionery products are usually chosen for consumption because of their flavour and textural properties and are often treated as sources of fats and carbohydrates. However, confectionery products can be also considered a source of vitamins, minerals, and even polyphenols and tocopherols, which are believed to have beneficial effects in the prevention of heart disease and possibly some cancers [5,7]. Chocolate, the most popular among cocoa products, is considered a luxury good [8], with the composition varying with the type of product. In addition to cocoa, the final composition of the product is influenced by many extra ingredients [7]. Dark chocolates with a high proportion of cocoa solids are generally treated as a rich source of magnesium (Mg) and copper (Cu), whereas milk and white chocolates are relatively good sources of calcium (Ca) [9].
Water activity has usually been related to food stability, assuming internal thermodynamic equilibrium in the product and its equilibrium with the environment while avoiding kinetic aspects. Nevertheless, equilibrium may not be achieved in complex food systems such as dehydrated or intermediate moisture products [10]. The removal of water during processing of many products often results in the formation of an amorphous state, which is a nonequilibrium state with time-dependent properties. The physical state of amorphous materials may change from a solid glassy state to a liquid-like rubbery one when the glass transition temperature (Tg) is reached. As the Tg is dependent on the water content, a change from a rubbery to a glassy state can also occur as a consequence of a water content decrease in the product during its processing or storage. The glass transition is supposed to cause dramatic changes in some physical properties of the product. It is known that stickiness and the collapse of dehydrated powdered products occur due to a drastic decrease in the viscosity above the Tg [11,12,13]. On the other hand, an increase in the molecular mobility above the Tg may allow the crystallization of amorphous compounds, especially in food products containing low molecular weight sugars such as strawberries. In products with crystallizing components, the determination of the critical water activity or critical water content at a given temperature to avoid crystallization will allow a prolonged product shelf life. State diagrams showing the relationships between a product’s water content and its physical state as a function of the temperature together with sorption isotherms are useful tools in process optimisation and food formulation for defining processing equipment and operation variables and designing package and storage conditions [14].
Removal of water from food products in order to increase their shelf life can be achieved by different dehydration techniques. However, shrinkage phenomena which depend on the interstitial mobility [15] affect the quality of the final product in classical dehydration methods markedly [16]. Berries, for example, with delicate structures and high levels of water content are very difficult to dehydrate by classical methods [17,18], especially during air-drying, when a collapse causes considerable damage to their physical structures [16]. Vacuum freeze-drying of biological products is the best method of water removal, with end products of the highest quality compared with other dehydration techniques [19,20]. Freeze-dried strawberries were found to be of excellent colour and flavour [18,21] with a high rehydration capacity [18,22].
The chocolate panned products represent a type of food product exhibiting high storage stability. Preservation of high-quality food products during their storage requires monitoring such parameters as the temperature, air humidity, oxygen content in the storage room, as well as the proximate chemical compositions of the products [23,24,25].
This presented study aimed to determine the influence of the chocolate coating on the state diagrams of strawberry snacks. The water activity of the environment, water content, and glass transition temperature of freeze-dried strawberries and dark and milk chocolate-coated strawberries are critical parameters that enable predicting the strawberry snacks’ storage conditions and can be treated as an attempt to define the shelf life of the products.
2. Materials and Methods
2.1. Material
Fresh Senga Sengana (Fragaria ananassa) strawberries were purchased from a local market in Warsaw (Poland). Then, the strawberries were cleaned and washed thoroughly in tap water. After this process, they were thoroughly dried on paper-lined trays. After drying, the strawberries were cut into 2–3-mm thick slices.
2.2. Freeze-Drying of Strawberries
The strawberry slices were prepared according to the methodology of Jakubczyk et al. [26].
Samples were placed on an aluminum tray and frozen at −40 °C for 4 h using a shock freezer (Irinox, Corbanese, Italy). Then, the material was freeze-dried for 24 h with the application of a Christ Gamma 1–16 LSC freeze-dryer (Martin Christ Gefriertrocknungsanlagen GmbH, Osterode am Harz, Germany) under a pressure of 63 Pa and at a shelf temperature of 20 °C.
2.3. Chocolate Coating of Freeze-Dried Strawberries
The freeze-dried strawberry slices were coated with dark or milk couverture chocolate. Then, the coated strawberries were taken out and put on sieves. The sieves were placed on paper trays in order to remove the excess chocolate. After drying, the dark and milk couverture chocolate-coated strawberries were placed in tightly closed polyethylene bags [25]. The dark couverture chocolate composition (according to the manufacturer’s declaration) was as follows: cocoa mass: 70%; sugar: 32.5%; and fat: 44.9%. The milk couverture chocolate composition (according to the manufacturer’s declaration) was as follows: cocoa mass: 35%; sugar: 53.5%; and fat: 37.3%.
2.4. Sorption Isotherms
The water vapour sorption isotherms were determined according to the method of Jakubczyk et al. [26] and Peleg [27]. The water vapour sorption isotherms were determined using the static gravimetric method. The different saturated salt solutions (LiCl, CH3COOK, MgCl2, K2CO3, Mg(NO3)2, NaNO2, and NaCl) and calcium chloride (CaCl2) were prepared to obtain a water activity in the range of 0.0–0.753. The triplicate samples of the same variant of freeze-dried strawberries without or with chocolate coatings were stored in desiccators at a stable water activity and a temperature of 25 °C for 3 months. A small amount of thymol was placed in the desiccator with the NaCl to avoid microbial growth in the samples.
The Peleg model (Equation (1)) was evaluated by determining the best fit to the experimental data [26,27].
The Peleg model was chosen based on the best fit to the experimental data [26,27]:
where u is the equilibrium moisture content, aw is the water activity, and A, B, C, and D areconstants.
The regression analysis was performed according to the method of Jakubczyk et al. [26]. The determination coefficient (R2), the adjusted coefficient of determination (R2 adj), and the root mean square error (RMSE) were used to estimate the compliance of the model with the empirical data. The regression analysis was performed with the application of Table Curve 2D v 5.01 (Systat Software Inc., San Jose, CA, USA).
2.5. Differential Scanning Calorimetry
The calorimetric measurements were performed with a Q200 DSC (TA Instruments, New Castle, DE, USA) according to the methods of Jakubczyk et al. [26] and Ostrowska-Ligęza et al. [28,29].
DSC curves are presented for three levels of water activity: 0.001, 0.329, and 0.753.
The water activity of 0.001 was a control, being basic and the first level of activity. It is the lowest level water activity for food, and in the real world, no food has a water activity level of 0.001.
The water activity 0.329 is the level corresponding to the water activity of many food products stored under appropriate conditions.
The water activity 0.753 is the level corresponding to the critical water activity of many food products stored under inappropriate conditions, such as at a high temperature and air humidity. With such water activity, pathogenic microorganisms can develop, and food products and ingredients can spoil very quickly (e.g., hydrolysis of fats occurs).
2.6. Glass Transition Temperature
The glass transition temperatures of the freeze-dried strawberries and dark and milk chocolate-coated strawberries were determined by modulated differential scanning calorimetry (MDSC) as described by Jakubczyk et al. [26] and Ostrowska-Ligęza et al. [29]. The Gordon–Taylor model (Equation (2)) was used to describe the changes in Tg with the water content and water activity [30]. The goodness of fit was estimated based on R2:
where Tgs, Tgw, and Tg are the glass transition temperatures of the solids, water, and samples, respectively, xw is the mass fraction of water, and k is the Gordon–Taylor model parameter.
2.7. Statistical Analysis
The statistical analysis was conducted as described by Ostrowska-Ligęza et al. [29].
3. Results
3.1. DSC Studies of Freeze-Dried Strawberries and Dark and Milk Chocolate-Coated Strawberries at Different Levels of Water Activity
The subjects of the research were freeze-dried strawberries and dark and milk chocolate-coated strawberries. Fructose, glucose, and sucrose is the mixture of sugars present in strawberries [31,32]. The DSC diagrams of the samples stored at water activities of 0.001, 0.329, and 0.753 are presented in Figure 1, Figure 2 and Figure 3, respectively.
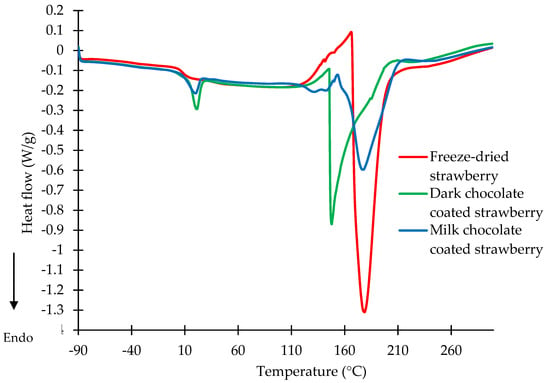
Figure 1.
DSC curves of freeze-dried strawberries and strawberries coated with dark and milk chocolate stored at a water activity of 0.001.
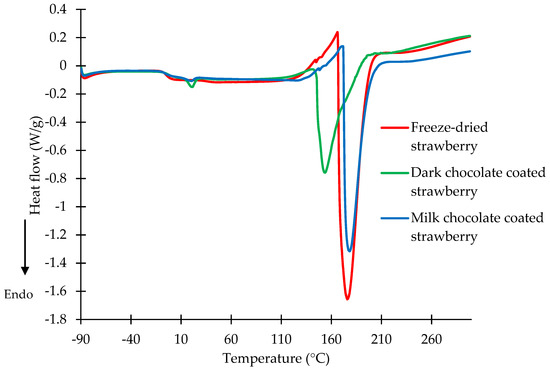
Figure 2.
DSC curves of freeze-dried strawberries and strawberries coated with dark and milk chocolate at a water activity of 0.329.
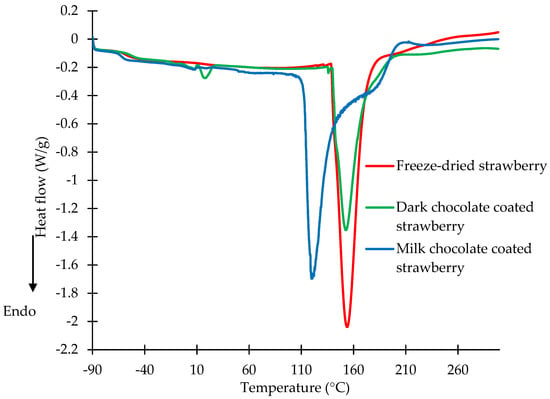
Figure 3.
DSC curves of freeze-dried strawberries and strawberries coated with dark and milk chocolate at a water activity of 0.753.
Mild endothermic peaks at temperatures ranging from 0 to 30 °C were observed on the DSC diagrams of the dark and milk chocolate-coated strawberries. The maximum temperature of the first endothermic peak was observed at 21.21 and 20.15 °C for the dark and milk chocolate-coated strawberries, respectively (Figure 1). The peak corresponds to the melting of the chocolate that covered the strawberry. Cocoa butter was present in the dark chocolate, and a mixture of cocoa butter and milk fat was present in the milk chocolate. The melting point of the chocolates was higher, but it should be mentioned that the chocolate coatings were cooled to −90 °C, and therefore the fat memory was erased [33,34]. Ostrowska-Ligęza et al. [35] investigated three types of chocolates: dark, milk, and white. The authors found that the course of the DSC melting curves and melting temperatures of the chocolates depended on the quality of the fat, addition of sugar or emulsifiers, and particle size distribution in the chocolate.
The DSC diagrams of the freeze-dried strawberries and dark and milk chocolate-coated strawberries were characterised by distinct endothermic peaks at a water activity of 0.001. The peaks were characterised by a very sharp course at a temperature range from about 130 to 210 °C (Figure 1). For the DSC curve of the freeze-dried strawberries, one endothermic peak was observed, with the maximum temperature found at 178.41 °C. The maximum temperature of the second peak for the milk chocolate-coated strawberries was characterised by a similar value of 177.68 °C. For the dark chocolate-coated strawberries, the presence of a second endothermic peak on the DSC curve was observed at a maximum temperature of 147.25 °C. The values of the transition temperatures corresponded to the melting of the sugars contained in the snacks. The mixtures of sugars in the compositions of the freeze-dried and coated strawberries may be in crystalline or amorphous states. The melting temperature was dependent on the sugar state and composition of its mixtures. Wang et al. [36] studied the temperatures of the melting transitions of sucrose, glucose, fructose, and their mixtures at a water activity of about zero. The melting maximum temperature of sucrose was observed at 190.6 °C, while that of glucose was 161.1 °C and fructose’s was 128.2 °C. The melting transitions of the mixtures of glucose–sucrose, fructose–sucrose, and glucose–fructose–sucrose were investigated by DSC. The melting temperature of sucrose was found to decrease in the presence of either fructose or glucose [36]. Lee et al. [37] determined the influence of the heating rate level on the melting transitions of sucrose, glucose, and fructose. The onset melting temperature was investigated. The values of the melting temperature were in agreement with the results published by Wang [36]. The dark chocolate was characterised by the lowest content of sugar. Coating the strawberry with dark chocolate probably lowered the melting temperature of the sugar. This melting point of the sugars may prove that the chocolate coating of the strawberry was carefully carried out.
The DSC diagrams of the freeze-dried strawberries and dark and milk chocolate-coated strawberries at a water activity of 0.329 are shown in Figure 2. The shapes, diagrams, and values of the melting temperatures were similar to those in the DSC curves with a water activity of 0.001. The intensity of the chocolate melting peaks changed, being lower for the dark and milk chocolate-coated strawberries at a water activity of 0.329. An endothermic peak with a maximum temperature of 21.25 °C for the dark chocolate-coated strawberries and 20.23 °C for the milk chocolate-coated strawberries was observed (Figure 2). Water activity in the range from 0.3 to 0.4 corresponds to the water activity during storage [28]. The maximum temperature of the carbohydrate transitions of the freeze-dried strawberries and dark and milk chocolate-coated strawberries at a water activity of 0.329 were observed at 175.87, 152.98, and 178.01 °C, respectively. Based on the obtained results, it can be stated that the thermal properties were not influenced by the level of water activity of the studied freeze-dried strawberry or dark or milk chocolate-coated strawberry samples.
The DSC curves of the freeze-dried strawberries and dark and milk chocolate-coated strawberries at a water activity of 0.753 are shown in Figure 3. The first endothermic peak corresponds to the melting transition of the dark chocolate coating, with the value of the maximum temperature at 17.95 °C. On the DSC diagrams of the freeze-dried strawberries and milk chocolate-coated strawberries, no peaks were observed in the range of temperatures from 0 to 30 °C. The milk chocolate coating was characterised by a lower content of fat, and this could cause the coating to partially dissolve. The peaks observed between 100 and 210 °C correspond to the melting transition of the carbohydrates for all samples. The maximum temperatures of the melting peaks for the freeze-dried strawberries and milk chocolate-coated strawberries were determined to be 153.76 and 118.8 °C, respectively. The increase in water content in the strawberries caused a decrease in the melting points of the sugars contained in the strawberries and the milk chocolate coating. An endothermic peak with a maximum temperature of 153.46 °C was observed for the dark chocolate-coated strawberries. The increased water activity of the carbohydrates lowered the melting points [38,39]. The freeze-dried strawberries and dark and milk chocolate-coated strawberries at a water activity of 0.753 could undergo permanent transformations. At a water activity of 0.753, oxidation and hydrolysis of fats can take place, as well as rapid rehydration of dried strawberries, the decomposition of sugars, and the development of pathogenic microorganisms, which lead to a reduction in the quality of the product. Kita et al. [25] investigated the influence of the packaging methods and storage time on chocolate-panned figs, cherries, hazelnuts, and almonds. They found that the right choice of package type allowed for minimizing transformations proceeding in chocolate-panned products during their long-term storage.
3.2. Sorption Isotherms of Freeze-Dried Strawberries and Dark and Milk Chocolate-Coated Strawberries
The moisture sorption isotherm of the freeze-dried strawberries and dark and milk chocolate-coated strawberries measured at 25 °C is shown in Figure 4. Adding dried fruits to chocolates has been widely used as a way of bringing nutritional and sensory benefits to these products [40]. The moisture sorption isotherm of a complex food is one of the most important measures affecting the acceptability, shelf life, and packaging and storage requirements [41]. The sorption isotherms as experimental data and the Peleg fitted model for freeze-dried strawberries with and without chocolate coatings at temperatures of 25 °C are presented in Figure 4. The sorption curves obtained for the samples were sigmoidal in shape, which is typical for type II isotherms [14,42]. The data showed typical behaviour of rich sugar foods: a slight increase in the equilibrium moisture content in the low water activity and a sharp increase above the water activity of 0.648 due to the prevailing effect of solute–solvent interactions associated with sugar dissolution [14,43,44]. Chocolate coating of freeze-dried strawberries influenced the course of the water vapour sorption isotherms. The equilibrium water content of the coated samples was lower than that of the freeze-dried fruit in the whole range of water activity. Lower values were obtained for strawberries coated with milk than dark chocolate, indicating that the chocolate coating protected the core against moisture absorption and the composition of the chocolate had a significant impact on the course of the sorption isotherms. Ghosh et al. [45] showed that the water vapour permeability of the chocolate coatings increased with the addition of cocoa powder and lecithin but decreased with the addition of sugar. Along with the diffusion of moisture, structural changes in the coating were observed by Ghost et al. [45] which altered the diffusivity of the moisture through the coating. These structural changes can occur due to the swelling of the cocoa particles or dissolving of the sucrose particles in the moisture and subsequent migration to the surface. The mechanism of diffusion through the two dispersed phases—sucrose and cocoa powder—is totally different. Moisture diffusion through the cocoa powder occurs through the particles, which is influenced by the porous nature of powder. The crystalline structure of sucrose makes it so that moisture cannot diffuse through sugar crystals, and therefore, moisture diffuses along the surface of the sugar particles [45]. The presence of a moisture layer on the surface can contribute to dissolving the sugar, and sugar can seep into the surface of the coating to cause sugar bloom.
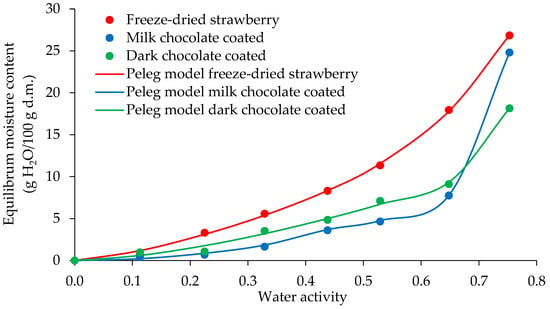
Figure 4.
Water sorption isotherms of freeze-dried and dark and milk chocolate-coated strawberry.
The goodness of fit for Peleg model was estimated based on the determination coefficient (R2), the adjusted coefficient of determination (R2 adj), and the root mean square error (RMSE) (Table 1). The Peleg model was described by high values for R2 (from 0.9962 to 0.9995) and low values for the RMSE (from 2.94 to 7.17%) for all samples (Table 2).

Table 1.
Fitting of Peleg model equation for obtained data.

Table 2.
Gordon–Taylor model fitting for experimental data.
Ciurzyńska and Lenart [42] confirmed that the highest probability of fitting experimental data for freeze-dried strawberries is given by Peleg’s model (R2 0.990–0.997). The Peleg model was also the best fitting observed for freeze-dried Syzygium cumini fruit (jambolan) [46] and freeze-dried apple puree gels [26] sorption values.
3.3. Influence of Water Activity on the Glass Transition Temperature of Freeze-Dried Strawberries and Dark and Milk Chocolate-Coated Strawberries
The relationships between the water activity and glass transition temperature as a function of the equilibrium moisture content are shown in Figure 5, Figure 6 and Figure 7 for the freeze-dried strawberries and dark and milk chocolate-coated strawberries, respectively. The experimental data of the glass transition temperature obtained for the freeze-dried and dark and milk chocolate-coated strawberries are presented in Table 3. The fitting of the Gordon–Taylor model for data obtained for the freeze-dried and dark and milk chocolate-coated strawberries is shown in Table 2.
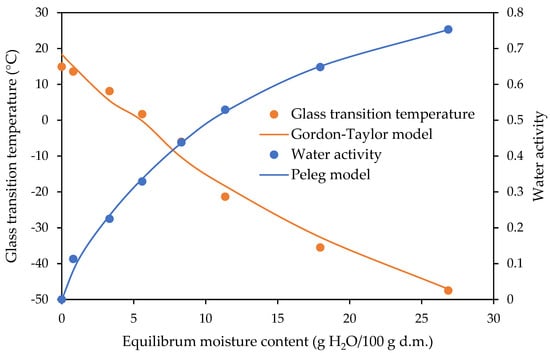
Figure 5.
State diagram of freeze-dried strawberries.
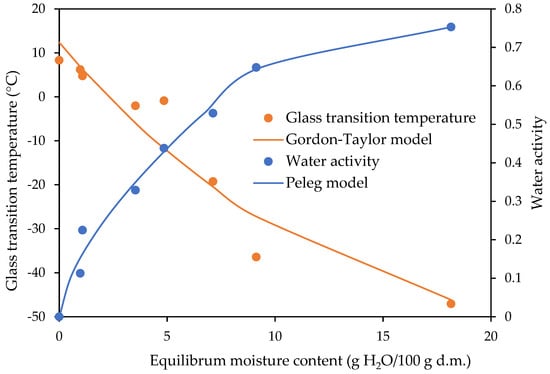
Figure 6.
State diagram of dark chocolate-coated strawberries.
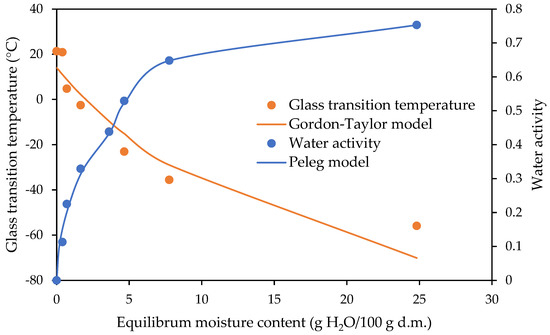
Figure 7.
State diagram of milk chocolate-coated strawberries.

Table 3.
Glass transition temperature of strawberries (freeze-dried and coated with dark chocolate and milk chocolate).
The sugar mixture (fructose, sucrose, and glucose) in the freeze-dried strawberries is in an amorphous state. These materials are not stable due to a lack of thermodynamic equilibrium [26,47]. With the values of the water contents increasing, the values of the glass transition decreased, as presented in the curves of the variations in glass transition temperature and water activity with the equilibrium moisture content of the freeze-dried strawberries and dark and milk chocolate-coated strawberries (Figure 5, Figure 6 and Figure 7). The temperature of determination of the sorption isotherm was 25 °C, and according to the glass transition temperature conception, the values of the critical water activity and equilibrium moisture content should be determined at exactly this temperature. This is not possible because in the study, the highest glass transition temperature was determined for the milk chocolate-coated strawberries and reached 21.08 °C, with an equilibrium moisture content value of 0.00 at a water activity of 0.001 (Table 3).
The values of the glass transition temperature for the freeze-dried strawberries and dark chocolate-coated strawberries were lower, being 14.62 and 7.99 °C, respectively (Table 3). Jakubczyk et al. [26] researched the effect of the incorporation of apple puree and maltodextrin to agar sol on the sorption properties and structure of the dried gel. The authors investigated the relations between the glass transition temperature, water activity, and water content for apple snacks. They found that a higher value for the critical water content and critical water activity at the glass transition temperature of 25 °C, determined from the relations of water content–water activity and water content–glass transition temperature, can result in better stability for the physical properties of stored products. Dried apple puree gels with maltodextrin were characterised by a significantly higher critical water activity than dried gel without a carrier addition. Sà and Sereno [39] investigated phase transitions and unfreezable water in fresh and freeze-dried samples of onions, grapes, and strawberries after equilibration at different relative humidities. Freeze-dried strawberries and onions were obtained in the form of powder. From the DSC trace for each product, the glass transition temperature and melting temperatures were determined. The onset and end temperature of the glass transition were defined. The glass transition temperature ranges obtained by Sà and Sereno [39] differed from those obtained in this article. The values of the onset and end glass transition temperature at a water activity of 0.33 obtained by Sà and Sereno [39] reached −22.6 and −14.8 °C, respectively, and the results obtained in this study at the same water activity were −3.9 and 7.7 °C, respectively (Table 2). This could be due to different sample preparation methods and a different methodology of using DSC. The Gordon–Taylor equation was able to predict the glass transition temperature for the water–food systems studied from the corresponding pure component values [39]. The freeze-dried entire tissue and homogenised tissue of the strawberries were used to obtain the moisture sorption isotherms and glass transition temperature by Moraga et al. [14]. Strawberry pretreatments cause changes in the tissue structure that affect the water binding capacity of the different product phases at equilibrium with a determined aw value. They found that freeze-drying was the method by which products with a very low water content were obtained. This ensures the stability of the product during storage.
Nightingale et al. [48] investigated the influence of the fluctuation temperature and relative humidity on the storage of dark chocolate. The impact of the storage conditions on the quality of the dark chocolate by sensory and, among others, DSC measurements was determined. The dark chocolate was kept under various conditions and analysed at 0, 4, and 8 weeks of storage. They found that varying the storage conditions (e.g., high or low temperature and varying humidity) caused changes in the texture of the chocolate. The cocoa butter changed from the V to VI polymorphic form, which caused blooms on the surface of the dark chocolate. The temperature variation had the worst effect on the quality of the dark chocolate. The authors recommended storage of dark chocolate at a constant temperature and relative humidity. According to Kita et al. [25], the selection of appropriate storage and packaging conditions for chocolate-covered fruit and nuts will ensure their appropriate quality.
In this study, phase diagrams for the dark and milk chocolate-coated freeze-dried strawberries were determined for the first time.
4. Conclusions
Differences in shape and course were observed in the DSC diagrams of the freeze-dried strawberries and dark and milk chocolate-coated strawberries. The sorption isotherms of the freeze-dried strawberries and dark and milk chocolate-coated strawberries were classified as type II according to BET. Based on the obtained results, it can be stated that the shape and course of the sorption isotherms of the freeze-dried strawberries and dark and milk chocolate-coated strawberries were influenced by the method of snack preparation. The glass transition temperature decreased with the increase in the moisture content, which could be due to the strong plasticizing effect of water on this parameter. Coating with milk or dark chocolate resulted in a significant reduction in the hygroscopic behaviour of the freeze-dried strawberries and could be considered a promising way to improve the shelf life of a product.
Author Contributions
Conceptualization, E.O.-L.; methodology, E.O.-L., K.S. and E.J.; investigation, K.D.-Ż., K.S., J.B., M.W.-W. and A.G.; formal analysis, E.O.-L., A.G., M.W.-W. and E.J.; writing—original draft preparation, E.O.-L. and K.S.; writing—review and editing, E.O.-L., A.G. and M.W.-W. All authors have read and agreed to the published version of the manuscript.
Funding
The study was financially supported by sources of the Ministry of Education and Science within funds of the Institute of Food Sciences of Warsaw University of Life Sciences (WULS) for scientific research.
Institutional Review Board Statement
Not applicable.
Informed Consent Statement
Not applicable.
Data Availability Statement
The data generated or analysed during this study are available from the corresponding author on reasonable request.
Conflicts of Interest
The authors declare no conflict of interest.
References
- Adams, E.L.; Savage, J.S. From the children’s perspective: What are candy, snacks, and meals? Appetite 2017, 116, 215–222. [Google Scholar] [CrossRef] [PubMed]
- Green, H.; Siwajek, P.; Roulin, A. Use of nutrient profiling to identify healthy versus unhealthy snack foods and whether they can be part of a healthy menu plan. J. Nutr. Intermediar. Metabol. 2017, 9, 1–5. [Google Scholar] [CrossRef]
- Potter, R.; Stojceska, V.; Plunkett, A. The use of fruit powders in extruded snacks suitable for Children’s diets. LWT-Food Sci. Technol. 2013, 51, 537–544. [Google Scholar] [CrossRef]
- Roe, L.S.; Meengs, J.S.; Birch, L.L.; Rolls, B.J. Serving a variety of vegetables and fruit as a snack increased intake in preschool children. Am. J. Clin. Nutr. 2013, 98, 693–699. [Google Scholar] [CrossRef] [PubMed]
- Beckett, S.T. The Science of Chocolate, 2nd ed.; The Royal Society of Chemistry: Cambridge, UK, 2008; pp. 61–79. [Google Scholar]
- Yeganehzad, S.; Kiumarsi, M.; Nadali, N.; Ashkezary, M.R. Formulation, development and characterization of a novel functional fruit snack based on fig (Ficus carica L.) coated with sugar-free chocolate. Heliyon 2020, 6, e04350. [Google Scholar] [CrossRef] [PubMed]
- Steinberg, F.M.; Bearden, M.M.; Keen, C.L. Cocoa and chocolate flavonoids: Implications for cardiovascular health. J. Am. Diet. Assoc. 2003, 103, 215–223. [Google Scholar] [CrossRef]
- Szefer, P.; Grembecka, M. Mineral Components in Food Crops, Beverages, Luxury Food, Spices, and Dietary Food. In Mineral Components in Foods, 1st ed.; Szefer, P., Nriagu, J.O., Eds.; CRC Press & Taylor Francis Group: Boca Raton, UK, 2006; Chapter 7; pp. 343–435. [Google Scholar] [CrossRef]
- Grembecka, M.; Szefer, P. Differentiation of confectionery products based on mineral composition. Food Anal. Method 2012, 5, 250–259. [Google Scholar] [CrossRef][Green Version]
- Goff, H.D. Low-temperature stability and the glassy state in frozen foods. Food Res. Int. 1992, 25, 317–325. [Google Scholar] [CrossRef]
- Levine, H.; Slade, L. Principles of cryostabilization technology from structure/property relationships of carbohydrate/water systems: A review. Cryo-Lett. 1988, 9, 21–63. [Google Scholar]
- Roos, Y.H.; Karel, M. Applying state diagrams to food processing and development. Food Technol. 1991, 45, 68–71. [Google Scholar]
- Slade, L.; Levine, H. Beyond water activity: Recent advances based on an alternative approach to the assessment of food quality and safety. Crit. Rev. Food Sci. 1991, 30, 115–360. [Google Scholar] [CrossRef] [PubMed]
- Moraga, G.; Martinez-Navarrete, N.; Chiralt, A. Water sorption isotherms and glass transition in strawberries: Influence of pretreatment. J. Food Eng. 2004, 62, 315–321. [Google Scholar] [CrossRef]
- Roos, Y. Time-Dependent Phenomena, 1st ed.; Phase Transitions in Foods; Academic Press: London, UK, 1995; pp. 158–171. [Google Scholar]
- Krokida, M.K.; Maroulis, Z.B. Effect of drying method on shrinkage and porosity. Dry. Technol. 1997, 15, 2441–2458. [Google Scholar] [CrossRef]
- Jankovic, M. Physical properties of convectively dried and freeze-dried berrylike fruits. Publ. Fac. Agric. Belgrade 1993, 38, 129–135. [Google Scholar]
- Mastrocola, D.; Dalla Rosa, M.; Massini, R. Freeze-dried strawberries rehydrated in sugar solutions: Mass transfers and characteristics of final products. Food Res. Int. 1997, 30, 359–363. [Google Scholar] [CrossRef]
- Irzyniec, Z.; Klimczak, J.; Michalowski, S. Freeze-drying of the black currant juice. Dry Technol. 1995, 13, 417–424. [Google Scholar] [CrossRef]
- Krokida, M.K.; Karathanos, V.T.; Maroulis, Z.B. Effect of freeze-drying conditions on shrinkage and porosity of dehydrated agricultural products. J. Food Eng. 1998, 35, 369–380. [Google Scholar] [CrossRef]
- Mazza, G.; Miniati, E. Anthocyanins in Fruits, Vegetables and Grains, 1st ed.; CRC Press & Taylor Francis Group: Boca Raton, UK, 1993; pp. 126–248. [Google Scholar]
- Shishehgarha, F.; Makhlouf, J.; Ratti, C. Freeze-drying Characteristics of strawberries. Dry. Technol. 2002, 20, 131–145. [Google Scholar] [CrossRef]
- Nattress, L.A.; Ziegler, G.R.; Hollender, R.; Peterson, D.G. Influence of hazelnut paste on the sensory properties and shelf life of dark chocolate. J. Sens. Stud. 2004, 19, 133–148. [Google Scholar] [CrossRef]
- Steele, R. Understanding and Measuring the Shelf-Life of Food, 1st ed.; Woodhead Publishing: Cambridge, UK, 2004; Volume 2, pp. 340–356. [Google Scholar]
- Kita, A.; Lachowicz, S.; Filutowska, P. Effects of package type on the quality of fruits and nuts panned in chocolate during long-time storage. LWT-Food Sci. Technol. 2020, 125, 109212. [Google Scholar] [CrossRef]
- Jakubczyk, E.; Kamińska-Dwórznicka, A.; Ostrowska-Ligęza, E.; Górska, A.; Wirkowska-Wojdyła, M.; Mańko-Jurkowska, D.; Górska, A.; Bryś, J. Application of different compositions of apple puree gels and drying methods to fabricate snacks of modified structure, storage stability and hygroscopicity. Appl. Sci. 2021, 11, 10286. [Google Scholar] [CrossRef]
- Peleg, M. Assessment of a semi-empirical four parameter general model for sigmoid moisture sorption isotherms. J. Food Eng. 1993, 16, 21–27. [Google Scholar] [CrossRef]
- Ostrowska-Ligęza, E.; Jakubczyk, E.; Górska, A.; Wirkowska, M.; Bryś, J. The use of moisture sorption isotherms and glass transition temperature to assess the stability of powdered baby formulas. Therm. Anal. Calorim. 2014, 118, 911–918. [Google Scholar] [CrossRef]
- Ostrowska-Ligęza, E.; Dolatowska-Żebrowska, K.; Wirkowska-Wojdyła, M.; Bryś, J.; Górska, A. Comparison of thermal characteristics and fatty acids composition in raw and roasted cocoa beans from Peru (Criollo) and Ecuador (Forastero). Appl. Sci. 2021, 11, 2698. [Google Scholar] [CrossRef]
- Gordon, M.; Taylor, J.S. Ideal copolymers and the second-order transitions of synthetic rubbers. I. Non-crystalline copolymers. J. Appl. Chem. 1952, 2, 493–500. [Google Scholar] [CrossRef]
- Ciurzyńska, A.; Lenart, A. The influence of osmotic dehydration on chemical composition of freeze-dried strawberries. Postęy Tech. Przetwórstwa Spożywczego 2009, 1, 9–13. (In Polish) [Google Scholar]
- de Jesús Ornelas-Paz, J.J.; Yahia, E.M.; Ramirez-Bustamante, N.; Perez-Martinez, J.; Escalante-Minakata, M.P.; Ibarra-Junquera, V.; Acosta-Muniz, C.; Guerrero-Prieto, V.; Ochoa-Reyes, E. Physical attributes and chemical composition of organic strawberry fruit (Fragaria x ananassa Duch, Cv. Albion) at six stages of ripening. Food Chem. 2013, 138, 372–381. [Google Scholar] [CrossRef]
- Raemy, A.; Nouzille, C.; Lambelet, P.; Marabi, A. Overview of calorimetry as a tool for efficient and safe food-processing design. In Calorimetry in Food Processing, 1st ed.; Kaletunc, G., Ed.; IFT Press: Oxford, UK; Wiley-Blackwell: Hoboken, NJ, USA, 2009; pp. 202–236. [Google Scholar]
- Mishra, K.; Kohler, L.; Kummer, N.; Zimmermann, S.; Ehrengruber, S.; Kämpf, F.; Dufour, D.; Nyström, G.; Fischer, P.; Windhab, E.J. Rheology of cocoa butter. J. Food Eng. 2021, 305, 110598. [Google Scholar] [CrossRef]
- Ostrowska-Ligęza, E.; Marzec, A.; Gorska, A.; Wirkowska-Wojdyła, M.; Bryś, J.; Rejch, A.; Czarkowska, K. A comparative study of thermal and textural properties of milk, white and dark chocolates. Thermochim. Acta 2019, 671, 60–69. [Google Scholar] [CrossRef]
- Wang, Y.; Truong, T.; Li, H.; Bhandari, B. Co-melting behaviour of sucrose, glucose & fructose. Food Chem. 2019, 275, 292–298. [Google Scholar]
- Lee, J.W.; Thomas, L.C.; Schmidt, S.J. Can the thermodynamic melting temperature of sucrose, glucose, and fructose be measured using rapid-scanning differential scanning calorimetry (DSC)? J. Agric. Food Chem. 2011, 59, 3306–3310. [Google Scholar] [CrossRef] [PubMed]
- Chirife, J.; Buera, M.P. Water activity, glass transition and microbial stability in concentrated/semimoist food systems. J. Food Sci. 1994, 59, 921–927. [Google Scholar] [CrossRef]
- Sà, M.M.; Sereno, A.M. Glass transitions and state diagrams for typical natural fruits and vegetables. Thermochim. Acta 1994, 246, 285–297. [Google Scholar] [CrossRef]
- De Santana, R.F.; de Oliveira Neto, E.R.; Santos, A.V.; Soares, C.M.F.; Lima, Á.S.; Cardoso, J.C. Water sorption isotherm and glass transition temperature of freeze-dried Syzygium cumini fruit (jambolan). J. Therm. Anal. Calorim. 2015, 120, 519–524. [Google Scholar] [CrossRef]
- Kim, S.S.; Kim, S.Y.; Kim, D.W.; Shin, S.G.; Chang, K.S. Moisture sorption characteristics of composite foods filled with chocolate. J. Food Sci. 1999, 64, 300–302. [Google Scholar] [CrossRef]
- Ciurzyńska, A.; Lenart, A. The influence of temperature on rehydration and sorption properties of freeze-dried strawberries. Croat. J. Food Sci. Technol. 2009, 1, 15–23. [Google Scholar]
- Tsami, E.; Krokida, M.; Drouzas, A. Effect of drying method on the sorption characteristics of model fruit powders. J. Food Eng. 1998, 38, 381–392. [Google Scholar] [CrossRef]
- Mosquera, L.H.; Moraga, G.; Martínez-Navarrete, N. Critical water activity and critical water content of freeze-dried strawberry powder as affected by maltodextrin and arabic gum. Food Res. Int. 2012, 47, 201–206. [Google Scholar] [CrossRef]
- Ghosh, V.; Duda, J.L.; Ziegler, G.R.; Anantheswaran, R.C. Diffusion of Moisture through Chocolate-flavoured Confectionery Coatings. Food Bioprod. Process. 2004, 82, 35–43. [Google Scholar] [CrossRef]
- Augusto, P.; Vissotto, F.; Bolini, H. Sensory impact of three different conching times on white chocolates with spray-dried and freeze-dried açai (Euterpe oleracea). Food Sci. Technol. Int. 2019, 25, 480–490. [Google Scholar] [CrossRef]
- Roos, Y.H.; Drusch, S. Phase Transitions in Foods, 2nd ed.; Academic Press: Oxford, UK, 2015; p. 380. [Google Scholar]
- Nightingale, L.M.; Lee, S.-Y.; Engeseth, N.J. Impact of storage on dark chocolate: Texture and polymorphic changes. J. Food Sci. 2011, 76, 142–153. [Google Scholar] [CrossRef] [PubMed]
Publisher’s Note: MDPI stays neutral with regard to jurisdictional claims in published maps and institutional affiliations. |
© 2022 by the authors. Licensee MDPI, Basel, Switzerland. This article is an open access article distributed under the terms and conditions of the Creative Commons Attribution (CC BY) license (https://creativecommons.org/licenses/by/4.0/).