Article

Goal Shot Analysis in Elite Water Polo—World Cup Final 2018 in Berlin

1
Institute of Sport Science, Motion Science, Martin-Luther-University Halle-Wittenberg, 06120 Halle, Germany
2
German Swimming Federation (DSV), Water Polo, 34132 Kassel, Germany
3
Institute of Sport Science, Training Science & Kinesiology, University of Bayreuth, 95440 Bayreuth, Germany
*
Author to whom correspondence should be addressed.
Appl. Sci. 2022, 12(3), 1298; https://doi.org/10.3390/app12031298
Submission received: 23 November 2021 / Revised: 17 January 2022 / Accepted: 18 January 2022 / Published: 26 January 2022
(This article belongs to the Special Issue Performance Analysis in Sport and Exercise)

Abstract

:
The subject of this game analysis was the throwing behavior of the world class players under competition match conditions during the final “World Cup Water Polo” tournament 2018 in Berlin. Specifically, we analyzed (a) the situational dependence of concrete environmental conditions (“constraints”) of successful throwing actions as well as (b) the goal throw biomechanics concerning throwing speed. Therefore, player’s and ball positions were recorded by video cameras as well as high-speed cameras. Based on the positions and trajectories parameters such as goal throw speed, Voronoi-cells as well as team centroids were calculated. The area of the Voronoi-cells differs concerning defending and attacking teams as well as between successful and non-successful teams and can be used as an indicator for goal or no goal. Under semi-collective tactical aspects, the comparison of the offensively and defensively controlled field areas (collective space control) between successful and unsuccessful goal throws shows that in the case of successful attacking completions, the attacking team (in the sum of its six players) each controlled significantly more field area in front of the opponent’s goal than the six defensive players together with their goalkeeper. In the case of unsuccessful attacking attempts, this area ratio was exactly reversed, i.e., the defensive team dominated the space.

1. Introduction

The sports game of water polo is the oldest Olympic ball sport (first played in St. Louis in 1904). Shooting is one of the most important performance prerequisites in water polo [1,2,3,4]. Successful throws on the goal are of primary interest to coaches and players, and thus also in the focus of game analysis in training science. Deficits in the individual throw performance, when trying to score a goal, mainly result from poor talent selection overseeing throwing competence, and bad technical education of youth players regarding to throwing techniques and goal shooting skills. Besides poor education, also the lack of scientific knowledge about throwing techniques and shooting skills in water polo competition plays an important role.
On the individual level, the biomechanics of the sports-specific skills “drive” shot and “feint” shot (with a waving movement of the throwing arm) were investigated predominantly under isolated training conditions [5,6]. This research revealed that the personal differences in throw performance between the players do not primarily result from ball speed. This leads to the assumption that in competition environment and task constraints (Figure 1) of the skill execution are much more important for the goal throw performance compared to organismic strength alone.
The water polo polo education guidelines describe the most important shot techniques overhead shot, backhand shot, push shot (incl. “self-doubler”), bounce shot, lob etc. under morphological [10,11,12] or function-analytical aspects [13] at least with regard to the elementary teaching-learning situations of technician acquisition and technique application [14] in the junior age. However, it is not sufficiently clarified with which frequency and effectiveness these shot techniques are used especially under competition game conditions.
From a biomechanical perspective the individual goal shot result primarily depends on the following parameters of high quality shooting: (i) Shot velocity respectively the ball speed during a goal shot is the most important performance prerequisite in male elite water polo [1,2,15]. Thus, shot velocity has increased over the last 20 years from 20 ms 1 [16] to 25 ms 1 [17], mostly due to better ball quality, but also because of more intense strength training in elite teams [18]. (ii) Ball speed is significantly different between different shot techniques, such as (a) drive shot, (b) goal shot after feinting (fake shot), and (c) goal shot directly from the catch of the ball [19]. (iii) Shot velocity in match-play (at least of women) is influenced by the players’ load. Stevens [20] found (for women) significantly higher shot velocities in a controlled rest condition (11.6 ms 1 ) compared to throwing velocity after a series of repeated swim sprints (11.2 ms 1 ). Shot velocity is also strongly influenced by the age of the (male) players [17], vertical jump height during a water polo boost out of the water [17], the strength of shoulder rotators [18], as well as by body height [21]. Nevertheless, throwing velocity is an independent factor of water polo performance [21].
However, there is still a deficit of specific measurements in competitive games. Diagnoses seem to be particularly necessary for the overhead shot that is dominantly used in competitive play (as a direct “drive” shot, as a mounted “bounce” shot, or as a “fake” shot after a feinting waving movement of the throwing arm), because relevant measured values are primarily only available for shot movements under isolated training conditions or in laboratory situations [5,6,22]. Thus, important performance-related parameters in the competitive game, such as throwing distance and throwing speed, as well as flight and reaction time, remain unclear. Since international performance differences in maximum throwing velocity under laboratory conditions are comparatively small, recent international research has focused on the primarily tactical situational dependence, e.g., the specific environmental conditions (so-called “constraints” or limitations) of successful finishing actions in sports games [23,24,25]. This development has gone largely unnoticed in water polo.
On the basis of the dynamical systems approach [7,8,9], the goal shot has to be interpreted as the result of a coherent interpersonal coordination of the attackers in relation to the interpersonal coordination of the defenders, and thus must be investigated also on the complex team level. Therefore, recent research on goal shot behavior in different sports games has focused on the situational constraints that are imposed on the shooter when scoring or missing a goal [23,24,25]. Important variables describing the macroscopic formations of the players as agents in a complex adaptive system were e.g., the distances and angles between the assisting and shooting player or between the attacker, defender and goalkeeper, or also the team centroids (“center of gravity”) of the teams in offense and defense [26]. As goal shots are the outcome of dynamic and self-organized multi-agent patterns learned by the players during tactical training and match-play, game analysis is focused on the most functional states of the complex performer-environment system. Despite the huge variety of influential constraints acting on the players during match-play, the number of such perfectly timed interpersonal actions patterns is limited, because less functional states of team or sub-group organization will vanish during the performance development of the team [27].
In our study we focused on the individual technical movement parameters of the single players, as well as on the group tactical behavior of the team shortly before the throws were finally executed. On the individual level there is abundant research on the shot velocity [6], and the various throw positions [28] of world class water polo athletes in competition games, but the quality of the technical execution and its impact on the throw efficacy of the players was not yet described. Furthermore, on the team level—to our knowledge—no research exists on the relevance of collective variables such as e.g., the defensive position of the opposite goal keeper or the position, angle and speed of the assist pass to the shooter in the own offense.
Therefore, the goal of this paper is to analyze the three constraints of the playing behavior of teammates and opponents (semi-collective goal throw characteristics: shot angle, passing distance and speed as well as the goalkeeper position during the goal throw) and to relate them to the situational throw success. A further analysis will clarify the connection between the overall collective offensive and defensive behavior and the goal-scoring success rate using the concepts of “local dominance” [27] in the sense of “space control” [29]. For this purpose, the partial areas of the field controlled by each individual player in the offense and defense will be calculated and compared using Voronoi-cells.
In summary, our analysis of goal throw in elite water polo focuses on both scenarios of the situational movement solution under the specific competition constraints (Figure 1): (i) typical patterns of intra-player movement coordination resulting in high accuracy and speed of the ball during a goal throw on individual level of a specific player, and (ii) coherent patterns of collective inter-player coordination resulting on team (or sub-group) level in the successful scoring of a goal.

2. Materials and Methods

All 24 games of the World Cup 2018 in Berlin were analyzed comprising 12 games of the preliminary rounds played in two groups, eight games of the quarter and semifinal round, and four games for the final round that led to the final ranking of the teams.
Deviating from the conventional rules of the game—and as a test run to speed up the game–, some rule changes were tested by the World Federation FINA at the 2018 World Cup in Berlin. The two most important changes were moving the penalty shot line to 6 m (instead of 5 m) and reducing the attack time until the goal is scored to only 20 s (instead of 30 s).

2.1. Notational Analysis of the Goal Shot Behavior of Individual Players

By means of a notational analysis which is a worthwhile tool in water polo analysis [19] we investigated all N = 1482 goal shots from all 24 tournament matches. The notational goal shot analysis was carried out on the basis of the professionally produced video material of the official television agency (RoughWater Inc., Berlin, Germany). The recordings of the television cameras offered excellent evaluation conditions due to the observation podium installed directly at the edge of the pool, as well as name insertions, close-ups and slow motion replays among other features. To investigate the individual qualitative goal throw behavior under the influence of environmental and situational constraints in elite water polo competition the data collection was based on a game observation with an event sampling [30] during complete the tournament. This resulted in the analysis of: (1) goal shot result (with the characteristics hit and miss), and (2) goal shot technique. To differentiate the observed techniques in more detail the characteristics shot type, shot variation, shot situation, shot execution, and shot fault of the goal throws were documented according to 12 different features and categories (Table 1).
To test observational objectivity, the preliminary round match Croatia vs. USA was repeatedly evaluated independently and in full length with respect to inter-rater reliability, and the results were compared action by action [31]. This resulted in a very good observational quality for observer agreement across the 12 observation categories (Table 1) with a Cohens’ Kappa of κ = 0.903 [32].

2.2. Biomechanical Analysis of the Goal Shot Behavior of Individual Players

For biomechanical analysis on the individual level in each match player and ball positions were recorded by two high-speed cameras (PHOTRON Fastcam mini AX50 and Fastcam SA-3) positioned under the ceiling (top-view above the goals) with a high temporal (250 fps) as well as spatial resolution (1024 × 1024 pixels; Figure 2b; Video S1 available in Supplementary Materials). Both sides of the field were calibrated on the water surface (2D direct linear transformation; Figure A1). Here only the successful goals were analyzed with an endless loop mode and an end-trigger. Unfortunately, very few goals are missing in the case when throwing a (next) goal during camera’s saving time (about 30–60 s) of the previous goal. Then, the ball positions were tracked frame-wise using WinAnalyze 2.8. The tracked positions were smoothed using a Savitzky-Golay filter (span 31). All further analysis (e.g., ball velocity, ball trajectory, ball velocity decay, etc.) were calculated in MATLAB 2018a. The main focus was to analyze (a) the situational dependence of concrete environmental conditions (“constraints”) of successful throwing actions as well as (b) the goal throw biomechanics concerning throwing speed.

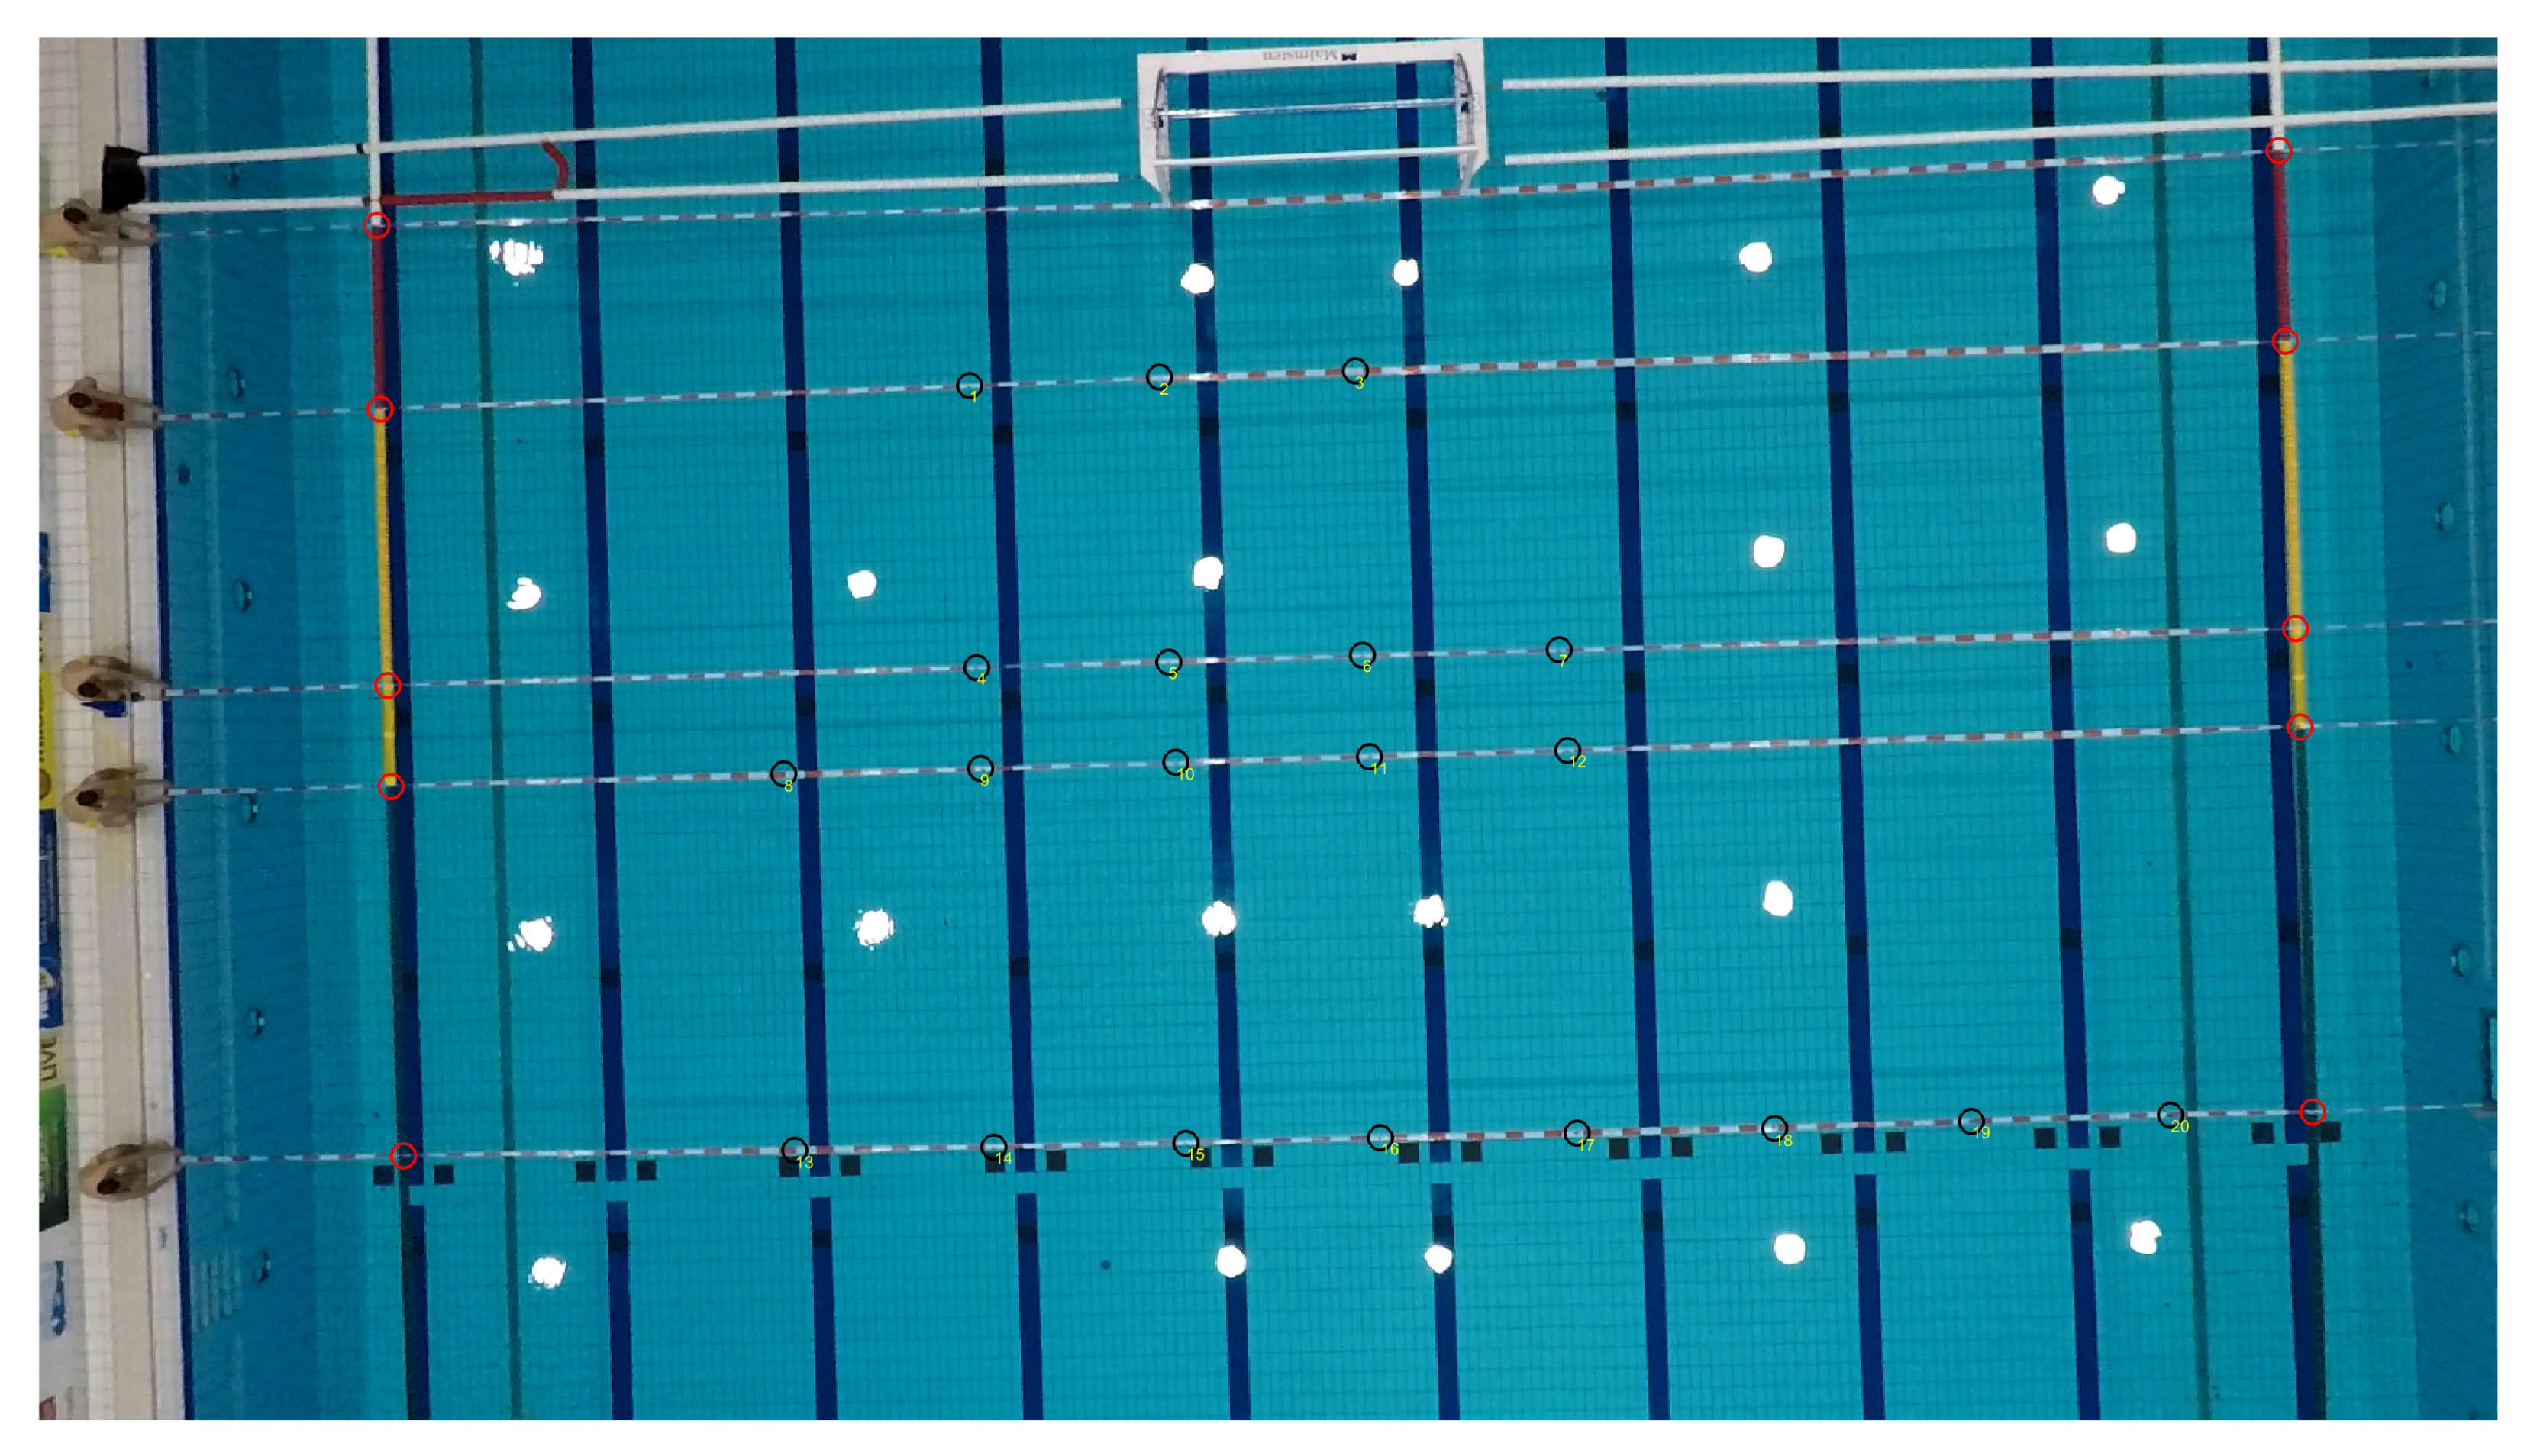
2.3. Biomechanical Analysis of the Goal Shot Behavior on Collective Level

For quantitative analysis on collective level a video camera (GoPro Hero 5 Black; 4096 × 2160 pixels @ 50 fps; linear view to avoid fish-eye distortion) is attached to the ceiling of the swimming pool vertically 13 m above each of the two goal areas in order to record the trajectories of the players and ball during goal shot (Figure 2 and Figure 3). The parameters (player’s position as well ball position) of the assist pass and the goal throw were determined at four different points in time (Table 2): (t1) at the release of the assisting pass, (t2) at the receive of the ball by the shooter, (t3) at the release of ball by the shooter, and finally (t4) when the ball crosses the goal line (or was blocked). These parameters were manually tracked frame-by-frame for all successful as well as non-successful goal shots (N = 1482) using MATLAB 2018a. For calibration, the location (of the world coordinates) of specific points on the water surface (points on lines) were measured and manually tracked in the calibration image (image coordinates; see Figure A1). Afterwards, the image positions were transformed into world coordinates using a two-dimensional direct linear transformation (2D–DLT) and subsequent parameters were calculated such as angle, speed and accuracy. Thereby, the transformation matrix of the Direct Linear Transformation (DLT; Appendix A) was calculated using MATLAB 2018a.
In general, the playing behavior of the attacking and defending team was only analyzed in relation to the position attacks (during 6-vs.-6 position attack and 6-vs.-5 man-up attack) within these game zones. An analysis of the swimming bridging the midfield (transition) was not carried out.
To quantify the space control [29] the idea was to divide the playing field into zones, where each zone is controlled by one player (so called Voronoi-cells; [29]). Thereby, each player is considered as the “nucleus” of a cell that encompasses exactly the area whose points are closest to the player (Figure 3). The boundary of two adjacent cells is thus drawn at the point that the two players could reach at the same time. In the simple and most trivial case there are only two players, then these two players control two different spaces depending on their position on the field. In the case of more players, things get a bit more complicated (Figure 3). Generally, the border of Voronoi-cells is on the half of the distance to the other player and goes perpendicular to this half-distance. The intersection of all these boundary lines creates the Voronoi-cell associated with the player (Figure 3). To calculate and visualize the Voronoi-cells an adapted version of the MATLAB function VoronoiLimit from Jakob Sievers was used. It would not be helpful to use the entire half of the field as the outer boundary, because the outer and rear players would have large areas of Voronoi-cells, but they would not be important for attacking or defending. Therefore, for the calculation of the Voronoi-cells, only a 15 m wide (±7.5 m laterally of the center of the goal) and 8 m high to the rear rectangle was used. This definition prevailed over the testing of other sizes (e.g., −7 m to 7 m × 7 m; −5 m to 5 m × 8 m; −5 m to 5 m × 2 m to 8 m) and best reflected the actual positional distribution and space control of the players.
The centroids ( c x , c y ) of offense and defense—defined by a polygon with n vertices ( x 1 , y 1 ) till ( x n , y n ) —were calculated by:
c x = 1 6 A i = 1 n x i + x i + 1 x i y i + 1 x i + 1 y i
c y = 1 6 A i = 1 n y i + y i + 1 x i y i + 1 x i + 1 y i
where A is the area of the polygon
A = 1 2 i = 1 n x i y i + 1 x i + 1 y i

3. Results

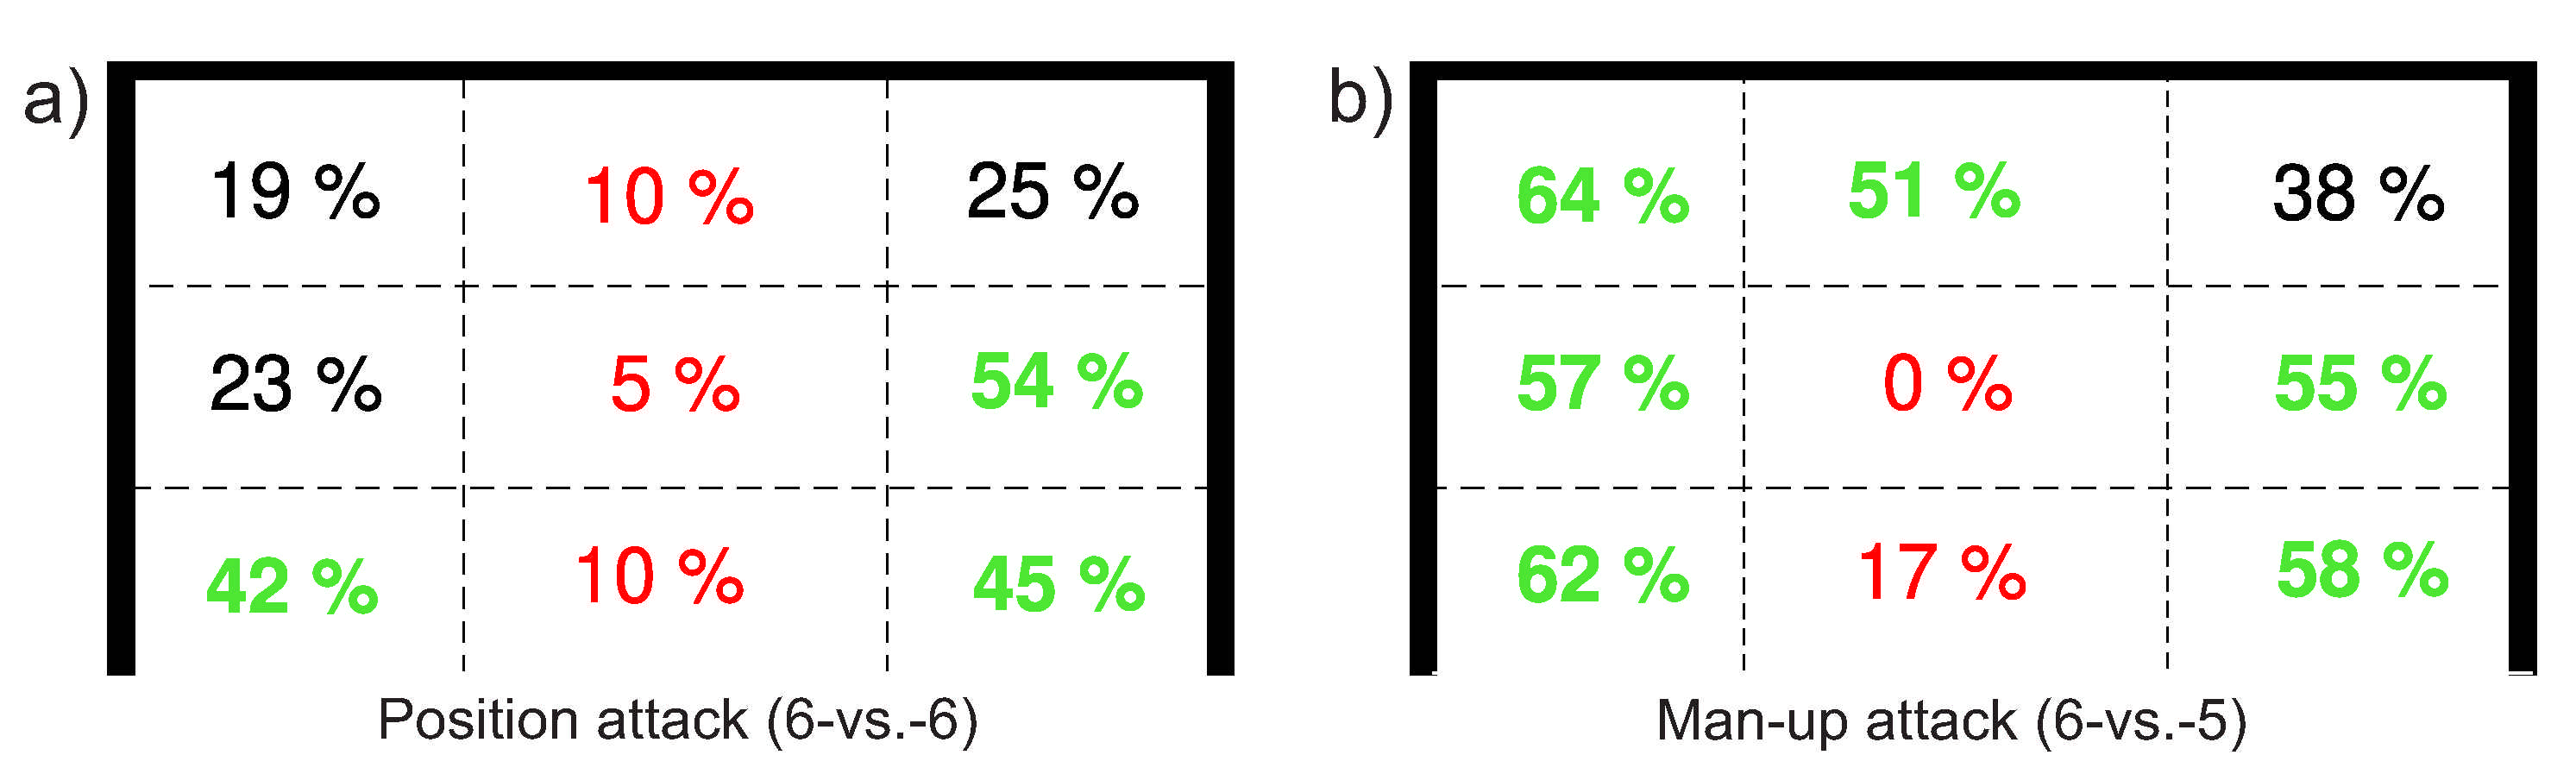
3.1. Notational Analysis of the Goal Shot Behavior of Individual Players

In a first step, the notational goal shot analysis referred to the general success statistics of the goal throw in water polo. This showed that at the international performance level on average 2.05 (±0.2) goals are scored per game quarter and that this number of goals does not vary systematically over the approximately 15-min game segments (this results nearly from the net game time of 4 × 8:00 min) (Min = 1.95, Max = 2.16 goals). In total, 36% of all 1482 goal shots of the players participating in the tournament ended-up successfully and contributed to the game results. However, large differences in the goal success of the players occur in the different types of team attack (Figure 4a), among which the players in the position attack with about 25% showed a significantly lower success rate than in the teams fast break attack with 47% and the man-up attack with 48%. As expected, the 6 m penalty shot is clearly in the lead here with about two-thirds (67%) of successful goal shots. Equally unsurprising is that among the goal shot targets within the 1 m × 3 m water polo goal, at least the two lower of the three vertically arranged zones in the center of the goal are significantly less promising compared to the lateral zones next to the left and true goalposts (Figure 5). In addition, especially in the position attack in equal numbers (6-vs.-6), the players had better success when throwing at the lower target zones and showed particularly good hit rates due to the “touchdowns”, i.e., the shots directly on the water surface near the goal line, which are difficult to defend for the goalkeeper (Figure 5). In general, the success rates of right-handers (36% successful shots on goal) and left-handers (37%) did not show any remarkable difference in the tournament. But it is worth to note that in the positional attacks (6-vs.-6) as well as in the frequent man-up attacks (6-vs.-5) of the own team—which usually result from a 20 s time penalty for an opponent and are played out in a rehearsed formation (power play)—that left-handers positioned on the right wing achieve a significantly (p < 0.05) higher hit performance with 56% hits compared to right-handers throwing from the same, but for them uncomfortable position (with only 35% or even only 24% in the case of man-up attacks).
With regard to the various goal-shot techniques (Figure 4b), among which the tip-in with the forehand and with the backhand (“pull-shot”) might be exclusive for the sport of water polo, there are also significant differences. In the case of the tip-in, after the player has lifted the ball over the goalkeeper, the ball only has to be pushed into the unguarded long corner of the goal without making any mistakes (with the forehand or backhand, depending on the direction of the pass), so the hit rates are naturally very high. However, it is rather surprising that with the most important shot type, the drive shot, which accounts for more than 90% of all passes and shots in the game, is clearly more efficient compared to the “dry” goal shot without water contact (hit rate: 31%). The changing ball trajectory and speed (depending on whether the ball hits a wave crest or wave trough) during the water touchdown seems to be more difficult for goalkeepers to anticipate and thus to defend. The rarer backhand shot and lob shot, which are typically used in water polo from the outside positions and the center player positioned near the 2 m offside line in the center in front of the goal, respectively, are far less successful (Figure 4b).

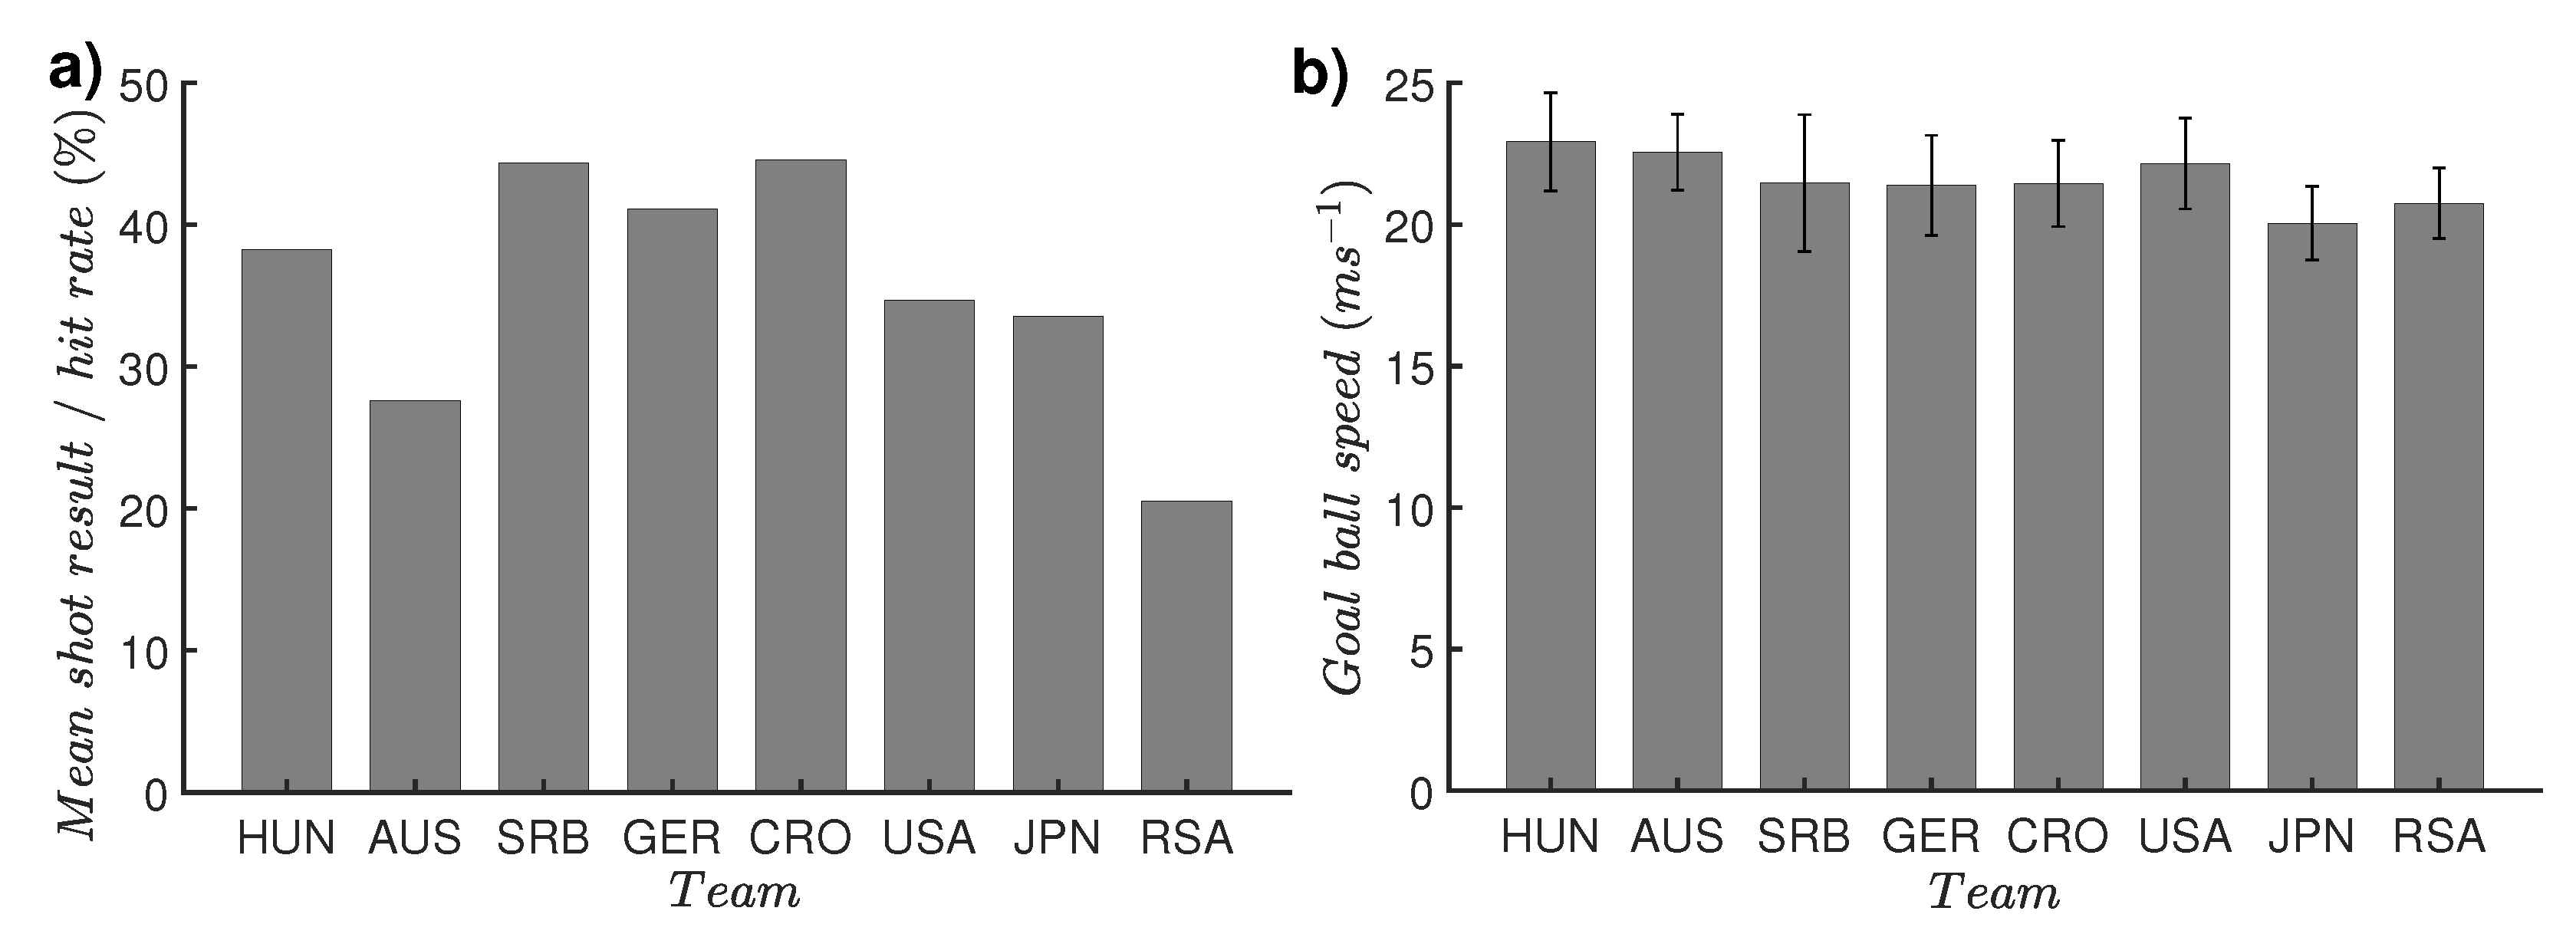
3.2. Biomechanical Analysis of the Goal Shot Behavior of Individual Players

From a biomechanical point of view, the ball velocity and the flight duration of the ball during the goal shot are of primary interest. Because of its dominant importance, our analysis focused on the drive shot, but in both techniques of the high (“dry”) and the bounce shot (as a rebound from the water surface). To ensure that the examined goal shots were executed by the players with approximately maximum intensity, only those drive shots (n = 193) were included in the analysis that were unimpeded (“free” shots), executed without technical mistakes, from a minimum distance of 6 m, and with a ball release velocity of at least 17 ms 1 (Table 3).
As a result, both penalty throw (from the 6 m line) and throw from the field showed very high release speeds, some of which were over 25 ms 1 . Thereby, the top performers were one player of the 2016 and 2020 Olympic champion Serbia with faster than 27 ms 1 and one player from Hungary with faster than 26 ms 1 . At these shot speeds, the reaction time of the goalkeeper (time between t3, leaving the ball from the hand, to t4, passing goalkeeper’s position) was less than 0.2 s in individual cases (Figure 6).
Hungary’s national team occupied a special position among the world’s top water polo teams in terms of shot velocity, because, on the one hand, its average superiority over four of seven World Cup finalists was significant (see the individual comparisons in Figure 7b; Bonferroni post-hoc, p < 0.05), and, on the other hand, no less than five players achieved shot velocities higher than 23 ms 1 , which was not achieved by a single Japanese or South African player, for example.
Comparing the overall team scoring results of the eight participating national teams, the higher scoring rates of the water polo nations Hungary (Olympic champion 2000, 2004, 2008), Croatia (Olympic champion 2012) and Serbia (Olympic champion 2016, 2020), which have been successful at Olympic Games and World Championships for many years, are already noticeable at first glance (Figure 7a).

3.3. Biomechanical Analysis of the Goal Shot Behavior on Collective Level

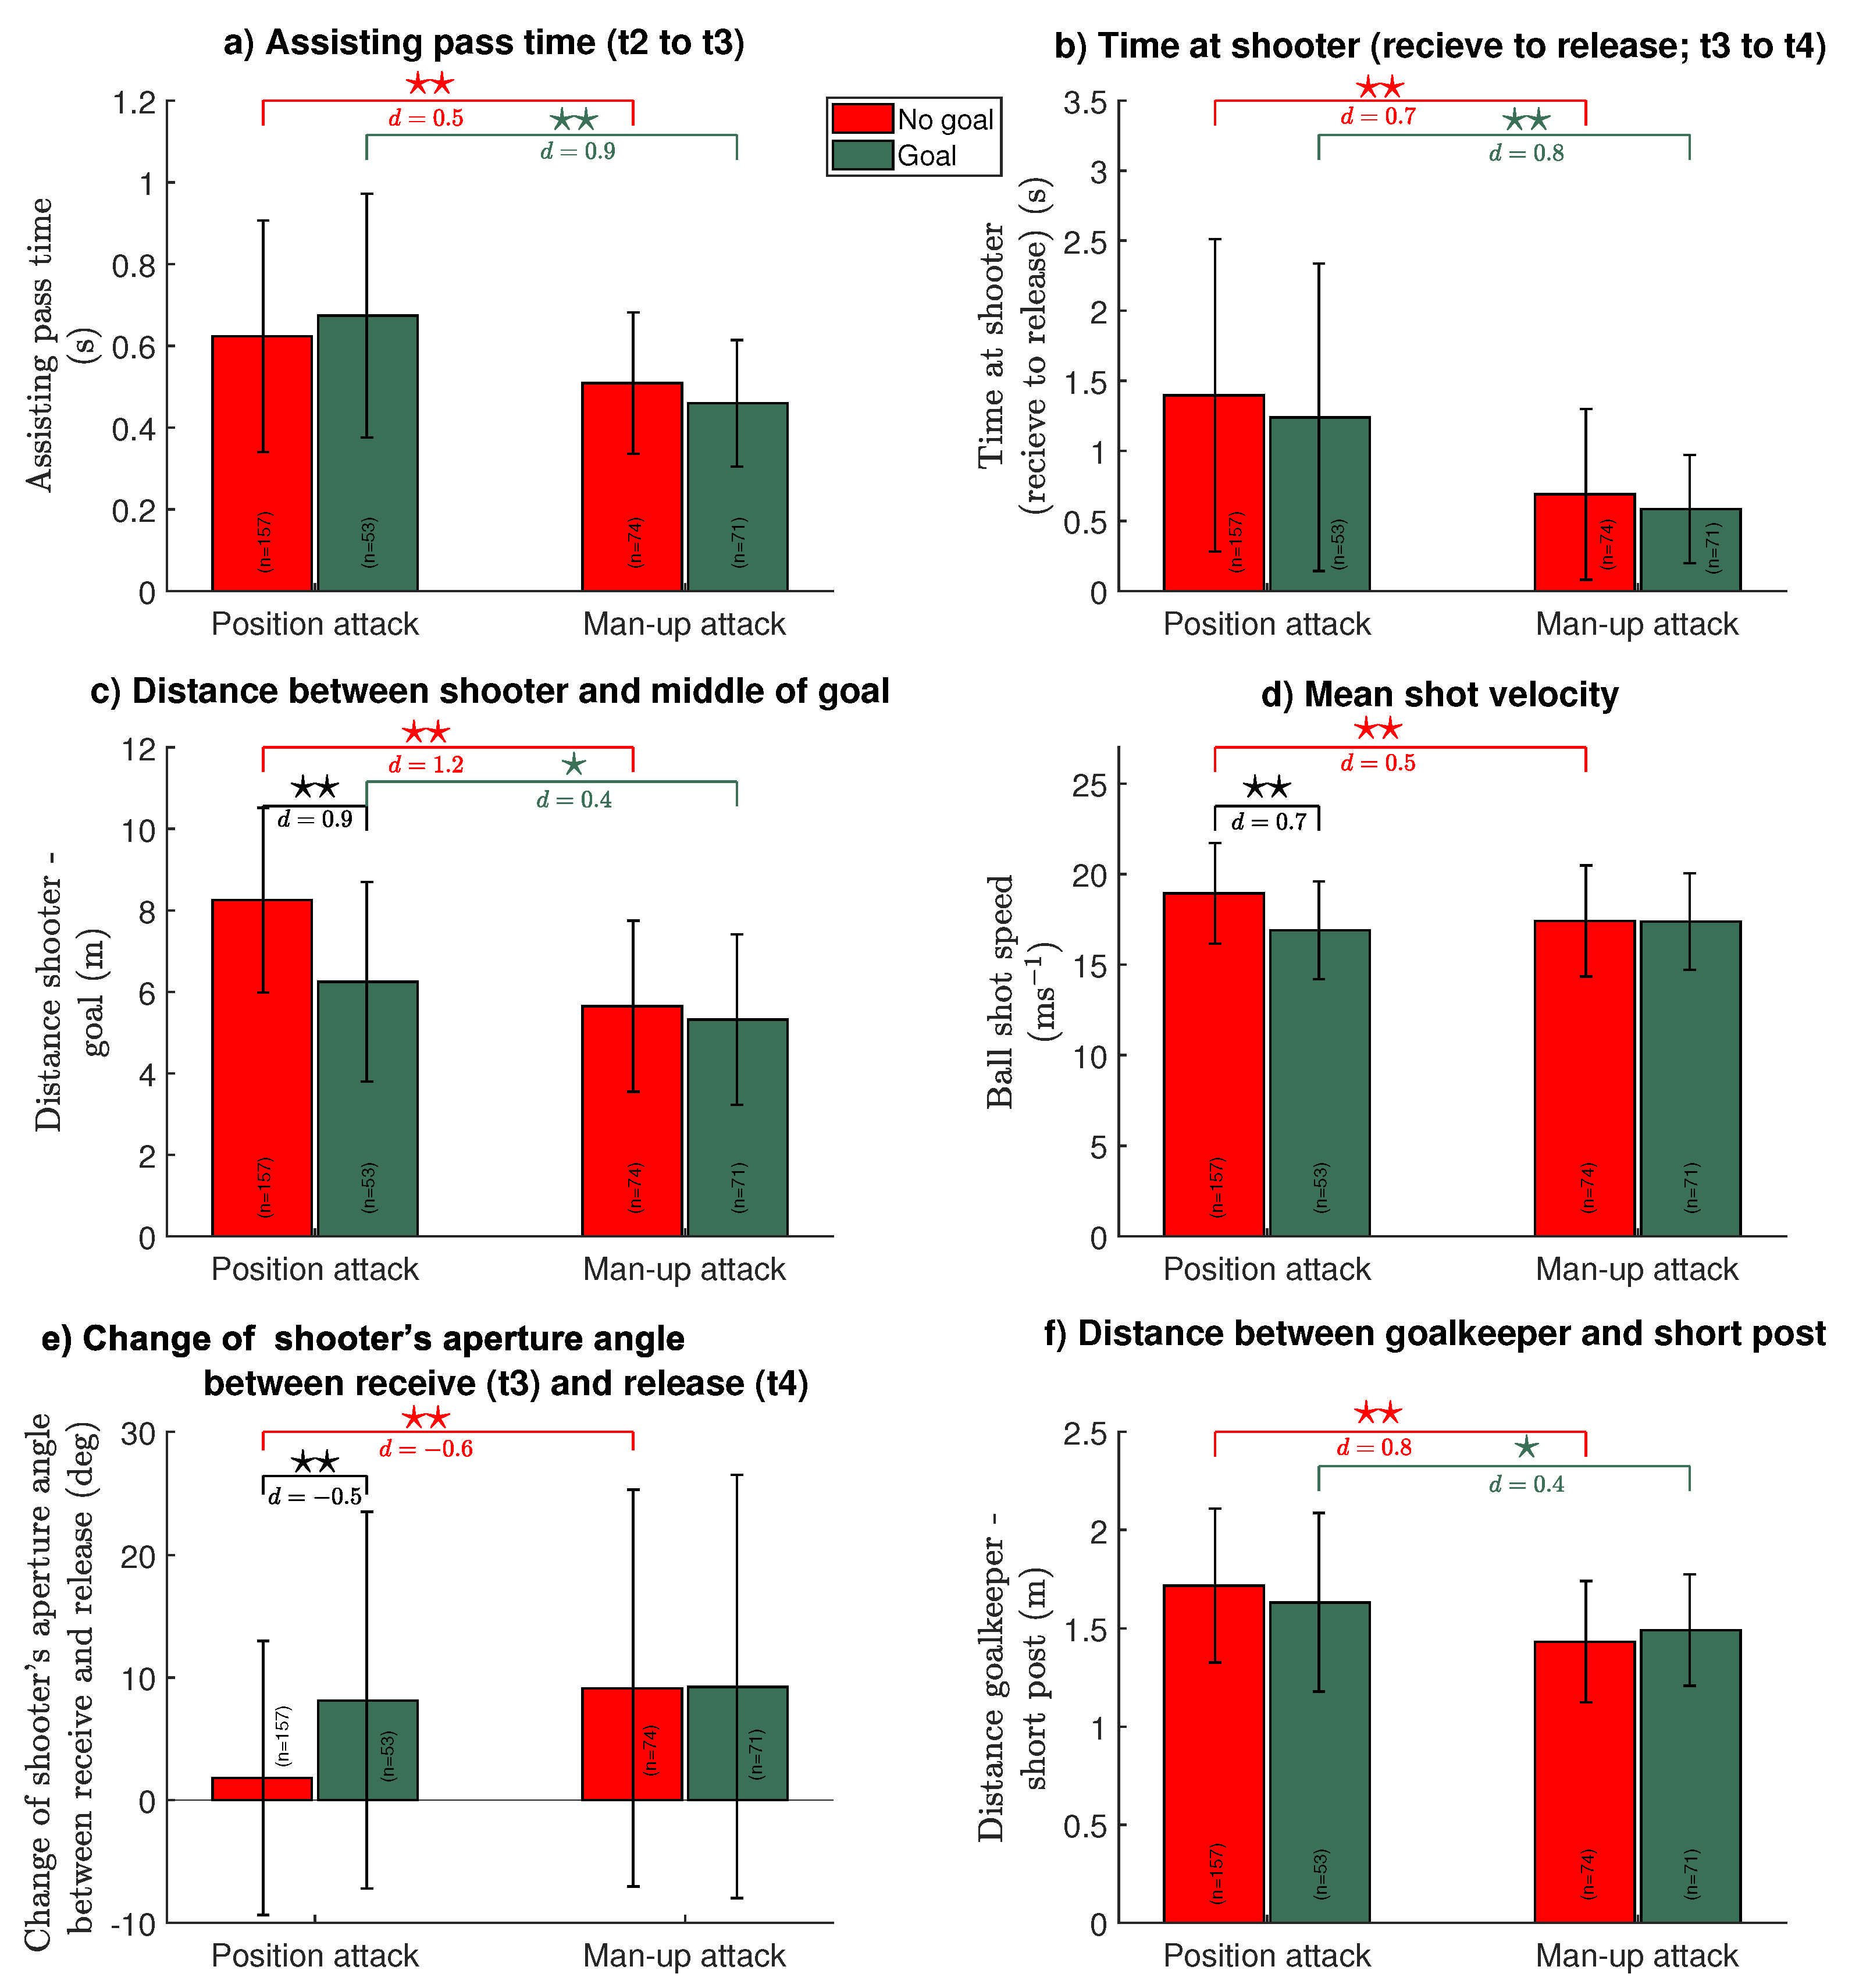
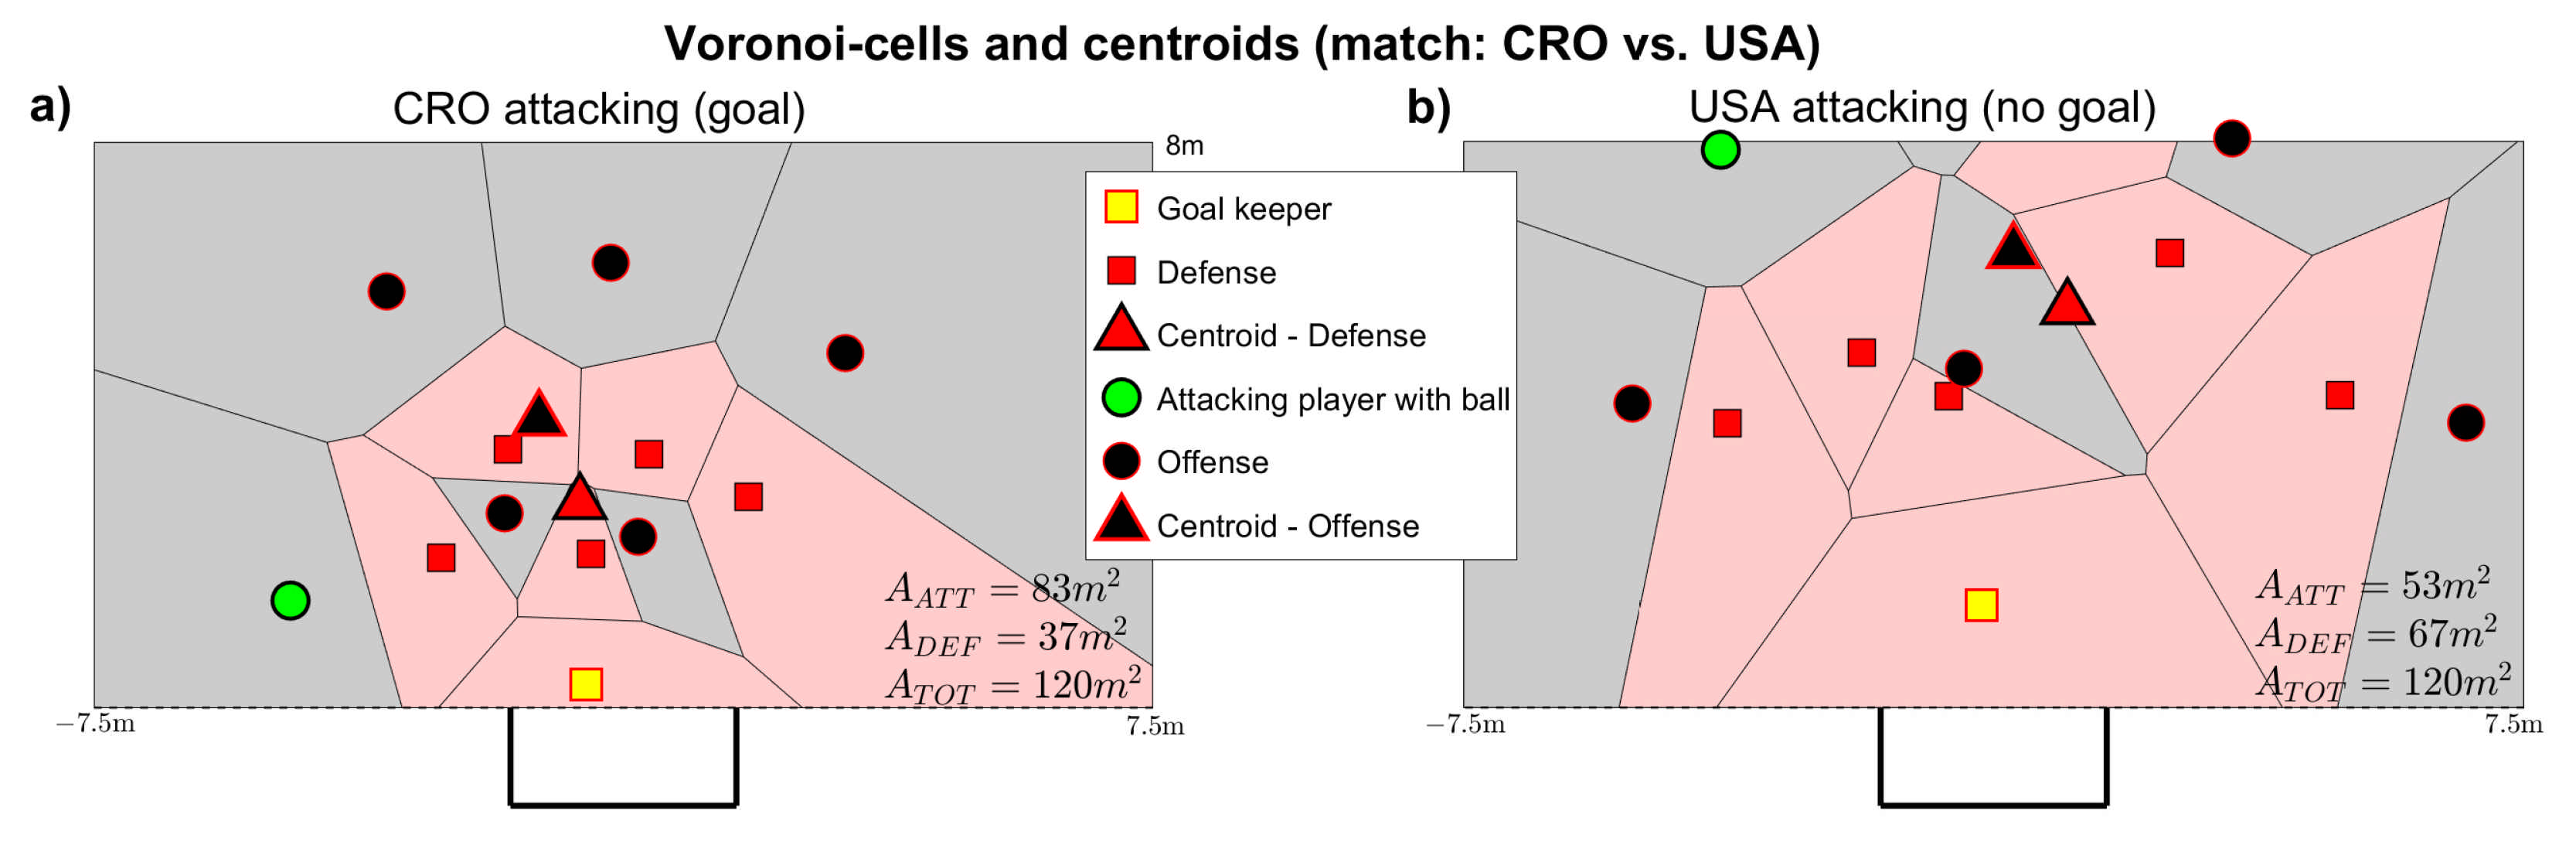
3.3.1. Partial Collective Tactical Goal Shot Analysis

In the partial collective tactical goal throw analysis, n = 395 drive shots of all eight teams (only when scoring) were included. In a first step, we examined whether the individual tactical throwing behavior, which is expressed (a) in the position of the shooter in the Tactical Playing Area (TPA) [3] that is the position relative to the goal and goalkeeper, and (b) in the spatial change of the position during his ball possession shows a correlation with the success of the goal throw. In a second step, we investigated whether the tactical behavior of the assisting teammate, in this case represented by the ball speed of the assist pass, also shows a correlation with the success of the goal throw.
In general, it has been shown that the two types of attack—positional attack and man-up attack—must be evaluated separately, which unfortunately reduces the individual case numbers even further. From a tactical point of view, the results firstly show that the throwing distance is of significant (p < 0.05) importance, because—at least in the positional attack—the closer the shooter could move up to the goal, the higher his hit rate was (Figure 8c). Furthermore, the hit rate was also higher when a player executed the goal shot—presumably for the purpose of higher throwing accuracy—rather with a sub-maximal throwing speed, because Figure 8d shows that in the positional attacks, the throwing speed was significantly (p < 0.05) lower for the successful goal shots compared to the missed shots.
Furthermore, our analysis (Figure 8e) reveals that the targeted goal success is favored by a change in the position of the ball possessor, i.e., when the shooter changes his spatial position on the field in the time window between receiving the ball (t2) and shooting on goal (t3) in such a way that this increases the opening angle during the goal shot (“pulling to the center”). This significant (p < 0.05) change in the player’s position occurs primarily with the goal of opening up a (wider) shot corridor concerning an opponent or directly the goalkeeper. At the same time, this finding corresponds with the use of more sophisticated throwing movements to or against the throwing hand side already noted above among the top nations. This change in the position of the ball owner, which is relevant for success, is also interesting because it obviously has to be executed very quickly, because independent of the associated optimization of the throwing angle, the hit rate also increases in the same direction with a shortened ball holding time (see Figure 8b) of the attacker, whereby systematically shorter ball holding times were shown in the man-up attack compared to the positional attack. Besides a fast execution of the shooting movement around the defender or goalkeeper, the success relevance of a short ball holding time might also result from the fact that in case of a long cross pass from the opposite side of the field it can be relevant for success to finish as fast and directly as possible into the “short” corner, i.e., close to the thrower, as long as the goalkeeper is still in lateral movement. This naturally takes place more often in an man-up situation. A correlation between the optimization of the shot angle or the shortest possible ball holding time and the defensive behavior of the goalkeeper is also supported by the fact that the scoring rate is higher when the distance between the goalkeeper’s position and the “short” post is greater at the moment of the goal throw—even if this trend, which is noticeable for several teams, is only significant for the USA and South Africa (Figure 8f; p < 0.05).
Finally, from a semi-collective-tactical point of view, we tested the hypothesis of a correlation between the passing speed, i.e., specifically, the ball flight time between leaving the hand of the passer (t1) and the reception by the goal shooter (t2). This attacking characteristic turned out to be significant for the scoring rate between the two general attacking situations 6-vs.-6 and 6-vs.-5 (Figure 8a).

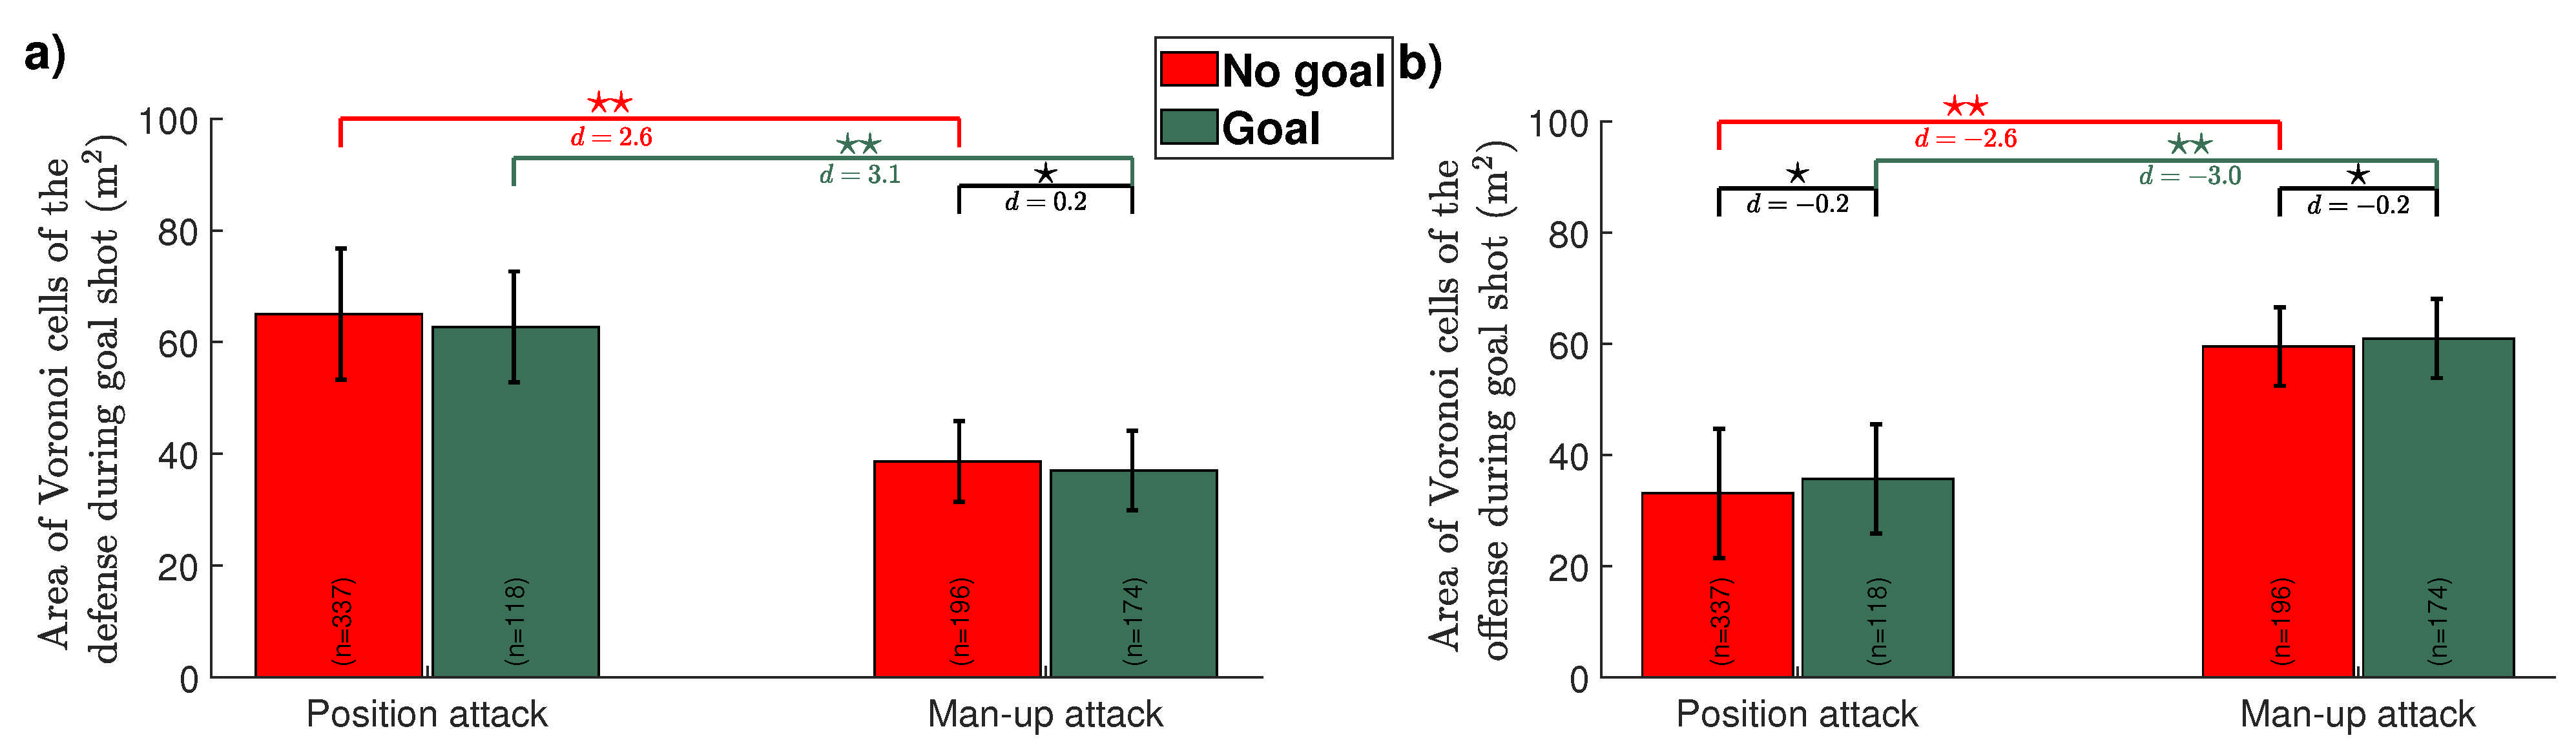
3.3.2. Collective Tactical Goal Shot Analysis

From a total team perspective—evaluating all N = 1482 goal throws—the hit rates differed considerably with regard to the four different attack types: fast break attack, position attack, man-up attack and penalty shot (see Figure 4b). As expected, the observed national teams scored about twice as much in the attack initiation via a fast break attack (“counterattack”) with about 48% goals than in the position attack with equal numbers (6-vs.-6), which generally follows an unsuccessfully broken fast break attack and is played out until the end of the (in this tournament) regular attacking time of 20 s. Even if only a quarter of these positional attacks have resulted in a goal, the exclusion of an opponent due to an infringement of the rules often results in a far more promising man-up attack (6-vs.-5), which is restarted with a further attack time of 20 s. Such an man-up attack is usually played by means of a power play set-up and in the 2018 World Cup Final it brought on average almost a doubling of the scoring rate compared to the positional attack.
Comparing the hit rate of the prototypically unimpeded and maximally fast penalty throwss (n = 66) in the 2018 World Cup final, for example, with that at the 2007 Men’s World Cup in Melbourne, where the penalty throw distance was increased from 4 m to 5 m for the first time at a World Cup, the first result that stands out is the significantly reduced hit rate from 74.1% at the time [33] to the current 67.0%. Since the throwing speed increased significantly during the same historical period, the main causes might be an improved goalkeeping performance on the one hand, and a lower goal shot accuracy due to the greater shooting distance on the other hand.
The final analysis of the relationship between the overall team offensive and defensive behavior—based on the positional data (position sampling) of all six offensive and defensive players and the goalkeeper–, i.e., specifically, collective space control, is again based on the n = 395 goal successful shots of all eight teams (Figure 4b).
Focusing on the offensively and defensively controlled partial field areas (“controlled space”) generally the probability to throw a goal is significant lower (p < 0.05) when the defending team controls larger space in front of their own goal (during man-up attack; Figure 9a) or is significant higher (p < 0.05) when the attacking team controls larger space in front of the opponent’s goal (during positional as well as man-up attack; Figure 9b).
Simplified, in the case of successful attacking completions, the attacking team in the sum of its six players controlled more space in front of the opponent’s goal compared to the six defensive players together with their goalkeeper (Figure 10a) and—in contrast—for unsuccessful attacking attempts, this area ratio was often exactly reversed, i.e., the defensive team dominated the controlled space (Figure 10b).

4. Discussion

4.1. Notational Analysis of the Goal Shot Behavior of Individual Players

Our analyses revealed two fundamental determinants of the individual goal shot success: the laterality of the handedness of the scorer in relation to his position on the left or right side in the team attack zone, and his spatial throwing position in the tactical playing area (TPA) [34]. Since left-handers almost never play on the left attack side, the throwing results of left-handers and right-handers on the right attack side alone were compared. As a result, for the positional attacks with equal numbers (6-vs.-6) as well as for the frequent man-up attacks (6-vs.-5), it is noteworthy that left-handers used on the right wing position achieve a significantly (p < 0.05) higher hitting performance with on average 56% hits compared to the right-handers in the same, but for them unfavorable position in the tactical playing area (TPA) with only 35%, and even only 24%, respectively.
Furthermore, the result of the investigation of a more or less constant goal rate of approx. 2 goals per game quarter shows that at international performance level the number of goals does not vary systematically over the approx. 60 min game duration. Even if the causes of this consistency were not analyzed in more detail, at least for the world’s top players, we can hardly assume a decreasing precision of throwing during the course of the game. This fact is important because [28] and most recently [35] had diagnosed a fatigue-related decrease in throwing accuracy by 20.3% (±23.5%) (p < 0.05) following a match.

4.2. Biomechanical Analysis of the Goal Shot Behavior of Individual Players

Throwing speed is probably one of the most important performance prerequisite in water polo at all performance levels—together with swimming speed—[1,2,15] and therefore rightly forms a central focus of the present study. In the case of the drive shot, which is dominantly used in water polo with more than 85%, it is possible to distinguish between the variants of (a) direct goal throw, (b) goal shot after feinting and (c) goal throw directly from catching [19]. Doing so, but a systematic difference between the ball velocities cannot be detected [21]. According to [22], on the side of the more general performance characteristics of the players’ the age [17] and body height [21] are primary variables that influence the throwing velocity. On the side of the trainable physical components, hand grip strength [36] as well as shoulder rotator strength [18,37], specifically the pectoralis major muscle and deltoid muscle strength [38], and in-water shoulder proprioception [39], are the main determinants of throwing speed. Also a positive impact on throw velocity was shown for the vertical jump height by means of the water polo boost, and the height of the head above the water surface during the throw [17]. Both features are based mainly on the quickness and technical quality of the leg movement [18,22]. Notwithstanding these influential determinants, however, it seems that individual throwing behavior represents an independent dimension (in terms of factor analysis) of water polo performance [21].
In the context of the present study, it is particularly noteworthy that in the throwing behavior of the current men’s world class since the 1980s, the throwing velocity continues to increase unabated (especially considering the maximum values in the range of 26–27 ms 1 ), ranged from 19.1 ms 1 (penalty shot from a distance of 4 m at that time; [6]) to 20.2 ms 1 (±1.4 ms 1 ) at the 1997 FINA World Cup in Athens [16], to the most recent value reported by [22] measured throwing velocity of 22.8 ms 1 (±2.8 ms 1 ) in Italian first division players, up to the average velocity of 21.62 ms 1 (±1.90 ms 1 ) currently diagnosed in the present study.
This increase of the throwing speed in the course of the last 15 years by about 9% may be regarded as an obvious concomitant of the professionalization of the water polo sport especially in the nations of the Mediterranean area. This considerable increase in speed is also underlined by the fact that the throwing speeds measured by [6] in the 1980s are now already achieved by 15–18-year-old Croatian junior national players with 19.91 ms 1 (±0.91 ms 1 ; [40]). In general, it should also be noted that goal throws under competitive match conditions—at least according to the comparison made by [1,2] in top Spanish female players—have a ball velocity up to 3 ms 1 (p < 0.05) higher than drive shots throws performed on the empty goal under laboratory conditions.
With respect to goal throw in competitive play, it is further noteworthy that it has not yet been conclusively determined whether throwing velocity in water polo depends on immediate player stress. Whereas [20] found significantly higher throwing velocities, at least for intermediate-level women, at 11.63 ms 1 (±1.40 ms 1 ) in an unstressed control situation compared to 11.21 ms 1 (±1.23 ms 1 ; p < 0.05) within a series of repeated sprint loads, neither [41] in juniors, nor [35] in first-line Greek players have found fatigue-induced decreases in throwing velocity in the male high performance range. One reason for this contradiction is likely to be the general, lower physical performance level of women’s water polo, where even top female players have throwing speeds approximately 4–5 ms 1 lower than men [6].

4.3. Biomechanical Analysis of the Goal Shot Behavior on Collective Level

4.3.1. Partial Collective Tactical Goal Shot Analysis

The connecting factor between the individual and the collective level is that the goal throw result does not only depend on the individual throwing speed and throwing precision, but is also significantly determined by the situational environmental conditions (constraints). Thus, highly skilled players adjust their throwing behavior variably and functionally and to the specific situational conditions at hand in a way that ensures a maximally successful throwing result [42].
In the case of goal throws in the form of a single and uninterrupted catch-throw action (drive shot), the influencing factor of keeping the ball as short as possible has been found to be an important prerequisite of the subsequent goal throw success. The reason for this is probably that in water polo, on the one hand, the ball may only be caught with one hand due to the rules, which makes ball control more difficult, and on the other hand, the defender can attack the ball owner for the duration of his possession in accordance with the rules. Thus, it is quite logical that, for technical-tactical reasons, a significant proportion of goal throws are made as quickly as possible in the form of a single and uninterrupted catch-and-throw action.
With direct shots as well as with fake shots (after one-time or multiple feinting), the result of the throw also depends on an effective change of position of the thrower during the possession of the ball relative to an opponent and especially to the goalkeeper. In principle, the thrower tries to fix his own opponent and the goalkeeper on their respective positions and at the same time to increase the goal area not covered by the opponent and the goalkeeper by his own forward and/or sideways movement.
Ramos [27] introduced the term “local dominance” which means that highly skilled goal scorers in invasion games shape the configuration of the player triad goal thrower-counter-goalkeeper towards a throwing situation set-up favorable to them. In our findings in top-level water polo is in line with this performance indicator. So, the players of the three top nations Hungary, Serbia and Croatia firstly do not only use the more difficult throwing techniques to or against the throwing hand side, but also quickly move around the defender or goalkeeper with the help of an effective leg movement (straddle movement or boost). To impose local dominance the best water polo players optimize their position in the tactical playing area (TPA) in front of the opposite goal by optimizing the angle relative to the goal and goalkeeper position.
Furthermore, under semi-collective-tactical aspect, such functional grouping patterns of the players [43,44], which turn out to be typical situational conditions during successful goal finishes, are of interest. Although no systematic relationship with goal-scoring effectiveness has been demonstrated for the speed of passing by the assisting teammate, which has been investigated under semi-collective aspects, at least the spatial size of the throwing target, which is influenced by one’s position relative to the goal and goalkeeper position [24], tended to be significant for goal success: the greater the distance between the goalkeeper and the goal post close to the thrower in the positional attack, the greater the goal scorer’s hit rate.

4.3.2. Collective Tactical Goal Shot Analysis

Generally speaking, when scoring a goal in most sports games, the throwing result primarily depends on the distance to the nearest opponent [29,45]. In addition to this elementary variable, and in line with the key performance indicator local dominance [16] the top international water polo teams try to increase their control of space in front of the opponent’s goal primarily through quick position changes (e.g., in the form of vertical penetrations, diagonal crosses, and horizontal swims “into the box” from the outside, etc.) in the attack. To do this, each player must optimize several spatial distances at the same time in his playing position or in his attacking zone, i.e., not only to the nearest defenders, but also to his teammates in terms of the best possible throwing situation for himself or a teammate [25]. As the present study has shown, that superior space control both in the positional attack (6-vs.-6) and in its defense leads to a significantly higher rate of goal scoring or goal prevention. The attacking teams when scoring goals with six field players controlled on average a space in front of the opponent’s goal which was about 32.0 m 2 (±3.0 m 2 ) larger than the space controlled by the six defenders together with their goalkeeper. Conversely, the successfully defending teams controlled a pitch area in front of their own goal that was also larger by 24.0 m 2 (±2.0 m 2 ) when they thwarted a goal against. The same (preliminary) findings emerge for the outnumbered attack (6-vs.-5) and the man-up attack (6-vs.-5) and the man-down defense (5-vs.-6), respectively, although here the absolute size of the Voronoi-cells controlled by the two teams is smaller, as expected, due to the power play set-up.

5. Conclusions

The findings enabled a differentiated clarification of the differences in the individual throwing behavior of the individual players and the collective goal throwing results of the eight investigated national water polo teams at world class level. What has become clear is that world-class goal-throwing behavior in water polo cannot be viewed in isolation at either the individual or the (partial) collective level of analysis, but must be described as a whole via the system dynamic interaction between the two levels of analysis [9,46]. Thus, a complete elucidation of the throwing performance of world-class water polo players can hardly succeed without taking into account their co-adaptive variability in throwing behavior at the (sub-) collective level of action [47]. By linking movement, biomechanical, and situational tactical information, which was the aim of the present project from the beginning, complex findings could be obtained, which hopefully can be used for a sports science-based training and competition design in water polo [48].
In summary, the following recommendations for training practice can be derived or extracted from the results of the study:
  • The throwing speed (or throwing power) has to be increased or maximized (allowing for an indirect increase in precision, since the higher hit rates tend to be achieved with submaximal throws).
  • An improved player’s footwork enables to exert local dominance that is to optimize the spatial position quickly during the catch and the throwing actions, and to control larger spaces on the pitch.

Supplementary Materials

An exemplary high-speed video of a goal shot is available online at https://www.mdpi.com/article/10.3390/app12031298/s1, Video S1: Goal shot.

Author Contributions

Conceptualization, A.H., S.H. and D.H.; methodology and analysis, S.H. and A.H.; software, S.H.; writing–original draft preparation, S.H. and A.H.; writing—review and editing, D.H. and A.H.; visualization, S.H.; supervision and project administration, A.H. and S.H.; funding acquisition, A.H. and D.H. All authors have read and agreed to the published version of the manuscript.

Funding

This research was funded by Bundesinstitut für Sportwissenschaft (BISp; grant number: ZMVI4-072029/18-19).

Institutional Review Board Statement

The study was conducted according to the guidelines of the Declaration of Helsinki. Due to the tournament was a public event we used the public broadcast videos. As well as, the participating nations are allowed to film each other for mutual analysis and to publish it.

Informed Consent Statement

Not applicable—Due to the tournament was a public event the participating nations are allowed to film each other for mutual analysis and to publish it. As the organizer, the DSV even made recordings available to all participating nations.

Data Availability Statement

The data associated with the study are not publicly available but are available from the corresponding author on reasonable request.

Acknowledgments

We thank Steffen Barthel for tracking the videos as well as Kevin Moll, Andreas Richardon and Maximilian Siener for their experimental help during the World Cup in Berlin. We acknowledge support by Deutscher Schwimmverband (DSV) and Steffen Zesner (Zesner Sportberatung) as well as the financial support of the Open Access Publication Fund of the Martin-Luther-University Halle-Wittenberg.

Conflicts of Interest

The authors declare no conflict of interest.

Appendix A. Direct Linear Transformation

The goal of Direct Linear Transformation (DLT; e.g., [49,50,51] is to determine the actual location of the world coordinates ( x , y ) T based on the location of the images coordinates ( u , v ) T . DLT transforms image coordinates of one (or more) cameras to the corresponding world coordinates of a point. Before this can be done, the system must be calibrated with points of known location (calibration points; for 2D-DLT at least six points; Figure A1). More points (for 2D-DLT more than six points) can enhance the estimate of L .
x 1 y 1 1 0 0 0 u 1 x 1 u 1 y 1 0 0 0 x 1 y 1 1 v 1 x 1 v 1 y 1 x 2 y 2 1 0 0 0 u 2 x 2 u 2 y 2 0 0 0 x 2 y 2 1 v 2 x 2 v 2 y 2 x N y N 1 0 0 0 u N x N u N y N 0 0 0 x N y N 1 v N x N v N y N 2 N × 8 · Ł 1 L 2 L 3 L 4 L 5 L 6 L 7 L 8 8 × 1 = u 1 v 1 u 2 v 2 u N v N 2 N × 1
or
A L = B
Figure A1. Exemplary calibration points of one half of the field.
Applsci 12 01298 g0a1
Then, L can be estimates by calibration to:
L = A T A 1 A T B
This results in
L 1 L 7 u L 2 L 8 u L 4 L 7 v L 5 L 8 v Q · x y = u L 3 v L 6 q
or in case of two cameras (with indices L and R for left and right camera, respectively)
L 1 L 7 u L L 2 L 8 u L L 4 L 7 v L L 5 L 8 v L R 1 R 7 u R R 2 R 8 u R R 4 R 7 v R R 5 R 8 v R Q · x y = u L L 3 v L L 6 u R R 3 v R R 6 q
Rearrange to the world coordinates ( x , y ) T is:
x y = Q T Q 1 Q T q

References

  1. Alcaraz, P.E.; Abraldes, J.A.; Ferragut, C.; Rodríguez, N.; Argudo, F.M.; Vila, H. Throwing velocities, anthropometric characteristics, and efficacy indices of women’s European water polo subchampions. J. Strength Cond. Res. 2011, 25, 3051–3058. [Google Scholar] [CrossRef] [PubMed]
  2. Alcaraz, P.E.; Abraldes, J.A.; Ferragut, C.; Vila, H.; Rodríguez, N.; Argudo, F.M. Relationship between characteristics of water polo players and efficacy indices. J. Strength Cond. Res. 2012, 26, 1852–1857. [Google Scholar] [CrossRef] [PubMed] [Green Version]
  3. Özkol, M.Z.; Turunç, S.; Dopsaj, M. Water polo shots notational analysis according to player positions. Int. J. Perform. Anal. Sport 2013, 13, 734–749. [Google Scholar] [CrossRef]
  4. García-Marín, P.; Iturriaga, F.M.A. Water polo: Technical and tactical shot indicators between winners and losers according to the final score of the game. Int. J. Perform. Anal. Sport 2017, 17, 334–349. [Google Scholar] [CrossRef]
  5. Davis, T.; Blanksby, B.A. A cinematographic analysis of the overhand water polo throw. J. Sport. Med. Phys. Fit. 1977, 17, 5–16. [Google Scholar]
  6. Elliott, B.C.; Armour, J. The penalty throw in water polo: A cinematographic analysis. J. Sport Sci. 1988, 6, 103–114. [Google Scholar] [CrossRef]
  7. Newell, K. Constraints on the development of coordination. In Motor Development in Children: Aspects of Coordination and Control; Martinus Nijhoff Publishers: Dordrecht, The Netherlands; Boston, MA, USA; Lancaster, UK, 1986; pp. 340–341. [Google Scholar]
  8. Renshaw, I.; Chow, J.Y.; Davids, K.; Hammond, J. A constraints-led perspective to understanding skill acquisition and game play: A basis for integration of motor learning theory and physical education praxis? Phys. Educ. Sport Pedagog. 2010, 15, 117–137. [Google Scholar] [CrossRef] [Green Version]
  9. Glazier, P.S. Game, Set and Match? Substantive Issues and Future Directions in Performance Analysis. Sport. Med. 2010, 40, 625–634. [Google Scholar] [CrossRef]
  10. Cutino, P.J.; Bledsoe, D.R. Polo: The Manual for Coach and Player; Swimming World: Los Angeles, CA, USA, 1976. [Google Scholar]
  11. Hohmann, A.; Dartsch, R.; Weissinger, P.; Hohenstein, D. Rahmentrainingskonzeption Wasserball; Deutscher Schwimm-Verband: Kassel, Germany, 2010. [Google Scholar]
  12. Nitzkowski, M. Water Polo: Learning and Teaching the Basics; Water Polo Consulting Service: Huntington Beach, CA, USA, 1998. [Google Scholar]
  13. Hohmann, A. Grundlagen der Wasserballtechnik. In Lehrplan Schwimmen. Band 1: Grundlagen der Technik; Ungerechts, B., Freitag, W., Volck, G., Eds.; Hofmann: Schorndorf, Germany, 2002; pp. 157–186. [Google Scholar]
  14. Hohmann, A.; Martin, L.; Letzelter, M. Einführung in die Trainingswissenschaft, 8th ed.; Wimpert Verlag: Wiebelsheim, Germany, 2020. [Google Scholar]
  15. Smith, H.K. Applied physiology of water polo. Sport. Med. 1998, 26, 317–334. [Google Scholar] [CrossRef]
  16. Darras, N.G. Maximum shooting velocity in water polo direct shot and shot with feints of the international level athletes participating in the 10th FINA World Cup. In Biomechanics and Medicine in Swimming VII; Keskinen, K., Komi, P., Hollander, A., Eds.; Gummerus Printing: Jyväskylä, Finland, 1999; pp. 185–190. [Google Scholar]
  17. De Siati, F.; Laffaye, G.; Gatta, G.; Dello Iacono, A.; Ardigò, L.P.; Padulo, J. Neuromuscular and technical abilities related to age in water-polo players. J. Sport. Sci. 2016, 34, 1466–1472. [Google Scholar] [CrossRef]
  18. Platanou, T.; Varamenti, E. Relationships between anthropometric and physiological characteristics with throwing velocity and on water jump of female water polo players. J. Sport. Med. Phys. Fit. 2011, 51, 185. [Google Scholar]
  19. Lupo, C.; Tessitore, A.; Minganti, C.; Capranica, L. Notational analysis of elite and sub-elite water polo matches. J. Strength Cond. Res. 2010, 24, 223–229. [Google Scholar] [CrossRef] [PubMed]
  20. Stevens, H.B.; Brown, L.E.; Coburn, J.W.; Spiering, B.A. Effect of swim sprints on throwing accuracy and velocity in female collegiate water polo players. J. Strength Cond. Res. 2010, 24, 1195–1198. [Google Scholar] [CrossRef] [PubMed]
  21. Uljevic, O.; Spasic, M.; Sekulic, D. Sport-specific motor fitness tests in water polo: Reliability, validity and playing position differences. J. Sport. Sci. Med. 2013, 12, 646. [Google Scholar]
  22. Melchiorri, G.; Viero, V.; Triossi, T.; De Sanctis, D.; Padua, E.; Salvati, A.; Galvani, C.; Bonifazi, M.; Del Bianco, R.; Tancredi, V. Water polo throwing velocity and kinematics: Differences between competitive levels in male players. J. Sport. Med. Phys. Fit. 2015, 55, 1265–1271. [Google Scholar]
  23. Headrick, J.; Davids, K.; Renshaw, I.; Araújo, D.; Passos, P.; Fernandes, O. Proximity-to-goal as a constraint on patterns of behaviour in attacker–defender dyads in team games. J. Sport. Sci. 2012, 30, 247–253. [Google Scholar] [CrossRef] [Green Version]
  24. Vilar, L.; Araújo, D.; Davids, K.; Travassos, B.; Duarte, R.; Parreira, J. Interpersonal coordination tendencies supporting the creation/prevention of goal scoring opportunities in futsal. Eur. J. Sport Sci. 2014, 14, 28–35. [Google Scholar] [CrossRef]
  25. Esteves, P.T.; Araújo, D.; Vilar, L.; Travassos, B.; Davids, K.; Esteves, C. Angular relationships regulate coordination tendencies of performers in attacker–defender dyads in team sports. Hum. Mov. Sci. 2015, 40, 264–272. [Google Scholar] [CrossRef]
  26. Davids, K.; Araújo, D.; Seifert, L.; Orth, D. Expert performance in sport: An ecological dynamics perspective. In Routledge Handbook of Sport Expertise; Routledge: Abingdon, UK, 2015; pp. 130–144. [Google Scholar]
  27. Ramos, J.; Lopes, R.J.; Marques, P.; Araújo, D. Hypernetworks reveal compound variables that capture cooperative and competitive interactions in a soccer match. Front. Psychol. 2017, 8, 1379. [Google Scholar] [CrossRef] [Green Version]
  28. Platanou, T.; Botonis, P. Throwing accuracy of water polo players of different training age and fitness levels in a static position and after previous swimming. In Proceedings of the XIth International Symposium for Biomechanics and Medicine in Swimming, Oslo, Norway, 16–19 June 2010; pp. 281–283. [Google Scholar]
  29. Memmert, D.; Raabe, D. Revolution im Profifußball; Springer: Berlin/Heidelberg, Germany, 2017. [Google Scholar]
  30. Winter, C.; Pfeiffer, M. Quantitative Spielanalyse–den Überblick bei zunehmender Heterogenität der Ansätze behalten. Ger. J. Exerc. Sport Res. 2020, 50, 51–59. [Google Scholar] [CrossRef]
  31. Erdmann, R.; Willimczik, K. Beobachtung. In Forschungsmethoden der Sportwissenschaft; Singer, R., Willimczik, K., Eds.; Limpert: Bad Homburg, Germany, 1978; pp. 9–48. [Google Scholar]
  32. Bortz, J.; Döring, N. Forschungsmethoden und Evaluation für Human-und Sozialwissenschaftler: Limitierte Sonderausgabe; Springer: Berlin/Heidelberg, Germany, 2007. [Google Scholar]
  33. Argudo, F.M.; Ruiz-Barquín, R.; Borges, P.J. The effects of modifying the distance of the penalty shot in water polo. J. Hum. Kinet. 2016, 54, 127. [Google Scholar] [CrossRef] [PubMed] [Green Version]
  34. Laakso, T.; Travassos, B.; Liukkonen, J.; Davids, K. Field location and player roles as constraints on emergent 1-vs.-1 interpersonal patterns of play in football. Hum. Mov. Sci. 2017, 54, 347–353. [Google Scholar] [CrossRef] [PubMed]
  35. Botonis, P.G.; Toubekis, A.G.; Terzis, G.D.; Geladas, N.D.; Platanou, T.I. Performance decrement and skill deterioration during a water polo game are linked with the conditioning level of the athletes. J. Strength Cond. Res. 2016, 30, 1033–1041. [Google Scholar] [CrossRef] [PubMed]
  36. Ferragut, C.; Vila, H.; Abraldes, J.A.; Argudo, F.; Rodriguez, N.; Alcaraz, P.E. Relationship among maximal grip, throwing velocity and anthropometric parameters in elite water polo players. J. Sport. Med. Phys. Fit. 2011, 51, 26–32. [Google Scholar]
  37. Olivier, N.; Daussin, F.N. Relationships between Isokinetic Shoulder Evaluation and Fitness Characteristics of Elite French Female Water-Polo Players. J. Hum. Kinet. 2018, 64, 5–11. [Google Scholar] [CrossRef] [Green Version]
  38. Yaghoubi, M.; Moghadam, A.; Khalilzadeh, M.A.; Shultz, S.P. Electromyographic analysis of the upper extremity in water polo players during water polo shots. Int. Biomech. 2014, 1, 15–20. [Google Scholar] [CrossRef] [Green Version]
  39. Hams, A.H.; Evans, K.; Adams, R.; Waddington, G.; Witchalls, J. Throwing performance in water polo is related to in-water shoulder proprioception. J. Sport. Sci. 2019, 37, 2588–2595. [Google Scholar] [CrossRef]
  40. Uljevic, O.; Esco, M.R.; Sekulic, D. Reliability, validity, and applicability of isolated and combined sport-specific tests of conditioning capacities in top-level junior water polo athletes. J. Strength Cond. Res. 2014, 28, 1595–1605. [Google Scholar] [CrossRef]
  41. Royal, K.A.; Farrow, D.; Mujika, I.; Halson, S.L.; Pyne, D.; Abernethy, B. The effects of fatigue on decision making and shooting skill performance in water polo players. J. Sport. Sci. 2006, 24, 807–815. [Google Scholar] [CrossRef]
  42. Seifert, L.; Button, C.; Davids, K. Key properties of expert movement systems in sport. Sport. Med. 2013, 43, 167–178. [Google Scholar] [CrossRef]
  43. Castellano, J.; Silva, P.; Usabiaga, O.; Barreira, D. The influence of scoring targets and outer-floaters on attacking and defending team dispersion, shape and creation of space during small-sided soccer games. J. Hum. Kinet. 2016, 51, 153. [Google Scholar] [CrossRef] [PubMed] [Green Version]
  44. Passos, P.; Milho, J.; Fonseca, S.; Borges, J.; Araújo, D.; Davids, K. Interpersonal distance regulates functional grouping tendencies of agents in team sports. J. Mot. Behav. 2011, 43, 155–163. [Google Scholar] [CrossRef]
  45. Hughes, M.D.; Bartlett, R.M. The use of performance indicators in performance analysis. J. Sport. Sci. 2002, 20, 739–754. [Google Scholar] [CrossRef] [PubMed]
  46. Riley, M.A.; Richardson, M.; Shockley, K.; Ramenzoni, V.C. Interpersonal synergies. Front. Psychol. 2011, 2, 38. [Google Scholar] [CrossRef] [PubMed] [Green Version]
  47. Passos, P.; Araújo, D.; Davids, K. Competitiveness and the Process of Co-adaptation in Team Sport Performance. Front. Psychol. 2016, 7, 1562. [Google Scholar] [CrossRef] [Green Version]
  48. Sarmento, H.; Clemente, F.M.; Araújo, D.; Davids, K.; McRobert, A.; Figueiredo, A. What performance analysts need to know about research trends in association football (2012–2016): A systematic review. Sport. Med. 2018, 48, 799–836. [Google Scholar] [CrossRef]
  49. Adbel-Aziz, Y.; Karara, H. Direct linear transformation from comparator coordinates into object space coordinates in close-range photogrammetry. Photogramm. Eng. Remote Sens. 1971, 81, 103–107. [Google Scholar] [CrossRef]
  50. Kwon, Y. Kwon3d Motion Analysis Package 2.1 User’s Reference Manual; V-TEK Corporation: Anyang, Korea, 1994. [Google Scholar]
  51. Rossi, M.M.; Silvatti, A.P.; Dias, F.A.; Barros, R.M. Improved accuracy in 3D analysis using DLT after lens distortion correction. Comput. Methods Biomech. Biomed. Eng. 2015, 18, 993–1002. [Google Scholar] [CrossRef]
Figure 1. The constraints-led approach of technical education in sport (based on [7,8,9]).
Applsci 12 01298 g001
Figure 2. (a) Experimental setup: two cameras filmed the games 13 m above the water surface. (b) The smaller camera GoPro (right side) and the high-speed camera on the left side.
Applsci 12 01298 g002
Figure 3. Definition of the Voronoi-cells exemplary for the right defender. The red lines represent the connection line between both players. The borders are the dashed black lines which are perpendicular to the red connection lines at the half distance between two players. The intersection of all these boundary lines (black dashes lines) or the boundary of the field creates the Voronoi-cell (delimited by the green line) associated with the player [29].
Applsci 12 01298 g003
Figure 4. The different hit rates (a) for the four typical team attack phases ( F 3 ; 1473 = 38.51; p < 0.001; Bonferroni post-hoc, p < 0.05) and (b) for the six different shot techniques.
Applsci 12 01298 g004
Figure 5. Overall hit rates of all players participating in the water polo World Cup Final 2018 in the different target zones of the water polo goal (separated for (a) position attack and (b) man-up attack situation of the team).
Applsci 12 01298 g005
Figure 6. Exemplary temporal ball speed (at time t3, leaving the hand) at goal completion using drive shot.
Applsci 12 01298 g006
Figure 7. (a) Hit rates of the eight nations participating in the 2018 World Cup Final (in order of tournament placement). (b) Team comparison of ball speed (at time t3, leaving hand; F 7 ; 185 = 7.00 ; p < 0.001) during goal completion with drive shot.
Applsci 12 01298 g007
Figure 8. Partial collective tactical analysis of selected characteristics of attacking behavior during goal completion with Cohens’ d and significances (☆ stands for p < 0.05 and for p < 0.01), separated into positional and man-up attack including following conditions: (1) drive shot or bounce shot, (2) free shot, (3) direct and feint shots and (4) without shot faults.
Applsci 12 01298 g008
Figure 9. Collective-tactical analysis of the space control during goal throw for the (a) defending and (b) attacking team defined as the team sum of the individually controlled areas by the six team members (Voronoi-cells within a 15 m × 8 m defined rectangle in front of the goal with Cohens’ d and significances: ☆ stands for p < 0.05 and for p < 0.01).
Applsci 12 01298 g009
Figure 10. Exemplary collective space control for offense and defense visualized by Voronoi-cells separated in attacking (gray) and defensing (red) zones with the corresponding space control areas A A T T and A D E F (within the preliminary round game CRO-USA). (a) CRO attacks scoring a goal. (b) USA attacks not scoring a goal.
Applsci 12 01298 g010
Table 1. Observed categories (and its different characteristics) of goal shot behavior in the water polo World Cup 2018 in Berlin.
Category123456789
PlayerNumber 1–13
Player handednessRightLeft
AttackFast break attackPosition attackMan-up attackPenalty
Shot positionRight wingCenterLeft wingLeft backMid backRight back
Shot zoneMid 0–2 mLeft 0–2 mRight 0–2 mMid 2–6 mMid 2–6 mLeft 2–6 mMid +6 mLeft +6 mRight +6 m
Shot techniqueDrive shotBounce shotLob shotBackhand shotTip-InPull shotPush shotHay-maker shotSelf Tip-In
Technical variantFeint shotDirect shotPass feint shotTurn shot
Shot targetLeft highMid highRight highLeft middleMid middleRight middleLeft lowRight lowMid low
Shot situationFree shotPressed shotRule shot
Shot movementNeutral shotJump shot to hand sideJump shot against hand sideShot by wrist movement only
Shot executionNo faultCatch faultGrab faultClamp shotSlip shot
Shot resultGoalSavedOutBlockedWater
Table 2. Overview of the used point of times/phases.
Point of TimeAction
t1Release of the assisting pass
t2Receive of the ball by the shooter
t3Release of the ball by the shooter (goal shot)
t4Ball crosses the goal line (or was blocked)
Table 3. Ball speeds during goal throw with drive shot at time t3 (leaving hand), only for direct and bounced, unimpeded drive shots without technique faults, from a distance of at least 6 m and with ball speeds higher than 17 ms 1 .
NationnBall Speeds (ms 1 )
MeanSDMin.Max.
Hungary2922.921.7319.1426.34
Australia1722.551.3419.7524.70
Serbia3221.462.4217.1327.32
Germany2221.381.7718.3925.29
Croatia3221.451.5217.4023.85
USA2422.151.6018.1624.83
Japan2520.041.3017.0021.86
South Africa1220.751.2517.6922.38
Total19321.621.9017.1327.32
Publisher’s Note: MDPI stays neutral with regard to jurisdictional claims in published maps and institutional affiliations.

