Article

A Two-Step Process for Improved Biomass Production and Non-Destructive Astaxanthin and Carotenoids Accumulation in Haematococcus pluvialis

1
Institut des Substances et Organismes de la Mer–ISOMer UR 2160, Faculté des Sciences et des Techniques, Université de Nantes, 44322 Nantes, France
2
Scottish Association for Marine Science (SAMS), Scottish Marine Institute, Oban, Argyll PA37 1QA, UK
3
Laboratory of Algal and Plant Physiology, Dipartimento di Scienze della Vita e dell’Ambiente, Università Politecnica delle Marche, Via Brecce Bianche, 60131 Ancona, Italy
*
Author to whom correspondence should be addressed.
Appl. Sci. 2022, 12(3), 1261; https://doi.org/10.3390/app12031261
Submission received: 29 November 2021 / Revised: 14 January 2022 / Accepted: 21 January 2022 / Published: 25 January 2022
(This article belongs to the Special Issue Advances in Microalgal Biomass Productions)

Abstract

:
Carotenoids extracted from microalgae have a considerable economic interest in numerous high-value markets. Natural astaxanthin has gained much interest in its powerful antioxidant properties, however, its commercial-scale production is still challenging. In this study, a simple and economical way to cultivate Haematococcus pluvialis (CCAP 34/1D) by a two-step process was investigated by exploring alternative strategies to maximise algal growth and astaxanthin yield. During the first step—improving biomass production—four nitrogen sources were tested (NH4Cl, NaNO3, Fe(III)NO3, and urea). The second step—carotenogenesis induction—was achieved by using a mix of moderate stressors that worked in synergy (i.e., mild light, nitrogen limitation, the addition of sodium acetate at 0.25% w/v), thereby minimising potential losses of the accumulated biomass caused, for example, by photobleaching or nitrogen starvation. Results showed that urea was the nitrogen source, allowing the highest cell density and growth rate. In terms of carotenogenesis induction, the use of mild stressors resulted in three out of four treatments having a relative increase in cell number (13.8–26.7%) and a concomitant increase in astaxanthin yield. Simple low-cost strategies, such as small adjustments to media recipes and synergism between mild stressors, could bring a disproportionate effect on the future successes of making algal biotechnology a widespread reality.

1. Introduction

Synthetic carotenoids are ubiquitously available since they can be rapidly produced using inexpensive chemicals, therefore reducing the production costs associated with cultivating, harvesting, and extracting from a living organism [1]. Although synthetic carotenoids, including synthetically produced astaxanthin (S-AX), are more abundant on the market, and faster and cheaper to produce, their health-promoting and antioxidant properties are not as effective as their natural counterparts, hence making them a less desirable product. Astaxanthin is a powerful natural antioxidant. It can be extracted from krill, yeasts, marine bacteria, and microalgae (e.g., Chlorella zofingiensis, Chlorococcum sp.) [2,3]. The most common source of natural astaxanthin (N-AX) on the market is derived from the freshwater microalgae Haematococcus pluvialis [4]. The natural form of astaxanthin has a stronger antioxidant activity. The final product composition also differs in the two forms: natural astaxanthin (N-AX) can potentially carry other carotenoids (i.e., β-carotene, lutein, and canthaxanthin) [5], bringing additional value to the market, while the S-AX contains synthetic astaxanthin and potentially synthesises intermediates with unknown effects [6,7]. For this reason, S-AX is still not currently permitted for human consumption [8], however, it is approved by the European Food Safety Authority (EFSA) and the United States Food and Drug Administration (US FDA) as an aquaculture feed additive.
The enhanced performance of natural astaxanthin compared to synthetic variants has made it a much more in-demand and valuable product. Currently, the market value of astaxanthin, depending on products’ purity, varies from $2500 for S-AX and >$7000 kg for N-AX derived from H. pluvialis [8,9,10]. The global market demand for both forms is estimated to exceed $880 million by 2026 and a compound annual growth rate (CAGR) of 8.2% by 2027 [11]. Furthermore, N-AX production accounts for less than 5%, of which only less than 1% is H. pluvialis derived [12]. The high market value is caused by the scarcity of natural astaxanthin due to its difficult production process.
Haematococcus pluvialis has a complex life cycle, undergoing several life stages before encysting and accumulating astaxanthin [13]. It involves different morphotypes: a green vegetative motile cell; a green vegetative palmella cell; a palmella cell with initial astaxanthin accumulation in transition to an aplanospore; and finally, an aplanospore cell with accumulated astaxanthin [14].
H. pluvialis industrial-scale cultivation commonly employs a two-step process: first, it aims to achieve high biomass yields; and secondly, the biomass is exposed to a stressor (e.g., high light) to induce carotenogenesis and hence the accumulation of astaxanthin [13].
In this first step, H. pluvialis is conventionally grown in autotrophy to reduce the risk of biological contamination, and to facilitate better operator control of the transition between green and the red phases.
There has been considerable interest in the research and development of the green phase of H. pluvialis during the past ten years due to the high value of N-AX and the challenges involved in H. pluvialis cultivation. In fact, due to its complexity, any small modification in the cultivation cycle that results in faster growth rates or higher overall biomass/astaxanthin yield can represent a significant economic improvement. The long vegetative growth contributes to the high production costs, especially in terms of nutrient supply. Among nutrients, nitrogen is needed not only for cell growth but also to produce the enzymes that catalyse astaxanthin synthesis and accumulation in H. pluvialis. Microalgae can uptake and assimilate different nitrogen sources (NS), i.e., nitrate, nitrite, ammonium, and urea; nitrogen assimilation utilising urea requires a different set of enzymes from nitrate, nitrite, and ammonium, which share the same metabolic pathway.
The vast majority of studies and industrial application of H. pluvialis cultivation have employed NaNO3 as a nitrogen source. NaNO3, however, is expensive and nitrogen only accounts for 16.5% of the molecular mass of the chemical, against 46% in urea containing two nitrogen atoms. For this reason, urea would be required in lower quantities for an equivalent nitrogen concentration. Attempts to cultivate H. pluvialis in urea commonly fail and H. pluvialis mostly used growth media, and does not provide urea in their formulation [15,16,17]. Deeper investigations and manipulations of the abiotic conditions could establish the use of urea in H. pluvialis growth mediums for cost-effective large-scale production.
The second phase of the two-step cultivation process is the carotenogenesis induction and can be achieved by modulating a few growth parameters: light and N depletion are commonly employed as stressors, and iron addition and osmotic stress may also enhance the accumulation of astaxanthin [18]. The astaxanthin accumulation employing autotrophic growth, however, may not have reached its maximum potential [15,16]. Currently, 4% w/v of astaxanthin accumulation in H. pluvialis is often considered the common threshold for comparative success [19,20]. The main difficulty in applying a stress to the H. pluvialis cells is to find the threshold level which minimises biomass loss and cell bleaching and maximises astaxanthin accumulation. It has been ascertained that high levels of stress, such as a sudden increase in irradiance or nitrogen starvation, may damage cells, decreasing the final biomass yield and the amount of recoverable astaxanthin [21]. For example, high light intensity can lead to photoinhibition [22], while nitrogen depletion affects photosynthesis and cellular metabolism [23,24,25].
In this study, H. pluvialis (CCAP 34/1D) was selected for a two-step cultivation based upon a previously published strain screening by Butler [26]. In our study, an initial optimisation of the growth conditions was carried out for both the green and red phases of the strain CCAP 34/1D: nutrients concentration and pH were manipulated as shown in Supplementary Materials 1. Afterward, different NS were tested to enhance biomass productivity during the green phase of growth.
To induce the red phase, the drawbacks of conventionally applied stringent individual stressors that were mentioned above were considered. We hypothesised that multiple moderate stressors could be simultaneously applied for a possible synergistic effect whilst preserving the biomass accumulated in the green phase.
Based on previous works, a mix of stressors (e.g., combining higher irradiance, salinity, organic carbon sources) were tested (Supplementary Materials 2); the mix of stressors that allowed the highest biomass yield preservation coupled with the greatest accumulation of carotenoids was selected to induce the red phase, i.e., buffered JM medium (without the addition of NaNO3, but retaining the NS from Ca(NO3)2·4H2O and (NH4)6Mo7O24·4H2O modified with the addition of 0.25% (w/v) sodium acetate and exposed to 250 µmol photons m−2 s−1 for 7 days.
The dual purpose of this study is to find a simple low-cost strategy to increase the rate of vegetative growth and biomass accumulation, followed by an enhancement of astaxanthin accumulation without any deleterious effects upon biomass yield. The efficiency of the employed induction method and the pigments’ characterisation was assessed by HPLC analysis in the green and the red phases. The overarching goal was to find an economic and easily implementable manner to cultivate H. pluvialis CCAP 34/1D for astaxanthin production.

2. Materials and Methods

2.1. Cultivation and Growth Conditions

The algal strain Haematococcus pluvialis CCAP 34/1D was obtained from the Culture Collection of Algae and Protozoa (CCAP), at The Scottish Association for Marine Science (SAMS, UK). Cultures were grown in Jaworski’s media (JM) with the pH adjusted to 7.5 ± 0.2 and buffered with 10 mM HEPES. Nitrogen type was varied and supplied as either sodium nitrate, iron (III) nitrate, ammonium chloride, or urea at a final N concentration of 941 µM, equivalent to that of the nitrogen concentration only derived from the sodium nitrate contained original JM recipe.
Starter cultures were maintained in a control temperature (CT) room at 20 °C, under a 16/8 h L/D (light/dark) regime at 75 μmol photon m−2 s−1 photosynthetically active radiation (PAR), without shaking or aeration. Prior to experimentation, cultures underwent a period of acclimation, where they were maintained under experimental conditions, outlined above, for 7 days. After this time, a calculated volume of culture was removed from the pre-acclimated cultures and centrifuged at 3000× g for 15 min, the supernatant discarded and the cell pellet resuspended in 500 mL of media. All experiments were performed in triplicate, with an initial cell density of 4 × 10⁵ cells/mL. Cultures were maintained in conditions outlined above for 15 days, for vegetative growth.

2.2. Carotenogenesis

Astaxanthin production was induced at day 15 (after vegetative growth) by centrifuging the cells, as described above, and resuspending in a modified JM medium: containing 0.25% (w/v) sodium acetate and NaNO3 depleted but with the original concentration of Ca(NO3)2·4H2O (84 µM) and (NH4)6Mo7O24·4H2O (0.8 µM), as described in the JM recipe. Astaxanthin induction was performed for 7 days at the same growth conditions as above, except for the light irradiance which was increased to 250 μmol photon m−2 s−1 PAR.

2.3. Techniques of Enumeration of H. pluvialis and Growth Cell Monitoring

Three different enumeration techniques were employed: the first one by the hemocytometer taking advantage of microscopic observation to count the cells and assess their morphological state at the same time. The other two techniques were cell counting methods which can be useful for repeated cell counts (CASY cell counter) or to follow cells’ growth by measuring the absorbance at the spectrophotometer, which is required while running an experiment with small volumes which cannot be sampled daily or contaminated. For the first two methods, cultures were sampled every day in a Laminar-flow cabinet (MSC advantage, Thermo Scientific). Cellular integrity/health and the degree of encystment were monitored using a hemocytometer; cell enumeration was performed using a CASY cell counter (Casy TT, Roche Innovatis) using a volume of 1 mL or 0.5 mL, depending on the density of the culture, and afterward, diluted in 9 mL of a solution 0.9% NaCl. An analytic volume of 100 μL was measured three times through a 50 μm aperture. When direct counting was not possible, cell enumeration was assessed spectrophotometrically (Heλios Gamma spectrophotometer UV-vis, Thermo Scientific) at 750 nm (OD750), after a linear calibration curve was created between OD750 and cells/mL (Figure S4 in Supplementary Materials 2).

2.4. HPLC Analysis

HPLC analyses were performed on cultures during both their green and red stages of growth. Cultures were harvested on cultivation day 14 (prior to astaxanthin induction) and at day 21 (7 days following induction). In both instances, cells were centrifuged at 3000× g for 15 min; pellets of sub-samples were then flash-frozen in liquid nitrogen, stored at −80 °C, and then freeze-dried (ALPHA 1-2 LD plus freeze dryer, Christ).
The lyophilised biomass was weighed, and the pigments extracted by employing a modified protocol by Sarada (2006) [27]. Briefly, 3 mg of dry weight (DW) biomass was resuspended in 1 mL of 2N HCl and incubated at 70 °C for 2 min. The pigment extraction was facilitated by using glass beads while vortexing (diameter of 0.25–0.5 mm, Roth, Karlsruhe, Germany). Samples were then cooled at −80 °C for five minutes, to exploit the thermic stress to favour the cell breakage. After thawing, samples were then centrifuged at 5000 rpm for 3 min (Thermo Fisher Sorvall Legend X1R Refrigerated Benchtop Centrifuge), the supernatant was removed, and the HCl-treated samples were washed twice in 2 mL deionized water to neutralise the pH, pelletized, and finally resuspended in 1 mL of extraction solvent (95% methanol, buffered with 2% ammonium acetate with the addition of the internal standard) and stored at −20 °C for 15 min. The extraction procedure was repeated until the algal cell debris was almost colourless and several short (30 s) vortexing steps were alternated between each resuspension in the extraction solvent.
Supernatants were collected after centrifugation (5000 rpm, 3 min, at 4 °C) and syringe filtered (porosity, 0.47 um). The extracts were injected into a high-performance liquid chromatography (HPLC) system (Waters Alliance 2695) equipped with a cooled auto-sampler and a photodiode array detector (Waters PDA 2998). Chromatographic separation was carried out using a 4.6 mm × 100 mm column (Sunfire, Waters) equipped with a 3.9 mm × 5 mm pre-column (Sunfire, VanGuard, Waters) for reverse-phase chromatography during a 30 min elution program. The elution gradient was run as follows with solvent A (80/20 v/v methanol and ammonium acetate 1 M) and solvent B (60/40 v/v methanol and acetone); the time gradient was 0 min 80% A, 20% B; 10 min 0% A, 100% B; 20 min 0% A, 100% B; 30 min 80% A, 20% B with a flow rate of 1.0 mL/min and a sample volume of 100 μL [28]. The synthetic carotenoid trans-β-Apo-8′-carotenal (Sigma) was used as an internal standard in each sample to improve the precision of the quantification and to detect eventual instrumental errors.
A chromatographic and spectral library was created from standard pigments (DHI lab, Hørsholm, Denmark). Pigments in the extracts were identified by comparison of chromatographic and spectral data recorded with standard pigments, using Empowered software (Waters). In the absence of the pigment standard, canthaxanthin and carotenoid-like pigments were quantified by the ISTD method (internal standard analysis), relating the ratio of the standard peak area and the pigment peak area to their respective amounts, as the standard concentration did not change. The absorbance spectra (400–800  nm) and retention times were also checked to validate the output given by the software, and the pigments’ concentrations were obtained from the signals in the photodiode array detector at 440  nm [29,30]. For some pigments, concentrations were summed: chlorophyll a and its allomeric and epimer forms. Values are expressed as mean values ± standard error of the triplicates.

2.5. Data Analysis

Algal growth expressed as the specific growth rate (μ) was determined using Equation (1):
μ   (   d 1 ) = ln ( x 1   ) ln ( x 2   ) t 1 t 2  
where x1 and x2 represent the number of cells per mL at the beginning and the end of the log phase, at the days t1 and t2, respectively.
All data were expressed as the mean ± standard deviation (SD) of measurements obtained from three biological replicates (n = 3). The significance of differences among the means of different treatments was determined by one-way or two-way ANOVA (if one or two independent variables were analysed in the treatments) with Tukey’s post hoc analysis (when comparing every mean with every other mean) or Šídák (when comparing sets of means) for multiple comparisons. Levels of significance were set at p < 0.05; all statistical analyses were performed using GraphPad Prism, Version 6.

3. Results

The first part of the study aimed at finding the optimal NS in the JM medium supplemented with HEPES buffer 10 mM for H. pluvialis CCAP 34/1D. In the second part, the same cultures were exposed to moderate stressors (i.e., mild light, nitrogen limitation, and sodium acetate at 0.25% w/v in the modified JM) to investigate if astaxanthin accumulation was induced without a biomass loss.

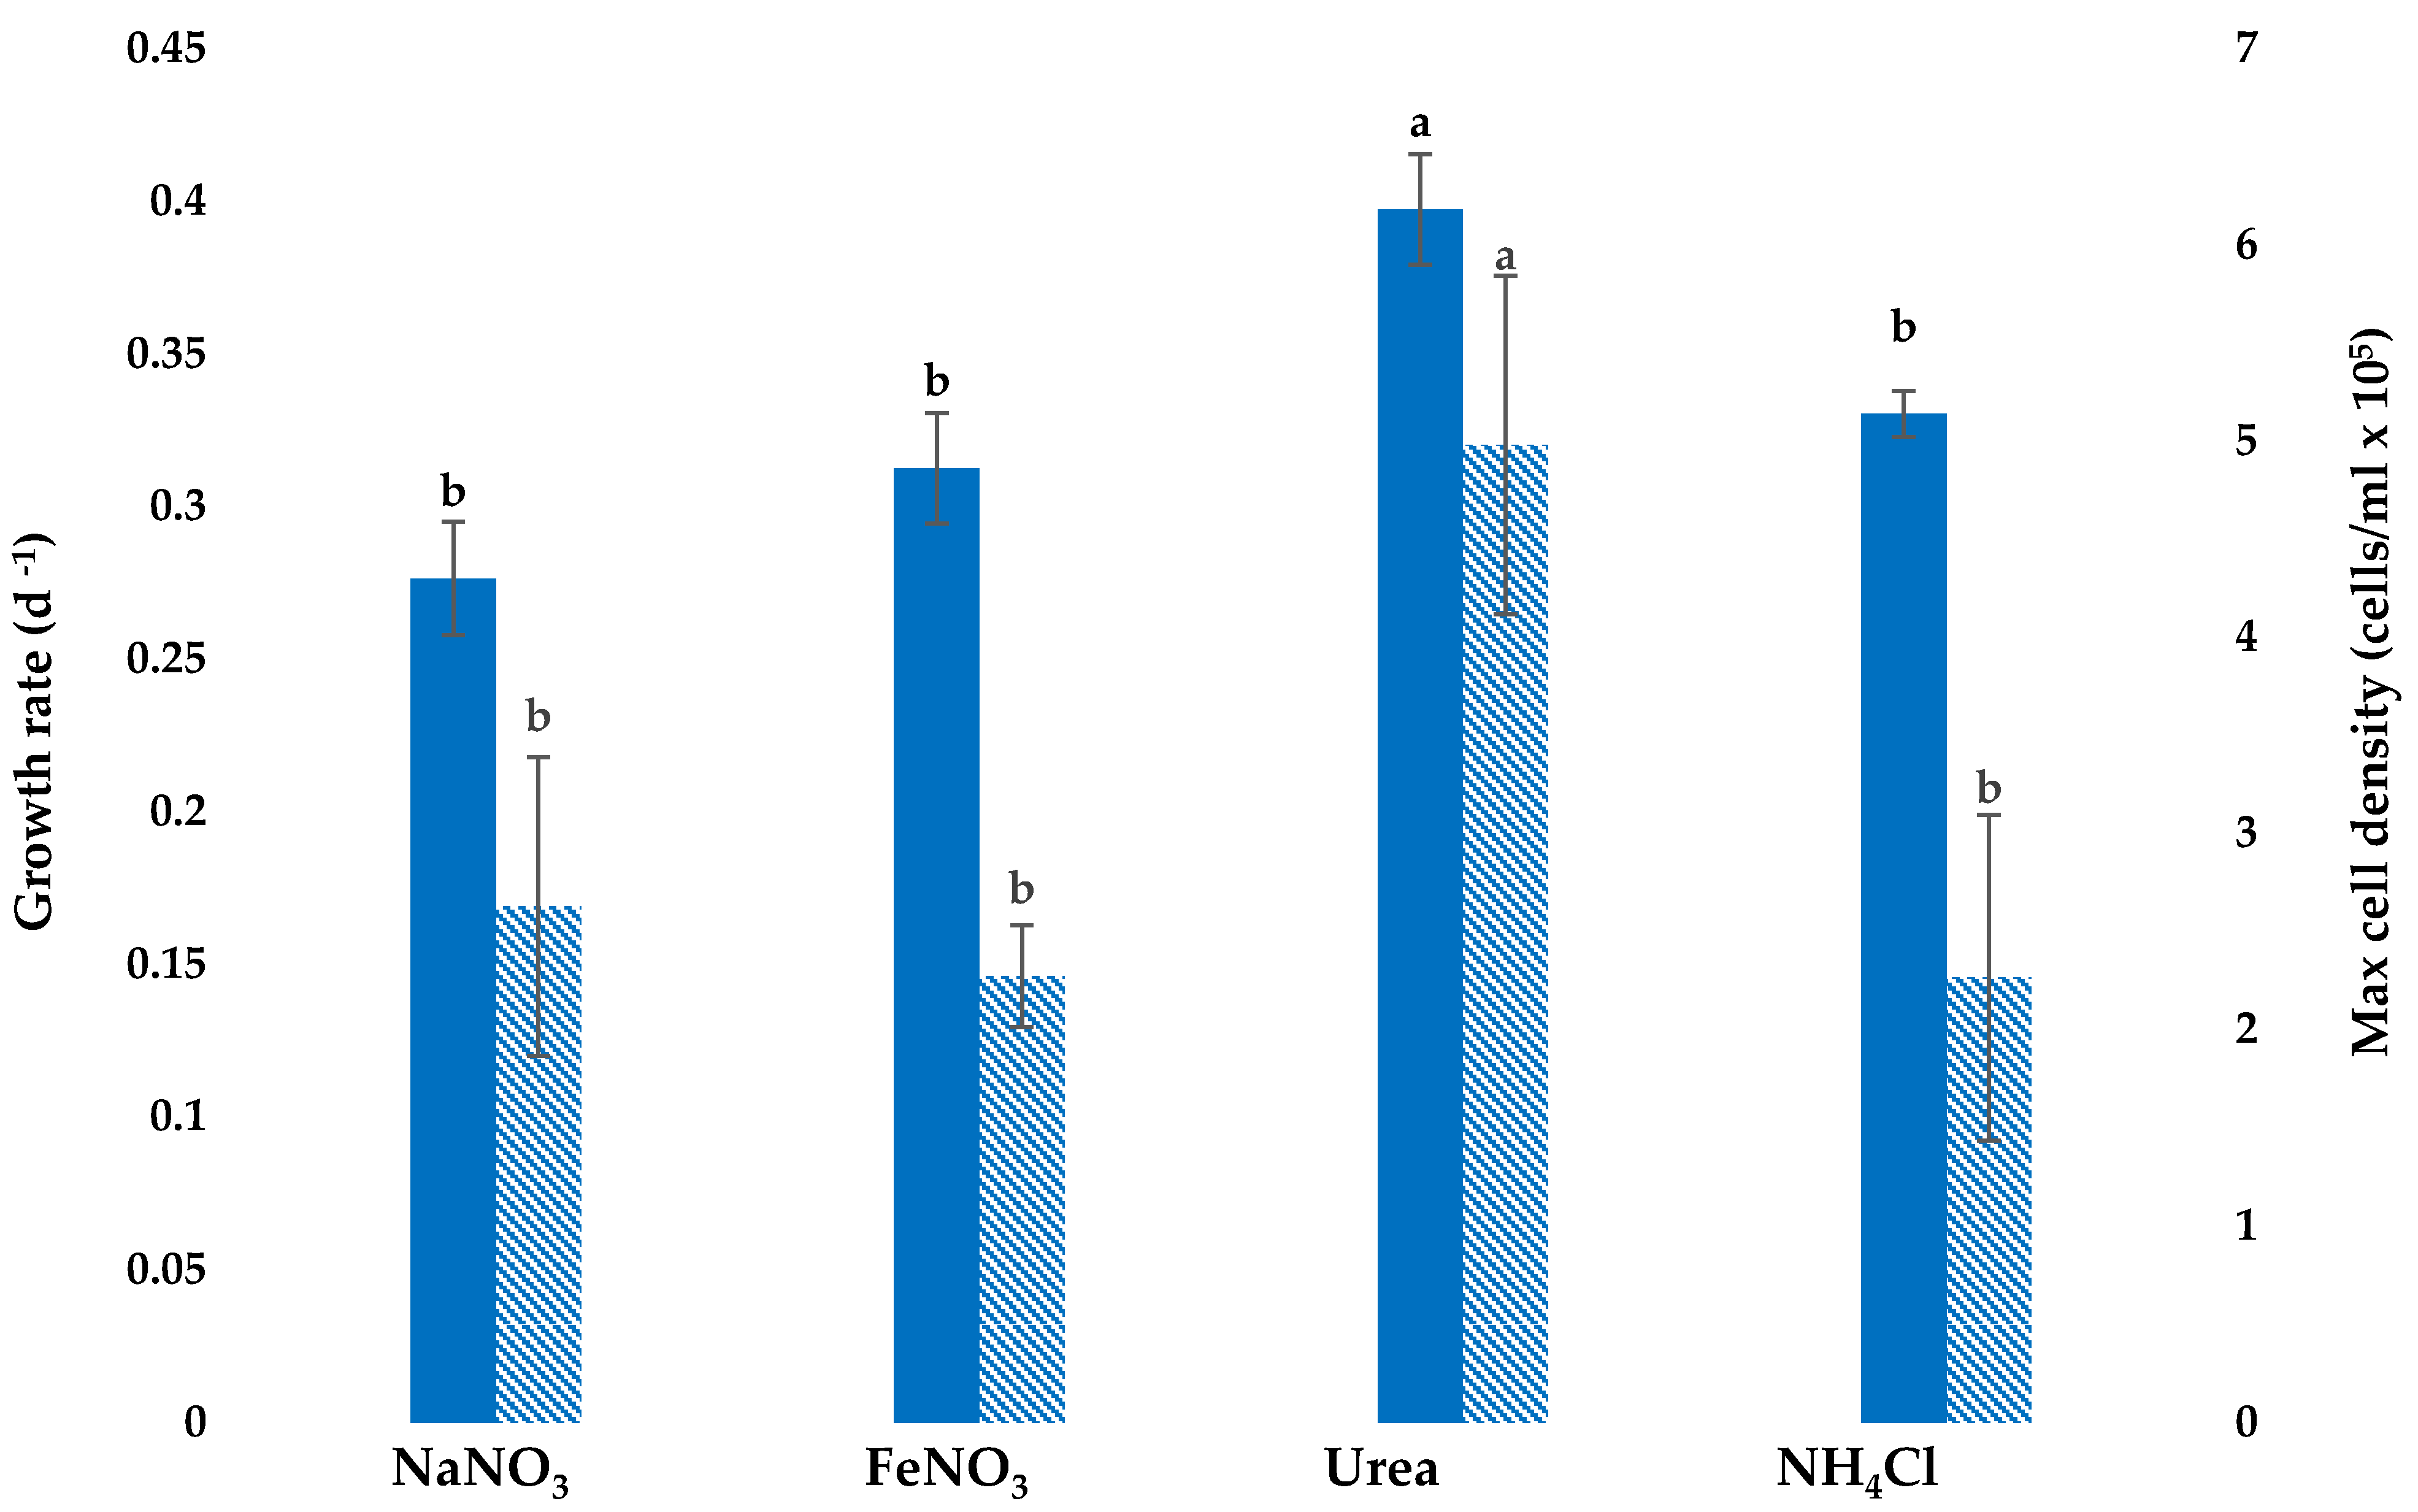
3.1. Growth with Different Nitrogen Sources

The highest growth rate (0.4 ± 0.011) and cell density (4.98 × 10⁵ ± 0.66 cells/mL) were achieved when urea was the sole NS, whereas the lowest growth rate (0.28 ± 0.02 d−1) was found when NaNO3 was supplied, as in standard JM, which may be considered as a positive control (Figure 1). Cultures grown in FeNO3 or NH4Cl showed similar values of growth rate and maximal cell density to those values obtained when cultivated in NaNO3 as the only NS (Figure 1).

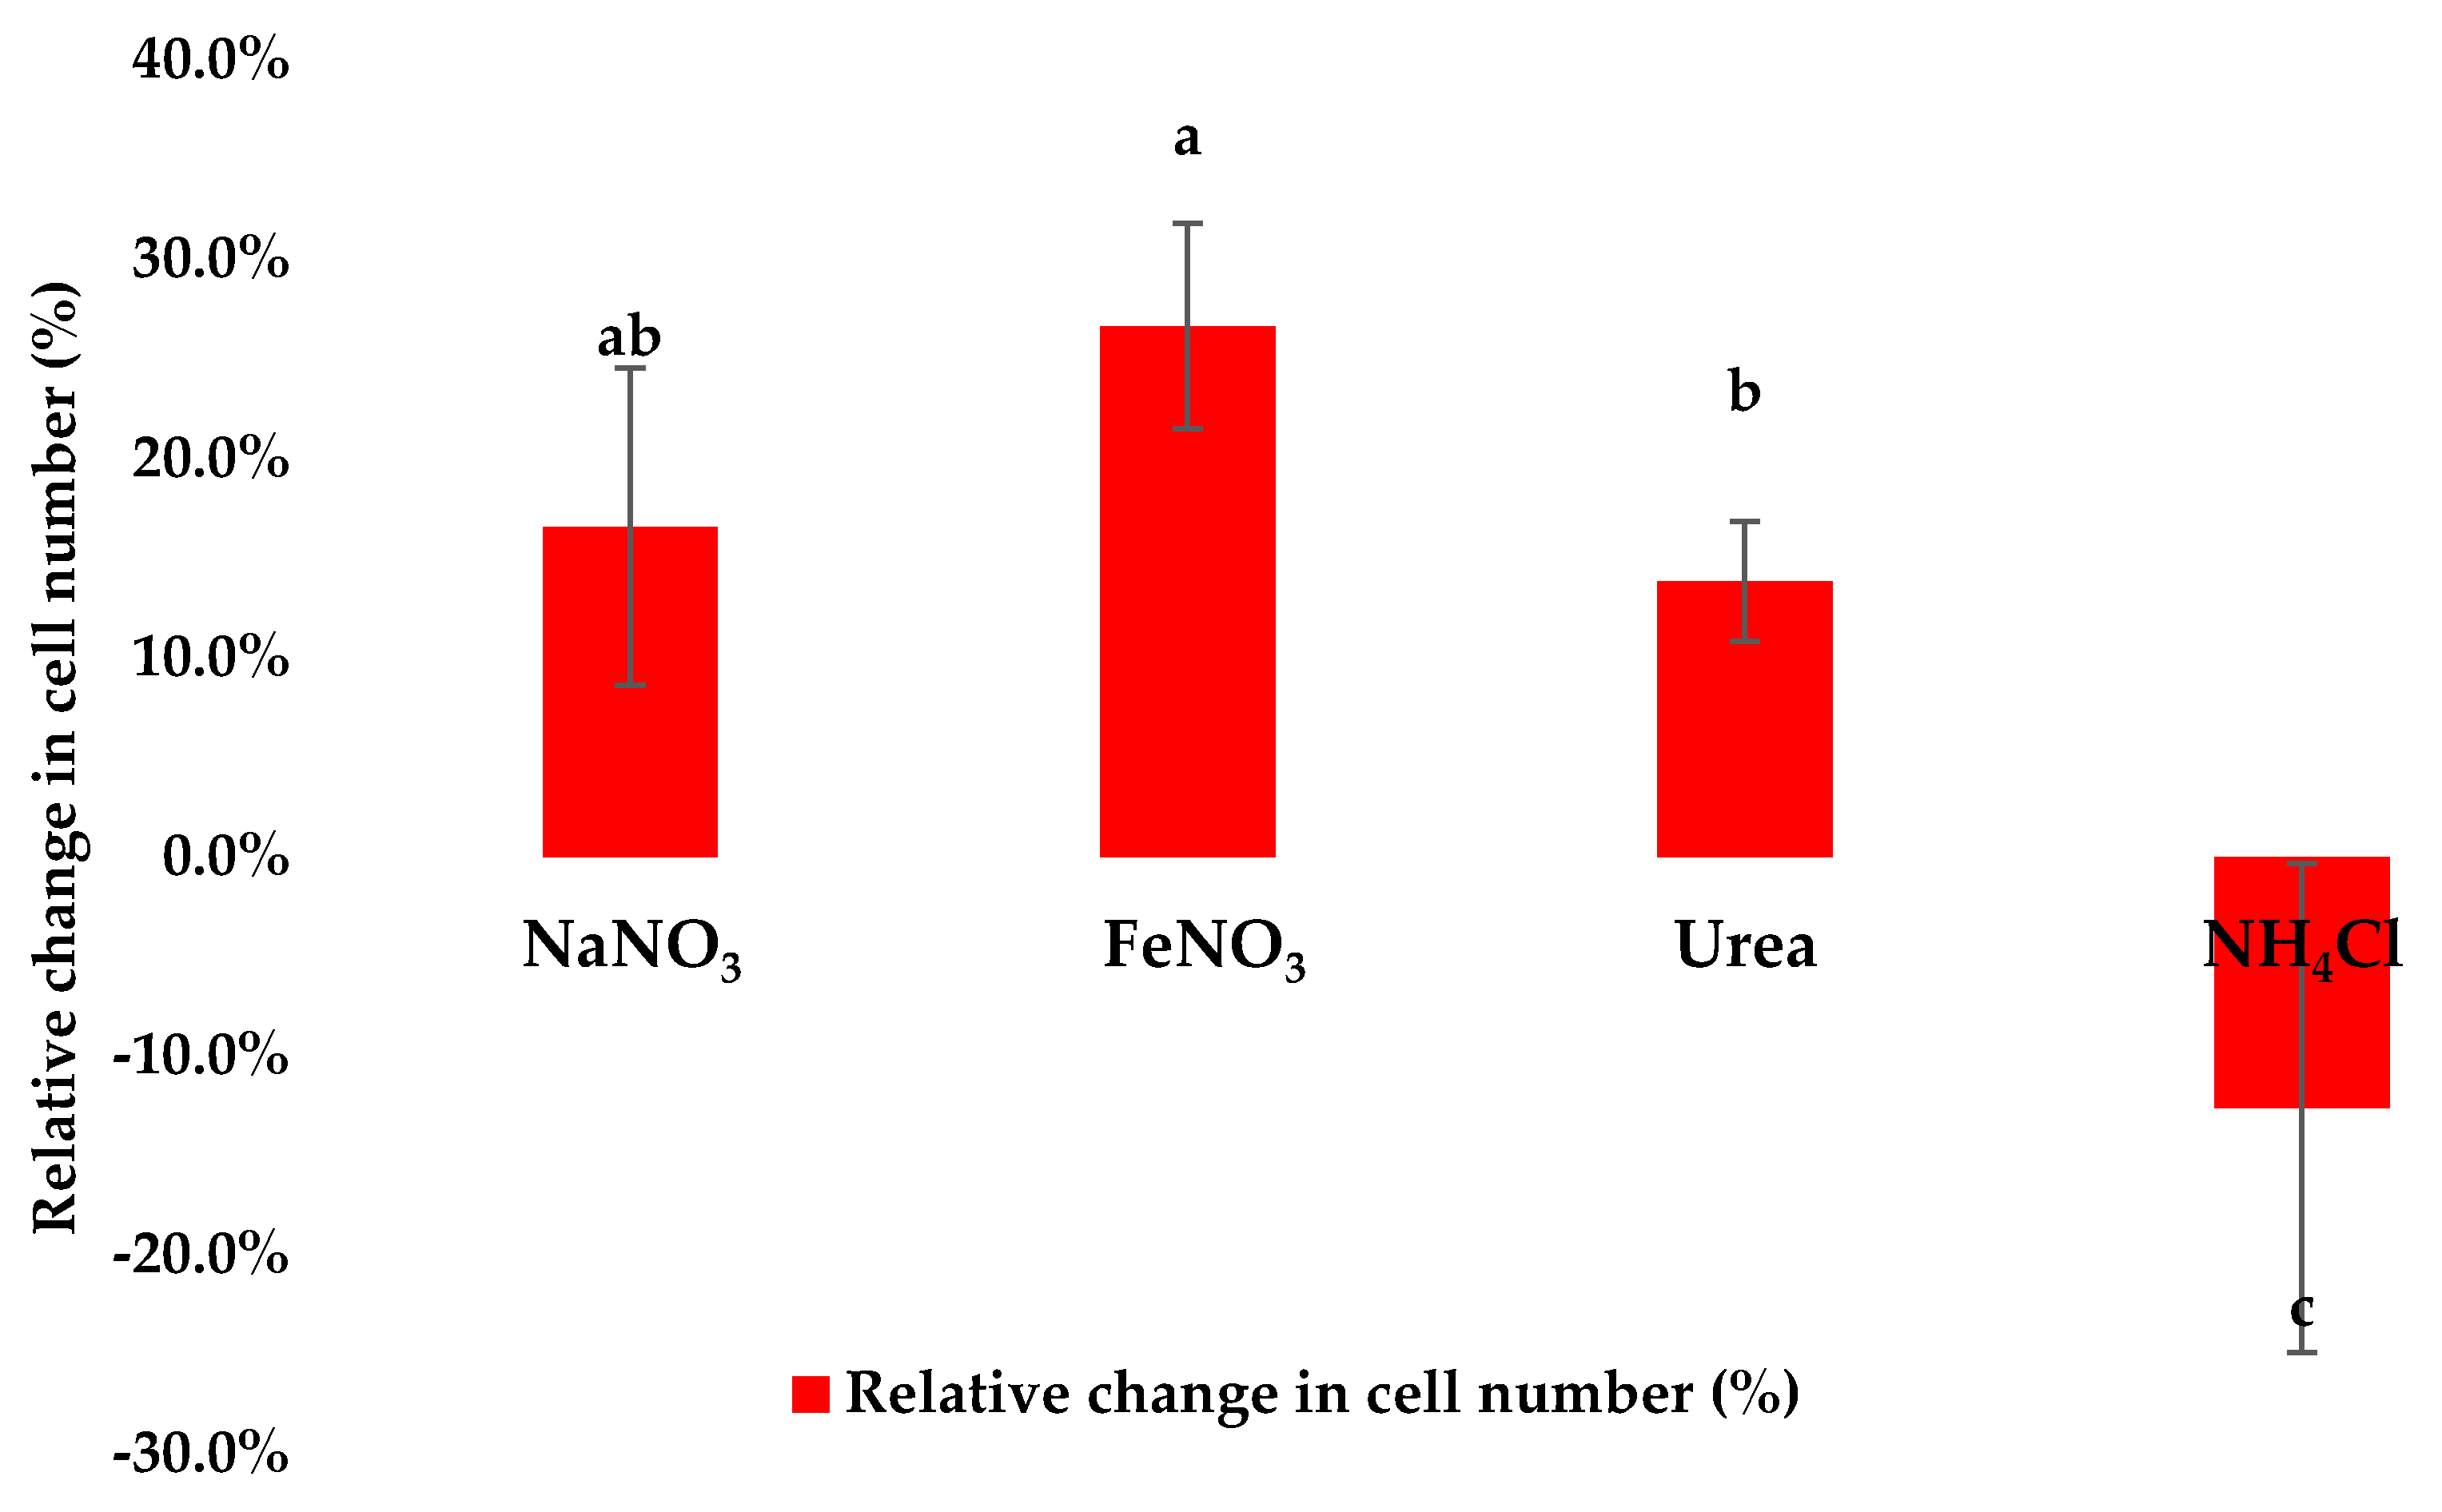
3.2. Assessment of Cell Density Following Application of Stress Conditions

Cultures grown in different NS were harvested and resuspended in the modified JM medium (without the NaNO3 addition, but with the original Ca(NO3)2·4H2O and (NH4)6Mo7O24·4H2O) with the addition of 0.25% (w/v) sodium acetate and exposed to 250 µmol photons m−2 s−1 for 7 days (Supplementary Materials 2).
The cell density increased during the induction process in all the treatments except for the one in NH4Cl (−12.6%), which was statistically different compared to the biomass previously obtained in NaNO3 (p = 0.0084). Although the cell number increase was highest when cells grew in FeNO3 (+26.7%), followed by those in NaNO3 (+16.6%) and urea (+13.8%), the relative change in FeNO3 was significantly greater only when compared to the changes in urea and NH4Cl grown cultures (Figure 2).

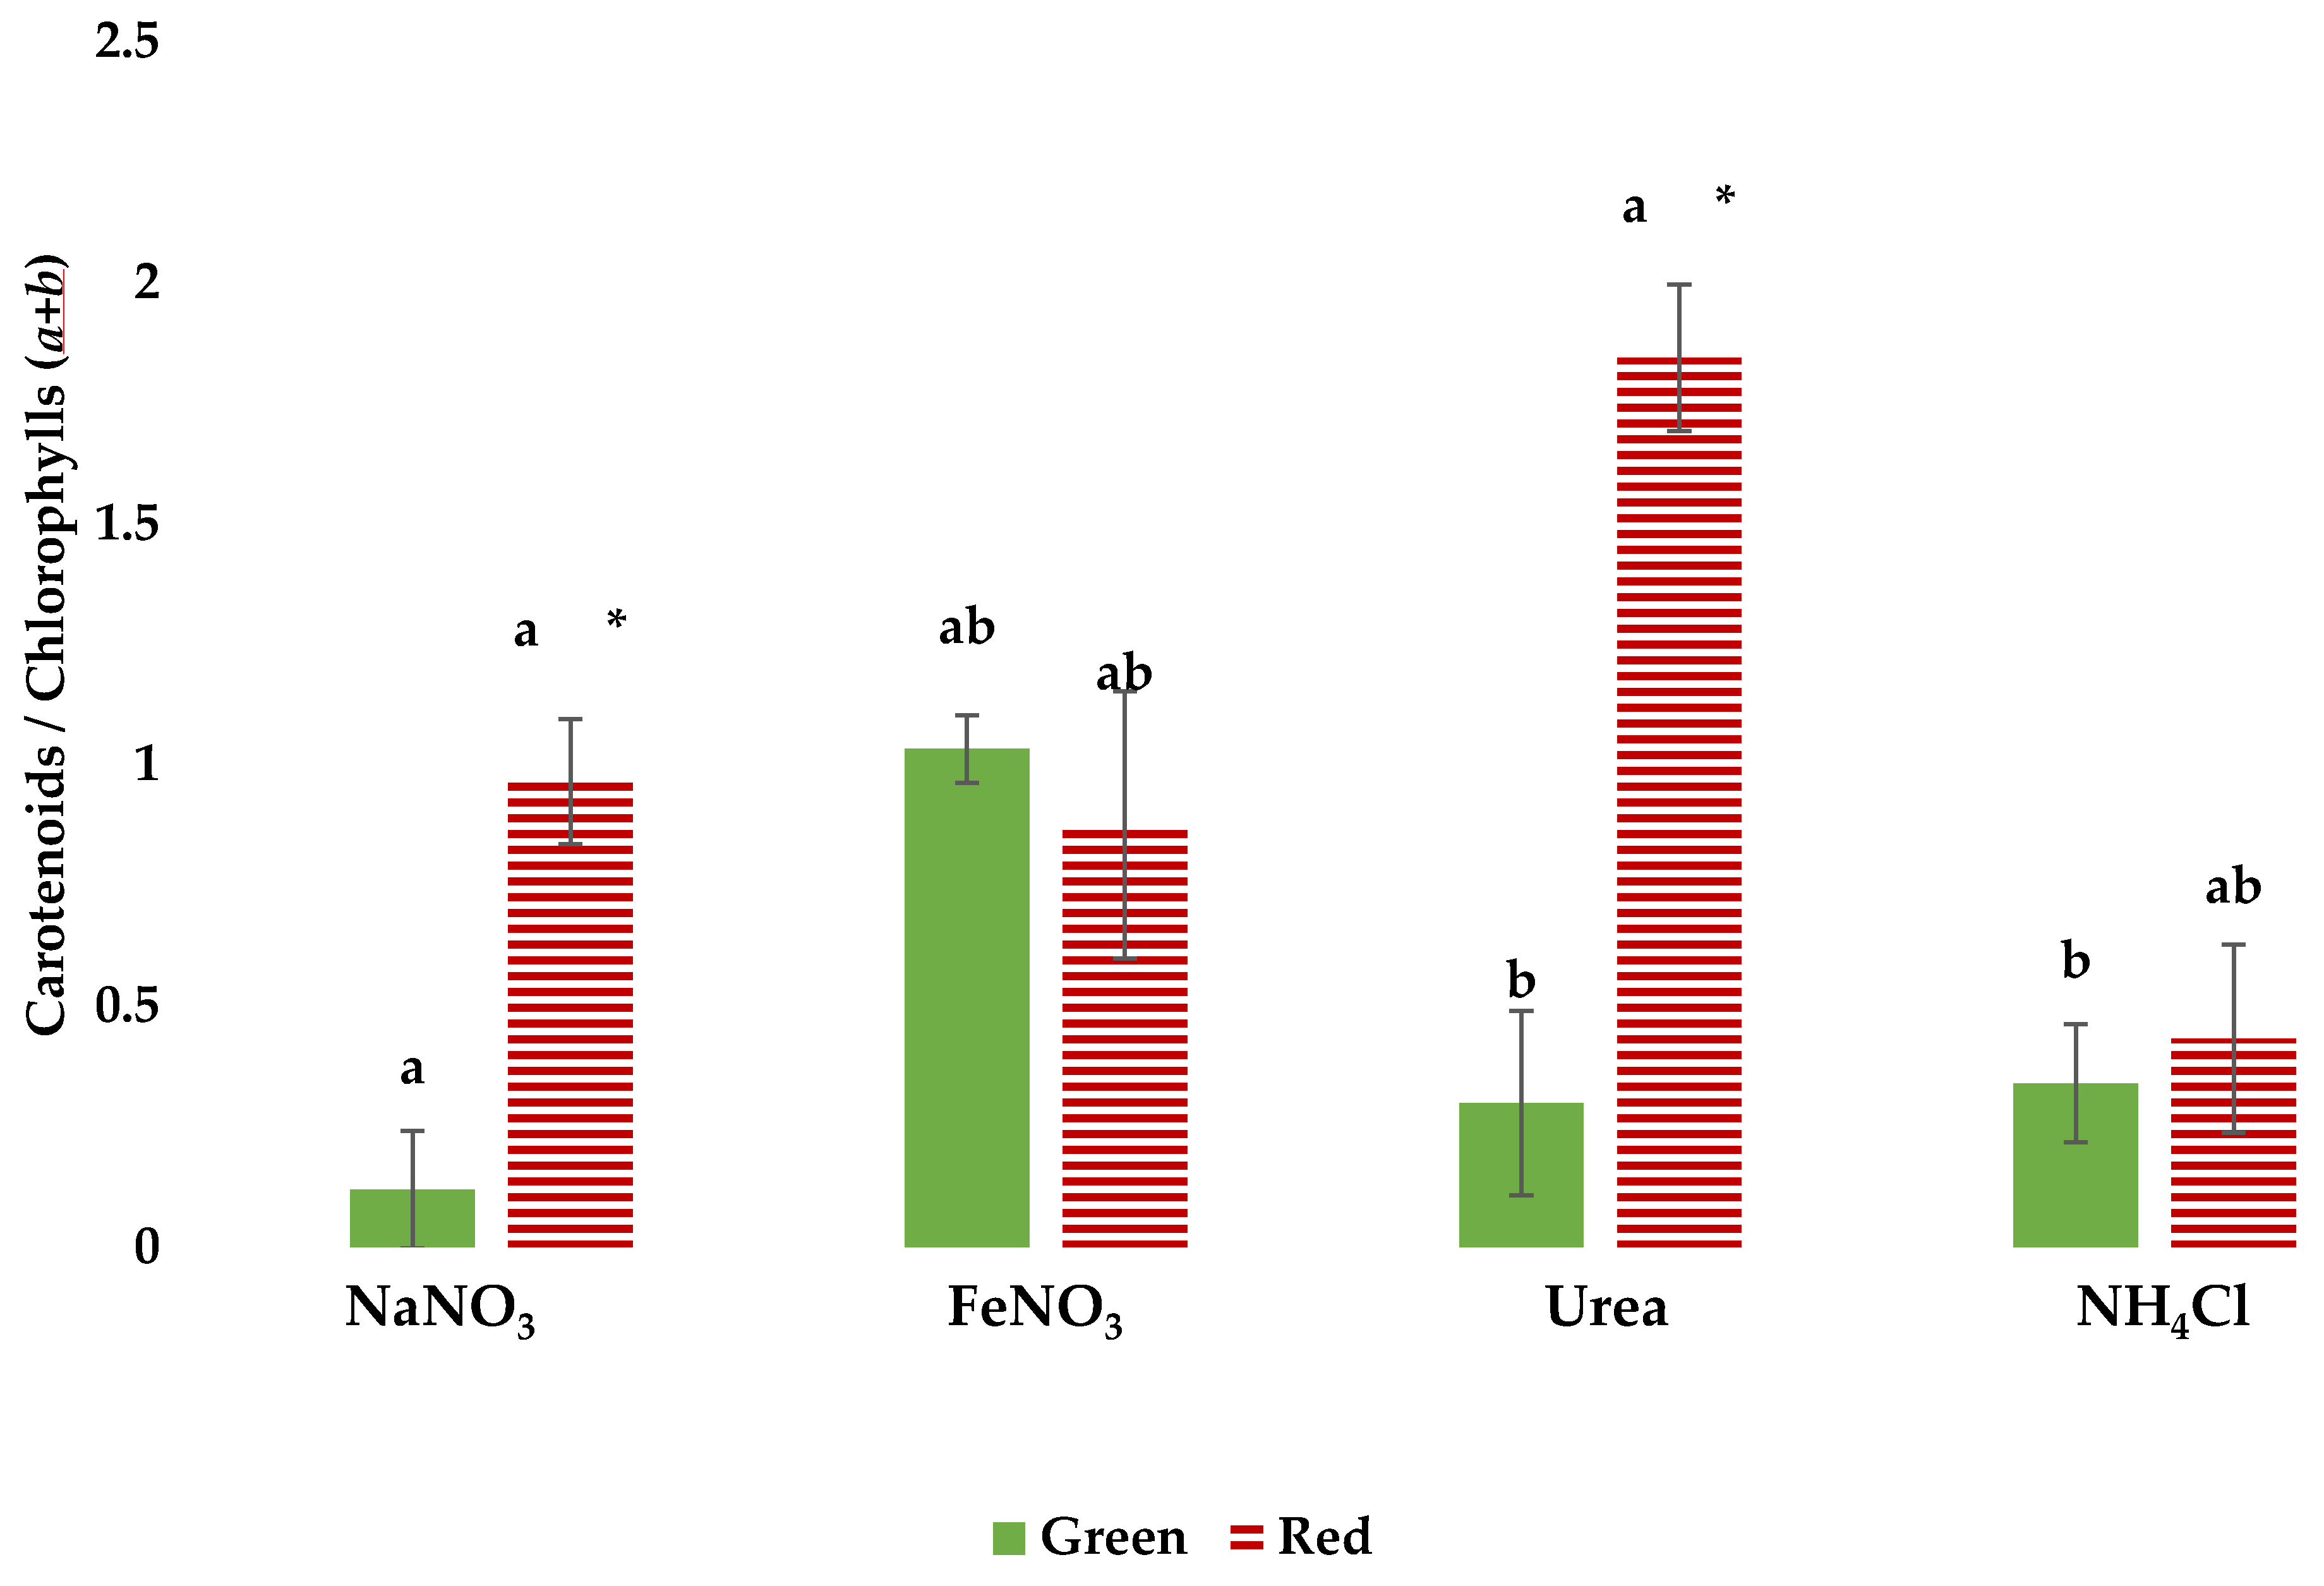
3.3. Pigment Profiles in Green and Red Growth Phases

Table 1 shows the pigment composition of the biomass, measured using HPLC analysis at the end of the green and red phases. The representative chromatograms per each treatment are included in Supplementary Materials 3. The major pigments identified were in agreement with those recorded elsewhere in the literature [28,30]. The number of peaks identified in the red phase were less than those observed in the green phase. In most instances, the chlorophyll a was the main peak in both phases, with the exception of urea, where the main pigment at the end of the green phase was unidentified but had carotene-like properties and astaxanthin in the red phase. The major pigments showing the greatest peak areas were carotenoid-like pigments, lutein, astaxanthin, chlorophyll a, β-carotene, pheophytin, canthaxanthin, and antheraxanthin. Minor pigments, present in traces, were not quantified: chlorophyll b and echinenone. Carotenoid-like pigments and canthaxanthin, whose standards were not available, were recognised by comparing the samples peaks with those found in literature and spectral library databases [31].
The addition of sodium acetate 0.25% (w/v) and the increase of irradiance led to the accumulation of astaxanthin in all the treatments, with final absolute values ranging from 0.313 ± 0.008 to 0.711 ± 0.143 mg/g, with the exception of cells previously cultivated with FeNO3, where its content reduced from 2714 ± 0.585 to 1353 ± 0.366, coincident with the degradation of chlorophylls and lutein.
The shift of pigment composition was more evident in the urea and NaNO3 grown samples, while cells whose vegetative growth was supplied with FeNO3 and NH4Cl were less affected by the induction method applied, except for the astaxanthin content drop in the iron treatment. The chlorophylls content dropped in all the treatments except for NH4Cl.
A high variety of unknown pigments was found in the green phase of urea cultivated cells: traces of echinenone were found in two out of three replicates; lutein and chlorophyll decreased, while the astaxanthin increased significantly from 0 to the 0.313 mg/g DW in the red phase. Neoxanthin was found in two out of three NaNO3 samples with a concentration of 0.025 ± 0.006 mg/g DW.
Other pigments, such as canthaxanthin, were detected in the green phase of FeNO3 and NaNO3.
When considering the carotenoids/chlorophyll ratio (Figure 3), the ratio changed remarkably between the two phases in urea-grown cells and in the NaNO3 control (p < 0.001). The change in ratio was greater in urea (1.55 ± 0.26) followed by NaNO3 (0.84 ± 0.33), NH4Cl (0.092 ± 0.012), and FeNO3 (−0.15 ± 0.06). This ratio change may, in part, be due to a difference in chlorophyll concentration following induction: NaNO3 −70%, FeNO3 −38%, Urea −91%, NH4Cl +23%.
Other biochemical analyses were performed, including total protein and carbohydrates (Table S1 in Supplementary Materials 3).

4. Discussion

This study demonstrates the possibility of successfully growing the strain H. pluvialis CCAP 34/1D in urea as the principal NS, reaching a high biomass yield and using a low-cost renewable source of nitrogen (Figure 1). The stressors used in our study had a significant effect on carotenoid accumulation, with a minimal negative impact upon the cell number obtained during vegetative growth (Figure 2). Namely, all the treatments, barring FeNO3, increased the astaxanthin accumulated and all, except NH4Cl, showed a further increase in the cell number following exposure to stressors (Table 1).
Previous reports showed that the best performance of H. pluvialis in terms of growth rate, cell density, and long vegetative stage, without premature encysting, is usually achieved supplying NaNO3 and/or KNO3 among possible NS [32,33], with results differing among the strains and the nitrogen concentrations.
In this study, cells grown in urea had a significantly greater growth rate (µ = 0.4) (p < 0.0001) and maximum cell density (4.98 × 10⁵ cells/mL, p < 0.0046) when compared to cultures grown in any other source of nitrogen tested. Studies investigating growth in different NS are few and have reported conflicting results. For instance, in Cifuentes et al. [34] when comparing different NS including urea, a rate of 0.47 d−1 was achieved in NaNO3 (a maximum cell density of 1.4 × 10⁵ cells/mL) while 0.44 d−1 was in urea (a maximum cell density of 4.5 × 10⁴ cells/mL), data that was considerably lower than the highest cell density reached in our study. Additionally, Goksan et al. [35] reached the maximum growth rate (0.26 d−1) in NaNO3 and found out that their strain did not grow under urea as sole NS. Many studies comparing these different NS, found H. pluvialis growing optimally in sodium nitrate, which is three and eight times more expensive than ammonium and urea, respectively [36]. In another study, Colusse et al. [37] calculated that NaNO3 accounts for 83.3% of the total chemical cost of all those used to make BG11 medium.
Urea (CO(NH2)2) is an organic compound, thus it provides additional C, which is important for the green-red transition and the accumulation of astaxanthin. As a low-cost N-source, urea could enhance the economics of the whole process. The replacement of sodium nitrate with urea has been attempted for other species cultivation, e.g., Spirulina platensis with the same purpose of making its cultivation more cost-effective by reducing the input cost without sacrificing the production efficiency [38,39].
Upon improving the green phase of cultivation in terms of biomass productivity, the astaxanthin induction was achieved by applying a mix of stressors at moderate intensity and assessed through a previous screening (Supplementary Materials 2), where the aim was to find the compromise between the highest cell concentration and the highest carotenoids accumulation. This was attained using modified JM (without the addition of extra NS in the form of NaNO3 but keeping the original recipe containing Ca(NO3)2 and (NH4)6Mo7O24·4H2O) with the addition of 0.25% (w/v) sodium acetate and exposed to 250 µmol photons m−2 s−1 for 7 days.
Previous studies on the nutrition of H. pluvialis have shown that acetate appears to be an important carbon source, enhancing both growth and carotenogenesis [40,41]. This was confirmed in our study and was used in the astaxanthin induction medium. Orosa et al. [42] tested different concentrations of sodium acetate, observing that 0.25% (w/v) acetate led to carotenoids accumulation and biomass increase, while higher concentrations (>0.5% w/v) caused growth inhibition, including a reduction in the chlorophyll a content and cell number decrease, whereas, Cifuentes et al. [34] recorded that the addition of sodium acetate (0.15% w/v) did not produce any increase in cell numbers but induced cyst formation. Zhang et al. [43] exposed the cultures to 10 mM (0.08% w/v) sodium acetate under solar irradiation, obtaining astaxanthin yields more than two-fold compared to the control, after 6 days. Moreso, in other studies, the induction process in mixotrophy led to a decrease in cell density, and in the present study, induction conditions did not stop algal growth. This result can be explained by two factors: (i) the resuspension of the 14 days old cultures in the fresh NaNO3 depleted buffered medium with the application of a moderate intensity stressor, which could have contributed to further growth; and (ii) the moderate increase of irradiance and the addition of an organic carbon source at 0.25% w/v, did not reduce the cell density, elongating the growth curve and concomitantly enhancing the degree of cell encystment.
Finding moderately stressful conditions is, indeed, essential to guarantee cell survival, e.g., the limitation of nitrogen instead of depletion, or exposure to a moderate increase in light [13]. The presence of nitrogen is essential for the cell division rate and for the accumulation of secondary carotenoids, and in addition, the synthesis of astaxanthin requires nitrogen for continuous protein synthesis in order to support its hyper-accumulation [44]. In the JM original recipe, the nitrogen from NaNO3 accounts for 941 µM, and in this study, it was eliminated from the induction medium. Meanwhile, the additional sources of nitrogen contained within the original JM recipe, including Ca(NO3)2 × 4H2O (84 µM N) and (NH4)6Mo7O24·4H2O (0.8 µM N) were retained and their presence was considered enough to maintain background levels of cell metabolism and growth.
When an NS (NaNO3 in our case) remained available for the cultures, chlorophylls, and total carotenoid concentrations remained at constant levels. However, under nitrogen deficiency, a rapid chlorophyll decline and carotenoid increase per cell occurred—this was avoided in this study due to the medium refresh without the total lack of nitrogen source.
As shown in the Supplementary Materials 3, the protein amount remained nearly constant, thanks to the presence of nitrogen in the medium (Table S1 in Supplementary Materials 3). Other authors found a decrease of proteins and a consequent decrease in photosynthetic activity [45,46]. The increase in the carbohydrate content is an indicator of the carotenogenesis induction, being the initial precursors in the carotenoids pathway (Table S1 in Supplementary Materials 3) [47].
The carotenoids detected by the HPLC analysis varied from the primary carotenoids commonly found in H. pluvialis, such as lutein and β-carotene, to the less frequent antheraxanthin and canthaxanthin [48]. The significant increase of the carotenoid/chlorophyll ratio between green and red phases of cells grown with urea and NaNO3 was mainly caused by a concomitant reduction of chlorophylls after the induction and a concomitant increase in the carotenoids value (Figure 3). On the other hand, it was observed that cultures grown in FeNO3 and NH4Cl, started to encyst before the induction process, from day 10 and 12, respectively, which was not observed in the cultures grown with either urea or NaNO3. The presence of astaxanthin in the green phase of the FeNO3 and NH4Cl treatments confirmed the presence of red cysts already formed before the induction process, as observed under the microscope. Although iron is a necessary element in photosynthesis and it is used to enhance the algal growth during the green phase [49], free ferrous (Fe2+) represents a hazard to the Fenton reaction process and generates reactive oxygen species (ROS), thus augmenting H. pluvialis astaxanthin synthesis [49,50]. Iron availability, in our case, may have caused a premature accumulation of astaxanthin to help prevent cellular damage caused by ROS production. The FeNO3, contrarily to the control in NaNO3, caused premature cell encystment and astaxanthin accumulation, accounting for the highest amount of astaxanthin reached in our treatments (2.71 ± 0.58 mg/g), showing that even if light is essential for its accumulation, other stressors can be equally or even more efficient. Additionally, the main issue regarding NH4-N nutrition is the conversion of the reduced ion to NH3 according to chemical equilibrium, and ammonia, which is a toxic nitrogen form and has a direct negative impact on the photosynthetic apparatus of microalga [40], especially at high N concentrations. Algae exhibit varying tolerances to the NH4-N nutrition [51].
The HPLC analysis confirmed this different behaviour of H. pluvialis cells in the different treatments. In general, the green phase tends to accumulate chlorophylls and primary carotenoids, such as lutein and neoxanthin, in the chloroplasts. The accumulation of astaxanthin was concomitant to the presence of other carotenoids, which are part of the astaxanthin metabolic pattern (involving a step-wise movement from β—carotene—echinenone—canthaxanthin—astaxanthin) [52], and detected only at the end of the green phase. While at the end of carotenogenesis, the presence of astaxanthin was dominant among the carotenoids. Contrarily, at the end of the green phase, other carotenoids were detected: canthaxanthin was present in iron and nitrate treatments; neoxanthin in two replicates of NaNO3; and urea-treatment presented many unidentified peaks, carotene-like, and echinenone. Canthaxanthin is a precursor of astaxanthin, especially present in the orange cells when they are transitioning from between the green and the red phases of growth; implying the onset of secondary carotenoid accumulation, a part of the astaxanthin metabolic pathway [24]. In fact, in green algal cells, chlorophyll a, chlorophyll b, and lutein are the main pigments, while small amounts of other carotenoids, such as neoxanthin, violaxanthin, astaxanthin, lutein-like, and canthaxanthin, also exist in green algal cells [53].

5. Conclusions

This study highlights the advantages of a modified JM medium where urea is the primary NS, not only for the enhanced growth of H. pluvialis but also for the low-cost sustainable source of nitrogen which could be economically employed at the industrial level.
It also scans a broader image, including an innovative method to induce astaxanthin by a combination of abiotic factors acting as stressors of moderate intensity without the loss of biomass. The combination of the following factors, including nitrogen limitation, the increase of light, and sodium acetate addition, was found to be the best. Different nitrogen sources showed a different mosaic of pigments that converged in the astaxanthin accumulation after exposure to the induction conditions.

Supplementary Materials

The following supporting information can be downloaded at: https://www.mdpi.com/article/10.3390/app12031261/s1, Figure S1: Growth rate of cultures in each different medium 3N-BBM+V+V, BG11, MWC, JM at 6, 6.5, 7, 7.5, 8 pHs; Figure S2: H. pluvialis 34/1D grown in different N/P ratios: Control with NaNO3 2.6/1; 1/1; 5/1; 10/1; Figure S3: Effect of sodium acetate 0%, 0.25%; 0.5%; 1%; 1.5%; 1.75%; 2% on carotenoids accumulation (OD480) and cell density (OD750) under ML and HL; Figure S4: H. pluvialis 34/1D calibration curve used for cell quantification; Figure S5: Representative HPLC chromatograms of H. pluvialis green (A) and red (B) phases of growth, when cultivated under FeNO3, NaNO3, NH4Cl, or Urea as the principal nitrogen source in Jaworski’s Media; Table S1: Biochemical table reporting the mean value (% DW) ± S.D. within samples (n = 3); Table S2: Ordinary one-way ANOVA and Tukey’s multiple comparison test, with a single pooled variance were performed for H. pluvialis; Table S3: The relative change of H. pluvialis CCAP 34/1D cell number based on the number of cells/mL at the beginning and end of the 7 day induction process; Table S4: Quantitative pigment composition (in mg/g DW), obtained by HPLC analysis, of H. pluvialis cells at the end of the green phase, in cultures previously supplied with equimolar concentrations of nitrogen from different sources; Table S5: For canthaxanthin, a t-test was used to determine if there is a significant difference between the means of two groups, NaNO3 and FeNO3; Table S6: Quantitative pigment composition (in mg/g DW), obtained by HPLC analysis, of H. pluvialis cells at the end of the red phases stationary phase, in cultures previously supplied with equimolar concentrations of nitrogen from different sources; Table S7: Pigments variation between the green and the red phase; Table S8: Ordinary two-way ANOVA and Sidak’s multiple comparison test, with individual variances computed for each comparison, were performed; Table S9: Carotenoids/Chlorophylls ratio analysis between the green and the red phase.

Author Contributions

A.R., A.N. and M.E.R. conceived and planned the project, and designed the experiments. A.R. conducted the experiments, and generated, collated, and processed the data. A.R., A.N., B.J. and M.E.R. interpreted the results. A.R. wrote the manuscript. A.R., A.N., B.J. and M.E.R. reviewed and edited the manuscript. A.N., B.J. and M.E.R. supervised the project and acquired the funding. All authors have read and agreed to the published version of the manuscript.

Funding

The project leading to this application has received funding from the Erasmus+/KA1 2017 with a personal scholarship for A.R. The authors acknowledge the financial support from the ABACUS project, grant agreement No. 745668, funded by the BBI-JU under the European Union’s Horizon 2020 R&I programme. This project has received funding from the European Union’s Horizon 2020 research and innovation programme under the Marie Skłodowska-Curie grant agreement No. 860125.

Acknowledgments

A.R. would like to acknowledge the SAMS Institute for the provision of their lab space and facilities.

Conflicts of Interest

The authors declare that they have no competing interest.

References

  1. Colusse, G.A.; Duarte, M.E.R.; de Carvalho, J.C.; Noseda, M.D. Production of astaxanthin by Haematococcus pluvialis: Lab processes to scale up including the cost considerations. In Global Perspectives on Astaxanthin; Ravishankar, G.A., Rao, A.R., Eds.; Academic Press: Cambridge, MA, USA, 2021; pp. 121–130. [Google Scholar] [CrossRef]
  2. Nguyen, K.D. Astaxanthin: A Comparative Case of Synthetic vs Natural Production. In Chemical and Biomolecular Engineering Publications and Other Works; The University of Tennessee Libraries: Knoxville, TN, USA, 2013. [Google Scholar]
  3. Li, F. Accumulation of Astaxanthin Was Improved by the Nonmotile Cells of Haematococcus Pluvialis. BioMed Res. Int. 2019, 2019, 8101762. [Google Scholar] [CrossRef] [PubMed] [Green Version]
  4. Novoveská, L.; Ross, M.E.; Stanley, M.S.; Pradelles, R.; Wasiolek, V.; Sassi, J.F. Microalgal Carotenoids: A Review of Production, Current Markets, Regulations, and Future Direction. Mar. Drugs 2019, 17, 640. [Google Scholar] [CrossRef] [PubMed] [Green Version]
  5. Capelli, B.; Bagchi, D.; Cysewski, G.R. Synthetic Astaxanthin Is Significantly Inferior to Algal-Based Astaxanthin as an Antioxidant and May Not Be Suitable as a Human Nutraceutical Supplement. Nutrafoods 2013, 12, 145–152. [Google Scholar] [CrossRef]
  6. Sun, H.; Kong, Q.; Geng, Z.; Duan, L.; Yang, M.; Guan, B. Enhancement of Cell Biomass and Cell Activity of Astaxanthin-Rich Haematococcus Pluvialis. Bioresour. Technol. 2015, 186, 67–73. [Google Scholar] [CrossRef]
  7. Capelli, B.; Talbott, S.; Ding, L. Astaxanthin Sources: Suitability for Human Health and Nutrition. Funct. Foods Health Dis. 2019, 9, 430–445. [Google Scholar] [CrossRef] [Green Version]
  8. Koller, M.; Muhr, A.; Braunegg, G. Microalgae as Versatile Cellular Factories for Valued Products. Algal Res. 2014, 6, 52–63. [Google Scholar] [CrossRef]
  9. Pérez-López, P.; González-García, S.; Jeffryes, C.; Agathos, S.; McHugh, E.; Walsh, D.; Murray, P.; Moane, S.; Feijoo, G.; Moreira, M.T. Life Cycle Assessment of the Production of the Red Antioxidant Carotenoid Astaxanthin by Microalgae: From Lab to Pilot Scale. J. Clean. Prod. 2014, 64, 332–344. [Google Scholar] [CrossRef] [Green Version]
  10. Jannel, S.; Caro, Y.; Bermudes, M.; Petit, T. Novel Insights into the Biotechnological Production of Haematococcus Pluvialis-Derived Astaxanthin: Advances and Key Challenges to Allow Its Industrial Use as Novel Food Ingredient. J. Mar. Sci. Eng. 2020, 8, 789. [Google Scholar] [CrossRef]
  11. Ahuja, K.; Rawat, A. Astaxanthin Market Size by Source (Synthetic, Natural), by Application (Dietary Supplement, Personal Care, Pharmaceuticals, Food & Beverages, Animal Feed Aquaculture, Livestock, Pets) Industry Outlook Report, Regional Analysis. Application Potential. Available online: https://www.marketresearch.com/One-Off-Global-Market-Insights-v4130/Astaxanthin-Size-Source-Synthetic-Natural-14839588 (accessed on 20 January 2022).
  12. Grand View Research. Functional Foods Market Size, Share & Trends Analysis Report by Ingredient (Carotenoids, Prebiotics & Probiotics, Fatty Acids, Dietary Fibers), by Product, by Application, and Segment Forecasts. 2019. Available online: https://www.researchandmarkets.com/reports/4764576/functional-foods-market-size-share-and-trends (accessed on 20 January 2022).
  13. Zhang, Z.; Wang, B.; Hu, Q.; Sommerfeld, M.; Li, Y.; Han, D. A New Paradigm for Producing Astaxanthin from the Unicellular Green Alga Haematococcus Pluvialis. Biotechnol. Bioeng. 2016, 113, 2088–2099. [Google Scholar] [CrossRef] [Green Version]
  14. Wayama, M.; Ota, S.; Matsuura, H.; Nango, N.; Hirata, A.; Kawano, S. Three-Dimensional Ultrastructural Study of Oil and Astaxanthin Accumulation during Encystment in the Green Alga Haematococcus Pluvialis. PLoS ONE 2013, 8, e53618. [Google Scholar] [CrossRef]
  15. Panis, G.; Carreon, J.R. Commercial Astaxanthin Production Derived by Green Alga Haematococcus Pluvialis: A Microalgae Process Model and a Techno-Economic Assessment All through Production Line. Algal Res. 2016, 18, 175–190. [Google Scholar] [CrossRef] [Green Version]
  16. Zhang, B.Y.; Geng, Y.H.; Li, Z.K.; Hu, H.J.; Li, Y.G. Production of Astaxanthin from Haematococcus in Open Pond by Two-Stage Growth One-Step Process. Aquaculture 2009, 295, 275–281. [Google Scholar] [CrossRef]
  17. Kiperstok, A.C.; Sebestyén, P.; Podola, B.; Melkonian, M. Biofilm cultivation of Haematococcus Pluvialis enables a highly productive one-phase process for astaxanthin production using high light intensities. Algal Res. 2017, 21, 213–222. [Google Scholar] [CrossRef]
  18. Suh, I.S.; Joo, H.-N.; Lee, C.-G. A Novel Double-Layered Photobioreactor for Simultaneous Haematococcus Pluvialis Cell Growth and Astaxanthin Accumulation. J. Biotechnol. 2006, 125, 540–546. [Google Scholar] [CrossRef]
  19. Aflalo, C. On the Relative Efficiency of Two- vs. One-stage Production of Astaxanthin by the Green Alga Haematococcus Pluvialis. Biotechnol. Bioeng. 2007, 98, 300–305. [Google Scholar] [CrossRef]
  20. Wen, X.; Wang, Z.; Ding, Y.; Geng, Y.; Li, Y. Enhancing the Production of Astaxanthin by Mixotrophic Cultivation of Haematococcus Pluvialis in Open Raceway Ponds. Aquac. Int. 2020, 28, 625–638. Available online: https://link.springer.com/article/10.1007/s10499-019-00483-2 (accessed on 20 January 2022). [CrossRef]
  21. He, B.; Hou, L.; Dong, M.; Shi, J.; Huang, X.; Ding, Y.; Cong, X.; Zhang, F.; Zhang, X.; Zang, X. Transcriptome Analysis in Haematococcus Pluvialis: Astaxanthin Induction by High Light with Acetate and Fe2+. Int. J. Mol. Sci. 2018, 19, 175. [Google Scholar] [CrossRef] [Green Version]
  22. Christian, D.; Zhang, J.; Sawdon, A.J.; Peng, C.-A. Enhanced astaxanthin accumulation in Haematococcus Pluvialis using high carbon dioxide concentration and light illumination. Bioresour. Technol. 2018, 256, 548–551. [Google Scholar] [CrossRef]
  23. Tocquin, P.; Fratamico, A.; Franck, F. Screening for a Low-Cost Haematococcus Pluvialis Medium Reveals an Unexpected Impact of a Low N/P Ratio on Vegetative Growth. J. Appl. Phycol. 2012, 24, 365–373. [Google Scholar] [CrossRef] [Green Version]
  24. Cerón, M.C.; García-Malea, M.C.; Rivas, J.; Acien, F.G.; Fernandez, J.M.; del Rio, E.; Guerrero, M.G.; Molina, E. Antioxidant activity of Haematococcus pluvialis cells grown in continuous culture as a function of their carotenoid and fatty acid content. Appl. Microbiol. Biotechnol. 2007, 74, 1112–1119. [Google Scholar] [CrossRef]
  25. González, M.A.; Cifuentes, A.S.; Gómez, P.I. Growth and total carotenoid content in four Chilean strains of Haematococcus pluvialis Flotow, under laboratory conditions. Gayana Bot. 2009, 66, 58–70. [Google Scholar] [CrossRef] [Green Version]
  26. Butler, T.O.; McDougall, G.J.; Campbell, R.; Stanley, M.S.; Day, J.G. Media Screening for Obtaining Haematococcus Pluvialis Red Motile Macrozooids Rich in Astaxanthin and Fatty Acids. Biology 2018, 7, 2. [Google Scholar] [CrossRef] [PubMed] [Green Version]
  27. Sarada, R.; Tripathi, U.; Ravishankar, G.A. Influence of Stress on Astaxanthin Production in Haematococcus Pluvialis Grown under Different Culture Conditions. Process Biochem. 2002, 37, 623–627. [Google Scholar] [CrossRef]
  28. Roy, S.; Llewellyn, C.A.; Egeland, E.S.; Johnsen, G. (Eds.) Phytoplankton Pigments: Characterization, Chemotaxonomy and Applications in Oceanography; Cambridge University Press: Cambridge, UK, 2011. [Google Scholar]
  29. Méléder, V.; Barillé, L.; Launeau, P.; Carrère, V.; Rincé, Y. Spectrometric Constraint in Analysis of Benthic Diatom Biomass Using Monospecific Cultures. Remote Sens. Environ. 2003, 88, 386–400. [Google Scholar] [CrossRef]
  30. Jeffrey, S.W.; Mantoura, R.F.C.; Wright, S.W. (Eds.) Phytoplankton Pigments in Oceanography: Guidelines to Modern Methods; UNESCO Publishing: Paris, France, 1997. [Google Scholar]
  31. Clementson, L.A.; Wojtasiewicz, B. Dataset on the absorption characteristics of extracted phytoplankton pigments. Data Brief 2019, 24, 103875. [Google Scholar] [CrossRef]
  32. Chen, J.; Wei, D.; Pohnert, G. Rapid Estimation of Astaxanthin and the Carotenoid-to-Chlorophyll Ratio in the Green Microalga Chromochloris Zofingiensis Using Flow Cytometry. Mar. Drugs 2017, 15, 231. [Google Scholar] [CrossRef] [Green Version]
  33. Imamoglu, E.; Sukan, F.; Dalay, M.C. Effect of Different Culture Media and Light Intensities on Growth of Haematococcus Pluvialis. Int. J. Nat. Eng. Sci. 2007, 1, 5–9. [Google Scholar]
  34. Cifuentes, A.S.; González, M.A.; Vargas, S.; Hoeneisen, M.; González, N. Optimization of Biomass, Total Carotenoids and Astaxanthin Production in Haematococcus Pluvialis Flotow Strain Steptoe (Nevada, USA) under Laboratory Conditions. Biol. Res. 2003, 36, 343–357. [Google Scholar] [CrossRef] [Green Version]
  35. Göksan, T.; Ak, İ.; Kılıç, C. Growth Characteristics of the Alga Haematococcus Pluvialis Flotow as Affected by Nitrogen Source, Vitamin, Light and Aeration. Turk. J. Fish. Aquat. Sci. 2011, 11, 377–383. [Google Scholar] [CrossRef]
  36. The Dollar Business Bureau. Final Findings in the Anti-Dumping Investigation Concerning Imports of Sodium Nitrate Originating in or Exported from European Union, China PR, Ukraine and Korea RP-reg No.15/1009/2012. 2014. Available online: https://www.thedollarbusiness.com/news/anti-dumping-investigation-on-imports-of-sodium-nitrate-final-findings/9541 (accessed on 20 January 2022).
  37. Colusse, G.A.; Mendes, C.R.B.; Duarte, M.E.R.; de Carvalho, J.C.; Noseda, M.D. Effects of different culture media on physiological features and laboratory scale production cost of Dunaliella salina. Biotechnol. Rep. 2020, 27, e00508. [Google Scholar] [CrossRef]
  38. Rizal, A.; Yeasmin, F.; Hossain, A.; Akter, T.; Rahman, M. Replacement of sodium nitrate in Kosaric medium with urea for culture of Spirulina platensis. Intl. J. Fish. Aquat. Stud. 2017, 5, 403–408. [Google Scholar] [CrossRef]
  39. Uddin, A.F.M.J.; Ifaz, M.I.; Husna, M.A.; Sakib, I.; Rakibuzzaman, M. Comparative Growth Analysis of Spirulina platensis using Urea as a Nitrogen Substitute for NaNO3. Int. J. Bus. Soc. Sci. Res. 2020, 8, 76–80. [Google Scholar]
  40. Li, X.; Li, W.; Zhai, J.; Wei, H.; Wang, Q. Effect of ammonium nitrogen on microalgal growth, biochemical composition and photosynthetic performance in mixotrophic cultivation. Bioresour. Technol. 2019, 273, 368–376. [Google Scholar] [CrossRef] [PubMed]
  41. Takaichi, S. Carotenoids in algae: Distributions, biosynthesis and functions. Mar. Drugs 2011, 9, 1101–1118. [Google Scholar] [CrossRef] [PubMed]
  42. Orosa, M. Analysis and enhancement of astaxanthin accumulation in Haematococcus Pluvialis. Bioresour. Technol. 2005, 96, 373–378. [Google Scholar] [CrossRef] [PubMed] [Green Version]
  43. Zhang, C.; Zhang, L.; Liu, J. Exogenous sodium acetate enhances astaxanthin accumulation and photoprotection in Haematococcus pluvialis at the non-motile stage. J. Appl. Phycol. 2019, 31, 1001–1008. [Google Scholar] [CrossRef]
  44. Patel, A.K.; Singhania, R.R.; Sim, S.J.; Dong, C.D. Recent Advancements in Mixotrophic Bioprocessing for Production of High Value Microalgal Products. Bioresour. Technol. 2021, 320, 124421. [Google Scholar] [CrossRef]
  45. Dos Santos, A.C.; Lombardi, A.T. Growth, photosynthesis and biochemical composition of Haematococcus pluvialis at various pH. J. Algal Biomass Util. 2017, 8, 1–15. [Google Scholar]
  46. Sipaúba-Tavares, L.H.; Berchielli-Morais, F.A.; Scardoeli-Truzzi, B. Growth of Haematococcus pluvialis Flotow in alternative media. Braz. J. Biol. 2015, 75, 796–803. [Google Scholar] [CrossRef] [Green Version]
  47. Gwak, Y.; Hwang, Y.-S.; Wang, B.; Kim, M.; Jeong, J.; Lee, C.-G.; Hu, Q.; Han, D.; Jin, E. Comparative analyses of lipidomes and transcriptomes reveal a concerted action of multiple defensive systems against photooxidative stress in Haematococcus pluvialis. J. Exp. Bot. 2014, 65, 4317–4334. [Google Scholar] [CrossRef]
  48. Rastar, M. Effects of Iron and Zinc Concentrations on Growth Performance and Biochemical Composition of Haematococcus Pluvialis: A Comparison between Nanoparticles and Their Corresponding Metals Bulks. J. Algal Biomass Util. 2018, 9, 59–67. [Google Scholar]
  49. Cai, M.; Li, Z.; Qi, A. Effects of iron electrovalence and species on growth and astaxanthin production of Haematococcus pluvialis. Chin. J. Oceanol. Limnol. 2009, 27, 370. [Google Scholar] [CrossRef]
  50. Adam, M.R.; Othman, M.H.D.; Abu Samah, R.; Puteh, M.H.; Ismail, A.; Mustafa, A.; Rahman, M.A.; Jaafar, J. Current Trends and Future Prospects of Ammonia Removal in Wastewater: A Comprehensive Review on Adsorptive Membrane Development. Sep. Purif. Technol. 2019, 213, 114–132. [Google Scholar] [CrossRef]
  51. Li, X.; Wang, X.; Duan, C.; Yi, S.; Gao, Z.; Xiao, C.; Agathos, S.N.; Wang, G.; Li, J. Biotechnological Production of Astaxanthin from the Microalga Haematococcus Pluvialis. Biotechnol. Adv. 2020, 43, 107602. [Google Scholar] [CrossRef] [PubMed]
  52. Mascia, F.; Girolomoni, L.; Alcocer, M.J.P.; Bargigia, I.; Perozeni, F.; Cazzaniga, S.; Cerullo, G.; D’Andrea, C.; Ballottari, M. Functional Analysis of Photosynthetic Pigment Binding Complexes in the Green Alga Haematococcus Pluvialis Reveals Distribution of Astaxanthin in Photosystems. Sci. Rep. 2017, 7, 16319. [Google Scholar] [CrossRef] [Green Version]
  53. Elumalai, S.; Santhose, B.I.; Kanna, G.R. Extraction of Carotenoid and Thin Layer Chromatography (TLC), GC-MS, FT-IR and HPLC Analysis of Pharmaceutically Important Pigment Astaxanthin from a New Strain of Haematococcus Pluvialis. Wkly. Sci. Res. J. 2014, 2, 2321–7871. [Google Scholar] [CrossRef]
Figure 1. H. pluvialis CCAP 34/1D maximum growth rate and cell density in different NS. Error bars are standard deviations of the means, n = 3. The letters indicate a significant difference in growth media treatments for each measured response (i.e., growth rate or maximum cell density) (p < 0.05).
Applsci 12 01261 g001
Figure 2. The relative change of H. pluvialis CCAP 34/1D cell number is based on the number of cells/mL at the beginning and end of the 7-day induction process, and thereby representative of the cell number change during the red phase alone. Error bars are standard deviations of the means, n = 3. Different letters indicate significant differences among the different nitrogen source treatments (p < 0.05).
Applsci 12 01261 g002
Figure 3. The letters indicate significant differences in the ratios between different nitrogen treatments during either the green or red growth phases (p < 0.05), while the differences between the green and the red phase in each treatment are denoted by * (p < 0.05).
Applsci 12 01261 g003
Table 1. Quantitative pigment composition (in mg/g DW), obtained by HPLC analysis, of H. pluvialis cells at the end of the green and red phases stationary phase, in cultures previously supplied with equimolar concentrations of nitrogen from different sources. Values are reported as the mean value (n = 3) ± 1 S.D. The letters indicate significant differences in the concentration of individual pigments between biomass cultivated using different NS at either green or red phase (p < 0.05), while the differences between the green and the red phase in each treatment are denoted by * (p < 0.05). Pigments denoted with † have been quantified based upon the relative peak area of an internal standard (trans-β-Apo-8′-carotenal).
GreenRed
Lutein †Astaxanthin †Chlorophyll aβ-Carotene †Pheophytin aAntheraxanthin †CanthaxanthinCarotenoid-likeLutein †Astaxanthin †Chlorophyll aβ-Carotene †Pheophytin aAntheraxanthin †
NaNO30.078 ± 0.022 a0.227 ± 0.177 a2682 ± 0.417 a,*0.017 ± 0.008 a0.376 ± 0.077 and1.4 ± 0.85 a,*1.69 ± 1.16 a,*0.046 ± 0.022 a0.711 ± 0.143 a0.812 ± 0.115 a0.017 ± 0.008 a0.107 ± 0.018 a0.010 ± 0.003 a
FeNO30.068 ± 0.014 a2,714 ± 0.585 b,*2722 ± 0.353 a,*0.031 ± 0.000 a1083 ± 0.041 b,*nd1.87 ± 0.68 a,*2.26 ± 0.32 a,*0.076 ± 0.03 a1353 ± 0.366 b1664 ± 0.347 b0.029 ± 0.013 a0.232 ± 0.056 and
Urea0.278 ± 0.229 a,*Nd *2212 ± 0.823 a,*0.090 ± 0.087 a0.325 ± 0.079 a0.294 ± 0.302 and3.09 ± 0.63 a,*0.003 ± 0.002 a0.313 ± 0.008 a0.181 ± 0.068 c0.003 ± 0.000 and0.015 ± 0.006 a
NH4Cl0.072 ± 0.016 a0.299 ± 0.055 a1132 ± 0.579 b0.013 ± 0.008 a0.165 ± 0.023 andnd0.39 ± 0 a,*0.043 ± 0.04 a0.486 ± 0.233 a1396 ± 0.996 b0.023 ± 0.011 a0.560 ± 0.518 a0.052 ± 0.033 a
Publisher’s Note: MDPI stays neutral with regard to jurisdictional claims in published maps and institutional affiliations.

