Article

Special Bioactivities of Phenolics from Acacia dealbata L. with Potential for Dementia, Diabetes and Antimicrobial Treatments

by
Vanessa Paula
1,†,
Soraia I. Pedro
2,3,4,†,
Maria G. Campos
5,6,*,
Teresa Delgado
2,
Letícia M. Estevinho
1 and
Ofélia Anjos
2,4,7,*
1
Centro de Investigação de Montanha, Instituto Politécnico de Bragança, Campus de Santa Apolónia, 5300-253 Bragança, Portugal
2
Centro de Biotecnologia de Plantas da Beira Interior, 6001-909 Castelo Branco, Portugal
3
Centro de Investigação em Ciências da Saúde (CICS-UBI), Universidade da Beira Interior, Av. Infante D. Henrique, 6200-506 Covilhã, Portugal
4
Centro de Estudos Florestais, Instituto Superior de Agronomia, Universidade de Lisboa, Tapada da Ajuda, 1349-017 Lisboa, Portugal
5
Observatory of Drug-Herb Interactions, Faculty of Pharmacy, Health Sciences Campus, University of Coimbra, Azinhaga de Santa Comba, 3000-548 Coimbra, Portugal
6
CQ-Centre of Chemistry—Coimbra, Department of Chemistry, Faculty of Sciences and Technology, University of Coimbra, Rua Larga, 3004-535 Coimbra, Portugal
7
Instituto Politécnico de Castelo Branco, 6001-909 Castelo Branco, Portugal
*
Authors to whom correspondence should be addressed.
These authors contributed equally to this work.
Appl. Sci. 2022, 12(3), 1022; https://doi.org/10.3390/app12031022
Submission received: 21 December 2021 / Revised: 12 January 2022 / Accepted: 14 January 2022 / Published: 19 January 2022
(This article belongs to the Special Issue Advances on Applications of Bioactive Natural Compounds)

Abstract

:
Some diseases still need better therapeutic approaches, including the prevention of development. Natural resources are investigated with this purpose; among them, we decided to use an invasive plant as a main strategy. This will help in two ways: screening new compounds in flowers prevents the plant from causing widespread damage by controlling the dissemination and also obtains crude material for further applications. In the present study, flower extracts from Acacia dealbata Link harvested in Portugal were studied during three stages of flowering. Phenolic compounds were evaluated using HPLC/DAD and the total phenolics as the total flavonoids content was determined. The bioactivities screened were antioxidant potential, inhibitory activities of some enzymes (acetylcholinesterase, lipase and α-glucosidase) and, to complete the screening, the inhibition of microbial growth was determined against Gram-negative and Gram-positive bacteria, as well as for yeasts. The data obtained suggested that the hydroethanolic extracts gave good results for all these biological activities and varied according to the maturation status of the flowers, with the early stage being the most active, which can be related to the chalcones content. This new approach will lead to the possible control of the invasive plant and also future perspective research for therapeutic purposes.

1. Introduction

In drug discovery, screening for potential bio-active structures is often started with natural product extracts. The present work reflects the preliminary study carried out with extracts of an invasive plant, Acacia dealbata L., which may be used in a win–win relationship, that is, as a raw material to supply bioactive molecules, while the harvest itself will contribute to controlling its invasiveness by decreasing the proliferation of this plant.
Among the possible bioactivities to explore that are believed to be linked to the compounds expected to be in the Acacia extracts we chose, the acetylcholinesterase inhibitors (AChEIs) can be explored further for the treatment of dementia symptoms [1] or even to delay the disease. The current extracts used to slow the progression of many of these pathologies still have modest outcomes.
Acacia species are aggressive invaders that affect ecosystem integrity worldwide [2]. Acacia dealbata Link is considered to be one of the most aggressive in Portugal. These plants are distributed throughout all Portuguese provinces [3,4,5] and may invade farmland and autochthonous forests, establishing monocultures, modifying the ecosystem structure and impacting the economy. Their flowers play a key role in the colonizing capacity, limiting the growth of other species due to the allopathic interference caused by vegetal material decomposition in the soil, which maintains the toxicity of soil percolates for a long time [6]. Extracts from the flowers are already explored as hydrogels for personal care products, cosmetics or pharmaceuticals, as well as perfumes based on their antiradical and anti-proliferative potential [7].
Along with this research, other possibilities were explored based on previous studies on ethanol extracts of leaves and flowers of Acacia species that suggested the presence of secondary metabolites, such as coumarins, cyanogenic glycosides, tannins, alkaloids and steroids [8]. Notwithstanding, this genus is recognized as a source of phenolic compounds [9,10,11], with flavonoids being the predominant chemical group [12]. In the study performed by Farid et al. [13] on the leaves, flowers and pods of A. seyal, A. nilotica and A. laeta, the antioxidant activity was promising. Furthermore, according to Ziani et al. [14], A. tortilis extracts exhibited various biological activities and their phenolic compounds were studied for the development of cytotoxic and anti-inflammatory drugs.
Antimicrobial activity was also identified in several Acacia species against Escherichia coli, Staphylococcus aureus and Salmonella typhi bacteria and the fungal strain Candida albicans and Aspergillus niger [15,16,17].
According to the aforementioned studies, the bark and pods contain secondary metabolites, such as flavonoids, alkaloids, saponins and tannins, which may contribute to the bioactivities. Among the most relevant potential applications in health, the inhibitory activities of the enzymes α-glucosidase, acetylcholinesterase and lipase will have an important impact on the development of new drugs. For instance, lipases, which are present in pancreatic secretions and are responsible for fat digestion, are able to break down triglycerides into free fatty acids and glycerol. Acetylcholinesterase inhibitors are relevant for Alzheimer’s disease treatment strategies.
For the possible applications cited above, especially regarding the antioxidant potential, the need to screen new molecules for the development of, for example, new drugs for dementia-related diseases, and the need to use a crude material that will leave a low environmental impact, are all good reasons to explore A. dealbata flowers. This reflection leads to the goal of the present work, which consisted of obtaining more robust data for possible future research using selected assays to evaluate the inhibitory activities of the enzymes acetylcholinesterase, α-glucosidase and lipase. To complete the screening, the inhibition of microbial growth was determined against Gram-negative and Gram-positive bacteria, as well as for the yeasts Candida albicans ATCC 10231TM and amphotericin-B-resistant Candida albicans ESA100.
In addition, phenolic compounds and flavonoids were screened using HPLC/DAD to characterize the extracts.

2. Materials and Methods
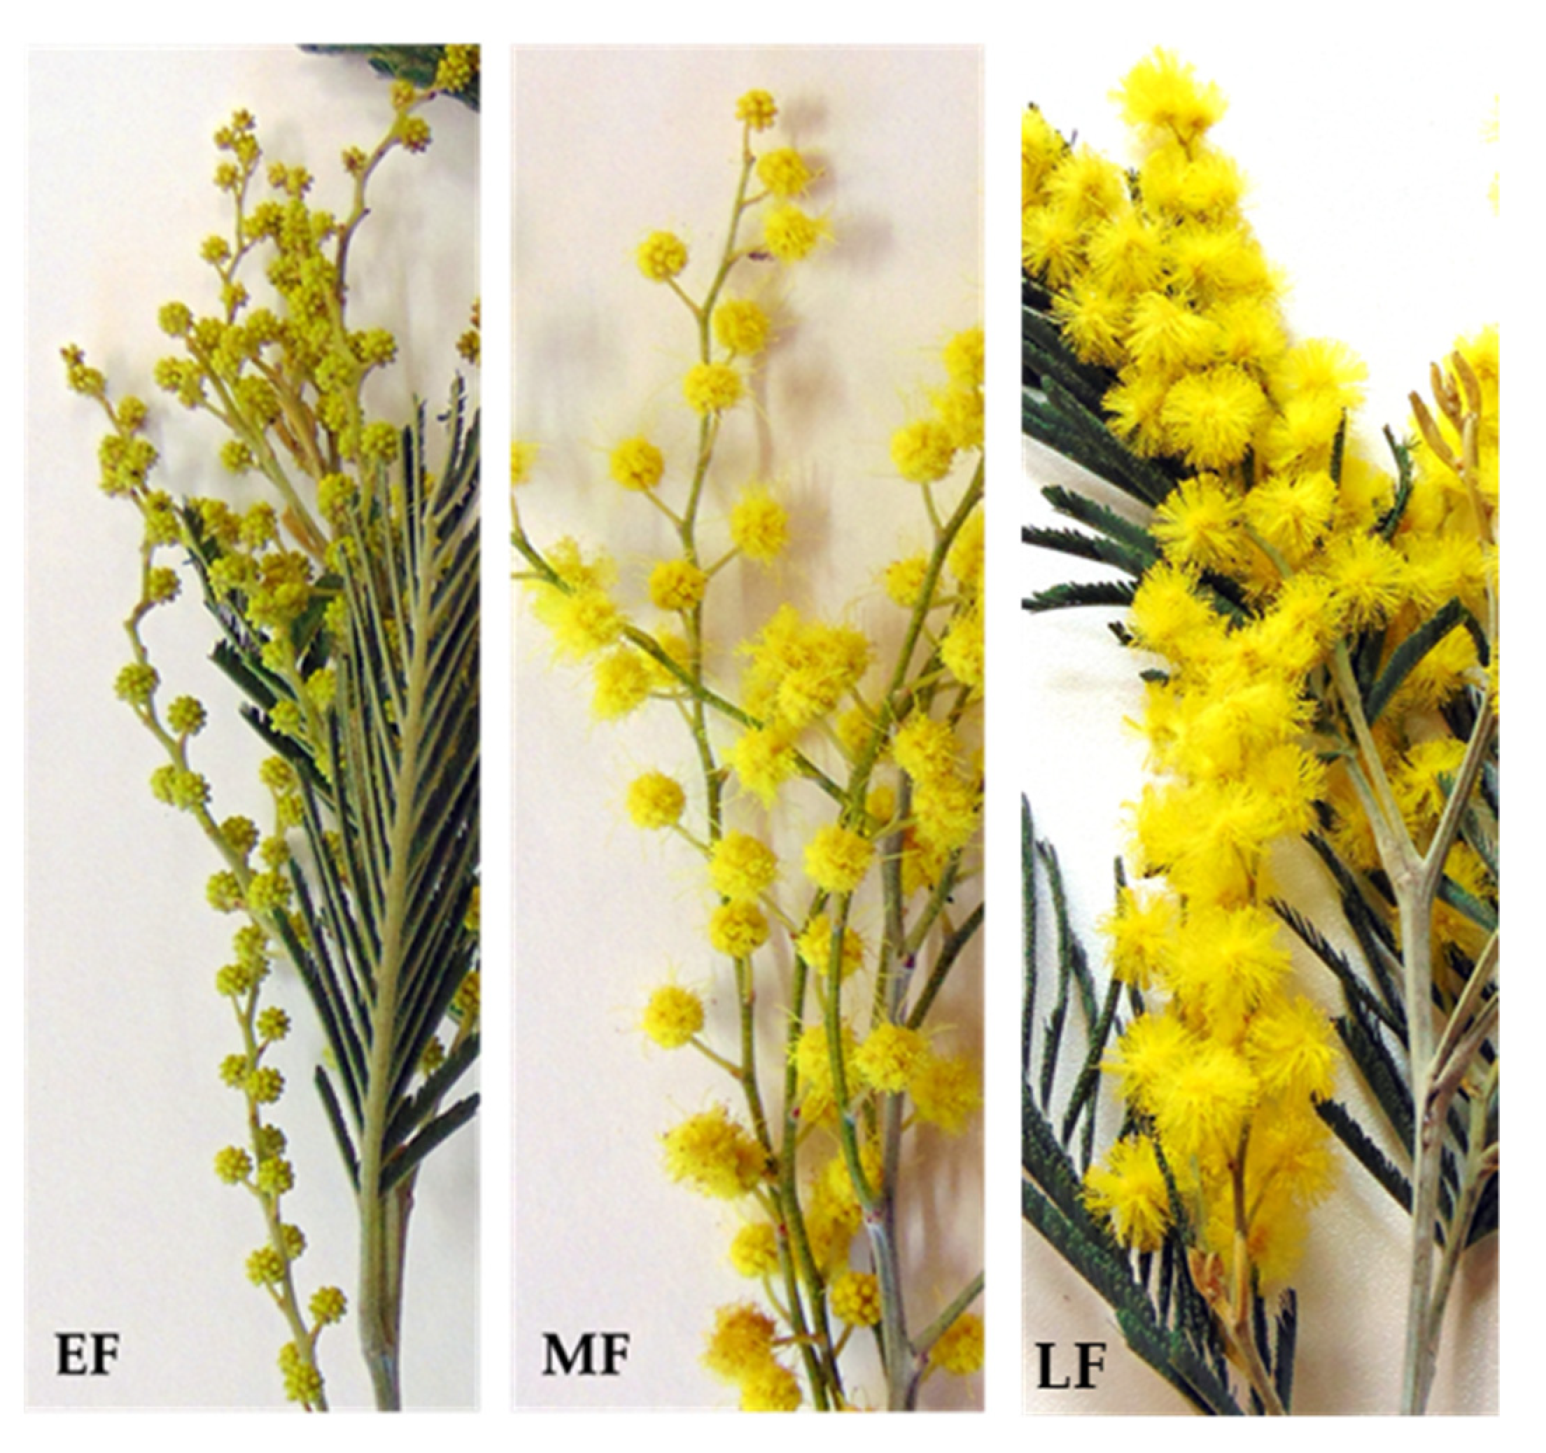
2.1. Plant Samples

The flowers of A. dealbata Link used in this study were harvested during three flowering stages (early flower—EF, mid flower—MF and late flower/ripening—LF), as shown in Figure 1, in 2018. After each harvest, the flowers were manually separated from the thick stems and leaves, and then lyophilized in dark conditions and milled. The fraction lower than 60 mesh was frozen at −20 °C until the extraction procedures. To study the characteristics and biological properties of the flowers, samples from two locations (A and B) in the central region of Portugal were analyzed and compared. These two regions were selected because there are large stands of this invasive species.

2.2. Extraction Conditions

The extraction procedure was performed according to Paula et al. [18]. Briefly, 10 g of flower samples were extracted with 100 mL of solvent with 50/50 ethanol/water following 15 h of stirring at 120 rpm at room temperature. Afterward, the flower samples were centrifuged at 5000 rpm for 10 min and the supernatant was collected and stored at −20 °C until further analysis. MilliQ water was used for the extraction and 96% ethanol was purchased from Merck. Therefore, in this study, the extracts were prepared via mixing. All extractions were performed in duplicate and all subsequent measurements and analyses were performed in triplicate. The final concentration of the extract was 100 mg/mL, which involved a calculation based on the differences between the dried weight before and after the extraction of plant material. Then, all the dilutions were corrected so that these presented the same concentration, namely, 100 mg/mL.

2.3. HPLC/DAD Conditions

Chromatographic analyses were carried out using HPLC/DAD [19]. Briefly, 50 μL of each extract prepared were submitted to analysis in a Gilson 170 and Waters Spherisorb ODS2 (5 mm) column (4.6 × 250 mm) using water acidified with o-phosphoric acid to achieve pH = 2.4 (A) and an acetonitrile (B) gradient with a 0.8 mL/min flow rate and a column temperature of 24 °C. All samples were analyzed in triplicate. Standard chromatograms were plotted at λmax values of 260 and 340 nm. Spectral data for all peaks were accumulated in the range 220–500 nm using DAD (Gilson 170; World Headquarters, Middleton, WI, USA), and the software Unipoint was used to analyze each of them. The suitability of the method was previously evaluated by Campos [19]. All the extracts were submitted to a results analysis of the main phenolic constituents. Structural determination of the phenolic compounds was performed according to the theoretical rules presented in Campos and Markham [20].

2.4. Total Phenol (TPC) and Flavonoid (TFC) Contents

The total phenolic compounds were determined using the Folin–Ciocalteu method [21]. A volume of 0.5 mL of the sample or standard was diluted with 2.5 mL of Folin–Ciocalteu (10% v/v) reagent, and afterward, 2 mL of sodium carbonate (Na2CO3, 75 g/L) was added. The absorbance was measured at a wavelength of 760 nm after incubation for 2 h in the dark. The calibration curve was prepared using standard solutions of gallic acid (AG) with concentrations between 50 and 350 mg/L.
The flavonoid content was estimated according to Woisky et al. [22]. Different extract concentrations (2.5 mL) were diluted with 2.5 mL of ethanol solution of AlCl3 (2%). After 1 h of incubation in the dark at room temperature, the absorbance of the mixture was read at 420 nm.

2.5. Antioxidant Activity

The original ferric reducing antioxidant power (FRAP) assay (without incubation) was monitored according to a method reported by Berker et al. [23]. A sample extract concentration (0.1 mL) was diluted with 0.3 mL distilled water and 3 mL FRAP reagent. The mixture was shaken and the absorbance was read at 595 nm after 6 min in the dark.
Previous to this assay, a DPPH screening was performed following the methodology described in Alencar et al. [24].

2.6. Acetylcholinesterase Inhibition Assay

The acetylcholinesterase inhibition was assessed spectrophotometrically as described by Sukumaran et al. [25]. The acetylcholinesterase activity was quantified using 5,5′-dithiobis-(2-nitrobenzoic acid) (15 mM, DTNB, Sigma Chemical, St. Louis, MO, USA); Electrophorus electricus acetylcholinesterase (electric eel Type-VI-S, Sigma Chemical, St. Louis, MO, USA) was used as the substrate. The hydrolysis of acetylcholine iodide was monitored through the formation of the anion 2-nitro-5-thiobenzoate (yellow) at 412 nm for 15 min. The percentage of inhibition was determined by comparing the rates of reaction of the samples with those of the blank (ethanol in phosphate buffer 0.2 M, pH = 8) using the expression ((E − S)/E) × 100, where E is the enzymatic activity without the extract and S is the activity of the sample. IC50 values were estimated from the graphic of inhibition percentage versus sample concentration. Eserine was used as a control.

2.7. Lipase Inhibitory effect

The inhibition of pancreatic lipase was assessed as described by Habib et al. [26]. In brief, 25 μL of the sample or the lipase inhibitor (Orlistat, Sigma Chemical, St. Louis, MO, USA) were mixed with 25 μL of lipase solution (16.7 U/mL in Tris-HCl, pH 8.0). For a 30 min incubation at 25 °C, the 4-methylumbelliferone product was released and the reaction was stopped by adding sodium citrate (0.1 mL of 0.1 M, pH 4.2). The measurements were performed with a fluorescence microplate reader (at 460 nm emission and 355 nm excitation). The results are expressed as percentages of α-lipase inhibition.

2.8. Inhibition Assay for α-Glucosidase Activity

The α-glucosidase activity was measured as reported by Tadera et al. [27]. The α-glucosidase-mediated transformation of the substrate pNPG into α-d-glucose and p-nitrophenol at 405 nm was monitored. In brief, the enzyme (0.05 U/mL, Sigma Chemical, St. Louis, MO, USA) was dissolved in 100 mM phosphate buffer (pH 6.8) in a 96-well plate. It was pre-incubated at 37 °C for 5 min with the samples (10–60 µg/mL); p-nitrophenyl-α- d-glucopyranoside (600 μM, Sigma Chemical, St. Louis, MO, USA) was then added and the mixture was incubated at 37 °C for 30 min. The enzymatic reaction was monitored spectrophotometrically by measuring the absorbance at 405 nm. The obtained values corresponded to the slope measured between 5 and 20 min. Acarbose (0–200 μM, Sigma Chemical, St. Louis, MO, USA) was used as a positive control.

2.9. Antimicrobial Potential

The in vitro antimicrobial activity was evaluated through a broth microdilution assay in 96 multi-well microtiter plates, as recommended by the Clinical and Laboratory Standards Institute (CLSI) Guidelines. The minimum inhibitory concentration (MIC) of the samples, defined as the lowest concentration of extract necessary to inhibit microbial growth, was determined against Gram-negative bacteria (Escherichia coli ATCC 29998TM and Escherichia coli ESA37 cephalosporins-resistant), Gram-positive bacteria (Staphylococcus aureus ATCC 43300TM and Staphylococcus aureus ATCC ESA111) and the yeasts Candida albicans ATCC 10231TM and amphotericin B-resistant Candida albicans ESA100. Gentamicin and amphotericin B were used as controls. The cell mass was diluted with 0.85% NaCl solution to reach 0.5 on the “MacFarland scale”, which was checked at 580 nm for bacteria and 640 nm for yeast. Muller–Hinton broth was used for bacteria or Yeasts Peptone Dextrose broth for yeast. Samples were diluted with broth to reach a concentration ranging from 5 to 30 mg/mL. The cell mass (106 colony-forming units (CFU)/mL) was added to all wells and incubated at 37 °C for 24 h and 25 °C for 48 h for bacteria and yeast, respectively. The antimicrobial activity was then determined by adding 20 μL of 2,3,5-triphenyl-2H-tetrazoliumchloride (TTC, 5 µg/mL) solution. In each assay, a negative control (containing only broth), a positive control (inoculated broth) and a DMSO control (DMSO with inoculated broth) were analyzed. The results were expressed in micrograms per milliliter.

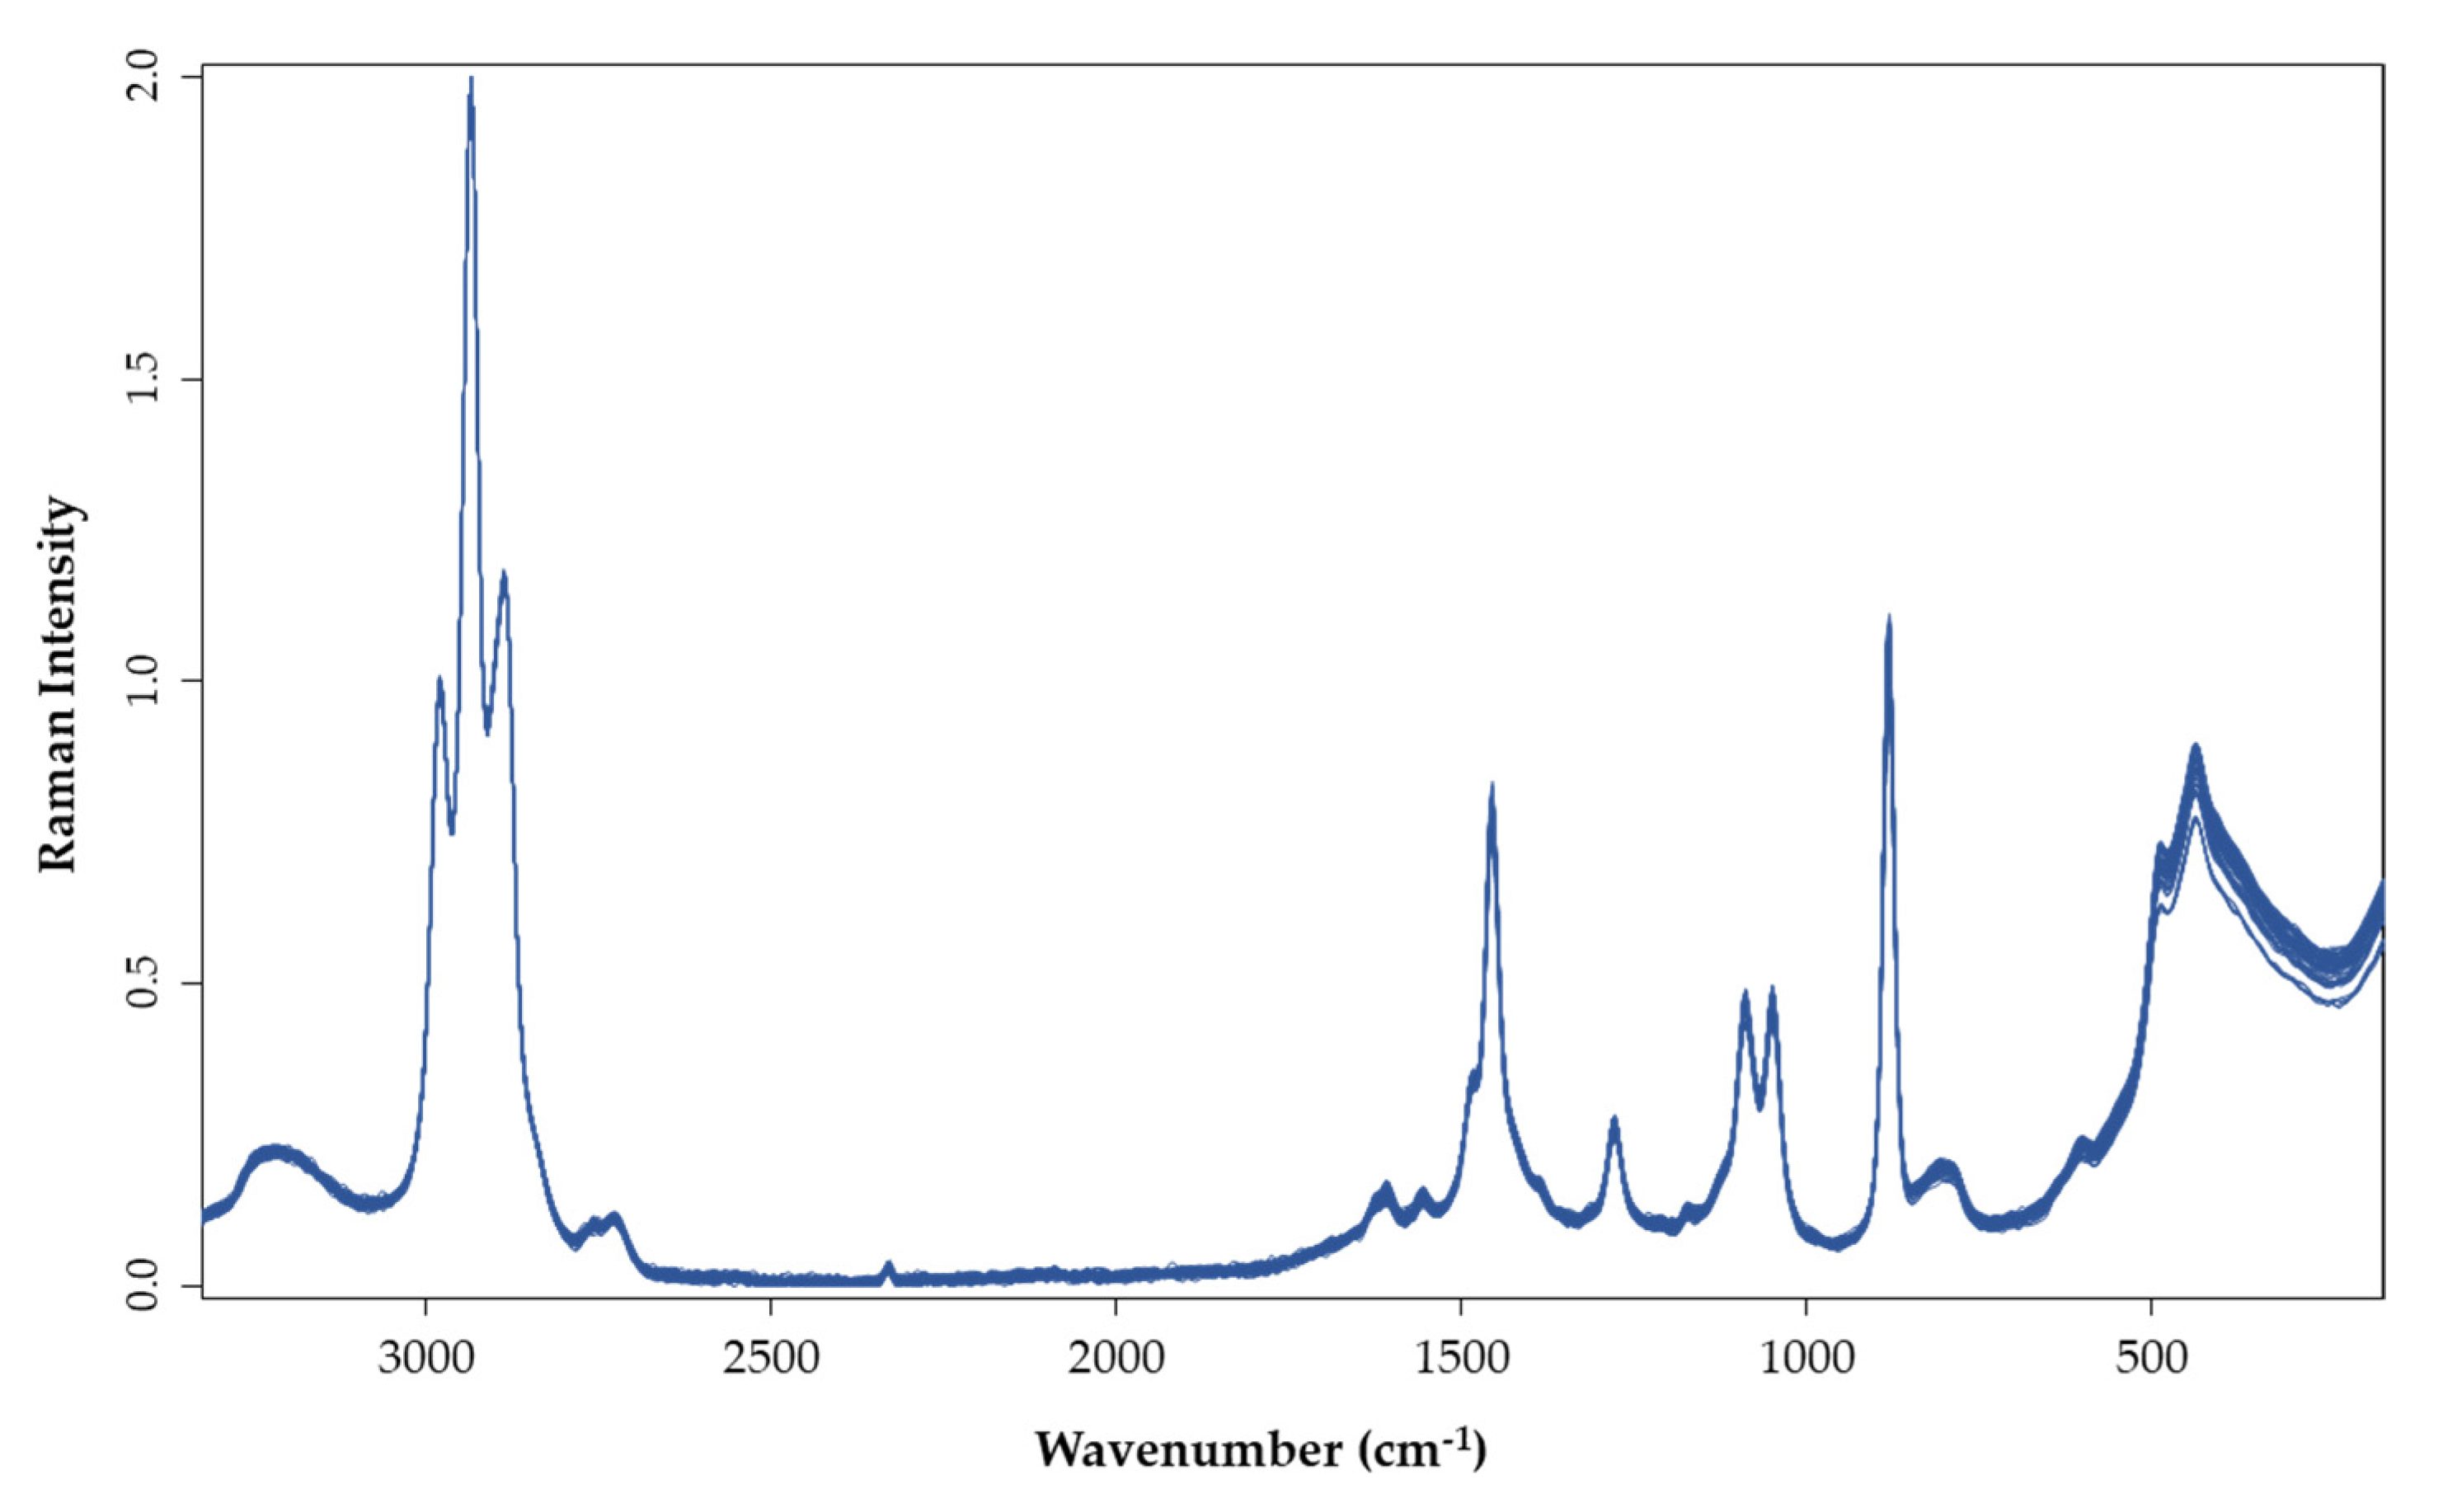
2.10. FT-Raman Spectral Acquisition

The spectra of the plant extracts were obtained using the methodology proposed by [28] using an FT-Raman spectrometer (BRUKER, MultiRAM, Bruker Portugal Unipessoal, Lisbon, Portugal), equipped with a 180° high-throughput collecting lens, an ultra-high sensitivity liquid nitrogen cooled Ge Diode detector and an integrated 1064 nm diode-pumped Nd:YAG laser with a maximum output power of 500 mW. The spectra were collected with 50 scans per spectrum at a spectral resolution of 8 cm−1 using a scanner velocity of 5 kHz in the wavenumber range from 4000 to 70 cm−1. The measurements were performed in duplicate in a 5 mm optic space quartz cell with the opposite face mirrored. The spectra were collected at constant room temperature (22 °C).

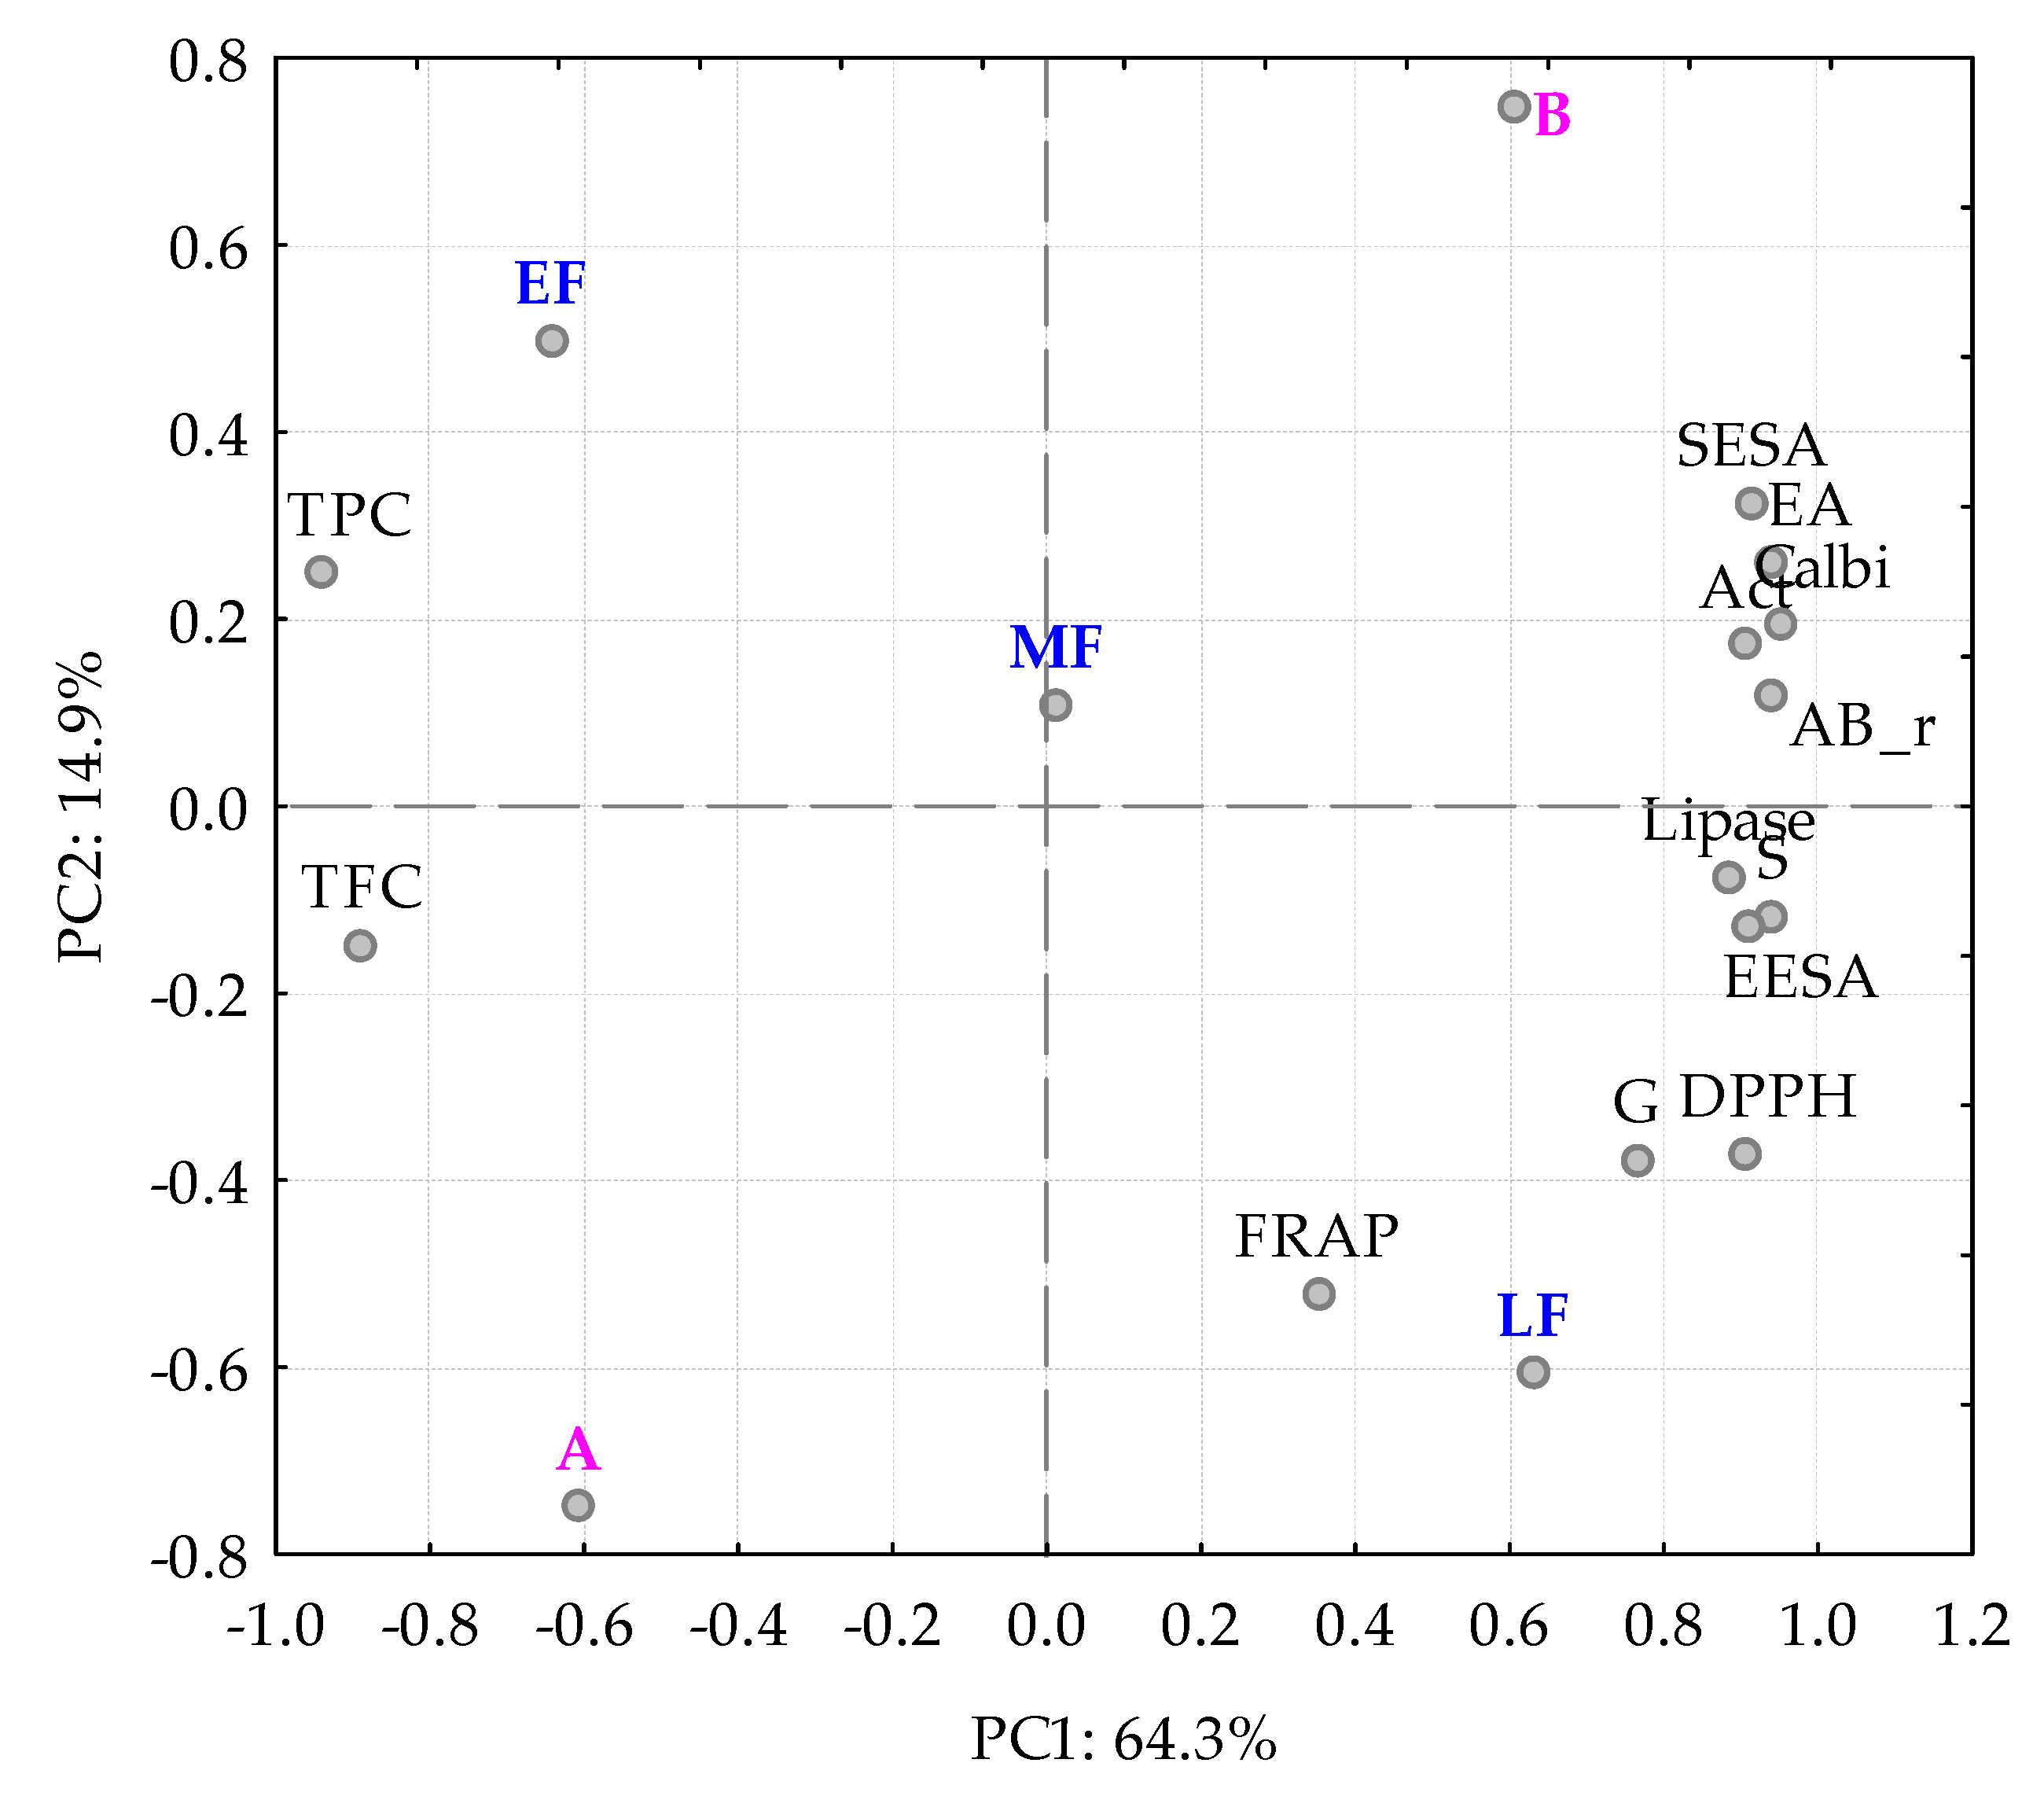
2.11. Statistical Analysis

The analysis of variance (ANOVA) was performed to identify the significance of the results and to determine the percentage of the variance of each factor using STATISTICA 7 (StatSoft Inc., Tulsa, OK, USA) software. Whenever the p-value was below 0.05, Tukey’s test was applied. Mean values and standard deviations were calculated and are presented in the figures as error bars.
Principal component analysis (PCA) was performed to identify the relationship between the factor (site and flower maturation) and the different variables measured.
For ANOVA and PCA, the StatSoft software was used; for spectral data analyses OPUS OPUS®, version: 7.5.18 (Bruker Optik, Ettlingen, Germany) and UnscramblerX 10.5 (CAMO, Oslo, Norway) were applied.

3. Results and Discussion

3.1. Characterization of the Extract
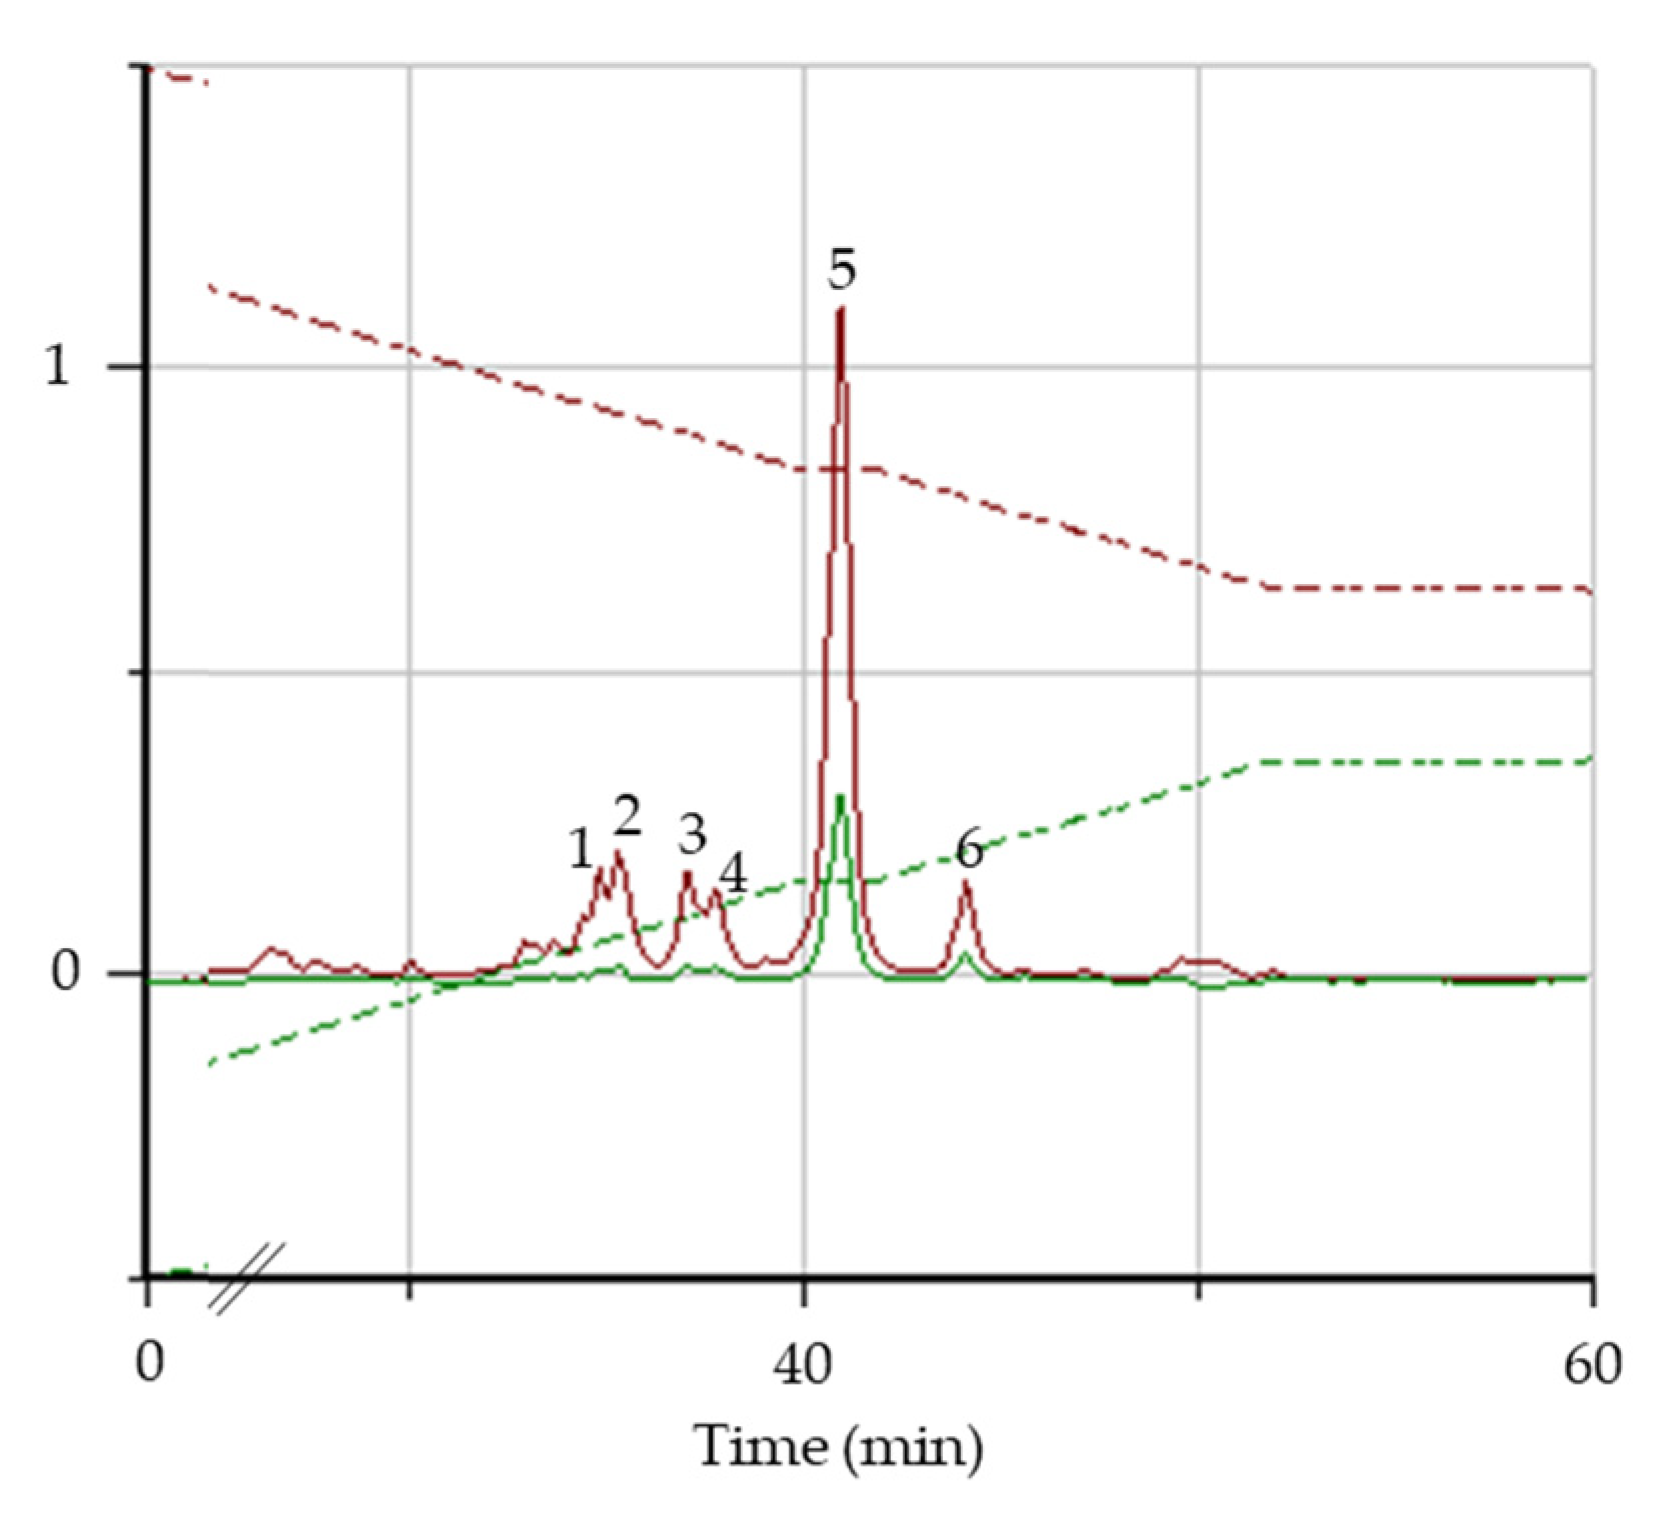
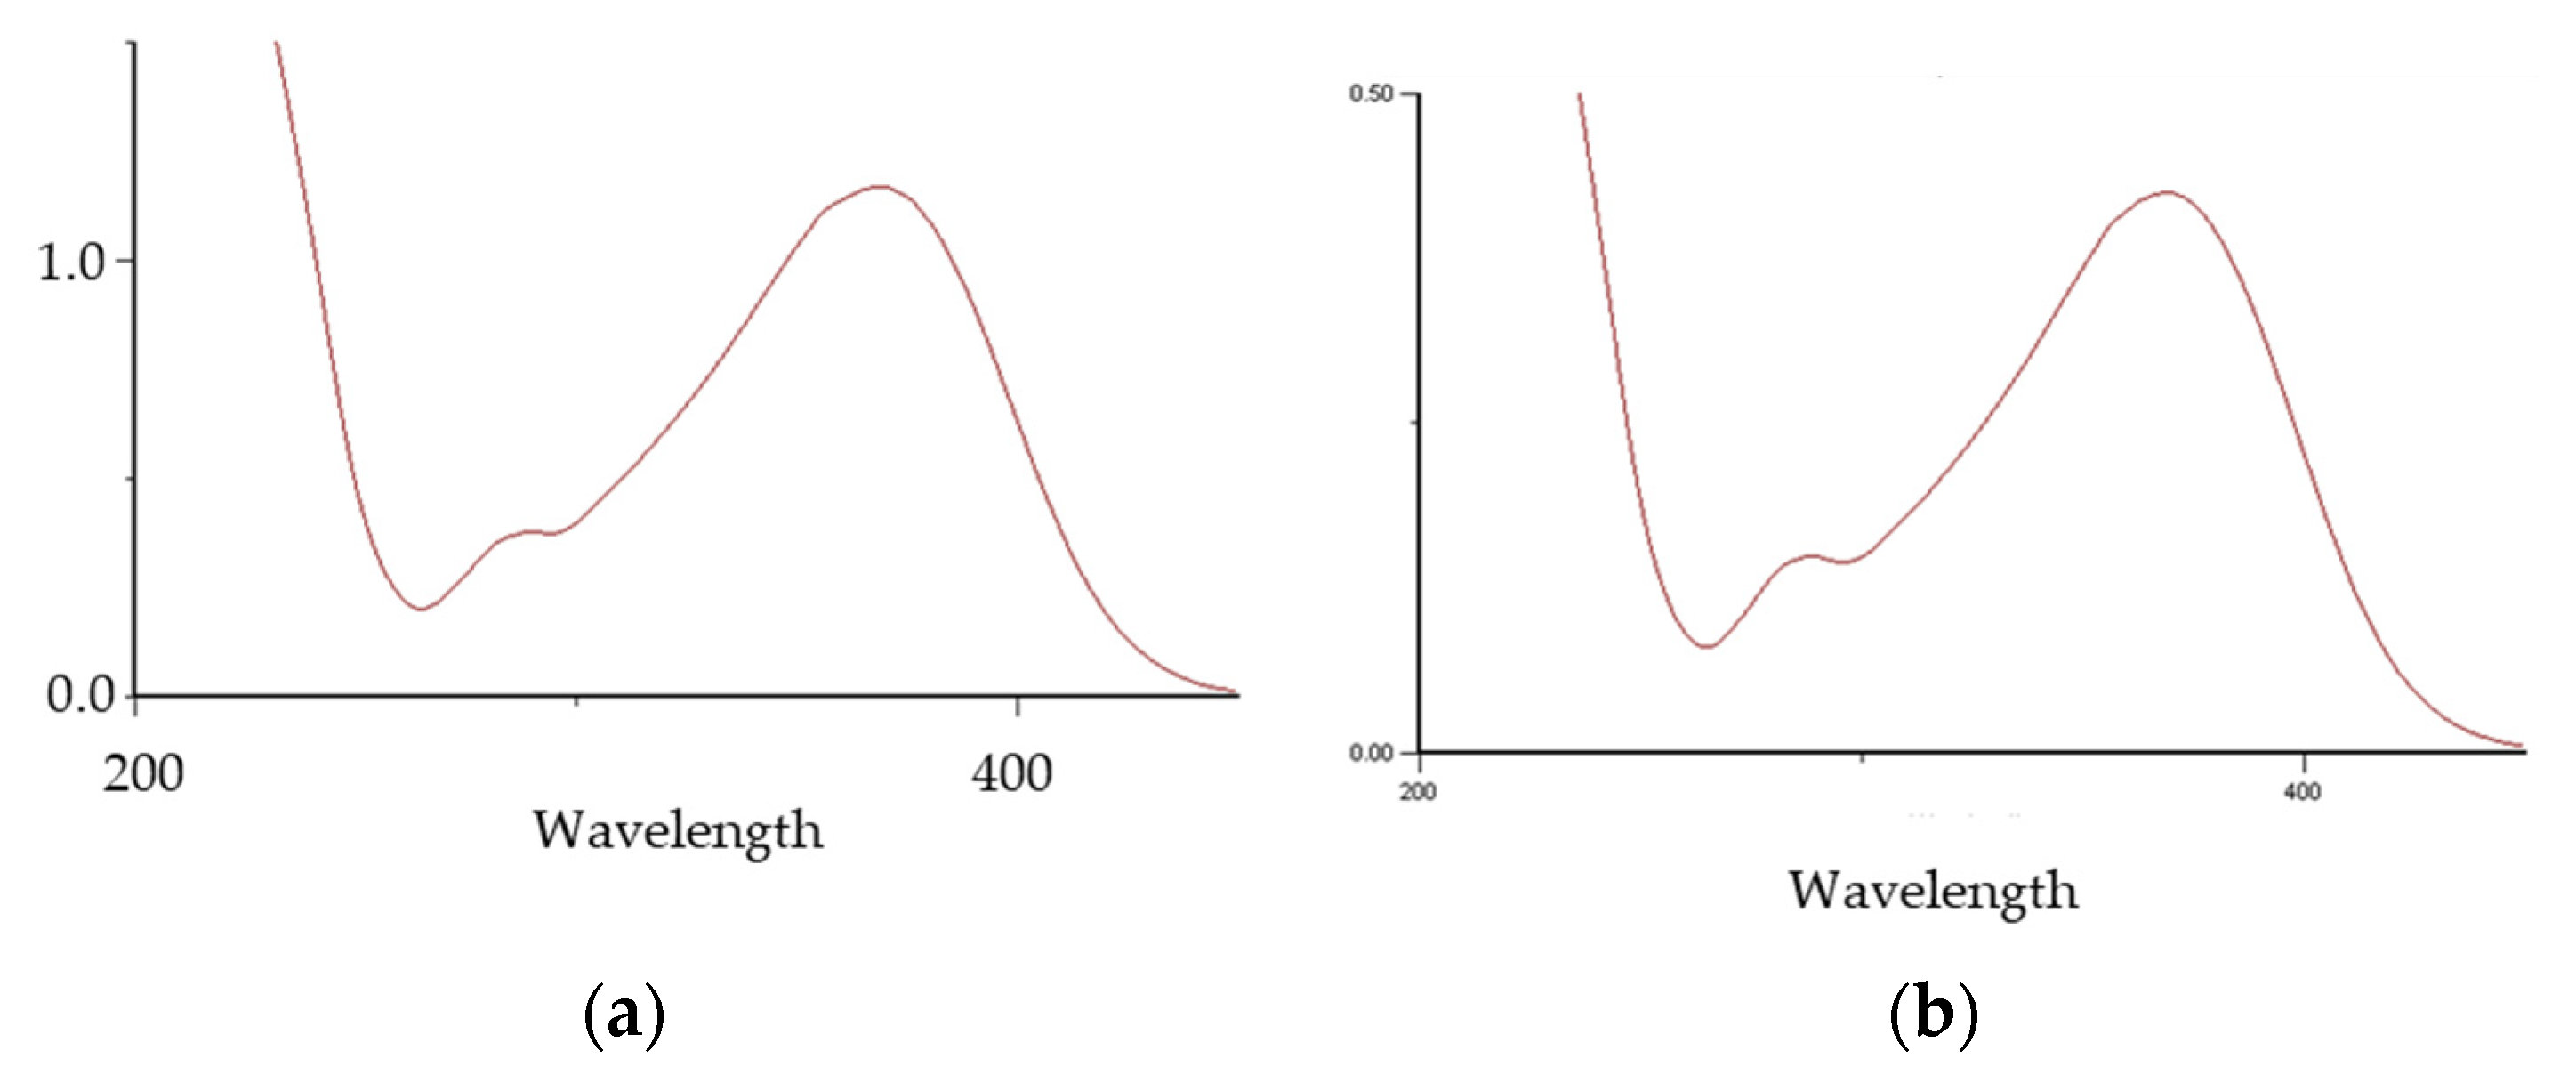
3.1.1. HPLC/DAD

From the HPLC/DAD chromatograms, six compounds were identified (Figure 2) and the corresponding ultraviolet absorption spectra of the most concentrated are provided in Figure 3. The minor compounds were related to the nucleus of flavonols (compounds 14) and the major were related to chalcones (compounds 5 and 6).
These latter components also belong to the flavonoid group of polyphenols; however, the C-ring remained open between the oxygen in position 1 and the carbon in position 2 (for a better understanding, please check the structure in Figure 4). These two compounds were chalcone derivatives that were previously identified by Campos [19].
Chalcones are polyphenols are structured as α,β-unsaturated aromatic ketones and can be found in various plants. They have been targeted in various studies that provide data about their potential in various therapeutic purposes, attributing bioactivities to them, such as helpfulness regarding oncology, infections and even in neurodegenerative diseases, including Alzheimer’s [29]. For the latter, the antioxidant and anti-inflammatory effects are also very important, and the data obtained with the present extract was found to be promising for some of these applications, as shown below.

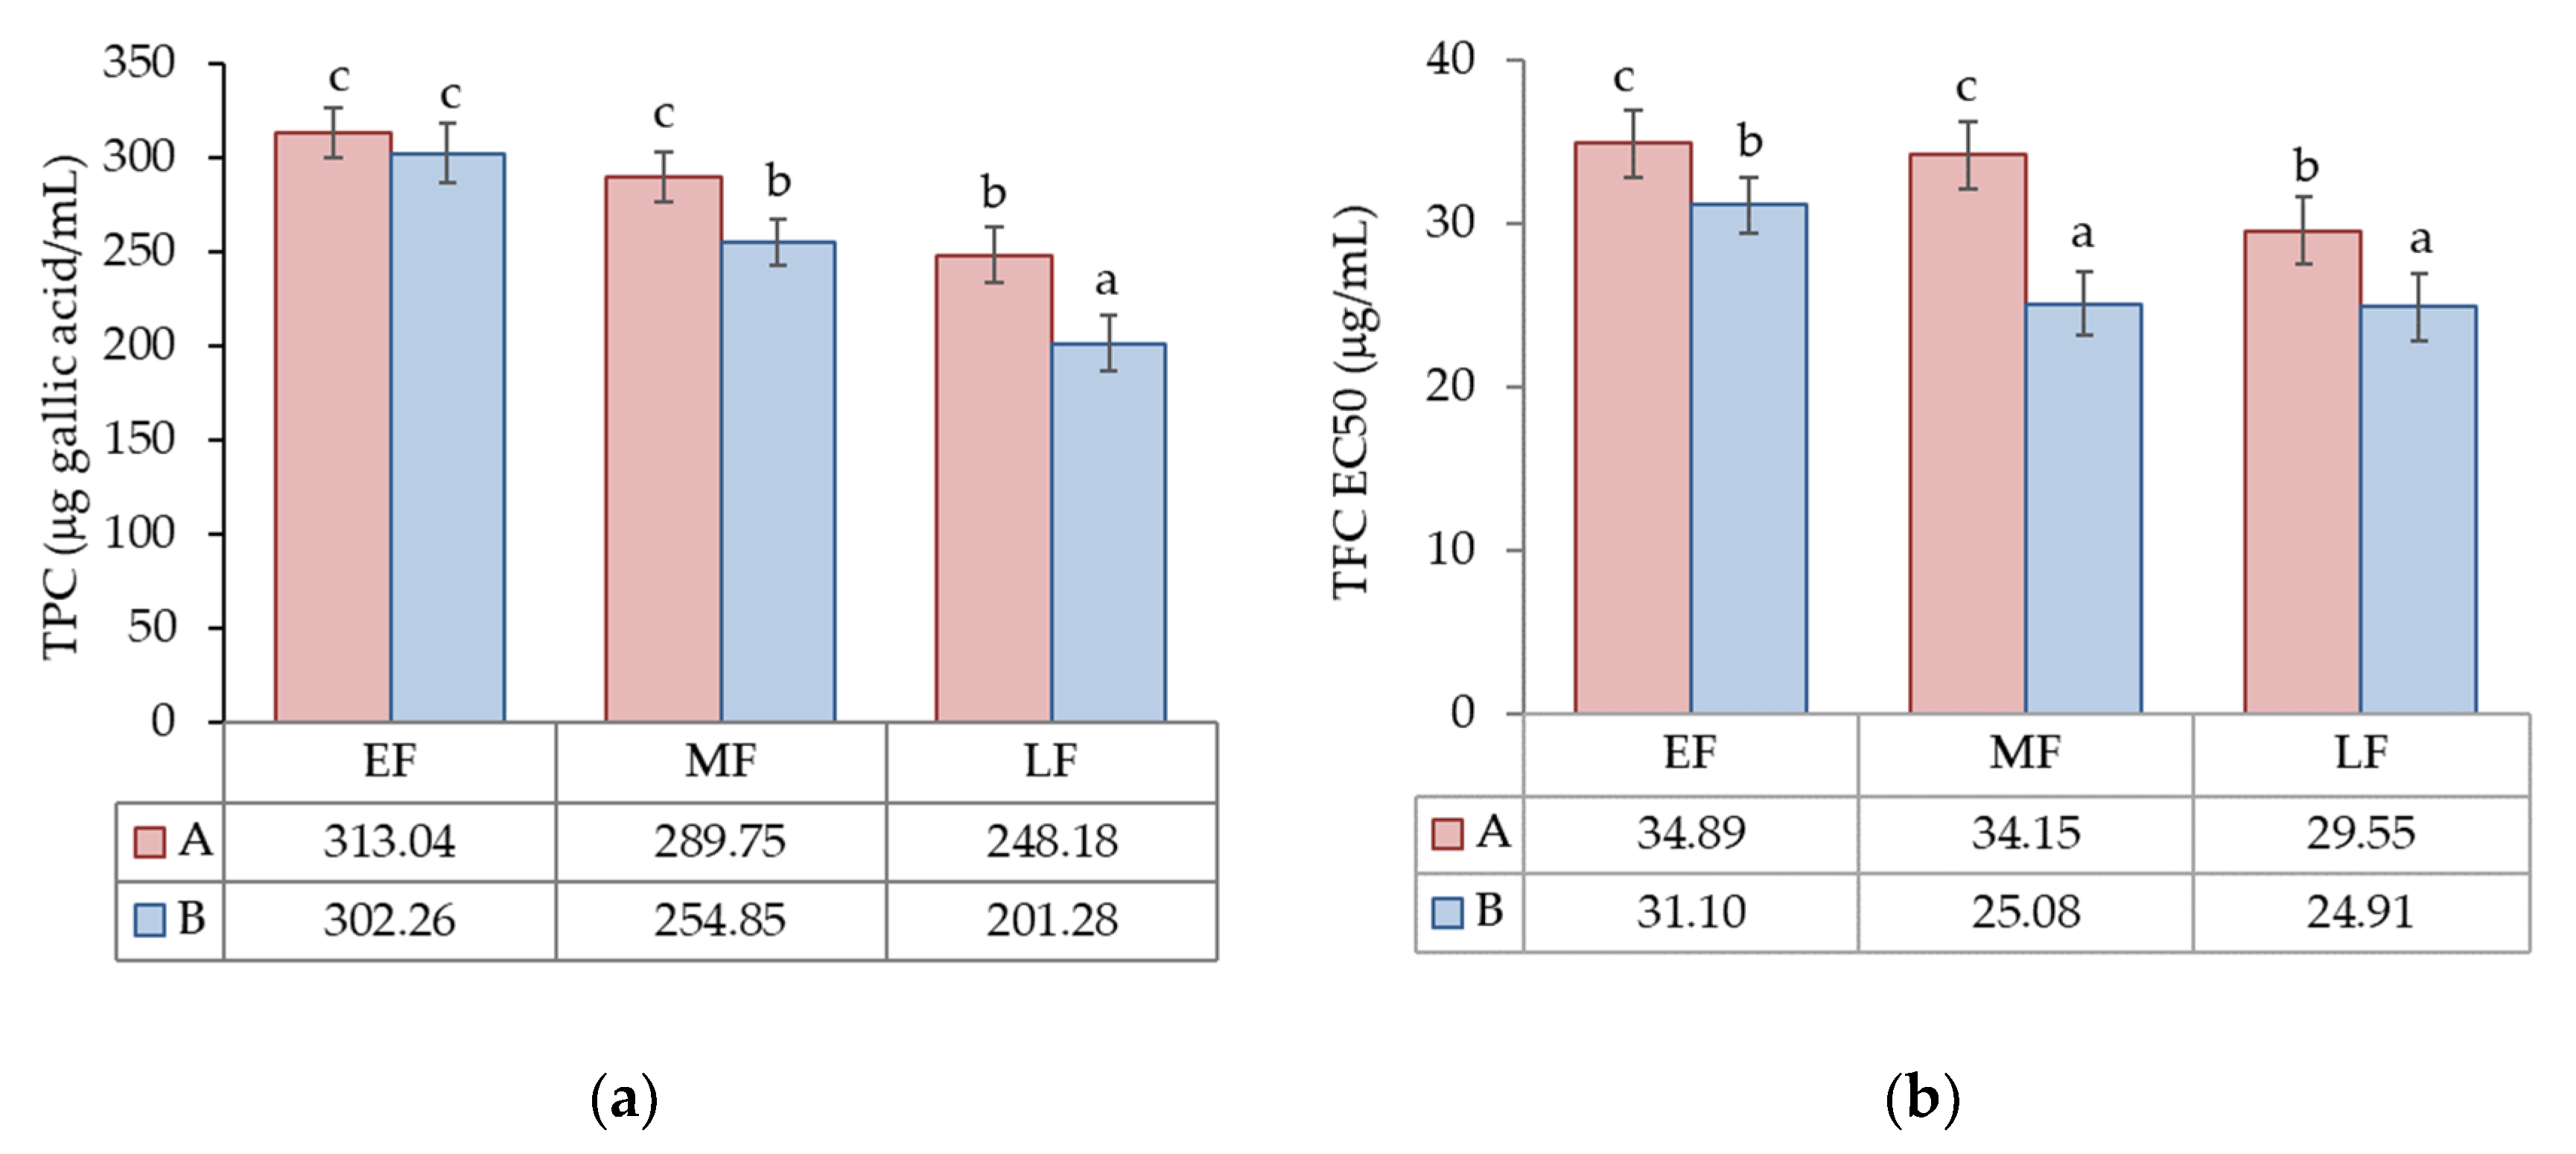
3.1.2. Total Phenol (TPC) and Flavonoid (TFC) Contents

Nevertheless, phenolic acid derivatives were not found in significate amounts in the hydroethanolic extracts, where its full quantification was performed using the fast, cheap and conventional Folin–Ciocalteu assay; chalcones can also be quantified with this methodology [30]. These results are shown in Figure 5, as well as the total content for flavonoids. The high TPC and TFC for both region extracts corresponded to the hydroethanolic solutions (50%) of the EF. However, even with lower differences, the highest concentration corresponded to EF from plants in region A.
The amount of TPC in flowers from the two different regions ranged from 201.28 to 313.04 μg gallic acid/mL for region B and region A, respectively, among the various statuses of maturation. The results obtained are in agreement with other authors, who obtained, for example, a concentration of 206.4 mg gallic acid/g sample in the Acacia flowers [31]. Wu et al. [32] obtained higher results for TPC with an ethanol extraction for A. confusa (544.4 mg/g of flower). In the aforementioned study, it was also found that the TPC was higher when ethanol was used as extract solvent. They also obtained high values for the antioxidant bioactivity due to this content in phenolic compounds.
The flowers harvested in region A presented a higher value of total phenol and flavonoid content, where this difference represented 24.4% of the total variation for the TPC and 37.4% for the TFC (Table 1). The maturation status was also of key importance where the higher values were obtained for the early flowering status (55.5% of the total variation for the TPC and 27.3% of the total variance for the TFC). This data was in accordance with the function of chalcones as precursors of flavonoids.
One of the goals in this work was to understand whether the early flowering status had better potential as a source of antioxidant compounds, or at least equal to the bioactivity of the compounds in the maturated flowers in the ripening stage, in order to collect them earlier and not give the possibility for the pollen to disperse. In this case, the results showed better activity than was expected, certainly due to the highest amounts of chalcones in this phase of the vegetative cycle of Acacia. These values were in line with the data obtained for the antioxidant activities. Studies from various authors with other Acacia spp. also showed that the TPC can vary according to the plant organ, solvent used in the extraction procedure and season [33,34], which were in accordance with the data here discussed for A. dealbata extracts.

3.2. Bioactivities

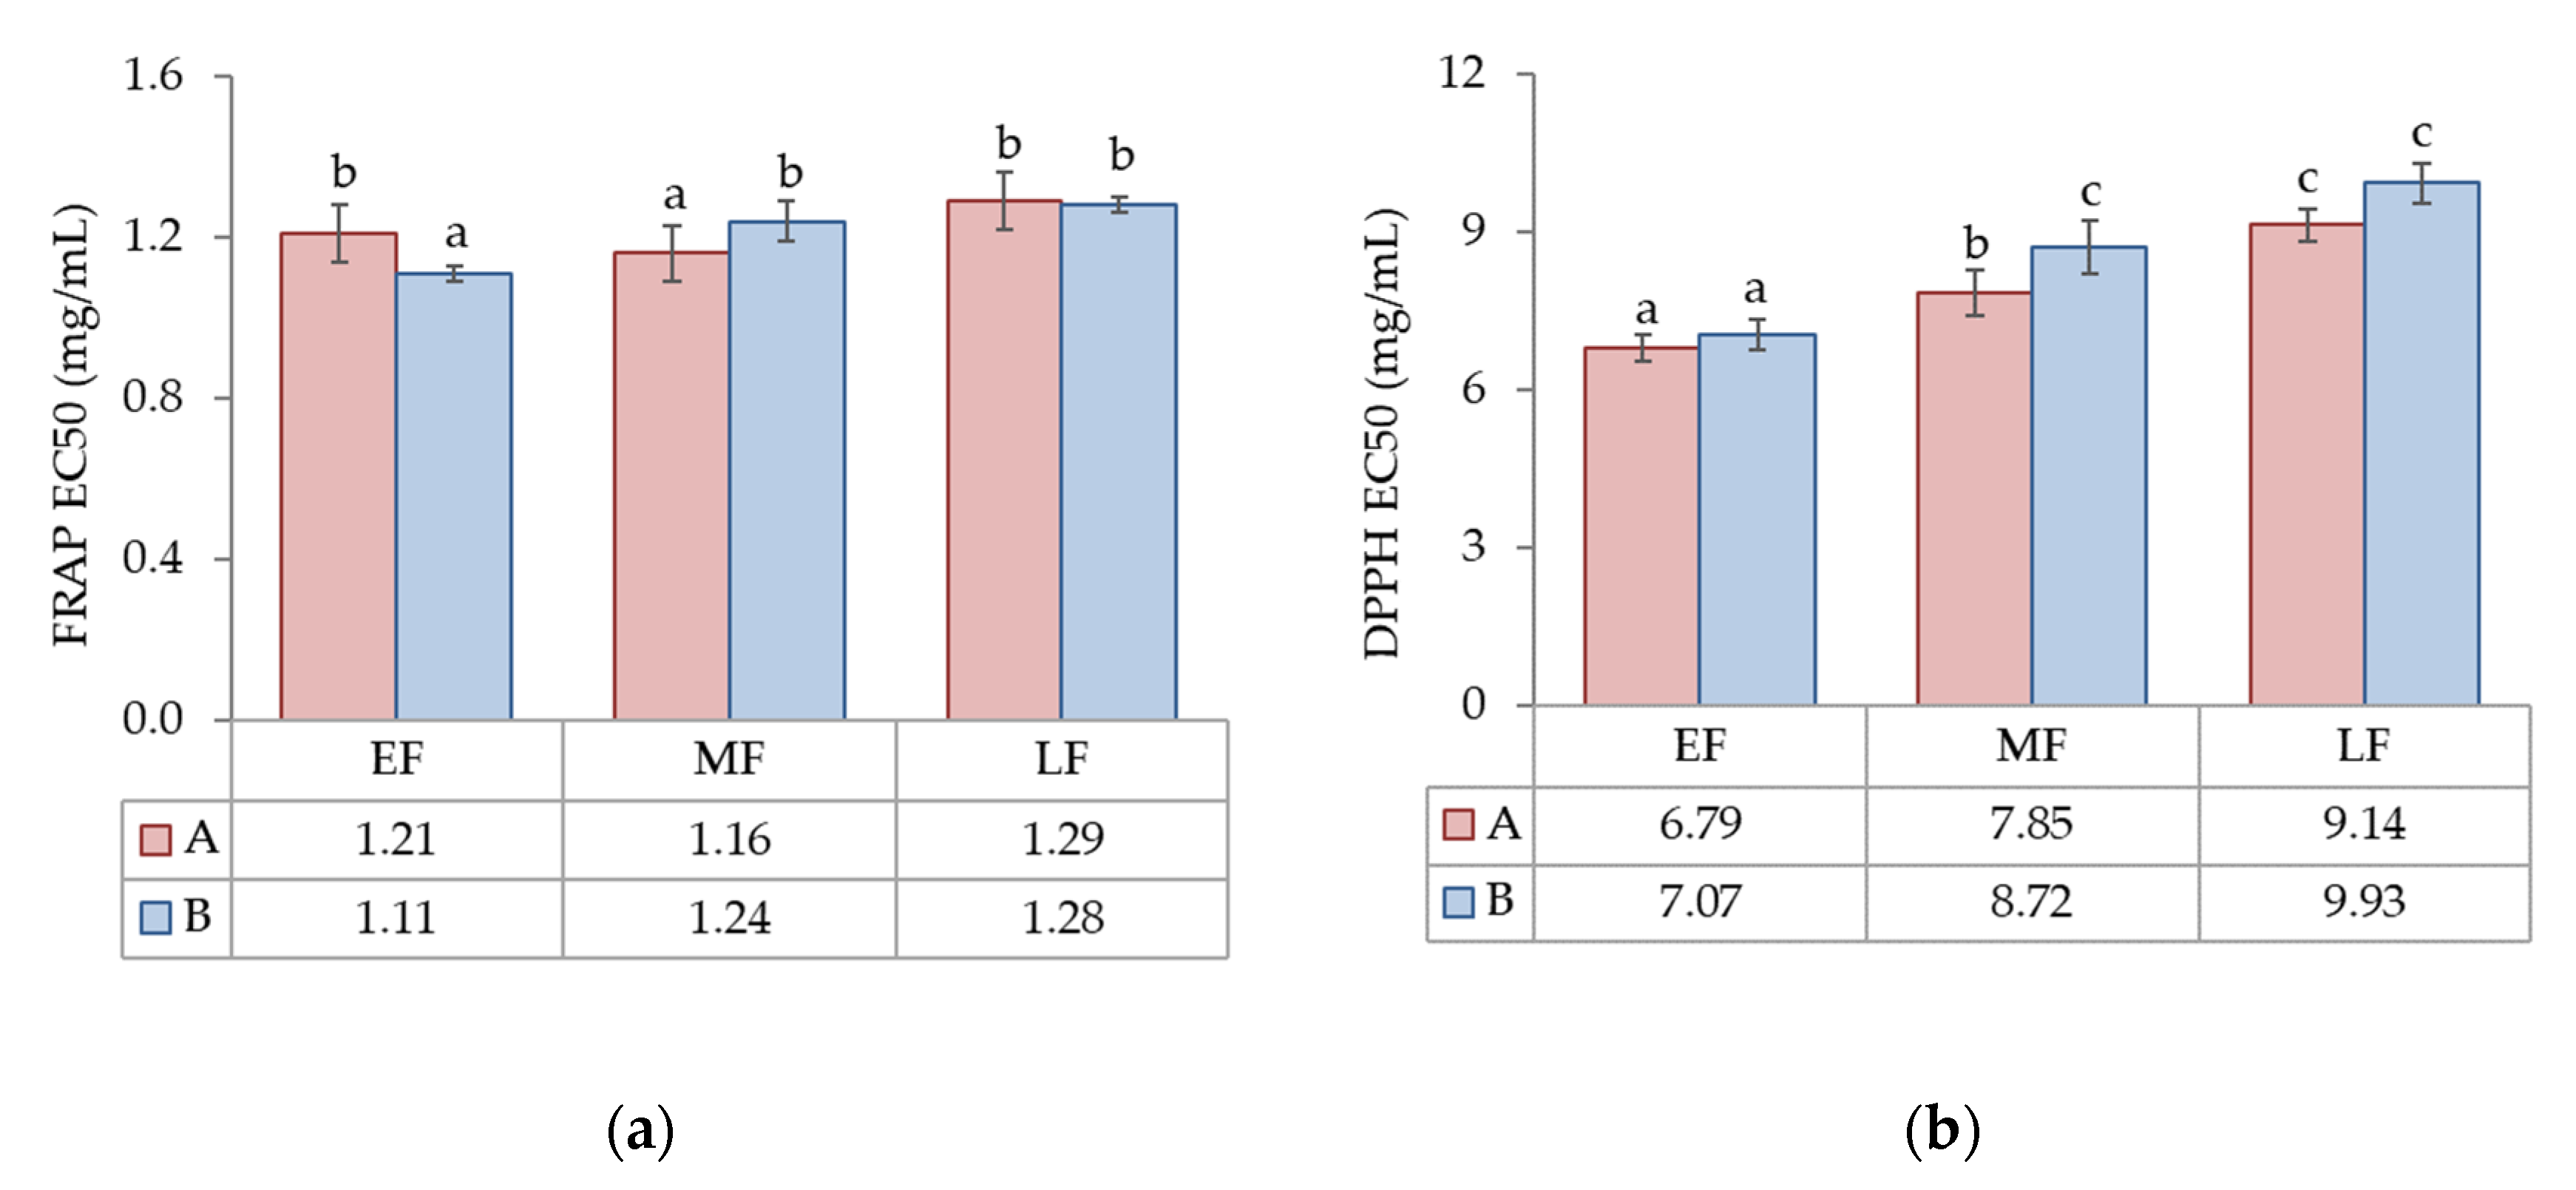
3.2.1. Antioxidant Activity

Among many other bioactivities associated with polyphenolic compounds, the antioxidant activity is one of the most reported [35,36] and can be explored for various purposes. The concerns about the increase in neurodegenerative diseases have increased the interest in some of these most promising molecules [29]. In the present work, our main goal was to verify its previous potential for the evaluation of the freshness of the matrix, for further standardization of the extracts and its potential for future research regarding anti-inflammatory drugs or to help in the prevention of degenerative diseases in accordance with its inhibitory activity for the enzyme acetylcholinesterase.
Various methodologies were chosen to evaluate this potential, as presented below. One of the most used to obtain preliminary data is the DPPH scavenging assay, which determines the capacity of a compound or group of compounds to stabilize the 2,2-diphenyl-1-picrylhydrazyl (DPPH˙) radical. The amount of extract required to scavenge 50% of DPPH solution (and for FRAP reagent) is defined as the IC50 (mg/mL). The antiradical free scavenging radical activity is measured through the stable radical DPPH, which shows the ability of substances present in the extracts to sequester free radicals from the existing medium. The extracts under evaluation showed free radical scavenging activity with EC50 values ranging from 6.79 to 9.93 mg/mL (Figure 6), which are good activities. The hydroethanolic extracts prepared with the EF collected in both locations showed similar results between the analyzed samples. Nevertheless, the data collected presented a decrease in this bioactivity with increasing maturation status. The results could be correlated to the content of phenols and flavonoids quantified in the samples. These first results suggested that A. dealbata could be a good source of natural antioxidants, which may be used to stabilize free radicals, which induce oxidative stress.
The other analysis performed to validate this data was a FRAP (ferric reducing antioxidant power) assay, which measures the ability of antioxidants to reduce the Fe(III)–TPTZ complex to the intensely blue Fe(II)–TPTZ complex in an acidic medium. The antioxidant activity can be measured spectrophotometrically by the change in color of the solution to blue resulting from the ferric to ferrous ion reduction, i.e., Fe(II) to Fe(III), while coordinated by 2,4,6-tris(2-pyridyl)-s-triazine (TPTZ). The data on the ferric reducing potential of the analyzed extracts also indicated better values for the EF extracts in both locations. All other extracts recorded moderate FRAP activity.
The data acquired with the extracts under study are shown in Figure 6.
Table 2 depicts that the material region harvested was not significant for the FRAP assay; however, the maturation status represented nearly 83% of the total variation in DPPH and nearly 54% for FRAP with a high significance.

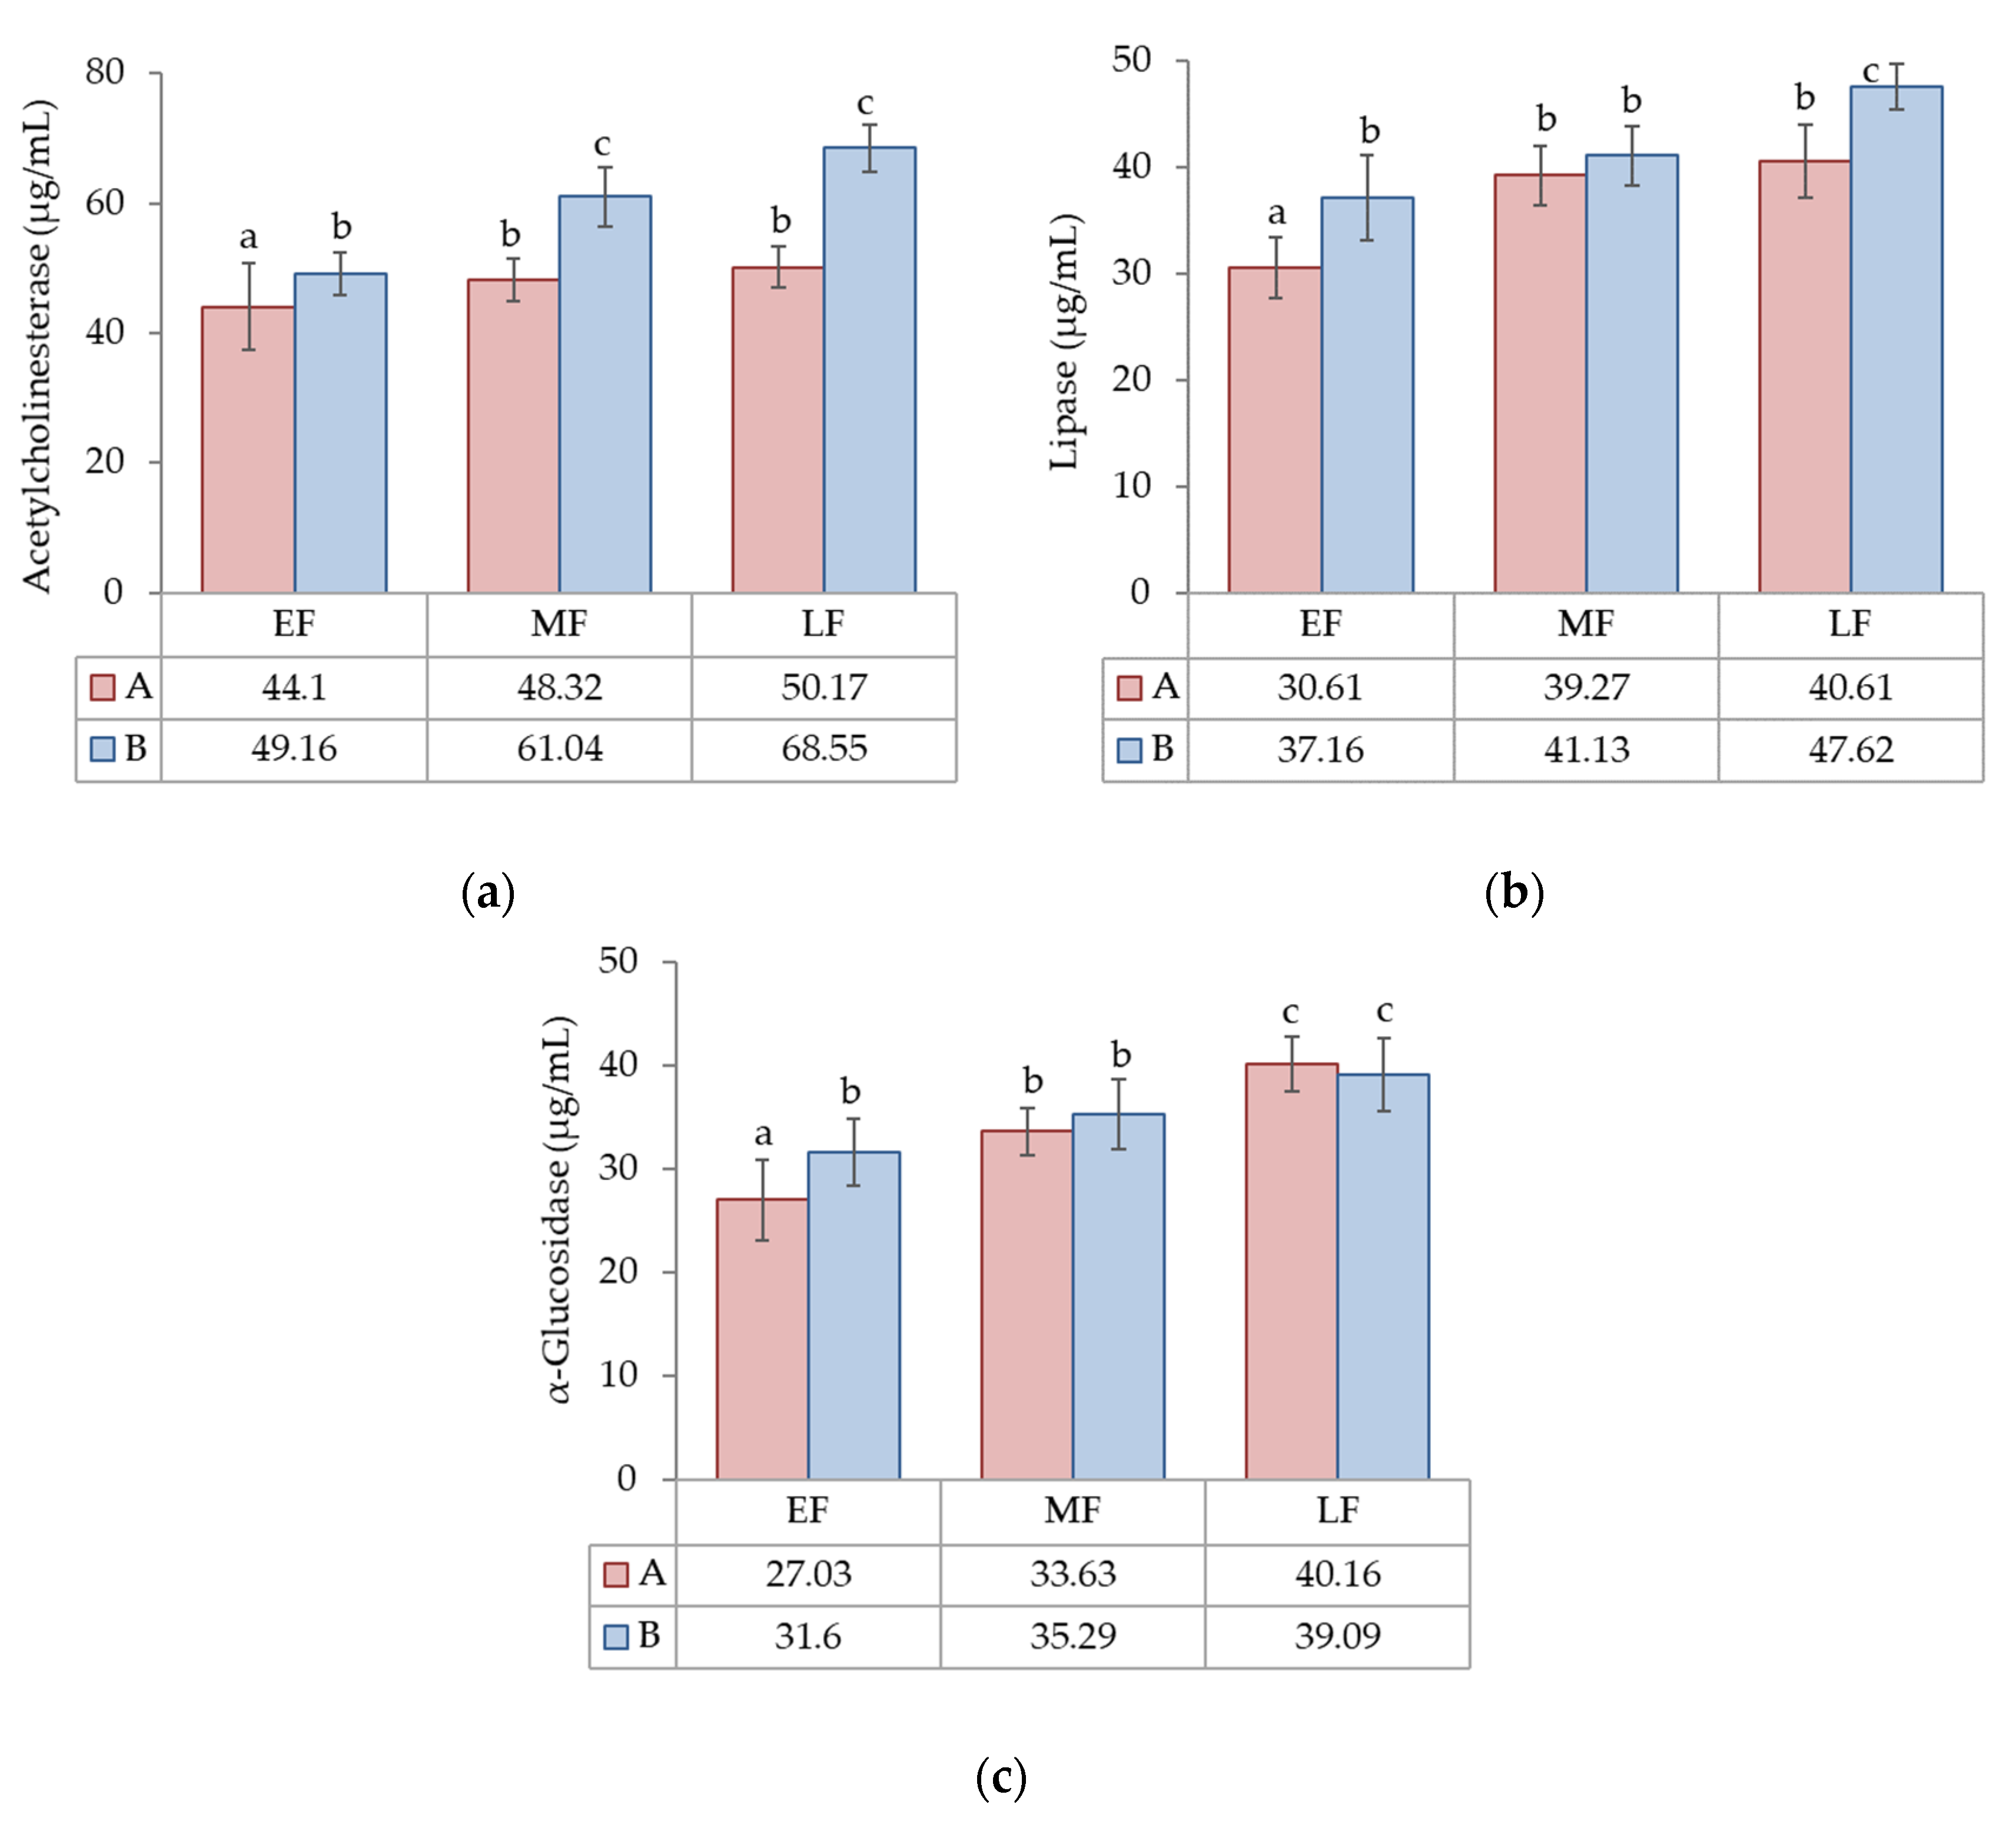
3.2.2. Enzyme Inhibitory Activity (Acetylcholinesterase, Lipase and α-Glucosidase Enzymes)

The enzyme inhibitory activity of A. dealbata flower extracts with different maturation stages was evaluated due to the potential application in drug discovery in different possible applications. The data shown here correlates with the three enzymes studied. First, the most relevant of them, which can be directly associated with neurodegenerative diseases, is the effect of acetylcholinesterase. This enzyme is able to metabolize acetylcholine, and its inhibition will increase this neurotransmitter in the synaptic cleft. The activity is expected to increase cerebral functions [37], which can contribute to delaying the development of neurodegenerative diseases.
All the flower extracts showed the ability to inactivate acetylcholinesterase, lipase and α-glucosidase enzymes (Figure 7). Despite all the concentrations of the extracts being able to inhibit the acetylcholinesterase enzyme, the most effective, with values between 44.1 and 49.16 µg/mL, was correlated with the EF maturation stage. Even using different Acacia mearnsii material (bark rich in tannin compounds), Ogawa and Yazaki [38] also verified similar results for lipase and glucosidase inhibition.
The flowers harvested in region A had a higher value of inhibition capacity for all the enzymes and this difference represented 51.9% of the total variation for acetylcholinesterase inhibition, 25.7% for lipase and without effect for 13.6% for α-glucosidase (Table 3). The maturation status (Table 3), once again, was also of key importance, with a higher variability attributed to these factor (27.7% of the total variation for acetylcholinesterase, 52.6% of the total variation for lipase and 68.5% of the total variation for α-glucosidase).
The importance associated with these three enzymes is the added value in the bioactivity, for instance, for acetylcholinesterase inhibition.

3.2.3. Antimicrobial Bioactivity

This bioactivity can be explored alone or even in parallel to others. For instance, if the target patients with neurodegenerative diseases need to be medicated with corticosteroids, which induce an immunodepression effect that makes them more vulnerable to infections, a molecule that accumulates acetylcholinesterase inhibition and activity against the most common bacteria and yeasts will improve the therapy [39]. Therefore, to complete the bioactivities for these extracts, we chose this last bioactivity, which will contribute better performance to further studies of the compounds in the extracts.
The extracts were screened for the antimicrobial activity for various microorganisms E. coli ATCC 29998 TM, Staphylococus aureus ATCC 43300TM, Candida albicans ATCC 10231 TM, E. coli ESA37, S. aureus ATCC ESA111 and amphotericin-B-resistant Candida albicans ESA 100 were tested.
The minimum inhibitory concentration of the A. dealbata flower extracts with different maturation stages is shown in Table 4.
The results shown in Table 5 report the higher effects of the region and maturation status on the antimicrobial bioactivity. Once again, the extracts from the EF harvested in region A gave the best activity. It seems that maybe a possible change occurred due to the different climatic conditions, soils or other factors. The effect of the harvest place should be explored more in future research designed with this purpose.
To summarize, in Figure 8, it is possible to see that all the data collected clearly highlighted that for all the bioactivities explored in these extracts, the EF status of maturation was the most significant. The principal component analysis explained 79.2% of the total variability observed for the different parameters analyzed concerning the two factors (site and maturation status). It is possible to note that regions A and B showed different behaviors concerning the studied properties, highlighting an influence of the harvest place regarding the properties of the plants given to the extracts. PC1 (which explained 64.3% of the total variation) clearly separated the three maturation stages, with EF showing the better results, which could be an advantage because collecting the flower in an early stage inhibits the possibility of the reproduction of the plant, which prevents further reproduction and invasion of other lands.

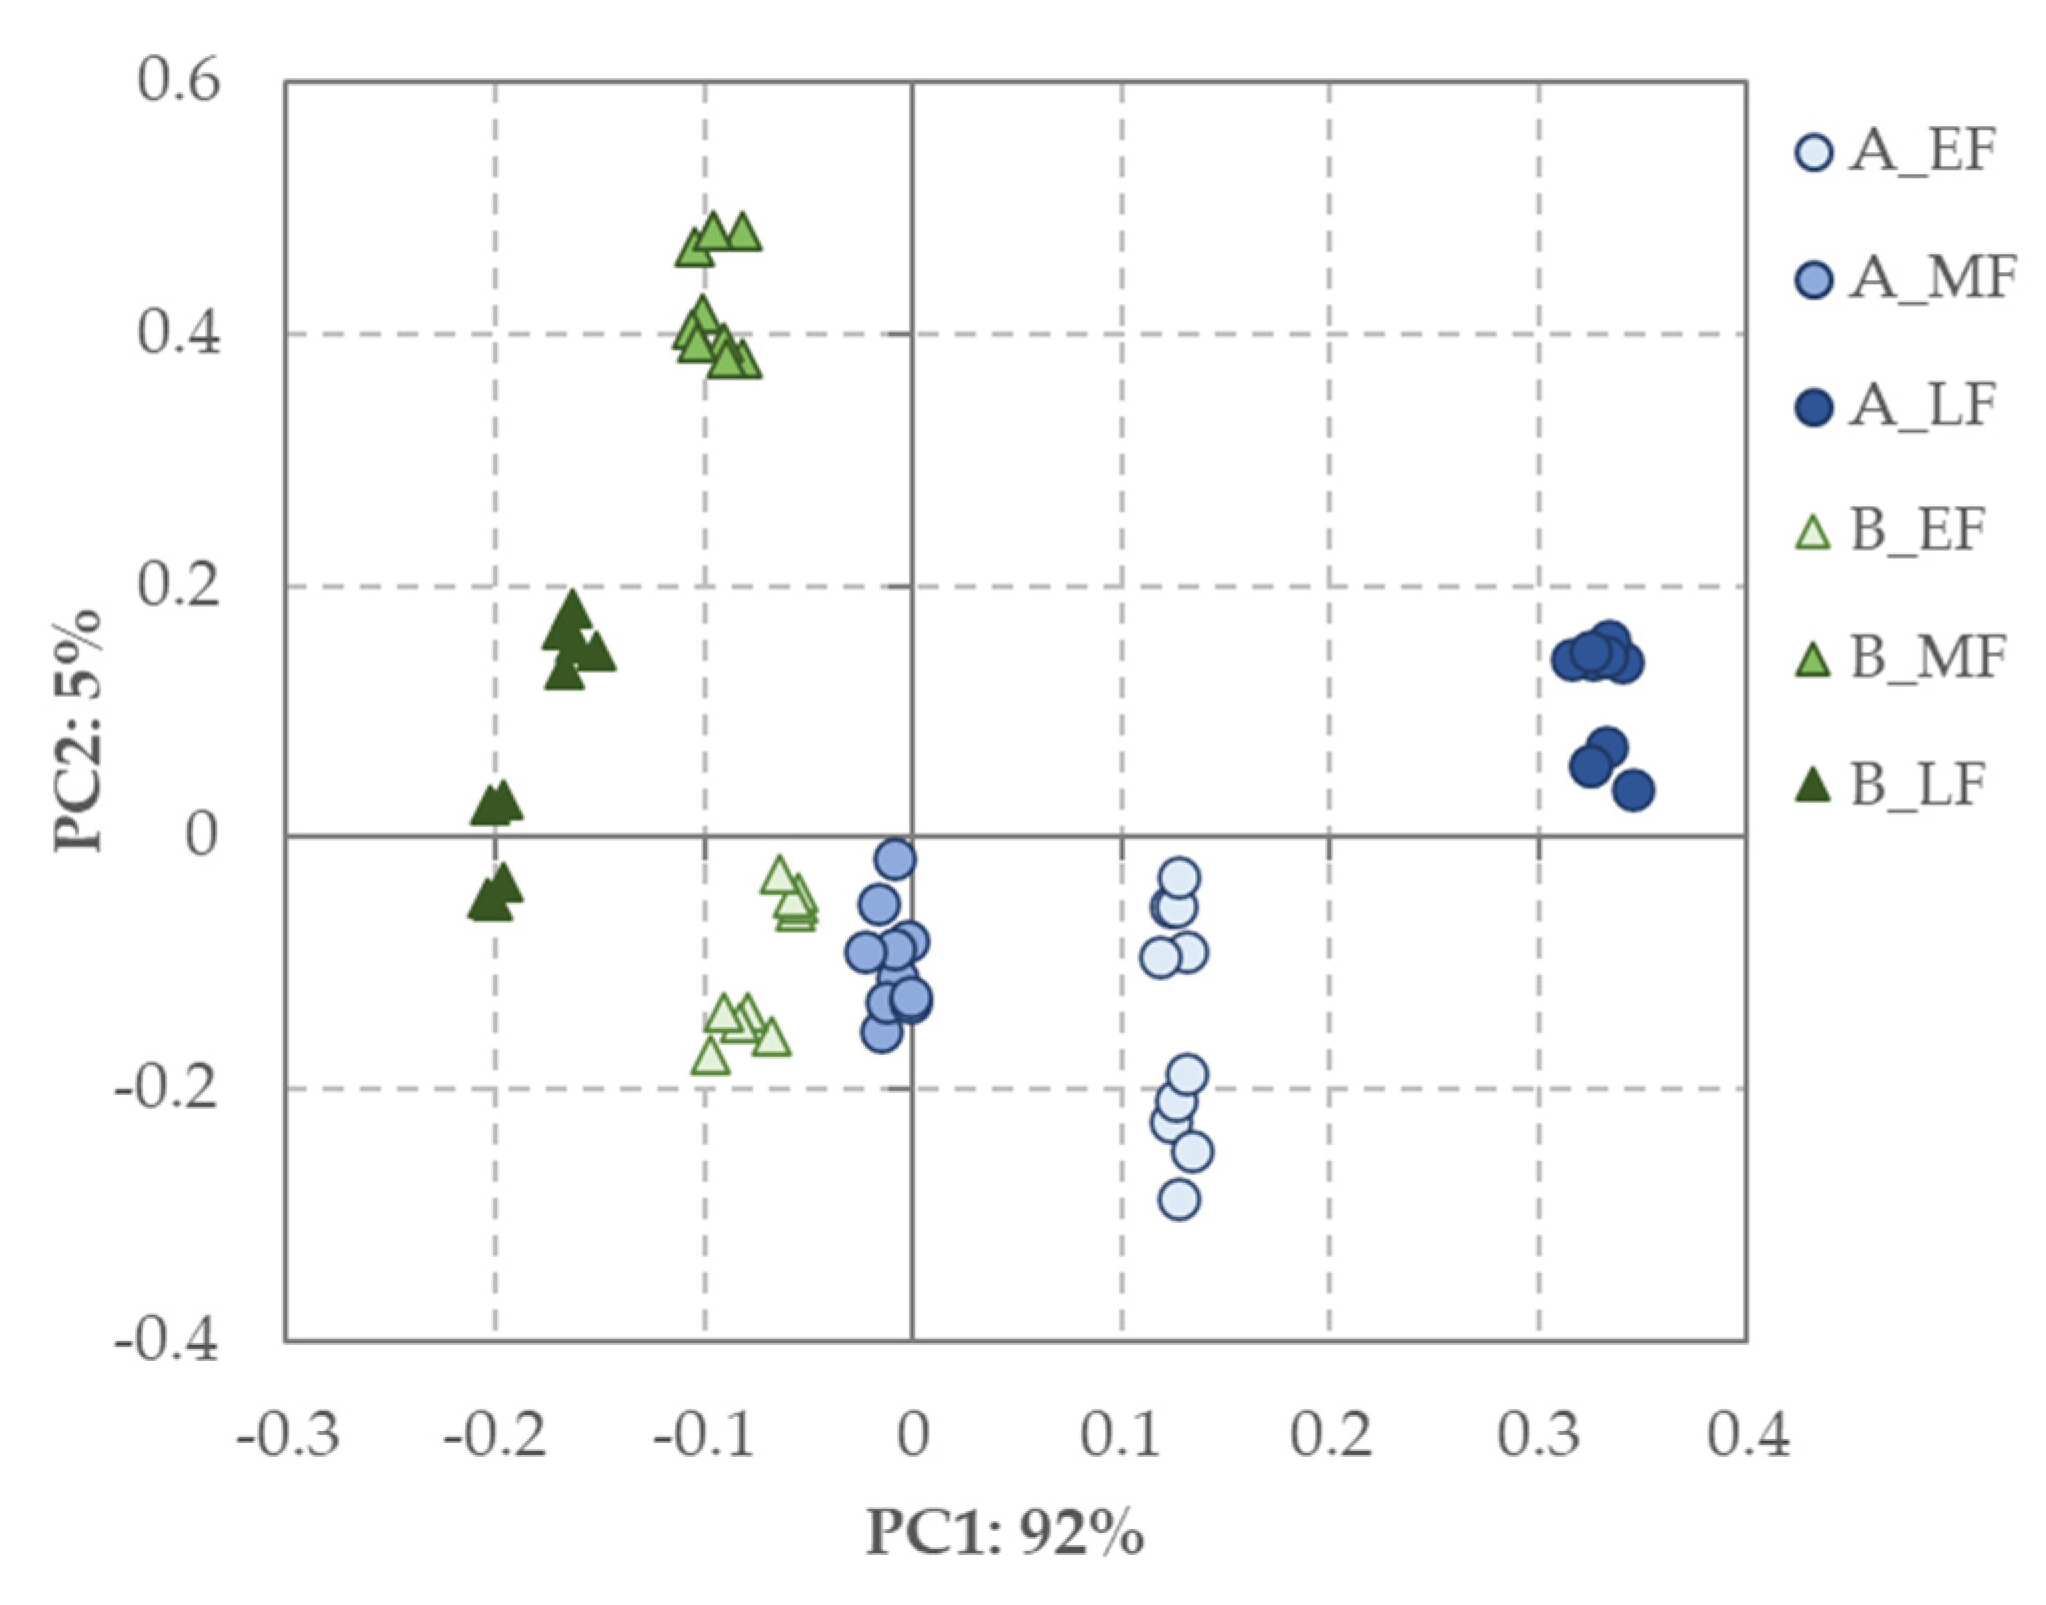
3.3. FT-Raman Spectral Acquisition

The spectra obtained with the hydroethanolic flowers extract (50:50) shown in Figure 9 display the strong influence of the compounds in this matrix [40]. The intense bands around 2975, 2931 and 2883 cm−1 were assigned to C–H stretching of some compounds present in the plant extracts, but also of the CH2 and CH3 stretching of the ethanol [18], and were influenced by the other substances from the plant extracts. The peak at 1450 cm−1 corresponded to the C–OH bending of ethanol, but also originated from the combination of bending vibration of CH2 and the vibration of the COO– group in the flavanol and organic acids [41,42].
The band at 1270 cm−1 was found to be due to the deformation vibration of O–C–H, C–C–H and C–O–H.
The peaks at 1090 and 1050 cm−1 were from the in-plane movement of the carbon ring and the substituents, which are regions linked to the characterization of alcohols, ethers, esters, carboxylic acids and anhydrides [43].
The bands around 705 cm−1 corresponded to the C–O and C–C–O stretching and O–C–O bending, and the bands in the 880 cm−1 region were assigned to the C–H, C–O–H and CH2 bending.
Concerning the results of the PCA (mean centered) made with the spectral data (Figure 10) the separation between regions as observed for the analytical data is clear, as well as the separation between the maturation stages of the flowers.
These results showed that Raman spectroscopy is a promising technique for discriminating between flower raw materials to identify possible differences in the biological activities of their extracts.
To our knowledge, this is the first time that these extracts have been studied and these bioactivities were explored together to provide a possible new drug strategy in neurodegenerative treatments, among other possibilities, and to help to contribute to the control of an invasive plant.

4. Conclusions

One of the challenges to be faced soon is the green chemistry and development of new drugs with low environmental impacts. The compounds of A. dealbata in the EF stage were found to have the necessary bifocality that fulfilled these two requirements. The antioxidant activity and the acetylcholinesterase inhibition of the compounds in the extracts enrolled in this work are presented for the first time as promising for further potential research for some therapeutic purposes, for instance, neurodegenerative diseases. These compounds can also be redesigned in new structures for new drugs, for instance, to enhance memory and other brain functions by influencing chemical activity in the brain. From the data presented in this work, all the assays revealed the best potential for the non-mature flowers of A. dealbata. This allows for the possibility to harvest them at this preliminary status and stop the reproduction of the plant, which will help to control its invasive potential.
In this study, it was also shown that Raman spectroscopy is a promising technique for identifying the differences between flower extracts in order to better select raw materials based on their biological activities.

Author Contributions

Conceptualization, O.A., M.G.C. and L.M.E.; methodology, V.P., M.G.C., S.I.P., T.D., L.M.E. and O.A.; software, O.A.; validation, V.P., M.G.C., S.I.P., T.D., L.M.E. and O.A.; formal analysis, V.P., M.G.C., S.I.P., T.D., L.M.E. and O.A.; investigation, V.P., M.G.C., S.I.P., L.M.E. and O.A.; writing—original draft preparation, V.P., M.G.C., S.I.P., L.M.E. and O.A.; writing—M.G.C., L.M.E. and O.A.; supervision O.A., M.G.C. and L.M.E.; project administration, O.A., M.G.C. and L.M.E.; funding acquisition, M.G.C., L.M.E. and O.A. All authors have read and agreed to the published version of the manuscript.

Funding

This research was funded by project PCIF/GVB/0145/2018 (Acacia4fireprev). This work is also funded by National Funds through the FCT—Foundation for Science and Technology under the Projects UIDB/00239/2020 (CEF), (UI0204): UIDB/00313/2020 and UIDB/00690/2020 (CIMO).

Institutional Review Board Statement

Not applicable.

Informed Consent Statement

Not applicable.

Data Availability Statement

We choose to exclude this statement because the study did not report any data.

Conflicts of Interest

The authors declare that they have no conflict of interest.

References

  1. Mohammad, D.; Chan, P.; Bradley, J.; Lanctôt, K.; Herrmann, N. Acetylcholinesterase inhibitors for treating dementia symptoms—A safety evaluation. Expert Opin. Drug Saf. 2017, 16, 1009–1019. [Google Scholar] [CrossRef]
  2. Lorenzo, P.; Pereira, C.S.; Rodríguez-Echeverría, S. Differential impact on soil microbes of allelopathic compounds released by the invasive Acacia dealbata Link. Soil Biol. Biochem. 2013, 57, 156–163. [Google Scholar] [CrossRef]
  3. Marchante, E.; Freitas, H.; Marchante, H. Guia Prático para a Identificação de Plantas Invasoras de Portugal Continenta; Imprensa da Universidade de Coimbra: Coimbra, Portugal, 2008; ISBN 9789892603988. [Google Scholar]
  4. Lorenzo, P.; González, L.; Reigosa, M.J. The genus Acacia as invader: The characteristic case of Acacia dealbata Link in Europe. Ann. For. Sci. 2010, 67, 101. [Google Scholar] [CrossRef] [Green Version]
  5. Domingues De Almeida, J.; Freitas, H. Exotic naturalized flora of continental Portugal—A reassessment. Bot. Complut. 2006, 30, 117–130. [Google Scholar] [CrossRef]
  6. Souza-Alonso, P.; González, L.; Cavaleiro, C. Ambient has Become Strained. Identification of Acacia dealbata Link Volatiles Interfering with Germination and Early Growth of Native Species. J. Chem. Ecol. 2014, 40, 1051–1061. [Google Scholar] [CrossRef] [PubMed]
  7. Casas, M.P.; Conde, E.; Ribeiro, D.; Fernandes, E.; Domínguez, H.; Torres, M.D. Bioactive properties of Acacia dealbata flowers extracts. Waste Biomass Valorization 2020, 11, 2549–2557. [Google Scholar] [CrossRef]
  8. Pinto, F.; Silva, F.; Barbosa, A. Evaluation of Haemolytic Activity of Leaves from Acacia podalyriifolia. Eur. J. Med. Plants 2016, 17, 1–5. [Google Scholar] [CrossRef] [Green Version]
  9. Silva, B.M.; Andrade, P.B.; Seabra, R.M.; Ferreira, M.A. Determination of selected phenolic compounds in quince jams by solid-phase extraction and HPLC. J. Liq. Chromatogr. Relat. Technol. 2001, 24, 2861–2872. [Google Scholar] [CrossRef]
  10. Lin, H.Y.; Chang, T.C.; Chang, S.T. A review of antioxidant and pharmacological properties of phenolic compounds in Acacia confusa. J. Tradit. Complement. Med. 2018, 8, 443–450. [Google Scholar] [CrossRef]
  11. Li, X.-C.; Liu, C.; Yang, L.-X.; Chen, R.-Y. Phenolic compounds from the aqueous extract of Acacia catechu. J. Asian Nat. Prod. Res. 2011, 13, 826–830. [Google Scholar] [CrossRef]
  12. De Andrade, C.A.; Miguel, M.D.; Miguel, O.G.; Ferrnato, M.d.L.; Peitz, C.; Cunico, M.; Dias, J.d.F.G.; Balestrin, L.; Kerber, V.A. Efeitos Alelopáticos das Flores da Acacia podalyriaefolia A. Cunn. Visão Acadêmica 2003, 4, 93–98. [Google Scholar] [CrossRef] [Green Version]
  13. Abdel-Farid, I.B.; Sheded, M.G.; Mohamed, E.A. Metabolomic profiling and antioxidant activity of some Acacia species. Saudi J. Biol. Sci. 2014, 21, 400–408. [Google Scholar] [CrossRef] [Green Version]
  14. Ziani, B.E.C.; Carocho, M.; Abreu, R.M.V.; Bachari, K.; Alves, M.J.; Calhelha, R.C.; Talhi, O.; Barros, L.; Ferreira, I.C.F.R. Phenolic profiling, biological activities and in silico studies of Acacia tortilis (Forssk.) Hayne ssp. raddiana extracts. Food Biosci. 2020, 36, 100616. [Google Scholar] [CrossRef]
  15. Saini, M.L.; Saini, R.; Roy, S.; Kumar, A. Comparative pharmacognostical and antimicrobial studies of Acacia species (Mimosaceae). J. Med. Plants Res. 2008, 2, 378–386. [Google Scholar]
  16. Banso, A. Phytochemical and antibacterial investigation of bark extracts of Acacia nilotica. J. Med. Plants Res. 2009, 3, 82–85. [Google Scholar]
  17. Mahesh, B.; Satish, S. Antimicrobial Activity of Some Important Medicinal Plant Against Plant and Human Pathogens. World J. Agric. Sci. 2008, 4, 839–843. [Google Scholar]
  18. Paula, V.B.; Delgado, T.; Campos, M.G.; Anjos, O.; Estevinho, L.M. Enzyme inhibitory potential of ligustrum lucidum aiton berries. Molecules 2019, 24, 1283. [Google Scholar] [CrossRef] [PubMed] [Green Version]
  19. Campos, M.; Markham, K.R.; Mitchell, K.A.; da Cunha, A.P. An approach to the characterization of bee pollens via their flavonoid/phenolic profiles. Phytochem. Anal. 1997, 8, 181–185. [Google Scholar] [CrossRef]
  20. Campos, M.d.G.; Markham, K.R. Structure Information from HPLC and On-Line Measured Absorption Spectra: Flavones, Flavonols and Phenolic Acids; Imprensa da Universidade de Coimbra: Coimbra, Portugal, 2007; ISBN 9789892604800. [Google Scholar]
  21. Singleton, V.L.; Orthofer, R.; Lamuela-Raventós, R.M. [14] Analysis of total phenols and other oxidation substrates and antioxidants by means of folin-ciocalteu reagent. Methods Enzymol. 1999, 299, 152–178. [Google Scholar]
  22. Woisky, R.G.; Salatino, A. Analysis of propolis: Some parameters and procedures for chemical quality control. J. Apic. Res. 1998, 37, 99–105. [Google Scholar] [CrossRef]
  23. Berker, K.I.; Güçlü, K.; Tor, İ.; Apak, R. Comparative evaluation of Fe(III) reducing power-based antioxidant capacity assays in the presence of phenanthroline, batho-phenanthroline, tripyridyltriazine (FRAP), and ferricyanide reagents. Talanta 2007, 72, 1157–1165. [Google Scholar] [CrossRef] [PubMed]
  24. Alencar, S.M.; Oldoni, T.L.C.; Castro, M.L.; Cabral, I.S.R.; Costa-Neto, C.M.; Cury, J.A.; Rosalen, P.L.; Ikegaki, M. Chemical composition and biological activity of a new type of Brazilian propolis: Red propolis. J. Ethnopharmacol. 2007, 113, 278–283. [Google Scholar] [CrossRef] [PubMed]
  25. Sukumaran, S.; Chee, C.; Viswanathan, G.; Buckle, M.; Othman, R.; Abd Rahman, N.; Chung, L. Synthesis, Biological Evaluation and Molecular Modelling of 2′-Hydroxychalcones as Acetylcholinesterase Inhibitors. Molecules 2016, 21, 955. [Google Scholar] [CrossRef] [Green Version]
  26. Habib, H.M.; Kheadr, E.; Ibrahim, W.H. Inhibitory effects of honey from arid land on some enzymes and protein damage. Food Chem. 2021, 364, 130415. [Google Scholar] [CrossRef]
  27. Tadera, K.; Minami, Y.; Takamatsu, K.; Matsuoka, T. Inhibition of alpha-glucosidase and alpha-amylase by flavonoids. J. Nutr. Sci. Vitaminol. 2006, 52, 149–153. [Google Scholar] [CrossRef] [Green Version]
  28. Anjos, O.; Caldeira, I.; Pedro, S.I.; Canas, S. FT-Raman methodology applied to identify different ageing stages of wine spirits. LWT 2020, 134, 110179. [Google Scholar] [CrossRef]
  29. Thapa, P.; Upadhyay, S.P.; Suo, W.Z.; Singh, V.; Gurung, P.; Lee, E.S.; Sharma, R.; Sharma, M. Chalcone and its analogs: Therapeutic and diagnostic applications in Alzheimer’s disease. Bioorg. Chem. 2021, 108, 104681. [Google Scholar] [CrossRef]
  30. Isla, M.I.; Salas, A.; Danert, F.C.; Zampini, I.C.; Ordoñez, R.M. Analytical methodology optimization to estimate the content of non-flavonoid phenolic compounds in Argentine propolis extracts. Pharm. Biol. 2014, 52, 835–840. [Google Scholar] [CrossRef] [Green Version]
  31. De Andrade, C.A.; Costa, C.K.; Bora, K.; Miguel, M.D.; Miguel, O.G.; Kerber, V.A. Determinação do conteúdo fenólico e avaliação da atividade antioxidante de Acacia podalyriifolia A. Cunn. ex G. Don, Leguminosae-mimosoideae. Rev. Bras. Farmacogn. 2007, 17, 231–235. [Google Scholar] [CrossRef]
  32. Wu, J.-H.; Tung, Y.-T.; Wang, S.-Y.; Shyur, L.-F.; Kuo, Y.-H.; Chang, S.-T. Phenolic Antioxidants from the Heartwood of Acacia confusa. J. Agric. Food Chem. 2005, 53, 5917–5921. [Google Scholar] [CrossRef] [PubMed]
  33. Faujdar, S.; Sharma, S.; Sati, B.; Pathak, A.K.; Paliwal, S.K. Comparative analysis of analgesic and anti-inflammatory activity of bark and leaves of Acacia ferruginea DC. Beni-Suef Univ. J. Basic Appl. Sci. 2016, 5, 70–78. [Google Scholar] [CrossRef] [Green Version]
  34. Gabr, S.; Nikles, S.; Pferschy Wenzig, E.M.; Ardjomand-Woelkart, K.; Hathout, R.M.; El-Ahmady, S.; Motaal, A.A.; Singab, A.; Bauer, R. Characterization and optimization of phenolics extracts from Acacia species in relevance to their anti-inflammatory activity. Biochem. Syst. Ecol. 2018, 78, 21–30. [Google Scholar] [CrossRef]
  35. Mazur, W.M.; Duke, J.A.; Wähälä, K.; Rasku, S.; Adlercreutz, H. Isoflavonoids and Lignans in Legumes: Nutritional and Health Aspects in Humans 11The method development and synthesis of the standards and deuterium-labelled compounds was supported by National Institutes of Health Grants No. 1 R01 CA56289-01 and No. 2 R0. J. Nutr. Biochem. 1998, 9, 193–200. [Google Scholar] [CrossRef] [Green Version]
  36. Hertog, M.G.; Feskens, E.J.; Kromhout, D.; Hertog, M.G.; Hollman, P.C.; Hertog, M.G.; Katan, M. Dietary antioxidant flavonoids and risk of coronary heart disease: The Zutphen Elderly Study. Lancet 1993, 342, 1007–1011. [Google Scholar] [CrossRef]
  37. Merino, E.N.; Sendin, M.A.C.; Osorio, J.A.V. Enfermedad de Alzheimer. Med. Programa Form. Médica Contin. Acreditado 2015, 11, 4306–4315. [Google Scholar] [CrossRef]
  38. Ogawa, S.; Yazaki, Y. Tannins from Acacia mearnsii De Wild. Bark: Tannin Determination and Biological Activities. Molecules 2018, 23, 837. [Google Scholar] [CrossRef] [Green Version]
  39. Pierpaoli, W. Neurodegenerative Diseases: A Common Etiology and a Common Therapy. Ann. N. Y. Acad. Sci. 2005, 1057, 319–326. [Google Scholar] [CrossRef]
  40. Jin, Z.; Chu, Q.; Xu, W.; Cai, H.; Ji, W.; Wang, G.; Lin, B.; Zhang, X. All-Fiber Raman Biosensor by Combining Reflection and Transmission Mode. IEEE Photonics Technol. Lett. 2018, 30, 387–390. [Google Scholar] [CrossRef]
  41. Paradkar, M.M.; Sakhamuri, S.; Irudayaraj, J. Comparison of FTIR, FT-Raman, and NIR Spectroscopy in a Maple Syrup Adulteration Study. J. Food Sci. 2002, 67, 2009–2015. [Google Scholar] [CrossRef]
  42. Nickless, E.M.; Holroyd, S.E.; Stephens, J.M.; Gordon, K.C.; Wargent, J.J. Analytical FT-Raman spectroscopy to chemotype Leptospermum scoparium and generate predictive models for screening for dihydroxyacetone levels in floral nectar. J. Raman Spectrosc. 2014, 45, 890–894. [Google Scholar] [CrossRef]
  43. Larkin, P. Infrared and Raman Spectroscopy: Principles and Spectral Interpretation; Elsevier Inc.: Amsterdam, The Netherlands, 2011; Volume 9, ISBN 9780123869845. [Google Scholar]
Figure 1. Different stages of A. dealbata flower used in this study (EF—early flower, MF—mid flower and LF—late flower/ripening). Photo from Ofélia Anjos.
Applsci 12 01022 g001
Figure 2. Example of an HPLC/DAD profile of the early maturation stage flowers from region A obtained with the most active Acacia dealbata L. hydroethanolic extract (50% (v/v)). Compounds 14 were flavonols and 56 were chalcones.
Applsci 12 01022 g002
Figure 3. Ultraviolet absorption spectra obtained using HPLC/DAD analysis of the flavonoid content. Compounds (a) and (b) were chalcone derivatives.
Applsci 12 01022 g003
Figure 4. Basic structures of flavone (a) and chalcone (b).
Applsci 12 01022 g004
Figure 5. Total phenol and flavonoid contents ((a) TPC and (b) TFC) of A. dealbata flower extracts with different maturation stages from two central regions of Portugal. A—region A, B—region B; EF—early flower, MF—mid flower, LF—late flower. Different lowercase letters (a, b, c) denote significant differences between values (Tukey’s test; p < 0.05).
Applsci 12 01022 g005
Figure 6. Antioxidant activity ((a) FRAP EC50 and (b) DPPH EC50) of A. dealbata flowers extracts with different maturation stages with a mixture of 50/50% (v/v) ethanol/water from two central regions of Portugal. A—region A, B—region B; EF—early flower, MF—mid flower, LF—late flower. Different lowercase letters (a, b, c) denote significant differences between values (Tukey’s test; p < 0.05).
Applsci 12 01022 g006
Figure 7. Enzyme inhibitory activity of A. dealbata flowers’ hydroethanolic extracts with different maturation stages for (a) acetylcholinesterase, (b) lipase and (c) α-glucosidase activities. A—region A, B—region B; EF—early flower, MF—mid flower, LF—late flower. Different lowercase letters (a, b, c) denote significant differences between values (Tukey’s test; p < 0.05).
Applsci 12 01022 g007
Figure 8. Principal component analysis of ethanol:water (50:50) extracts from the A. dealbata flowers in different maturation stages from two central regions of Portugal. A—region A, B—region B; EF—early flower, MF—mid flower, LF—late flower; TPC—total phenol content, TFC—total flavonoid content; GLUC—α-glucosidase, ACET—acetylcholinesterase; EcoliA—E. coli ATCC 29998 TM, Saur—S. aureus ATCC 43300TM, Calbi—C. albicans ATCC 10231 TM, EcoliESA—E. coli ESA37, SaurESA—S. aureus ATCC ESA111, AB_r—amphotericin-B-resistant Candida albicans ESA 100.
Applsci 12 01022 g008
Figure 9. Raman spectrum, baseline corrected spectrum for Acacia flowers samples.
Applsci 12 01022 g009
Figure 10. Score plot of the first two principal components after the PCA performed on the Raman spectra recorded from Acacia flowers samples using the first derivative Savitzky–Golay spectra transform with 15 smoothing points.
Applsci 12 01022 g010
Table 1. Percentage of variance obtained in a two-way ANOVA of the total phenol and flavonoid contents of the flowers extracts.
Site
(S)
Maturation
Status (M)
S × MResidual
TPC (µg gallic acid/mL)24.4 ***55.5 ***11.7 **8.4
TFC EC50 (µg/mL)37.4 ***27.3 ***n.s.35.3
MS—maturation status, EF—early flower, MF—mid flower, LF—late flower; n.s. for p > 0.05, * 0.01 < p < 0.05, ** 0.001 < p < 0.01, *** p < 0.001.
Table 2. Percentage of variance obtained in a two-way ANOVA (factor 1: site (S) and factor 2: maturation status (M)) of the antioxidant activity parameters for the flower’s extracts.
Site
(S)
Maturation
Status (M)
S × MResidual
FRAP EC50 (mg/mL)n.s.54.3 ***n.s.45.7
DPPH EC50 (mg/mL)10.0 **83.3 ***n.s.6.7
MS—maturation status, EF—early flower, MF—mid flower, LF—late flower; n.s. for p > 0.05, * 0.01 < p < 0.05, ** 0.001 < p < 0.01, *** p < 0.001.
Table 3. Variance percentages obtained in a two-way ANOVA of enzyme inhibitory activity of A. dealbata flowers.
Site
(S)
Maturation
Status (M)
S × MResidual
ACET (µg/mL)51.9 ***27.7 ***7.6 **12.9
Lipase (µg/mL)25.7 ***52.6 ***n.s.21.7
GLUC (µg/mL)n.s.68.5 *n.s.31.5
GLUC—α-glucosidase, ACET—acetylcholinesterase; MS—maturation status, EF—early flower, MF—mid flower, LF—late flower; n.s. for p > 0.05, * 0.01 < p < 0.05, ** 0.001 < p < 0.01, *** p < 0.001.
Table 4. Antimicrobial bioactivity activity of the A. dealbata flower extracts with different maturation stages.
MSEcoliA
(µg/mL)
Saur
(µg/mL)
Calbi
(µg/mL)
EcoliESA
(µg/mL)
SaurESA
(µg/mL)
AB_r
(µg/mL)
EthanolAEF4.57 ± 0.29 a0.79 ± 0.11 a8.37 ± 0.50 a9.30 ± 0.34 a2.63 ± 0.24 a15.00 ± 1.08 a
MF4.96 ± 0.35 c0.89 ± 0.09 a8.90 ± 0.55 a10.22 ± 0.61 a,b2.85 ± 0.1 a,b19.16 ± 1.57 b
LF5.67 ± 0.21 b1.21 ± 0.12 b10.34 ± 0.50 b11.19 ± 0.79 a,b3.02 ± 0.22 a,b19.89 ± 3.48 b
BEF6.00 ± 0.26 b0.87 ± 0.08 a10.53 ± 0.58 b9.72 ± 1.15 a,b3.21 ± 0.24 b 19.43 ± 1.43 b
MF7.28 ± 0.43 d1.32 ± 0.16 b11.48 ± 0.74 b11.47 ± 1.51 b3.83 ± 0.25 c22.59 ± 1.68 b,c
LF8.46 ± 0.29 e1.57 ± 0.21 c13.40 ± 0.71 c13.77 ± 1.00 c4.05 ± 0.24 c25.61 ± 0.87 c
Gentamicin
(µg/mL)
Gentamicin
(µg/mL)
Anfotericin B (µg/mL)Gentamicin
(µg/mL)
Gentamicin
(µg/mL)
Anfotericin B (µg/mL)
6.16 ± 0.081.11 ± 0.0410.50 ± 0.00510.95 ± 0.213.27 ± 0.0820.20 ± 0.22
A—region A, B—region B; EF—early flower, MF—mid flower, LF—late flower; EcoliA—E. coli ATCC 29998 TM, Saur—S. aureus ATCC 43300TM, Calbi—C. albicans ATCC 10231 TM, EcoliESA—E. coli ESA37, SaurESA—S. aureus ATCC ESA111, AB_r—amphotericin-B-resistant Candida albicans ESA 100. Different lowercase letters (a, b, c, d, e) in the same column denote significant differences between values (Tukey’s test; p < 0.05).
Table 5. Variance percentages obtained in a two-way ANOVA of the antimicrobial bioactivity of A. dealbata flowers.
Site
(S)
Maturation Status (M)S × MResidual
EcoliA (µg/mL)68.3 ***22.6 ***6.3 ***2.8
Saur (µg/mL)27.9 ***50.5 ***9.2 **12.4
Calbi (µg/mL)64.2 ***28.8 ***n.s.7.0
EcoliESA (µg/mL)21.3 ***47.8 ***9.6 *21.2
SaurESA (µg/mL)69.1 ***17.7 ***4.1 *9.1
AB_r (µg/mL)47.3 ***36.0 ***n.s.16.8
EF—early flower, MF—mid flower, LF—late flower; EcoliA—E. coli ATCC 29998 TM, Saur—S. aureus ATCC 43300TM, Calbi—C. albicans ATCC 10231 TM, EcoliESA—E. coli ESA37, SaurESA—S. aureus ATCC ESA111, AB_r—amphotericin-B-resistant Candida albicans ESA 100; n.s. for p > 0.05, * 0.01 < p < 0.05, ** 0.001 < p < 0.01, *** p < 0.001.
Publisher’s Note: MDPI stays neutral with regard to jurisdictional claims in published maps and institutional affiliations.

