
A CNN-RNN Combined Structure for Real-World Violence Detection in Surveillance Cameras


Abstract
1. Introduction
- A combination of ResNet and ConvLSTM is used for anomaly detection from surveillance cameras.
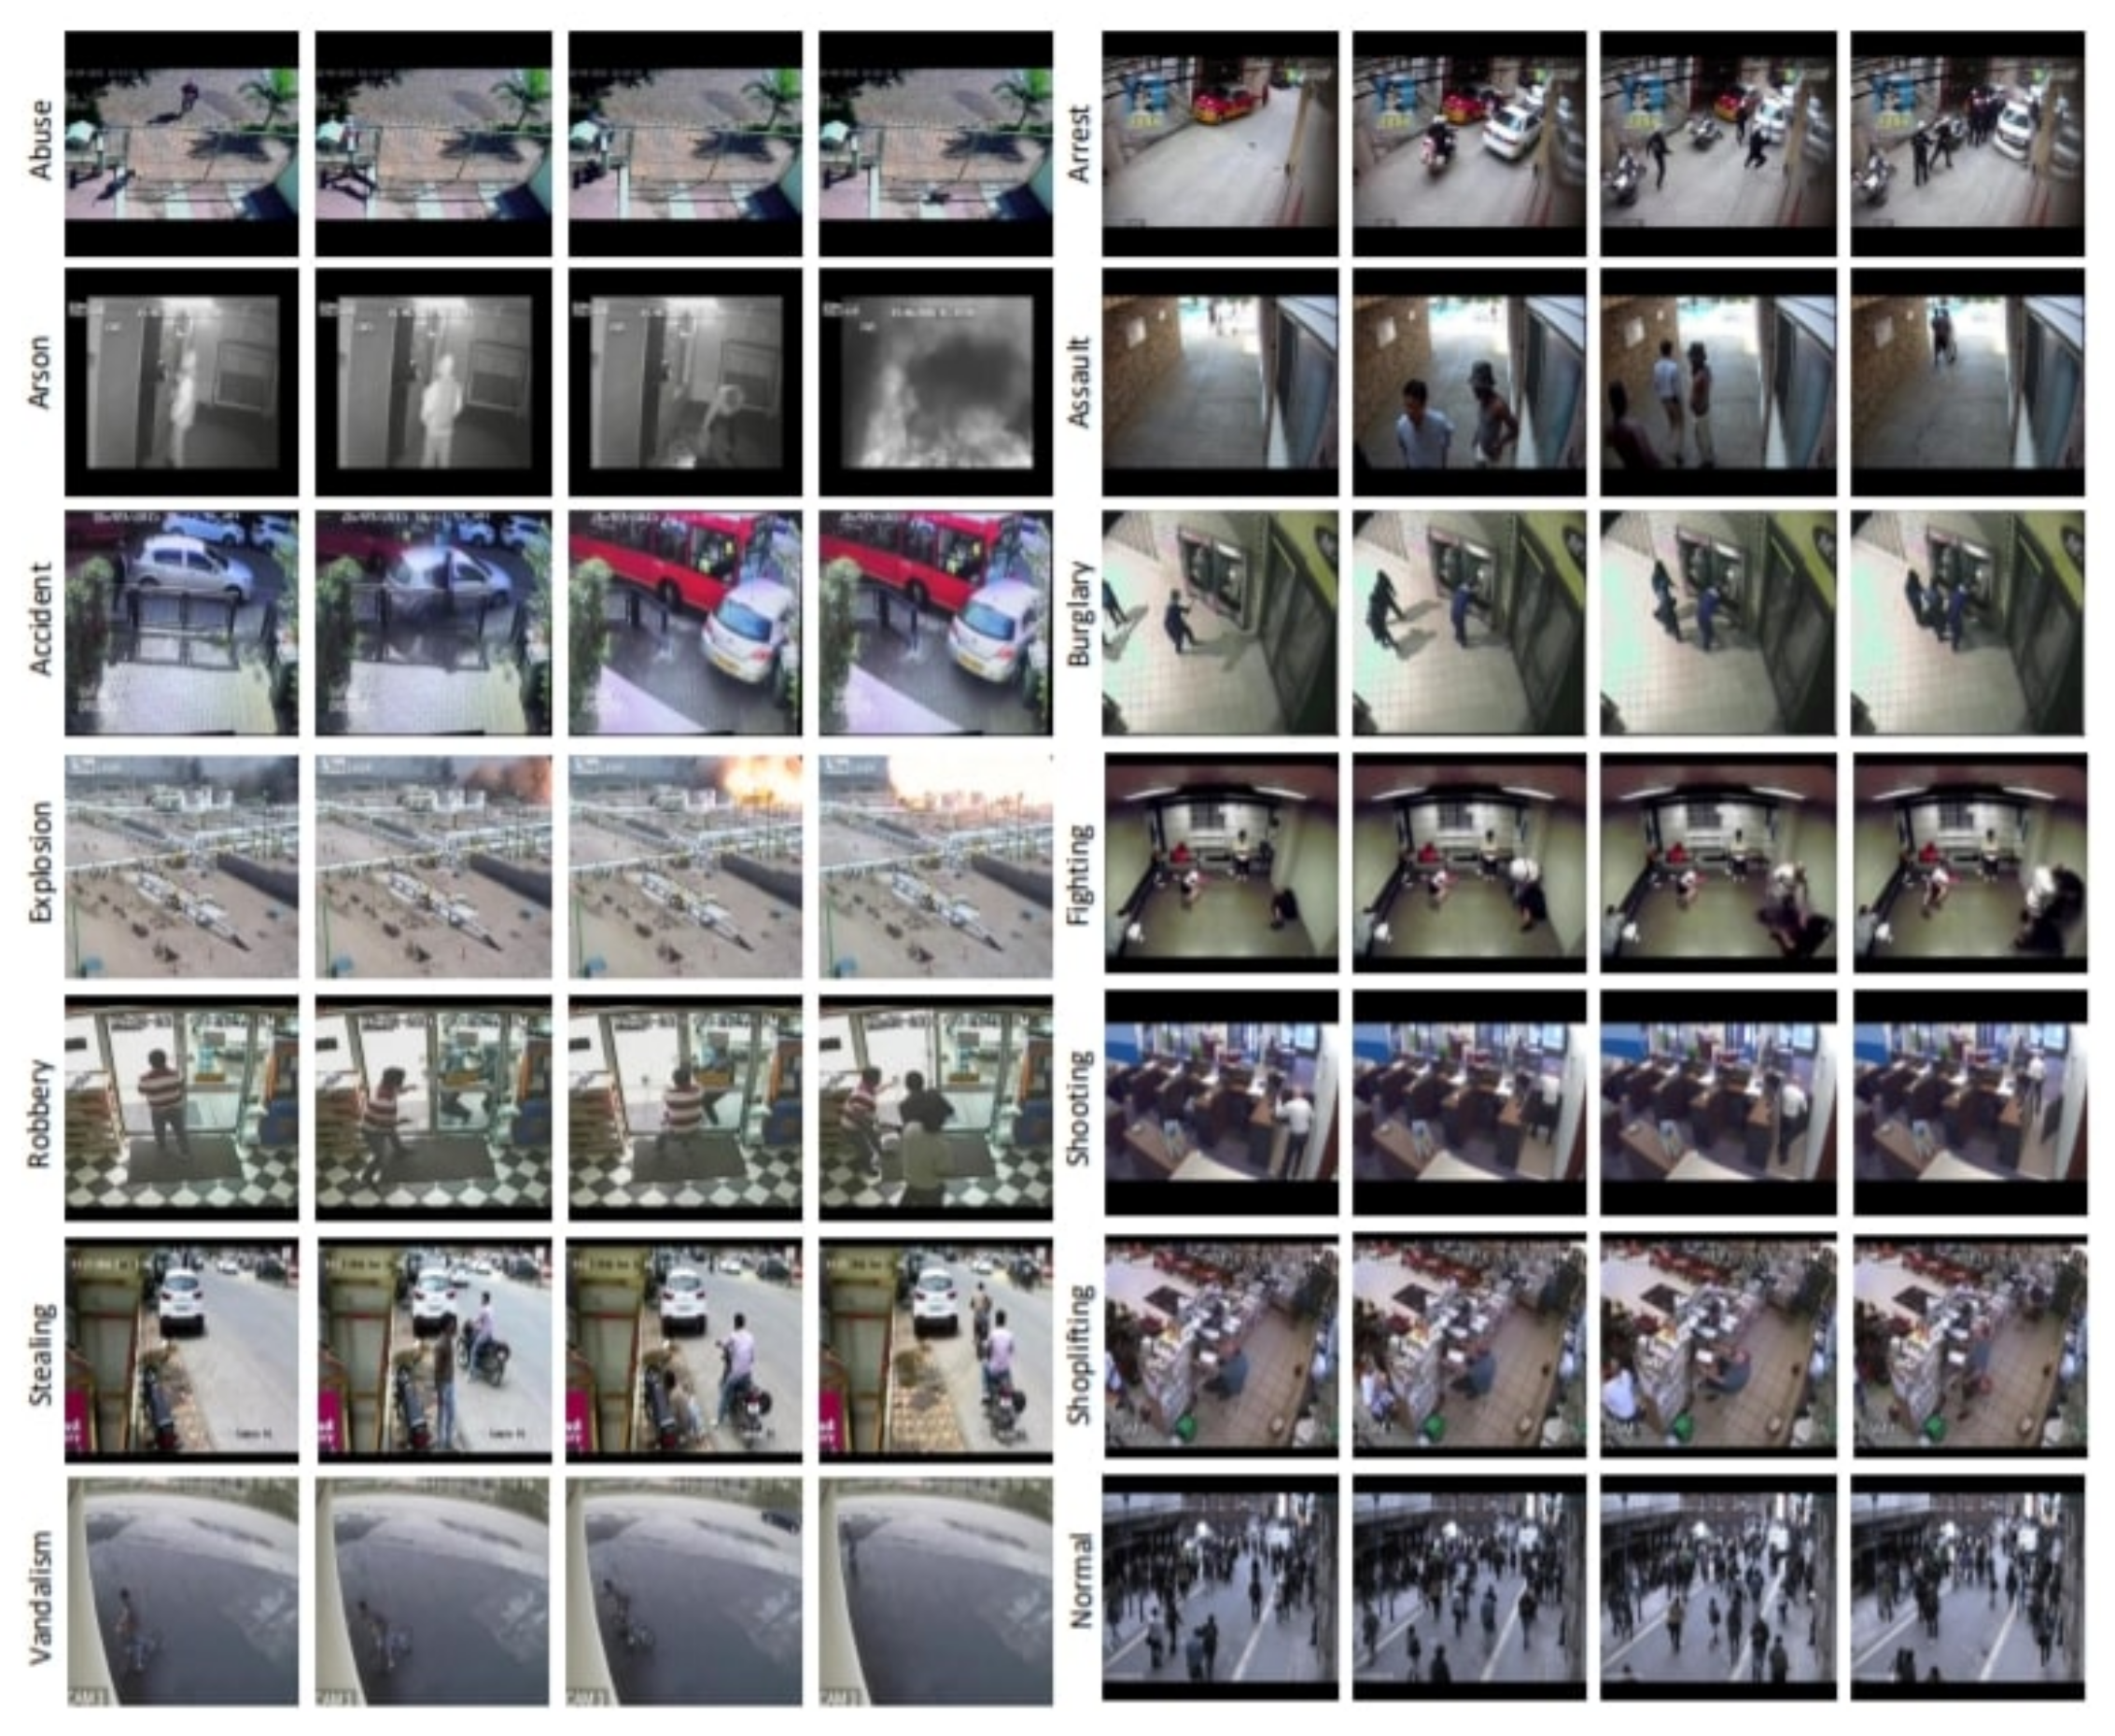
- We used the UCF-Crime dataset, which includes natural scenes recorded by surveillance cameras in 13 categories of abnormal events.
- To better understand each anomaly category, we defined two modified datasets from UCF-Crime by splitting the normal scenes from the abnormal ones.
2. Related Works
2.1. Convolutional Neural Networks
2.2. Recurrent Neural Networks
2.3. CNN + RNN
3. Proposed Method
3.1. Preprocessing
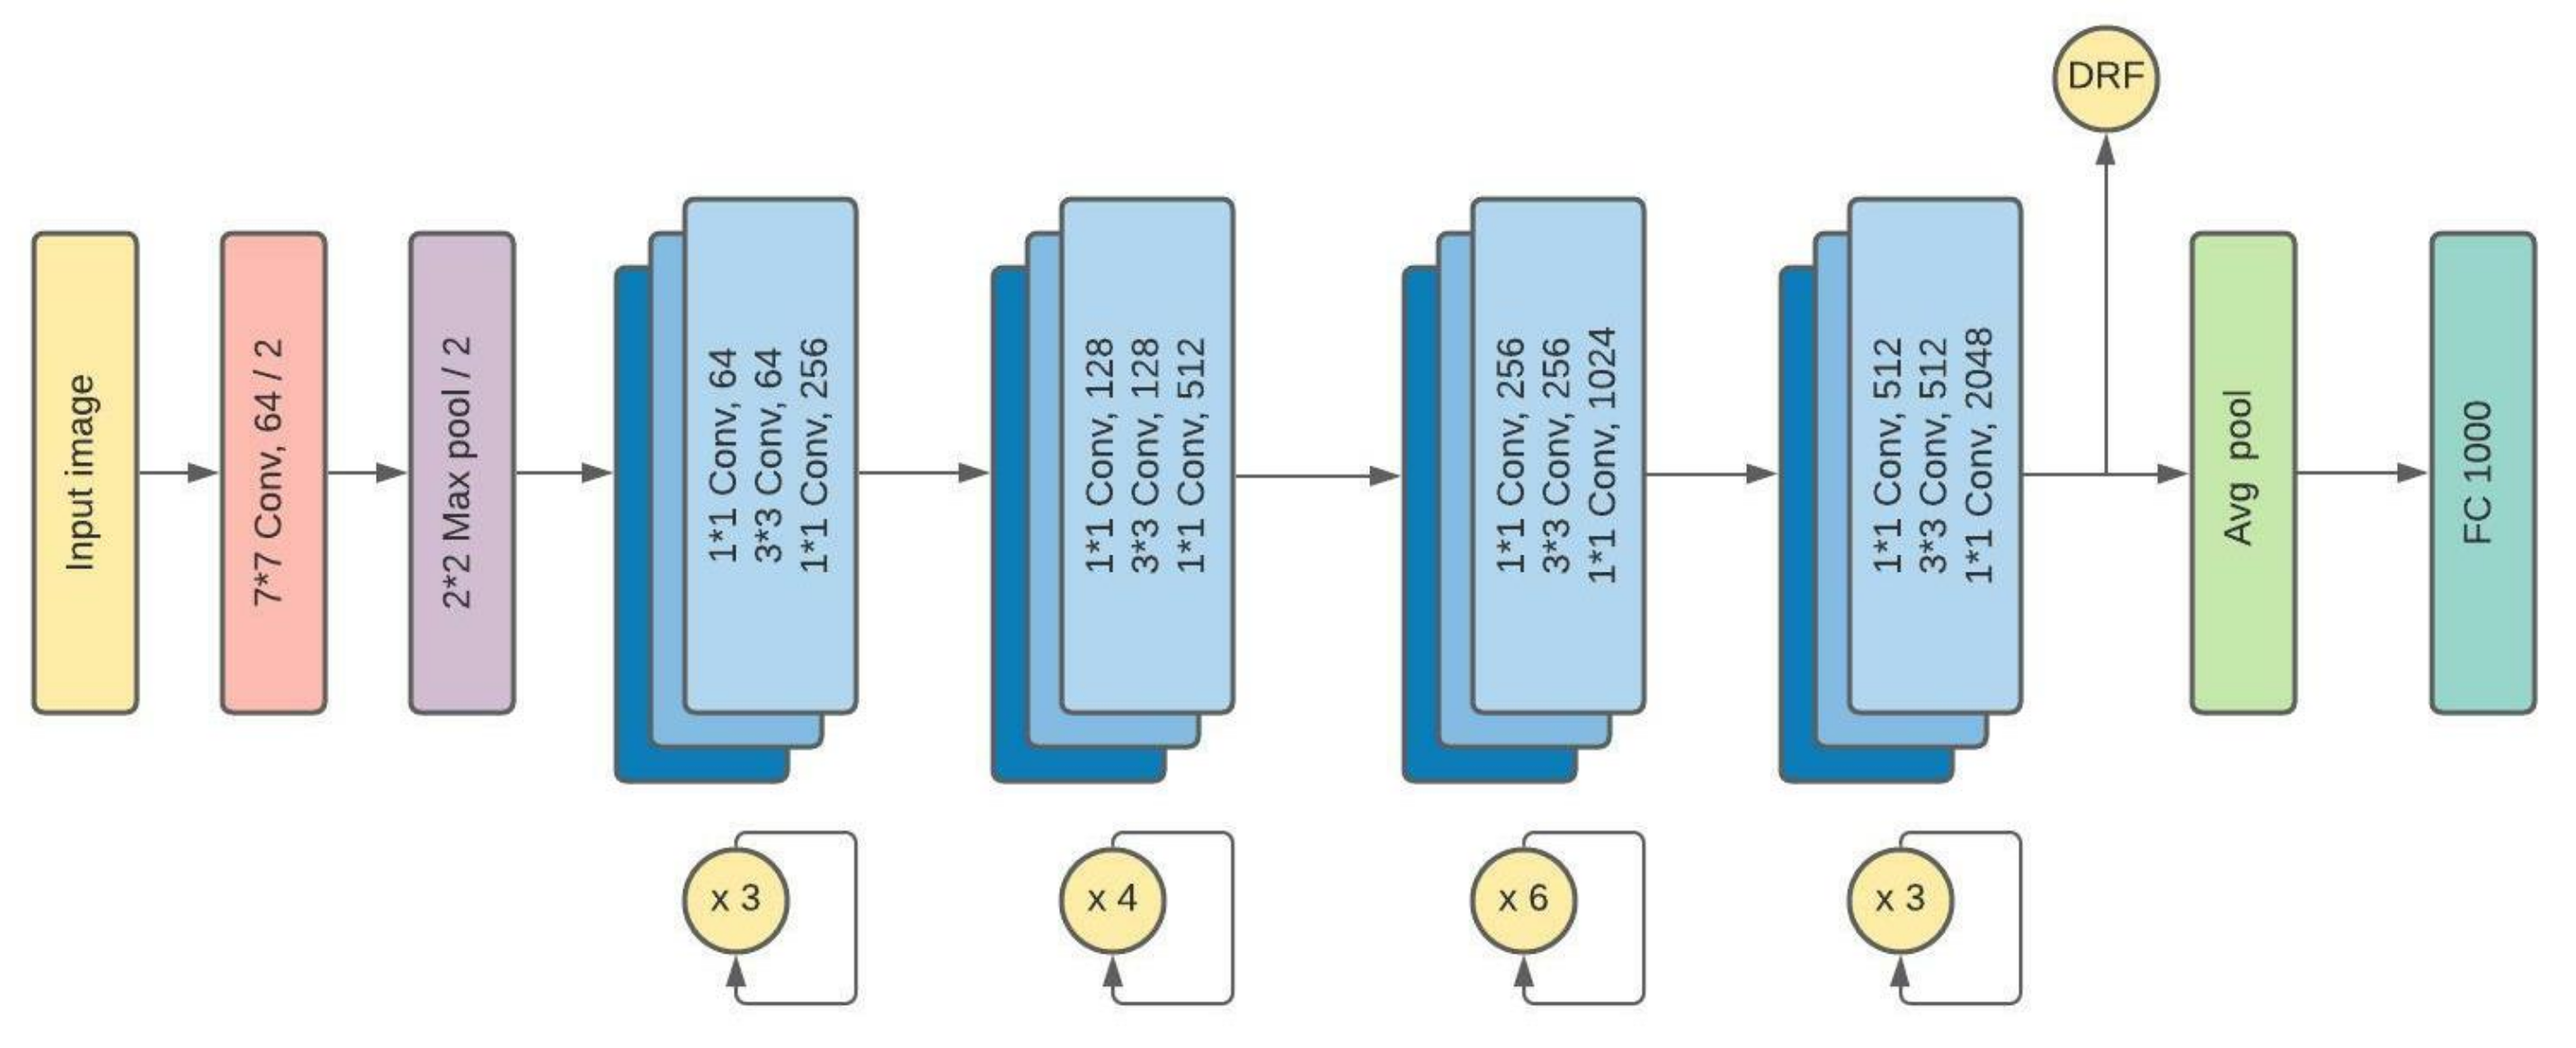
3.2. ResNet50
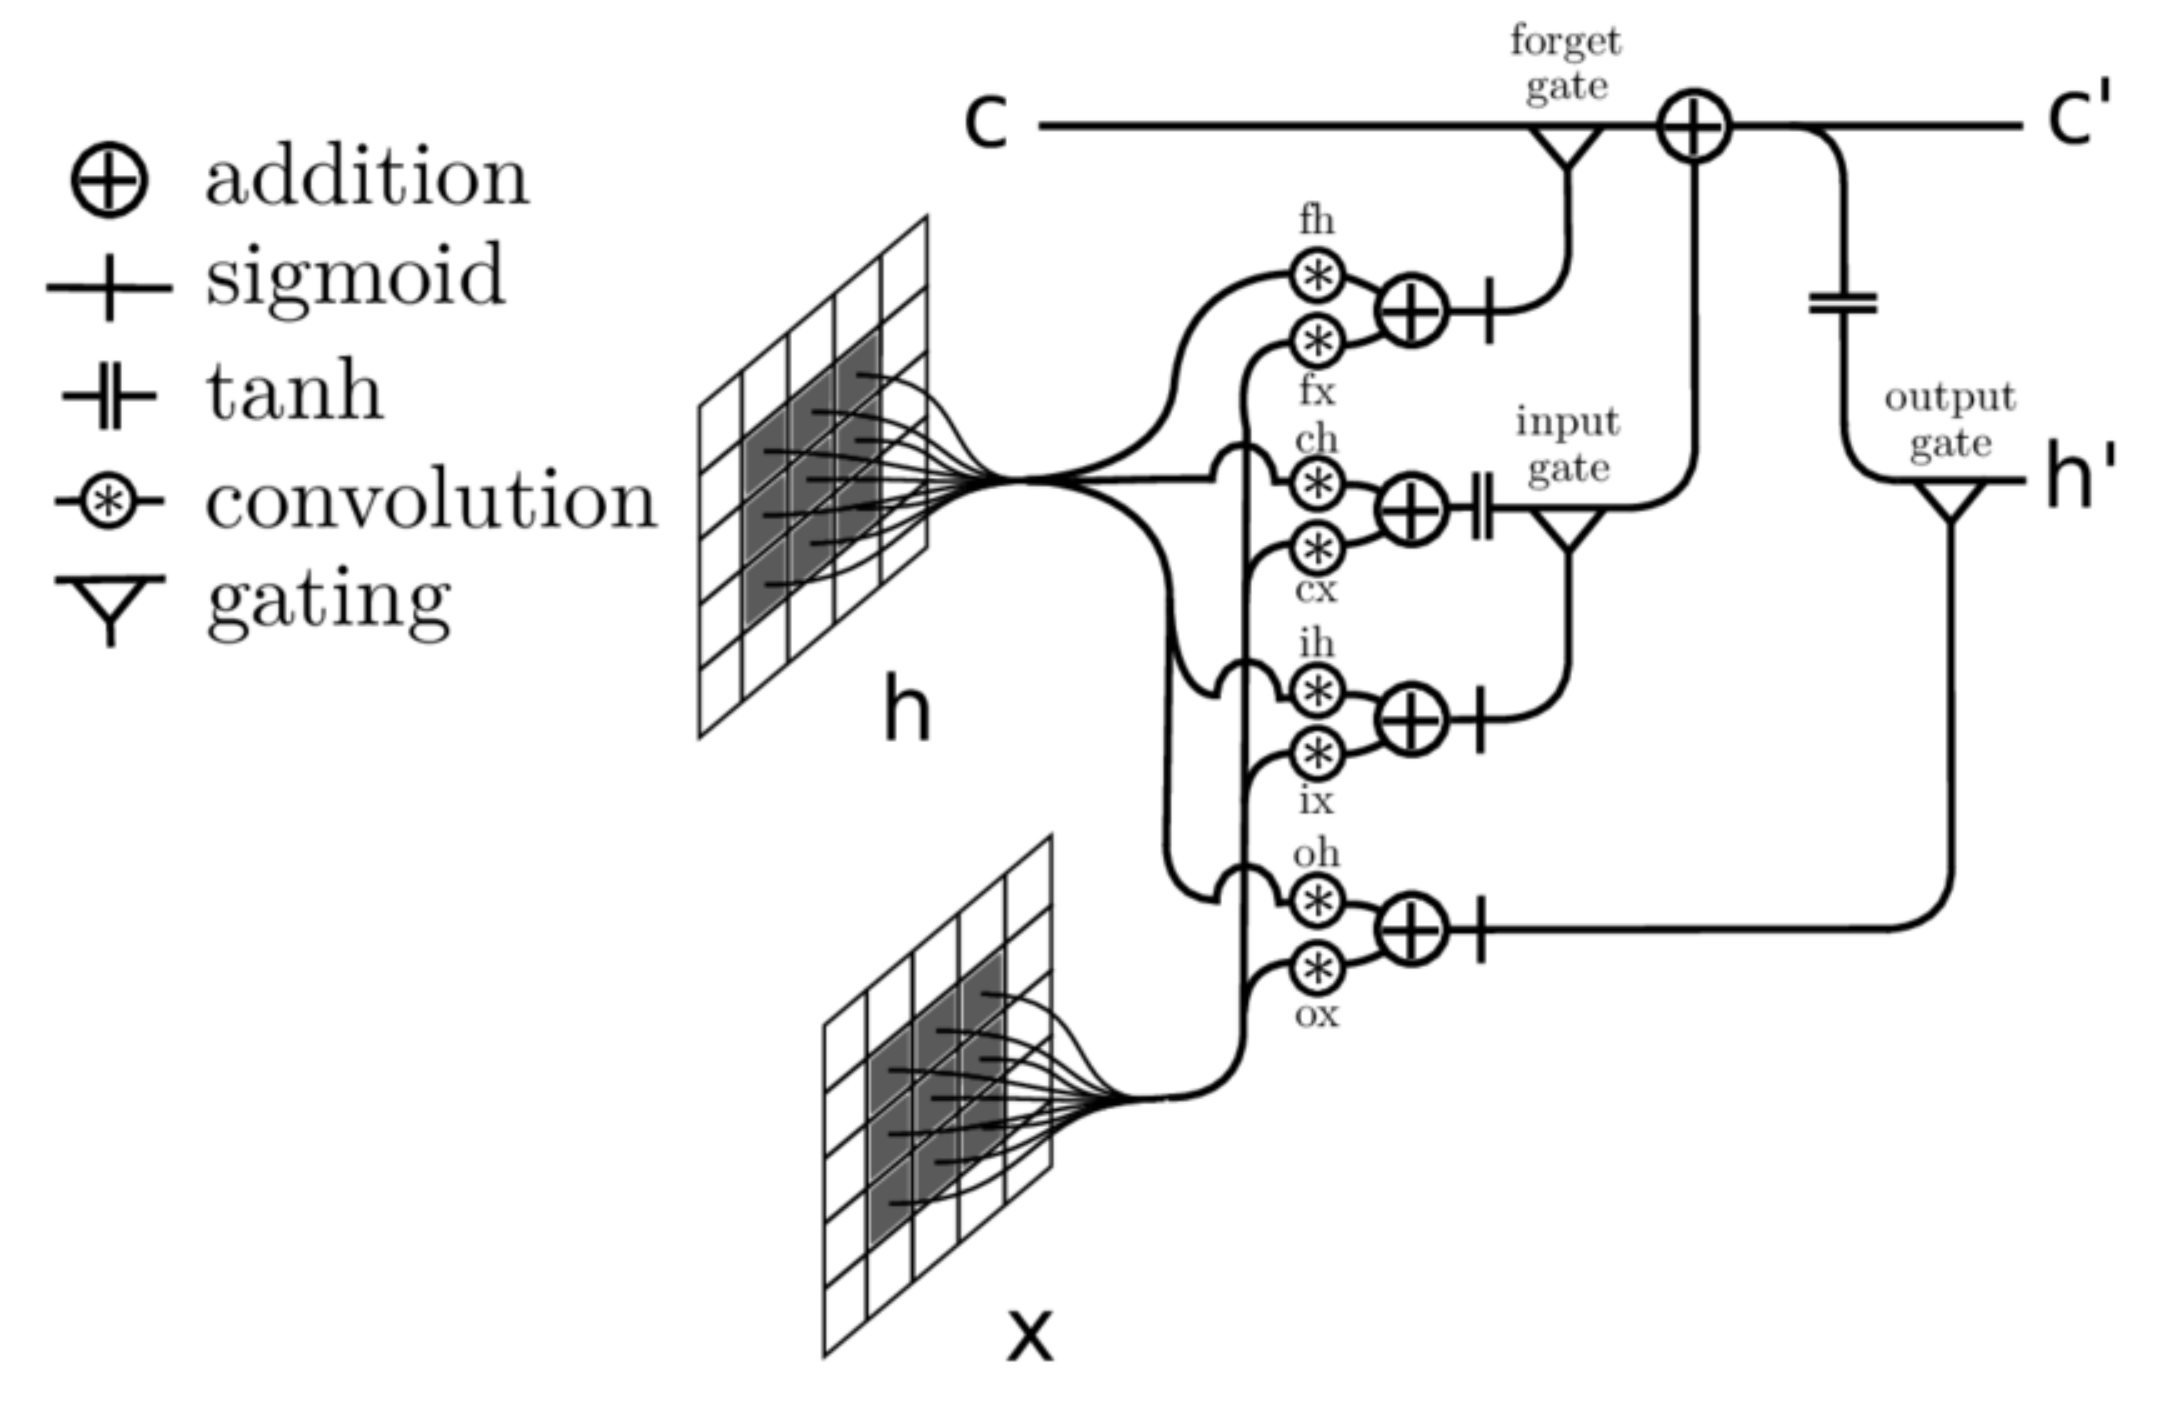
3.3. ConvLSTM
3.4. Classification
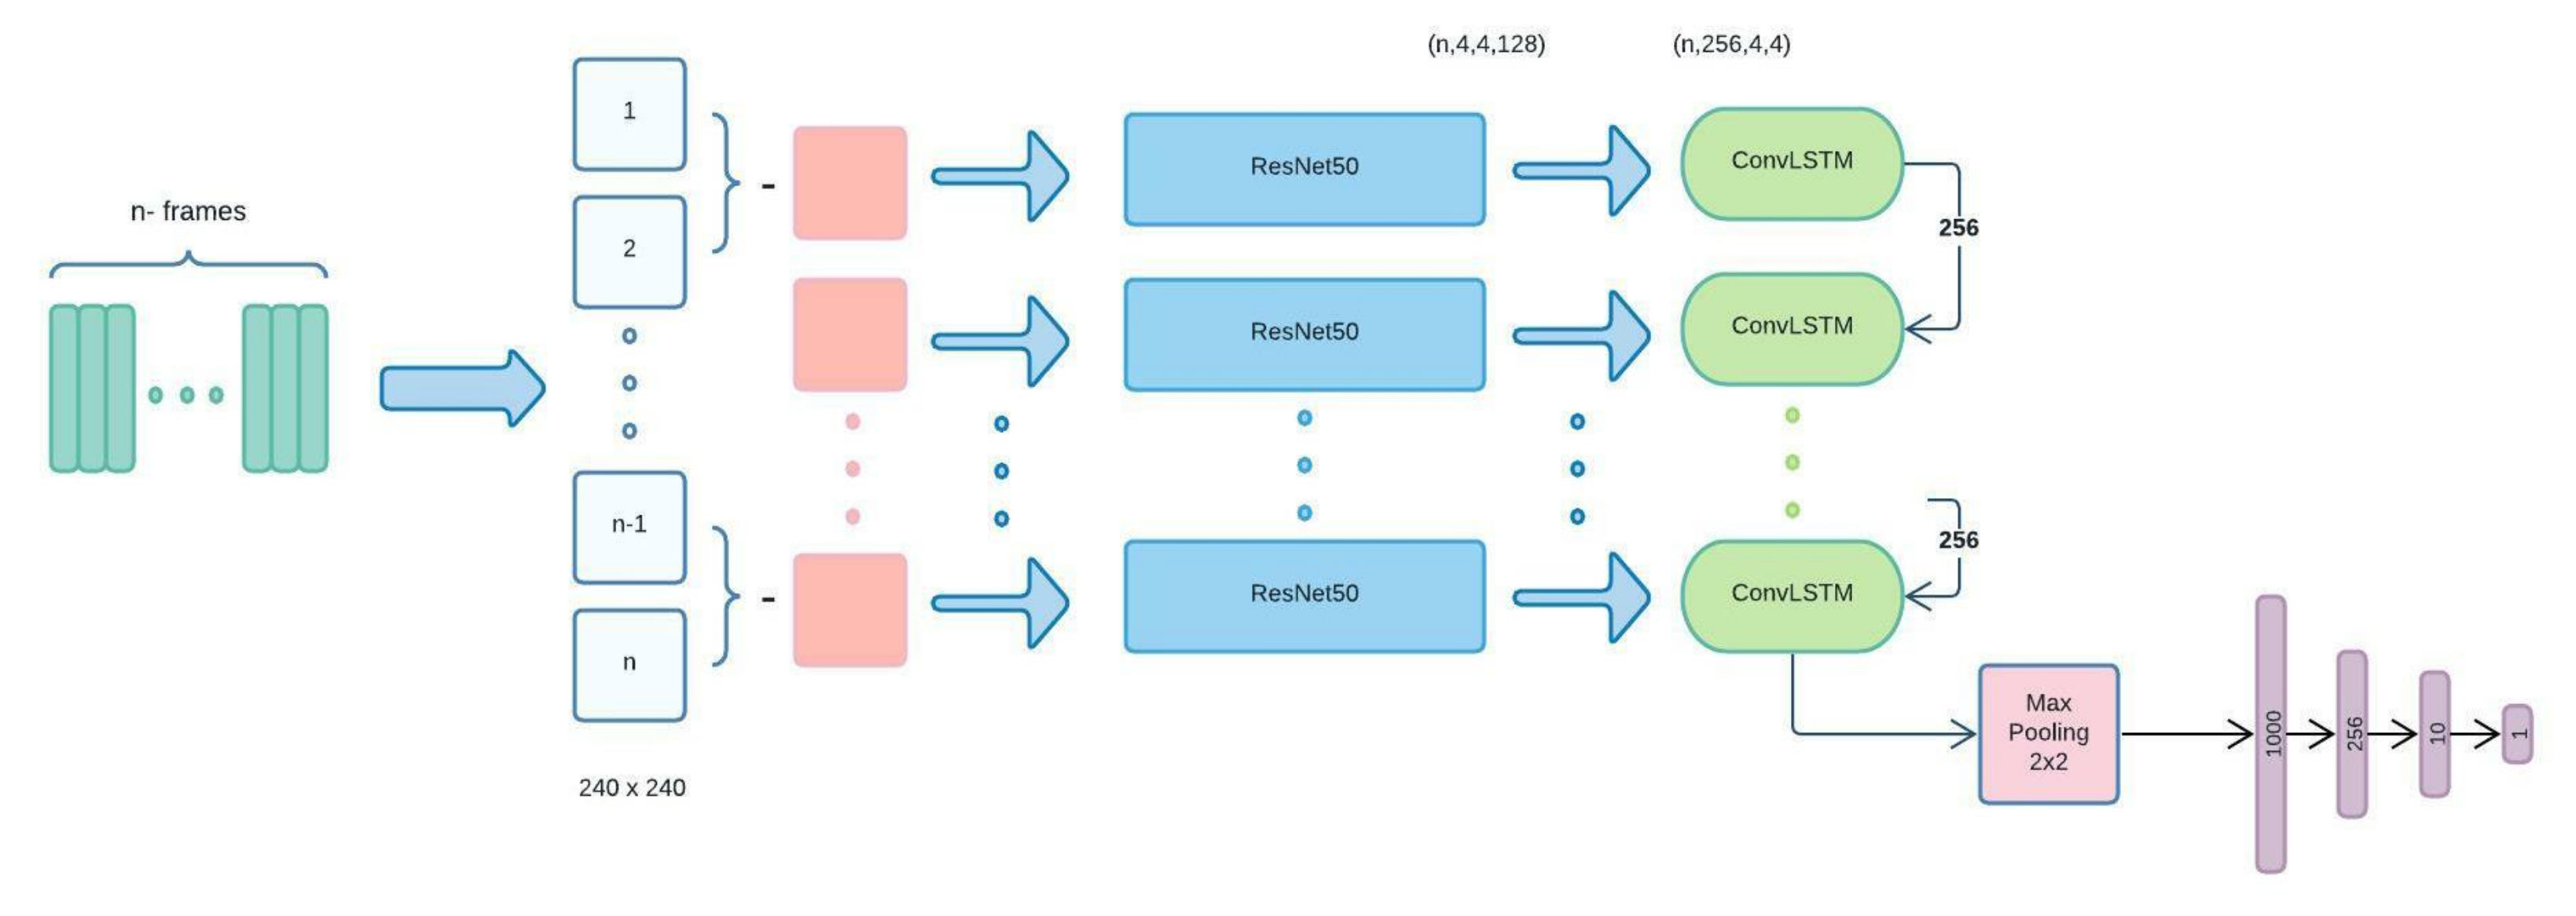
3.5. ResNet+ConvLSTM
- At first, each input video is divided into n frames. Then, the difference between each frame and the next frame goes to preprocessing phase as an initial part of the ResNet structure, including data augmentation, de-noising, and normalizing.
- Next, the difference of each two frames goes to our ResNet50 structure. It passes through 34-layers of Batch-Normalization, Convolutional, pooling and fully-connected layers to provide a suitable feature extraction of a vector size of 1000.
- Subsequently, the output for each image will be the input for the related ConvLSTM. Each ConvLSTM layer will be provided with two inputs: one from the previous ConvLSTM (256 feature maps) and the second from the data processed by ResNet50. As a result, this structure is significantly helpful for spatial-sequential data, particularly videos. The ConvLSTM that we used in our model consists of 256 filters with the size of and stride 1.
- Finally, the output of the last ConvLSTM layer, which includes all information from previous stages with size , goes to a MaxPooling layer followed by some fully connected layers to provide the desired classification.
4. Experimental Results
4.1. Dataset
4.2. Experimental Settings
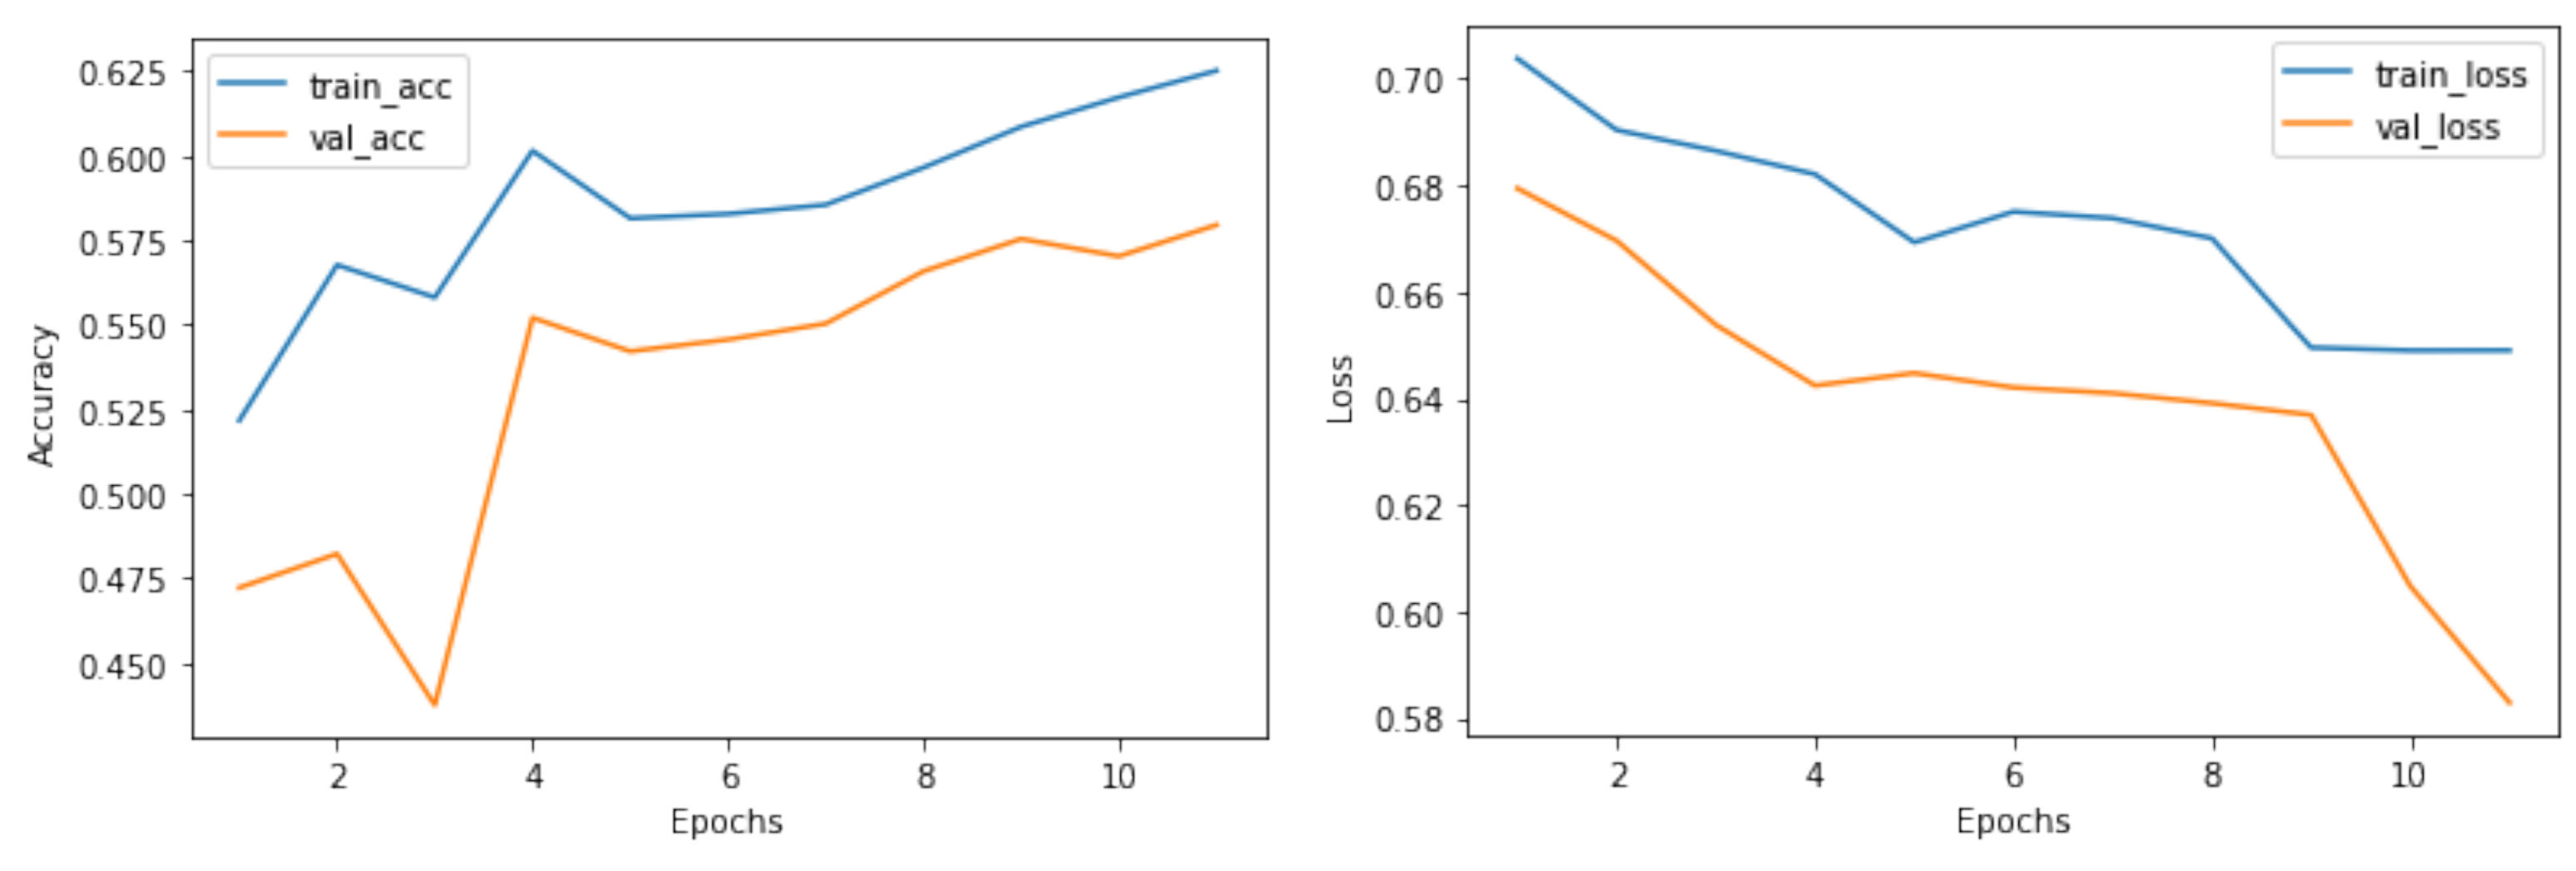
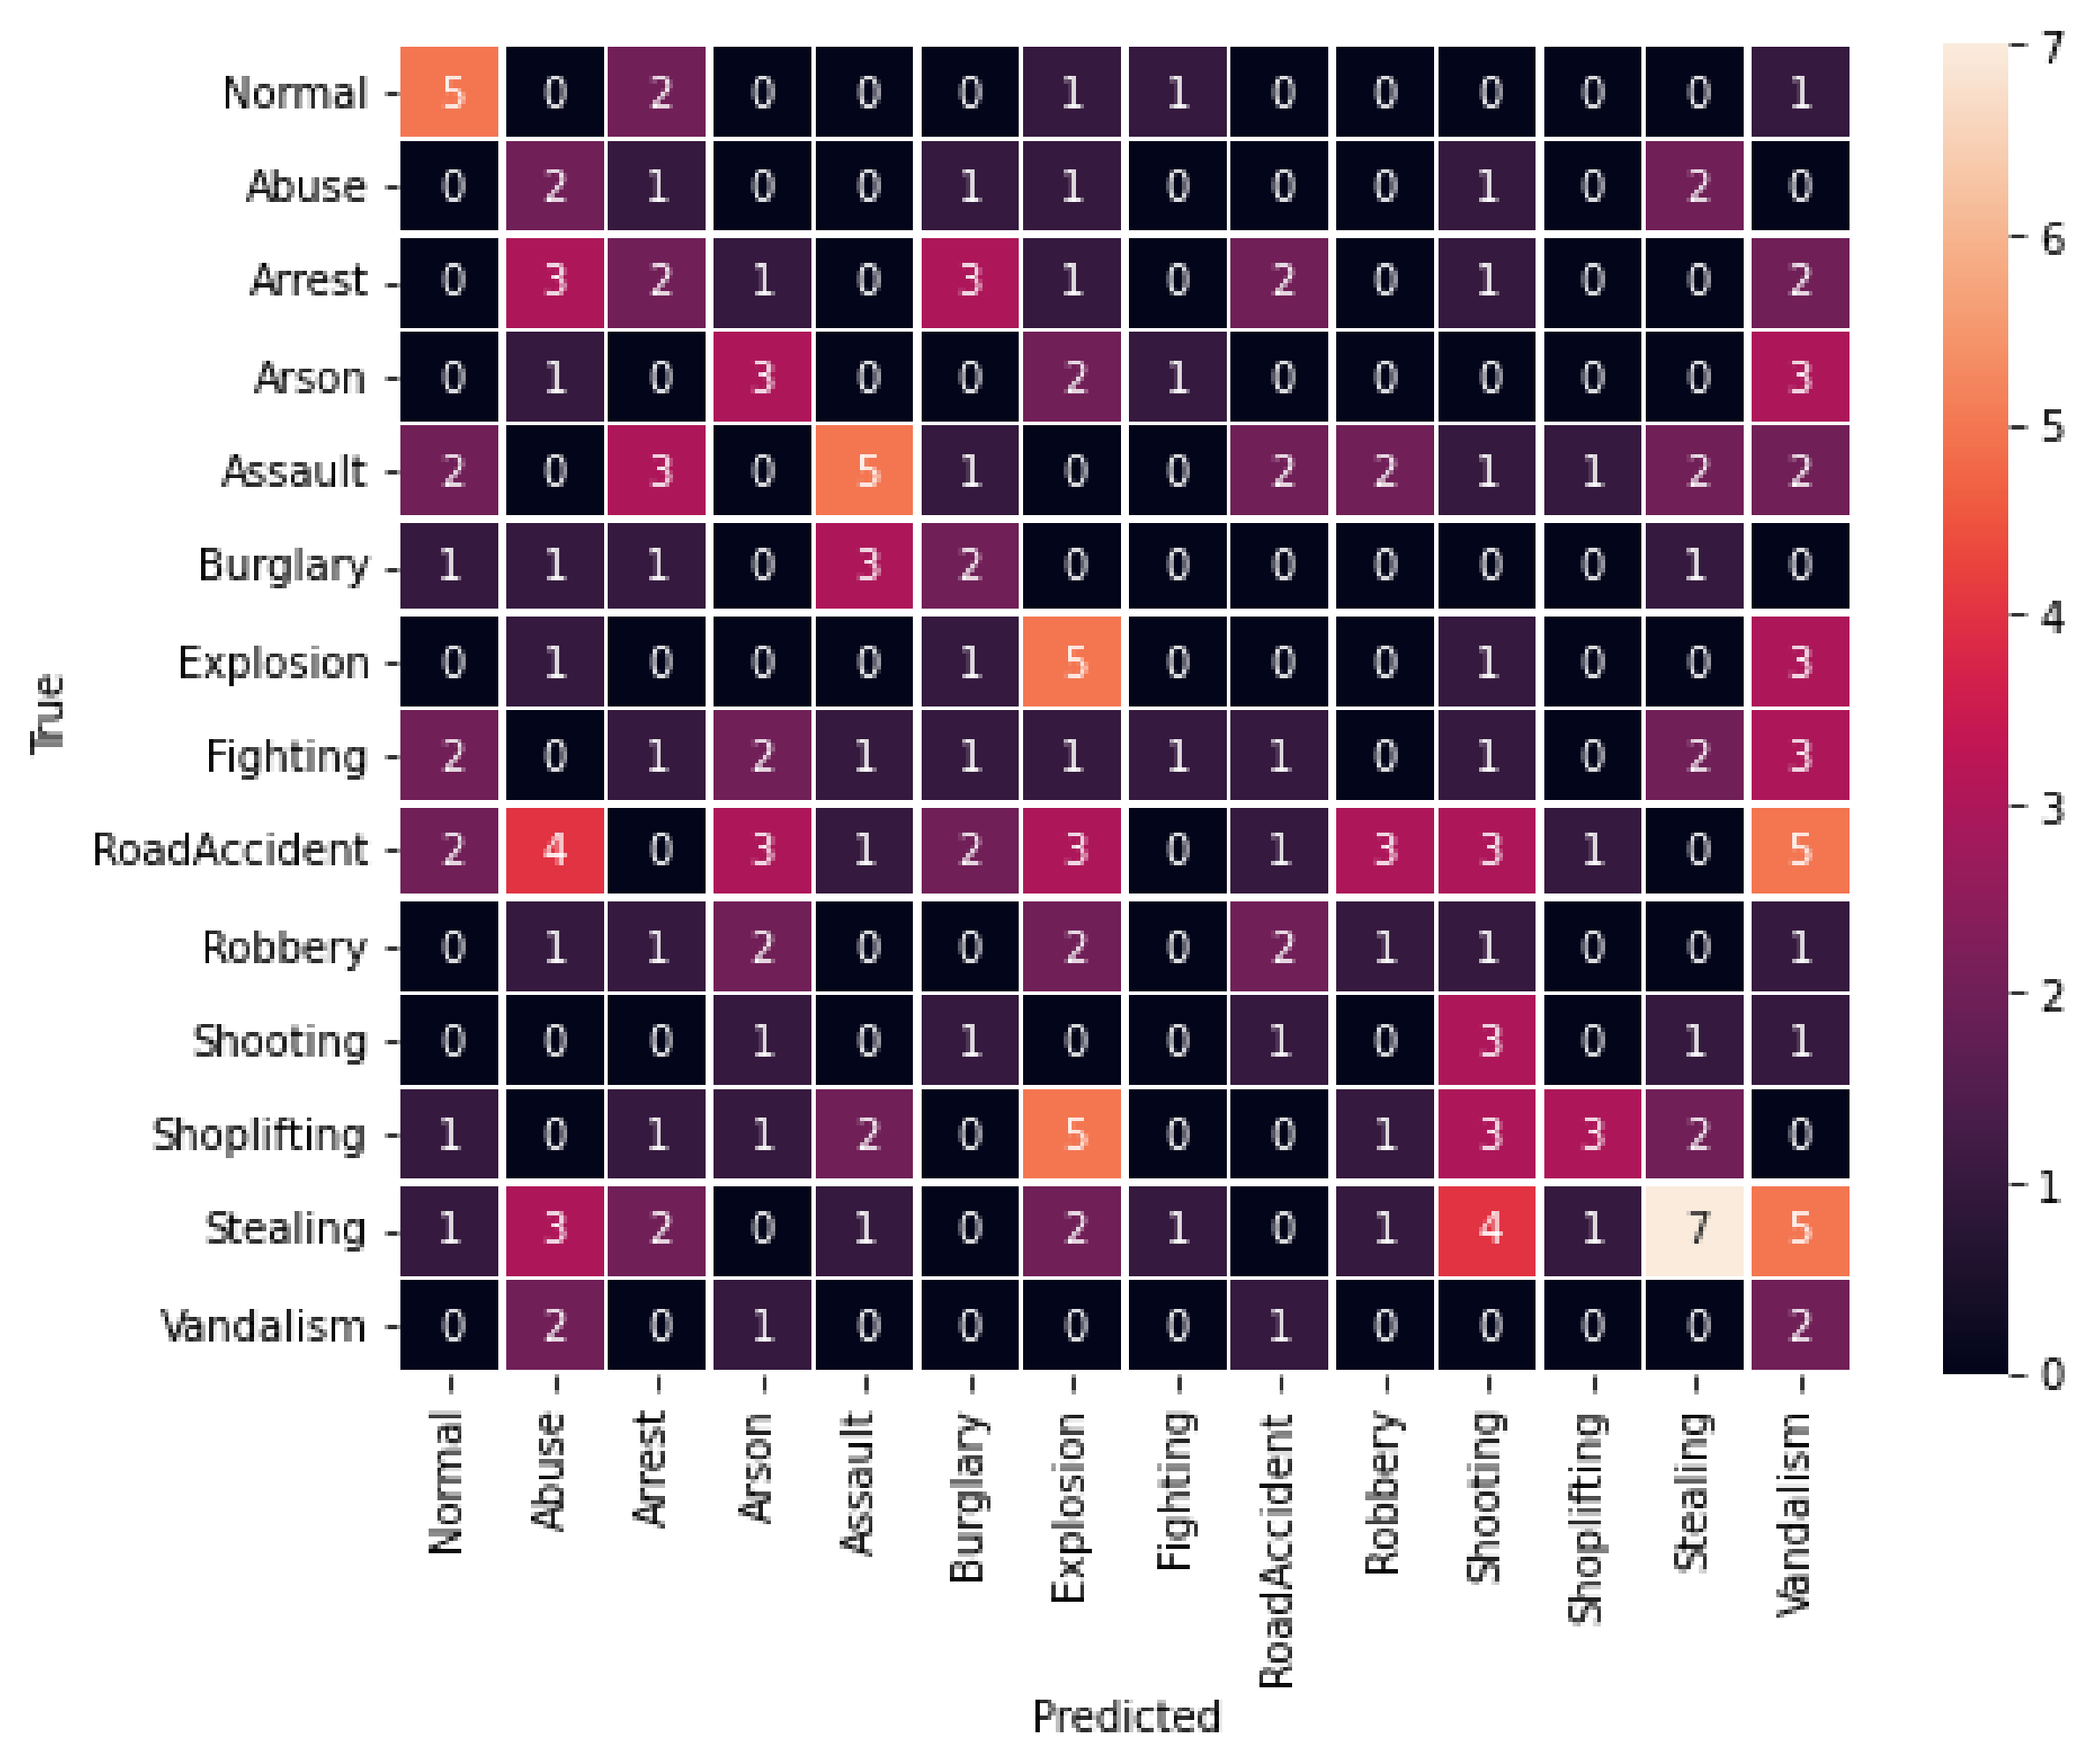
4.3. Evaluation
5. Conclusions, Limitations and Future Work
Author Contributions
Funding
Data Availability Statement
Conflicts of Interest
Definitions
- AUC: The AUC (Area under the curve) of the ROC (Receiver operating characteristic; default) or PR (Precision Recall) curves are quality measures of binary classifiers. This class approximates AUCs using a Riemann sum. During the metric accumulation phrase, predictions are accumulated within predefined buckets by value. The AUC is then computed by interpolating per-bucket averages. These buckets define the evaluated operational points.
- Accuracy: Calculates how often predictions equal labels. This metric creates two local variables, total and count that are used to compute the frequency with which matches . This frequency is ultimately returned as binary accuracy: an idempotent operation that simply divides total by count.
- : Calculated by where means the number of True Positives, the number of False Positives.
- : Calculated by where means the number of True Positives, the number of False Negative.
- F1-score: The F1-score is the harmonic mean of the precision and recall. In that, as it close to 1 it shows the better value while 0 means the worst value for F1-score. This metric calculated from and value as follow:
- Confusion Matrix: Provides a summary of predicted results on a classification problem, and shows them in a matrix format to depicts the number of correct and incorrect predictions.
References
- Hospedales, T.; Gong, S.; Xiang, T. Video behaviour mining using a dynamic topic model. Int. J. Comput. Vis. 2012, 98, 303–323. [Google Scholar] [CrossRef]
- Sulman, N.; Sanocki, T.; Goldgof, D.; Kasturi, R. How effective is human video surveillance performance? In Proceedings of the 2008 19th IEEE International Conference on Pattern Recognition, ICPR, Tampa, FL, USA, 8–11 December 2008; pp. 1–3. [Google Scholar]
- Nguyen, T.N.; Meunier, J. Anomaly detection in video sequence with appearance-motion correspondence. In Proceedings of the 2019 IEEE/CVF International Conference on Computer Vision, ICCV, Seoul, Korea, 27 October–2 November 2019; pp. 1273–1283. [Google Scholar]
- Tian, B.; Morris, B.T.; Tang, M.; Liu, Y.; Yao, Y.; Gou, C.; Shen, D.; Tang, S. Hierarchical and networked vehicle surveillance in its: A survey. IEEE Trans. Intell. Transp. Syst. 2017, 18, 25–48. [Google Scholar] [CrossRef]
- Yu, J.; Yow, K.C.; Jeon, M. Joint representation learning of appearance and motion for abnormal event detection. Mach. Vision Appl. 2018, 29, 1157–1170. [Google Scholar] [CrossRef]
- Varadarajan, J.; Odobez, J.M. Topic models for scene analysis and abnormality detection. In Proceedings of the 2009 IEEE 12th International Conference on Computer Vision Workshops, ICCV Workshops, Kyoto, Japan, 27 September–4 October 2009; pp. 1338–1345. [Google Scholar]
- Sodemann, A.A.; Ross, M.P.; Borghetti, B.J. A review of anomaly detection in automated surveillance. IEEE Trans. Syst. Man, Cybern. Part C (Appl. Rev.) 2012, 42, 1257–1272. [Google Scholar] [CrossRef]
- Zweng, A.; Kampel, M. Unexpected human behavior recognition in image sequences using multiple features. In Proceedings of the 2010 20th International Conference on Pattern Recognition, ICPR, Istanbul, Turkey, 23–26 August 2010; pp. 368–371. [Google Scholar]
- Jodoin, P.M.; Konrad, J.; Saligrama, V. Modeling background activity for behavior subtraction. In Proceedings of the 2008 Second ACM/IEEE International Conference on Distributed Smart Cameras, Trento, Italy, 9–11 September 2008; pp. 1–10. [Google Scholar]
- Dong, Q.; Wu, Y.; Hu, Z. Pointwise motion image (PMI): A novel motion representation and its applications to abnormality detection and behavior recognition. IEEE Trans. Circuits Syst. Video Technol. 2009, 19, 407–416. [Google Scholar] [CrossRef][Green Version]
- Mecocci, A.; Pannozzo, M.; Fumarola, A. Automatic detection of anomalous behavioural events for advanced real-time video surveillance. In Proceedings of the 3rd International Workshop on Scientific Use of Submarine Cables and Related Technologies, Lugano, Switzerland, 31 July 2003; pp. 187–192. [Google Scholar]
- Li, H.P.; Hu, Z.Y.; Wu, Y.H.; Wu, F.C. Behavior modeling and abnormality detection based on semi-supervised learning method. Ruan Jian Xue Bao (J. Softw.) 2007, 18, 527–537. [Google Scholar] [CrossRef][Green Version]
- Yao, B.; Wang, L.; Zhu, S.C. Learning a scene contextual model for tracking and abnormality detection. In Proceedings of the 2008 IEEE Computer Society Conference on Computer Vision and Pattern Recognition Workshops, Anchorage, AK, USA, 23–28 June 2008; pp. 1–8. [Google Scholar]
- Yin, J.; Yang, Q.; Pan, J.J. Sensor-based abnormal human-activity detection. IEEE Trans. Knowl. Data Eng. 2008, 20, 1082–1090. [Google Scholar] [CrossRef]
- Benezeth, Y.; Jodoin, P.M.; Saligrama, V.; Rosenberger, C. Abnormal events detection based on spatio-temporal co-occurences. In Proceedings of the 2009 IEEE conference on computer vision and pattern recognition CVPR, Miami, FL, USA, 20–25 June 2009; pp. 2458–2465. [Google Scholar]
- Dong, N.; Jia, Z.; Shao, J.; Xiong, Z.; Li, Z.; Liu, F.; Zhao, J.; Peng, P. Traffic abnormality detection through directional motion behavior map. In Proceedings of the 2010 7th IEEE International Conference on Advanced Video and Signal Based Surveillance, Boston, MA, USA, 29 August–1 September 2010; pp. 80–84. [Google Scholar]
- Loy, C.C.; Xiang, T.; Gong, S. Detecting and discriminating behavioural anomalies. Pattern Recognit. 2011, 44, 117–132. [Google Scholar] [CrossRef]
- Zhang, J.; Liu, Z. Detecting abnormal motion of pedestrian in video. In Proceedings of the 2008 International Conference on Information and Automation, Changsha, China, 20–23 June 2008; pp. 81–85. [Google Scholar]
- Ruff, L.; Vandermeulen, R.A.; Görnitz, N.; Binder, A.; Müller, E.; Müller, K.R.; Kloft, M. Deep semi-supervised anomaly detection. arXiv 2019, arXiv:1906.02694. [Google Scholar]
- Tang, Y.P.; Wang, X.J.; Lu, H.F. Intelligent video analysis technology for elevator cage abnormality detection in computer vision. In Proceedings of the 2009 Fourth International Conference on Computer Sciences and Convergence Information Technology, Seoul, Korea, 24–26 November 2009; pp. 1252–1258. [Google Scholar]
- Feng, J.; Zhang, C.; Hao, P. Online learning with self-organizing maps for anomaly detection in crowd scenes. In Proceedings of the 2010 20th International Conference on Pattern Recognition, Istanbul, Turkey, 23–26 August 2010; pp. 3599–3602. [Google Scholar]
- Sharif, M.H.; Uyaver, S.; Djeraba, C. Crowd behavior surveillance using Bhattacharyya distance metric. In Proceedings of the International Symposium Computational Modeling of Objects Represented in Images, Buffalo, NY, USA, 5–7 May 2010; Springer: Berlin/Heidelberg, Germany, 2010; pp. 311–323. [Google Scholar]
- Xiang, G.; Min, W. Applying Semi-supervised cluster algorithm for anomaly detection. In Proceedings of the 2010 Third International Symposium on Information Processing, Qingdao, China, 15–17 October 2010; pp. 43–45. [Google Scholar]
- Wang, J.; Neskovic, P.; Cooper, L.N. Pattern classification via single spheres. In Proceedings of the 8th International Conference on Discovery Science, Singapore, 8–11 October 2005; Springer: Berlin/Heidelberg, Germany, 2005; pp. 241–252. [Google Scholar]
- Liu, W.; Luo, W.; Lian, D.; Gao, S. Future frame prediction for anomaly detection–a new baseline. In Proceedings of the IEEE Conference on Computer Vision and Pattern Recognition, CVPR, Salt Lake City, UT, USA, 18–23 June 2018; pp. 6536–6545. [Google Scholar]
- Ergen, T.; Mirza, A.H.; Kozat, S.S. Unsupervised and semi-supervised anomaly detection with LSTM neural networks. arXiv 2017, arXiv:1710.09207. [Google Scholar]
- Available online: https://visionlab.uncc.edu/download/summary/60-data/477-ucf-anomaly-detection-dataset (accessed on 12 January 2018).
- Görnitz, N.; Kloft, M.; Rieck, K.; Brefeld, U. Toward supervised anomaly detection. J. Artif. Intell. Res. 2013, 46, 235–262. [Google Scholar] [CrossRef]
- Tran, D.; Bourdev, L.; Fergus, R.; Torresani, L.; Paluri, M. Learning spatiotemporal features with 3d convolutional networks. In Proceedings of the IEEE International Conference on Computer Vision, Santiago, Chile, 7–13 December 2015; pp. 4489–4497. [Google Scholar]
- Sultani, W.; Chen, C.; Shah, M. Real-world anomaly detection in surveillance videos. In Proceedings of the 2018 IEEE Conference on Computer Vision and Pattern Recognition, CVPR, Salt Lake City, UT, USA, 18–23 June 2018; pp. 6479–6488. [Google Scholar]
- Chalapathy, R.; Chawla, S. Deep learning for anomaly detection: A survey. arXiv 2019, arXiv:1901.03407. [Google Scholar]
- Krizhevsky, A.; Sutskever, I.; Hinton, G.E. Imagenet classification with deep convolutional neural networks. In Proceedings of the Advances in Neural Information Processing Systems, Lake Tahoe, NV, USA, 3–6 December 2012; pp. 1097–1105. [Google Scholar]
- Gorokhov, O.; Petrovskiy, M.; Mashechkin, I. Convolutional neural networks for unsupervised anomaly detection in text data. In Proceedings of the 18th International Conference on Intelligent Data Engineering and Automated Learning, Guilin, China, 30 October–1 November 2017; Springer: Cham, Switzerland, 2017; pp. 500–507. [Google Scholar]
- Kim, Y. Convolutional neural networks for sentence classification. arXiv 2014, arXiv:1408.5882. [Google Scholar]
- Varga, D. Multi-pooled inception features for no-reference image quality assessment. Appl. Sci. 2020, 10, 2186. [Google Scholar] [CrossRef]
- Kawahara, J.; BenTaieb, A.; Hamarneh, G. Deep features to classify skin lesions. In Proceedings of the 2016 IEEE 13th International Symposium on Biomedical Imaging (ISBI), Prague, Czech Republic, 13–16 April 2016; pp. 1397–1400. [Google Scholar]
- Bai, X.; Yang, M.; Huang, T.; Dou, Z.; Yu, R.; Xu, Y. Deep-person: Learning discriminative deep features for person re-identification. Pattern Recognit. 2020, 98, 107036. [Google Scholar] [CrossRef]
- Alzubaidi, L.; Zhang, J.; Humaidi, A.J.; Al-Dujaili, A.; Duan, Y.; Al-Shamma, O.; Santamaría, J.; Fadhel, M.A.; Al-Amidie, M.; Farhan, L. Review of deep learning: Concepts, CNN architectures, challenges, applications, future directions. J. Big Data 2021, 8, 53. [Google Scholar] [CrossRef]
- Christiansen, P.; Nielsen, L.N.; Steen, K.A.; Jørgensen, R.N.; Karstoft, H. DeepAnomaly: Combining background subtraction and deep learning for detecting obstacles and anomalies in an agricultural field. Sensors 2016, 16, 1904. [Google Scholar] [CrossRef]
- Dong, L.; Zhang, Y.; Wen, C.; Wu, H. Camera anomaly detection based on morphological analysis and deep learning. In Proceedings of the 2016 IEEE International Conference on Digital Signal Processing (DSP), Beijing, China, 16–18 October 2016; pp. 266–270. [Google Scholar]
- Xu, D.; Ricci, E.; Yan, Y.; Song, J.; Sebe, N. Learning deep representations of appearance and motion for anomalous event detection. arXiv 2015, arXiv:1510.01553. [Google Scholar]
- Hasan, M.; Choi, J.; Neumann, J.; Roy-Chowdhury, A.K.; Davis, L.S. Learning temporal regularity in video sequences. In Proceedings of the IEEE Conference on Computer Vision and Pattern Recognition, Las Vegas, NV, USA, 27–30 June 2016; pp. 733–742. [Google Scholar]
- Nguyen, V.; Phung, D.; Pham, D.S.; Venkatesh, S. Bayesian nonparametric approaches to abnormality detection in video surveillance. Ann. Data Sci. 2015, 2, 21–41. [Google Scholar] [CrossRef]
- Wang, H.; Schmid, C. Action recognition with improved trajectories. In Proceedings of the IEEE International Conference on Computer Vision, Sydney, Australia, 1–8 December 2013; pp. 3551–3558. [Google Scholar]
- Yun, K.; Yoo, Y.; Choi, J.Y. Motion interaction field for detection of abnormal interactions. Mach. Vis. Appl. 2017, 28, 157–171. [Google Scholar] [CrossRef]
- Fu, J.; Rui, Y. Advances in deep learning approaches for image tagging. APSIPA Trans. Signal Inf. Process. 2017, 6, E11. [Google Scholar] [CrossRef]
- He, K.; Zhang, X.; Ren, S.; Sun, J. Deep residual learning for image recognition. In Proceedings of the IEEE Conference on Computer Vision and Pattern Recognition, Las Vegas, NV, USA, 27–30 June 2016; pp. 770–778. [Google Scholar]
- Ebrahimi Kahou, S.; Michalski, V.; Konda, K.; Memisevic, R.; Pal, C. Recurrent neural networks for emotion recognition in video. In Proceedings of the 2015 17th ACM on International Conference on Multimodal Interaction, Seattle, WA, USA, 9–13 November 2015; pp. 467–474. [Google Scholar]
- Karim, F.; Majumdar, S.; Darabi, H.; Chen, S. LSTM fully convolutional networks for time series classification. IEEE Access 2017, 6, 1662–1669. [Google Scholar] [CrossRef]
- Medel, J.R.; Savakis, A. Anomaly detection in video using predictive convolutional long short-term memory networks. arXiv 2016, arXiv:1612.00390. [Google Scholar]
- Singh, A. Anomaly Detection for Temporal Data Using Long Short-Term Memory (LSTM). Master’s Thesis, KTH Royal Institute of Technology, Stockholm, Sweden, 2017. [Google Scholar]
- Srivastava, N.; Mansimov, E.; Salakhudinov, R. Unsupervised learning of video representations using lstms. In Proceedings of the 32nd International Conference on Machine Learning (ICML), Lille, France, 6–11 June 2015; pp. 843–852. [Google Scholar]
- Zhang, H.; Zheng, Y.; Yu, Y. Detecting urban anomalies using multiple spatio-temporal data sources. Proc. Acm Interact. Mobile Wearable Ubiquitous Technol. 2018, 2, 1–18. [Google Scholar] [CrossRef]
- Dong, Z.; Qin, J.; Wang, Y. Multi-stream deep networks for person to person violence detection in videos. In Proceedings of the 7th Chinese Conference on Pattern Recognition (CCPR), Chengdu, China, 5–7 November 2016; Springer: Singapore, 2016; pp. 517–531. [Google Scholar]
- Zhou, S.; Shen, W.; Zeng, D.; Fang, M.; Wei, Y.; Zhang, Z. Spatial–temporal convolutional neural networks for anomaly detection and localization in crowded scenes. Signal Process. Image Commun. 2016, 47, 358–368. [Google Scholar] [CrossRef]
- Sudhakaran, S.; Lanz, O. Learning to detect violent videos using convolutional long short-term memory. In Proceedings of the 2017 14th IEEE International Conference on Advanced Video and Signal Based Surveillance (AVSS), Lecce, Italy, 29 August–1 September 2017; pp. 1–6. [Google Scholar]
- Xingjian, S.H.I.; Chen, Z.; Wang, H.; Yeung, D.Y.; Wong, W.K.; Woo, W.C. Convolutional LSTM network: A machine learning approach for precipitation nowcasting. In Proceedings of the Advances in Neural Information Processing Systems, Montreal, QC, Canada, 7–12 December 2015; pp. 802–810. [Google Scholar]
- Deng, J.; Dong, W.; Socher, R.; Li, L.J.; Li, K.; Fei-Fei, L. Imagenet: A large-scale hierarchical image database. In Proceedings of the 2009 IEEE Conference on Computer Vision and Pattern Recognition, Miami, FL, USA, 20–25 June 2009; pp. 248–255. [Google Scholar]
- Alzubaidi, L.; Fadhel, M.A.; Al-Shamma, O.; Zhang, J.; Santamaría, J.; Duan, Y.; R Oleiwi, S. Towards a better understanding of transfer learning for medical imaging: A case study. Appl. Sci. 2020, 10, 4523. [Google Scholar] [CrossRef]
- Mahmood, A.; Ospina, A.G.; Bennamoun, M.; An, S.; Sohel, F.; Boussaid, F.; Hovey, R.; Fisher, R.B.; Kendrick, G.A. Automatic hierarchical classification of kelps using deep residual features. Sensors 2020, 20, 447. [Google Scholar] [CrossRef] [PubMed]
- Ahmadi, S.; Rezghi, M. Generalized low-rank approximation of matrices based on multiple transformation pairs. Pattern Recognit. 2020, 108, 107545. [Google Scholar] [CrossRef]
- Zapata-Impata, B.S.; Gil, P.; Torres, F. Learning spatio temporal tactile features with a ConvLSTM for the direction of slip detection. Sensors 2019, 19, 523. [Google Scholar] [CrossRef]
- Moreira, D.; Barandas, M.; Rocha, T.; Alves, P.; Santos, R.; Leonardo, R.; Vieria, P.; Gamboa, H. Human Activity Recognition for Indoor Localization Using Smartphone Inertial Sensors. Sensors 2021, 21, 6316. [Google Scholar] [CrossRef]
- Zhong, J.X.; Li, N.; Kong, W.; Liu, S.; Li, T.H.; Li, G. Graph convolutional label noise cleaner: Train a plug-and-play action classifier for anomaly detection. In Proceedings of the IEEE/CVF Conference on Computer Vision and Pattern Recognition (CVPR), Long Beach, CA, USA, 15–20 June 2019; pp. 1237–1246. [Google Scholar]
- Lu, C.; Shi, J.; Jia, J. Abnormal event detection at 150 fps in matlab. In Proceedings of the IEEE International Conference on Computer Vision, Sydney, Australia, 1–8 December 2013; pp. 2720–2727. [Google Scholar]


| Binary | No. Videos | Ucfcrimes | No. Videos |
|---|---|---|---|
| Abuse | 50 | Abuse | 50 |
| Arrest | 50 | Arrest | 50 |
| Arson | 50 | Arson | 50 |
| Assault | 50 | Assault | 50 |
| Burglary | 100 | Burglary | 50 |
| Explosion | 50 | Explosion | 50 |
| Fighting | 50 | Fighting | 50 |
| RoadAccident | 150 | RoadAccident | 50 |
| Robbery | 150 | Robbery | 50 |
| Shooting | 50 | Shooting | 50 |
| Shoplifting | 50 | Shoplifting | 50 |
| Stealing | 100 | Stealing | 50 |
| Vandalism | 50 | Vandalism | 50 |
| Normal | 950 | Normal | 50 |
| Total | 1900 | Total | 700 |
| 4MajCat | No. Videos | NREF | No. Videos |
|---|---|---|---|
| Theft | 150 | RoadAccident | 30 |
| (Burglary, Robbery, | |||
| Shoplifting, Stealing) | |||
| Vandalism | 150 | Explosion | 50 |
| (Arson, Explosion, | |||
| RoadAccident, Vandalism) | |||
| Violence behaviours | 150 | Fighting | 70 |
| (Abuse, Arrest, Assault, | |||
| Fighting, Shooting) | |||
| Normal | 150 | Normal | 150 |
| Total | 600 | Total | 300 |
| Hyper Parameters | Tune | Acc (%) |
|---|---|---|
| Data Augmentation | True | 54.18 |
| Data Augmentation | False | 53.82 |
| Initial Weight | glorot_uniform | 63.88 |
| Initial Weight | random_uniform | 54.17 |
| Initial Weight | he_uniform | 54.17 |
| Optimizer | RMSprop | 63.88 |
| Optimizer | Adam | 61.34 |
| Model | Acc (%) |
|---|---|
| ResNet50ConvLSTM | 62.5 |
| InceptionV3ConvLSTM | 62.5 |
| VGG19ConvLSTM | 59.32 |
| ResNet101ConvLSTM | 63.75 |
| ResNet152ConvLSTM | 56.25 |
| Model | AUC(%) |
|---|---|
| SVM Baseline | 50.0 |
| Hasan et al. [42] | 50.6 |
| Lu et al. [65] | 65.51 |
| Sultani et al. (loss without constraints) [30] | 74.44 |
| Sultani et al. (loss with constraints) [30] | 75.41 |
| Zhong et al. (C3D) [64] | 81.08 |
| Zhong et al. () [64] | 78.08 |
| our proposed model | 81.71 |
| Evaluation Metric | (Value%) |
|---|---|
| Precision | 22.93 |
| Recall | 24.31 |
| F1-score | 23.60 |
| Accuracy | 22.72 |
| Model | Acc (%) |
|---|---|
| ResNet50ConvLSTM | 22.72 |
| ResNet101ConvLSTM | 23.75 |
| C3D [29] | 23 |
| Dataset | AUC (%) | Acc (%) |
|---|---|---|
| NREF | 79.04 | 65.38 |
| 4MajCat | 73.88 | 62.22 |
| Ucfcrimes | 53.88 | 22.72 |
| Binary | 81.71 | 62.5 |
Publisher’s Note: MDPI stays neutral with regard to jurisdictional claims in published maps and institutional affiliations. |
© 2022 by the authors. Licensee MDPI, Basel, Switzerland. This article is an open access article distributed under the terms and conditions of the Creative Commons Attribution (CC BY) license (https://creativecommons.org/licenses/by/4.0/).
Share and Cite
Vosta, S.; Yow, K.-C. A CNN-RNN Combined Structure for Real-World Violence Detection in Surveillance Cameras. Appl. Sci. 2022, 12, 1021. https://doi.org/10.3390/app12031021
Vosta S, Yow K-C. A CNN-RNN Combined Structure for Real-World Violence Detection in Surveillance Cameras. Applied Sciences. 2022; 12(3):1021. https://doi.org/10.3390/app12031021
Chicago/Turabian StyleVosta, Soheil, and Kin-Choong Yow. 2022. "A CNN-RNN Combined Structure for Real-World Violence Detection in Surveillance Cameras" Applied Sciences 12, no. 3: 1021. https://doi.org/10.3390/app12031021
APA StyleVosta, S., & Yow, K.-C. (2022). A CNN-RNN Combined Structure for Real-World Violence Detection in Surveillance Cameras. Applied Sciences, 12(3), 1021. https://doi.org/10.3390/app12031021