Article

Phytoaccumulation of Heavy Metals by Sodom Apple (Calotropis procera (Aiton) W. T. Aiton) along an Urban–Rural Gradient

1
Department of Botany, University of Malakand, Chakdara Dir Lower, Khyber Pakhtunkhwa 18800, Pakistan
2
School of General Education, College of the North Atlantic—Qatar, 24449 Arab League Street, Doha 122104, Qatar
3
School of Health Sciences, College of the North Atlantic—Qatar, 24449 Arab League Street, Doha 122104, Qatar
*
Author to whom correspondence should be addressed.
Appl. Sci. 2022, 12(3), 1003; https://doi.org/10.3390/app12031003
Submission received: 22 December 2021 / Revised: 13 January 2022 / Accepted: 15 January 2022 / Published: 19 January 2022
(This article belongs to the Special Issue Ecology Impact of Heavy Metals)

Abstract

:
Heavy metals (HMs) are widely recognized for their toxicity and have serious environmental implications as technology advances and public pressure mounts to guarantee the safest and healthiest environment. This study evaluates the phytoremediation potential of HMs i.e., Copper (Cu), Zinc (Zn), Lead (Pb), and Cadmium (Cd) by Calotropis procera (Aiton) W.T. Aiton, also known as Sodom apple, along an urban–rural gradient and its effect on communities’ diversity, forage and medicinal quality in semi-arid region of Khyber Pakhtunkhwa Pakistan. The HM concentration was investigated along with the urban–rural gradients by sampling C. procera and soil samples. Acid-digested samples were tested for metal concentration using an atomic absorption spectrophotometer (AAS). We used principal component analysis and cluster analysis to identify the pattern of metal distribution in plants and soil. To comprehend the species’ diversity of plant communities in polluted sites, the species’ composition of C. procera communities was explored. Our results showed that the concentration of HMs in the soil and plant decreased from Zn to Cd (Zn > Cu > Pb > Cd). Likewise, more than half of the soil metal accumulated in the roots and aerial part of the plant, indicating the bioaccumulation potential of the plant species for these metals. Zn, Cu, Pb, and Cd translocation ratio varied from root > stem > leaf > flower. Root to stem transfer of metal was poor, but strongly mobilized to the leaves when available in the stems. Carthamus lanatus, Sonchus asper, Cynodon dactylon, Xanthium strumarium, and Silybum marianum were the leading species in three groups of 36 plant species. Pearson’s correlation revealed a significant relationship between HM concentrations and diversity indices. Zn and Cu content in the soil influenced plant species richness, Shannon–Wiener index (H′), and evenness index (Eh). Given the environmental toxicity of HMs, Cd concentrations in soil exceeded the permissible level, suggesting residents should be warned about potential health risks. As a result, the species chosen for this study can be employed as a biomonitor and phytoremediator of soil contaminated by these HMs, as it can accumulate HMs to a toxic level.

1. Introduction

Heavy metal (HM) pollution has spread across the biosphere, making it a serious worldwide concern because of its risk to humans and animals [1,2]. Various anthropogenic activities are mostly related to urban–rural gradients and industrialization, such as mining, application of fertilizers, smelting and industrial manufacturing processes, which can lead to the release of the HMs into the environment [3,4,5]. HMs are a serious matter of concern as these elements are non-biodegradable and persist in the soil for a much longer time than in other parts of the environment [6,7]. High concentrations of toxic metals, including Zn, Cu, and Cd are mostly due to human activities [8,9]. Metal contamination in the environment would affect the diversity, microbial properties, and functional diversity of soils [10,11]. Moreover, increased concentration of metal in the soils can be transferred and deposited into plants and likewise to human beings, producing numerous serious health disorders [6,12].
Numerous tools for remediation of contaminated soils have been undertaken, such as chemical/physical treatment and excavation of contaminated material. However, significant efforts have been made lately to identify cost-effective solutions for remediation of HMs-contaminated soil [13,14,15]. Recently, these cost-effective approaches, such as phytoremediation, have become a subject of public and scientific interest to alleviate HM pollutants from the soil, water, and air [16,17,18]. Phytoremediation is the use of plants to remove contamination from the soil, sediments, and water [19]. Metal hyperaccumulator plant species have been reported, but they are slow-growing, less abundant, and produce little biomass [20,21]. Phytoremediation treatments may be more successful if native plant species can overcome these hurdles. Native plants are frequently efficient in growth, reproduction, and survival when faced with challenging circumstances [22,23]. Therefore, the search for native plants with phytoremediation potential is important and continues [24,25].
A few natural, well-adapted plants have been utilized extensively for HM phytoremediation applications, including lemongrass (vetiver), Siam weed, wild grasses, Crotalaria, Avena, and Sesbania species [26,27,28]. C. procera, a traditional medicinal plant that may accumulate considerable amounts of HMs [29,30], is a dominating species in Khyber Pakhtunkhwa, and has been evaluated for its phytoremediation potential in this study. Furthermore, C. procera was chosen as a HMs pollution biomonitor for a variety of reasons: it may be found on the roadside, in urban and rural regions; it has a wide geographical range and ecological distribution; and sampling, identification, and cultivation are simple and inexpensive [29,31].
The World Health Organization (WHO) and the United States Environmental Protection Agency (USEPA) have recognized strict criteria for maximum acceptable limits for accumulation of HMs in soil. Toxicant levels in urban soils have been closely monitored and extensively recorded in developed nations, such as North America and Europe [32,33], Still, HM pollution and remediation data are critically deficient in underdeveloped countries. The lack of funds for other treatments makes phytoremediation especially well-suited to these developing nations, where labour, knowledge, and cost-cutting measures are crucial [31]. This study was carried out to fill the gap by presenting a thorough picture of HM contamination in the semi-arid region of Khyber Pakhtunkhwa, as well as identifying prospective candidate species for effective, practical phytoremediation. The present study aims to investigate the toxic levels of Zn, Pb, Cu, and Cd using C. procera L. as a bioindicator; and to evaluate the extent of metal accumulation potential of C. procera in Khyber Pakhtunkhwa, Pakistan.

2. Materials and Methods

2.1. Study Area and Sampling Collection

Bulk soil samples and C. procera plants were collected at 15 sites from Peshawar, Hazara, and Malakand Divisions, which were further classified into road, urban, and rural sites in Khyber Pakhtunkhwa province, Pakistan during the summer of 2019 (Figure 1). Among these three habitats, 11 sites were highly polluted at roadsides and urban areas where the heavy traffic and industries were the main sources of pollution. The roadside areas are mainly situated along the Grand trunk road from Swat to Peshawar District. Moreover, urban areas of Peshawar and Hazara Divisions are the industrial areas, which are densely polluted [34]. However, the rural areas from Malakand Division are characterized by low traffic intensity and population, which is considered as a control site. In Peshawar (34°02′ and 71°56′), elevation is 372 m asl, where the highest temperature was recorded to be 42.7 °C in June, and the lowest temperature was 15.5 °C in January. The relative humidity ranges from 37% to 70% throughout the year.
Malakand Division (34°11′ and 73°15′) and Hazara Division (34°44′ and 72°21′) lie at an elevation of 877 m and 988 m, above sea level. Hazara Division has the highest temperature in June, which was recorded to be 33.90 °C, and the lowest was −2.20 °C in January. The relative humidity ranges from 37.13 to 69.03% throughout the year. While the Malakand Division has the highest temperature in June recorded to be 39.90 °C, and the lowest temperature was 11.80 °C in January. The relative humidity ranges from 38.20 to 60.40% throughout the year [35]. Plant samples (including root, stem, leaves, and flowers) and soil samples were collected to assess the accumulation of HMs in the species. The study areas were waste sites along the roadside and residential areas of Khyber Pakhtunkhwa. These areas received a lot of contamination from traffic pollution and other refuse of human activities.

2.2. Analysis of HMs in Plant and Soil Samples

The concentration of HMs in soil samples was determined by sampling soil from the root zone of the plant. Each soil sample was taken at a depth of 10 cm and blended to create a composite sample. To obtain the fine particles, the soil sample was air-dried and poured through a 2 mm sieve. The soil was then stored in bottles to be analyzed further. Plant samplers collected were dried and estimated biomass through destructive method using electrical balance with a precision of 0.0101 g. The plant sample was cleaned to remove dirt and then dried for a week in a dust-free environment. After that, it was dried in an oven at 75 °C for 24 h. The dried plant samples were ground into a fine powder using a pestle and mortar and then a grinder.
Acid digestion and metal analysis were carried out following the procedure as outlined by Awofolu, [36]. In a 100-mL beaker, 0.25 g of dried plant material was added to 5.25 mL of nitric acid, and then heated on a hot plate until the digest was clear. The digested material was filtered after cooling using a Whatman filter paper. After diluting the filtrate with distilled water to the desired concentration, it was stored in a centrifuge tube. The acid digested samples were analyzed for HMs (Cu, Zn, Cd, and Pb) by using the atomic absorption spectrophotometer (AAS) at Kohat University of Science and Technology.
From the composite soil sample, N content was determined by following Kjeldahl procedure [37], electrical conductivity was calculated using a conductivity meter (Model CON 5) while the soil texture was determined through Bouyoucos Hydrometer [38]. In a 1:5 soil to water suspension, pH of the soil was calculated [39]. Other important nutrients (potassium, phosphorus, and lime concentration) were determined by following standard procedure [40] while organic matter was measured through dichromate oxidation method [41]. Available water was calculated following standard procedure adopted by [42]

2.3. Heavy Metal Accumulation Matrix

Phytoremediation of selected HMs was determined by Bioaccumulation Factors (BAF) and Translocation Factors (TF). BAF is the ratio of metals in plant parts to that in soil. BAF ≤ 1.0 specifies plant ability of metal absorption without significant accumulation. The plant potential to accumulate HMs is revealed from BAF > 1.00 [36,43]. BAF and the TF were determined using the following formula:
BAF = Cplant/Csoil
where Cplant is the concentration of metal in the plant part, and Csoil is the concentration of metal in the soil. Here we determined two types of BAF i.e., from soil to root (S/R) and soil to whole plant tissues (S/P). Similarly, three types of TF were calculated i.e., root to stem (R-S), stem to leaf (S-L) and leaf to flower (L-F).
TF (R-S) = Cstem/Croot
TF (S-L) = Cleaf/Cstem
TF (L-F) = Cflower/Cleaf
where Croot, Cstem, Cleaf or Cflower is the concentration of metal in the root, stem, leaf, and flower, respectively.
Species diversity (Shannon index, H′ and Evenness index, Eh) and soil pollution index (SPI) were calculated by following Wu et al. [44] as
H′ = −∑pi (ln pi)
Eh = H′/H′ max = H′/ln Rs
SPI = (Cdsoil/3 + Cuoil/100 + Pbsoil/100 + Znsoil/300)/4
where pi = proportion of species (i) to total number of species, ln = natural logarithm, H′ = Shannon index, Rs = species richness, SPI = soil pollution index. These diversity indices were calculated using density of the individuals in the sampling site by following Curtis and McIntosh [45].

2.4. Statistical Analyses

The studied metal concentrations were measured in soil dominated by C. procera and a statistical analysis was performed using one-way ANOVA with the Bonferroni post hoc test using a statistical package for social sciences (SPSS version 16.0). To ensure that BAF and TF were statistically significant, a single ANOVA was used. Using R software, correlation plots were drawn to investigate the relationship between species diversity indices and HMs concentration in soil and plants in the research region (Corrplot package). Using PC-Ord software (version 6) and Conoco software (version 4.5), a multivariate approach, two-way cluster analysis, and principal component analysis (PCA) were performed to detect a link between soil and plant-HM content, BAF, and TF. To produce a substantial value for the primary component, an eigenvalue larger than one was used.

3. Results

The phytoaccumulation potential of C. procera with soil physiochemical properties showed a significant variation among the studied habitats (Table 1 and 
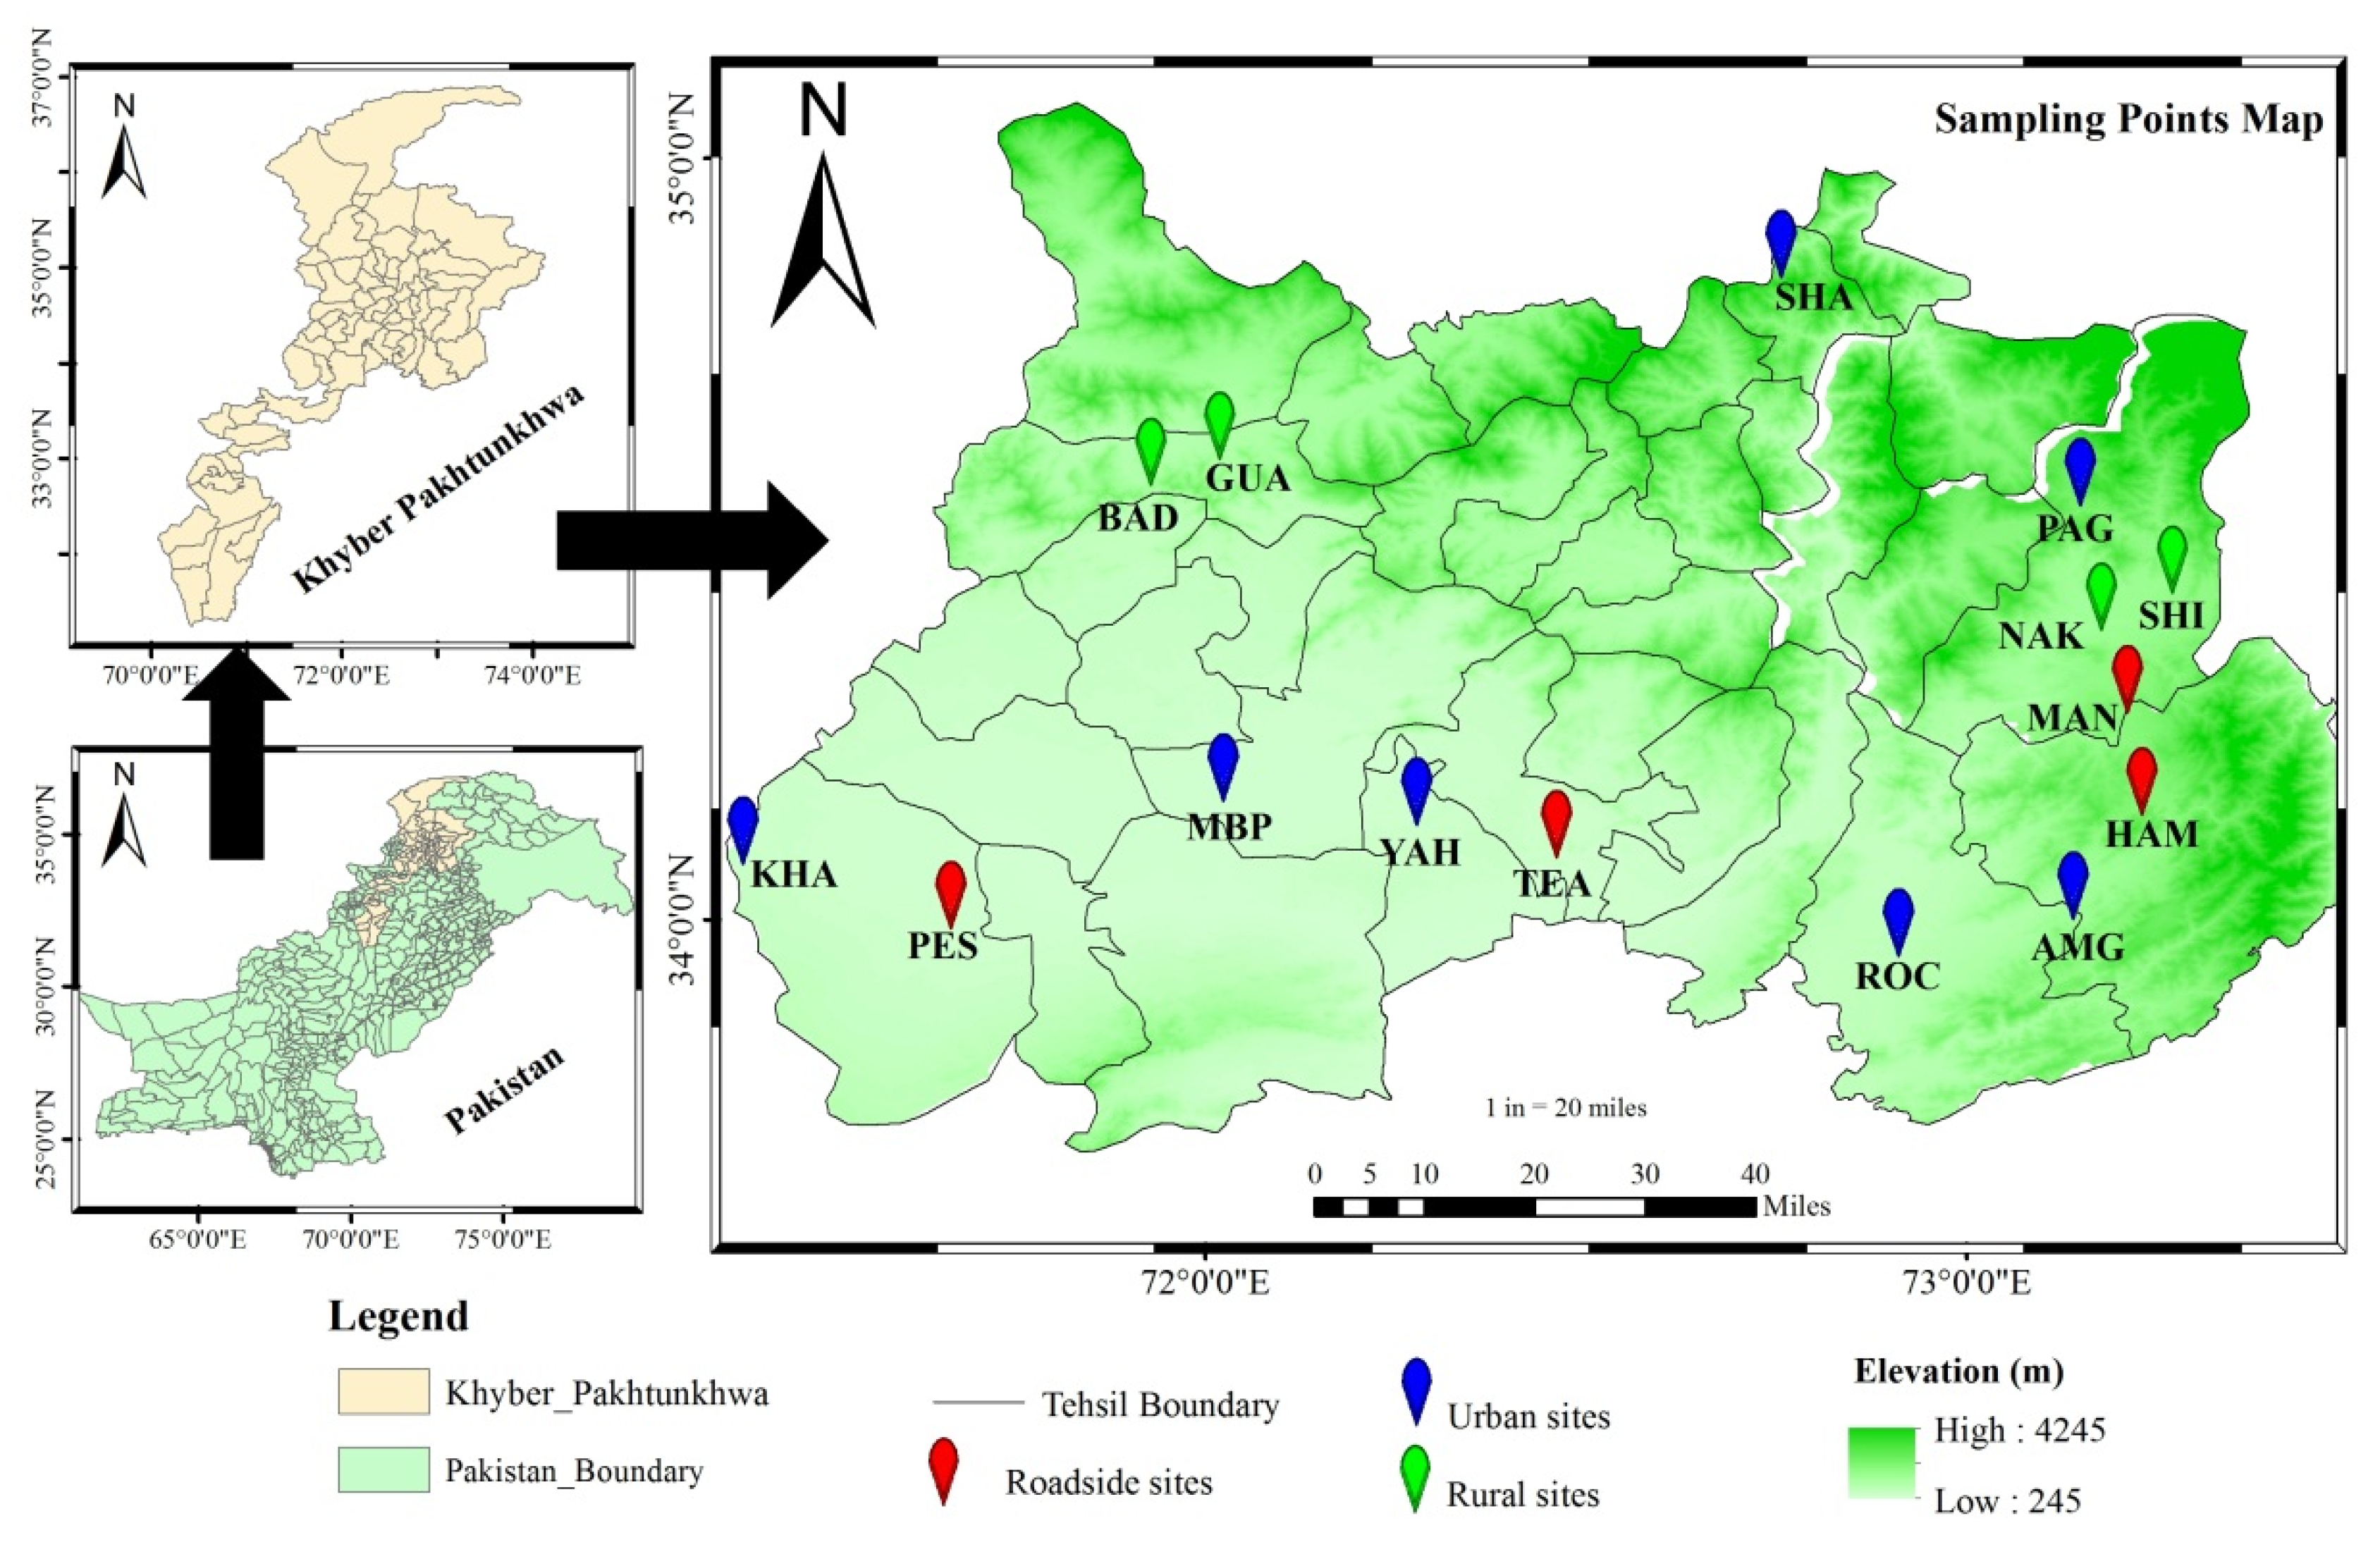
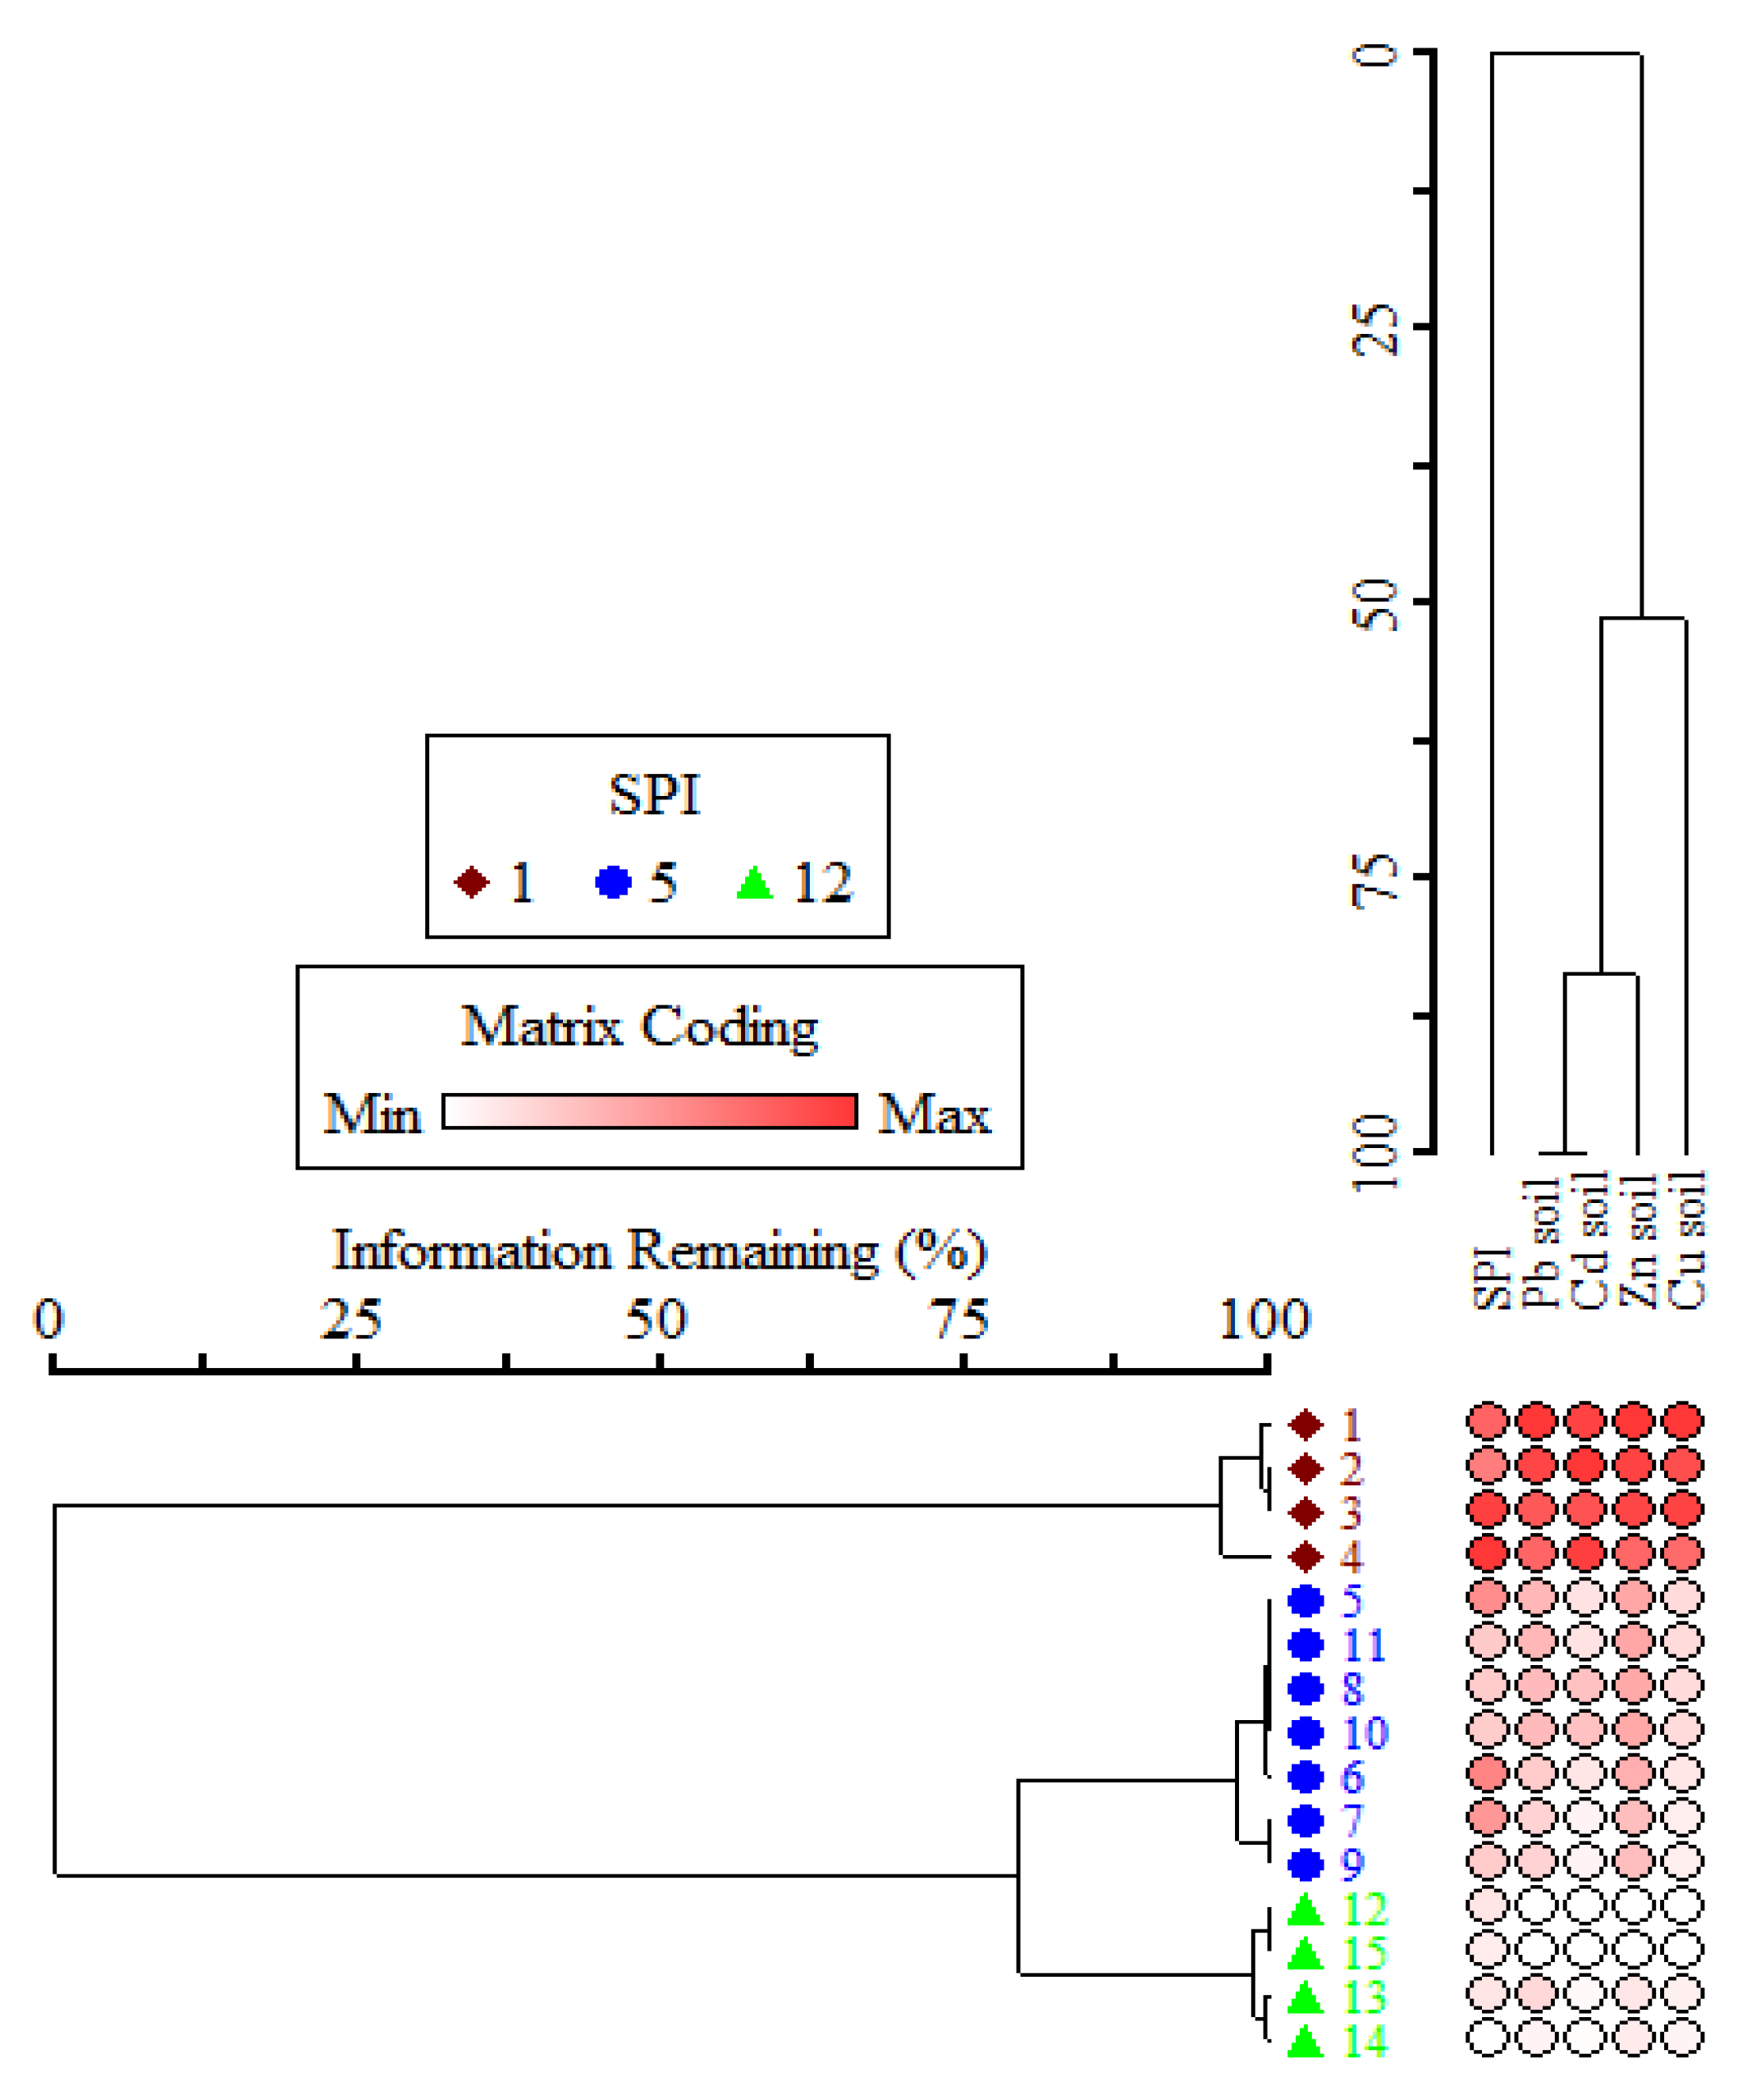
Table 2). The two-way cluster analysis segregated the studied sites into three distinct habitats (roadside, urban, and rural) based on the soil pollution index (Figure 2), i.e., the roadside areas had four stands (PES, MBP, TEA, and HAM) with high cumulative percentage (30.42), and the urban industrial sites (MAN, AMG, ROC, YAH, KHA, SHA, and PAG) had comparatively low cumulative value followed by the rural areas (NAK, SHI, GUA, BAD) with the lowest cumulative variance i.e., 29.71.
The sites showed a significant variation in soil pollution index (SPI) summarized in Table 1. The ANOVA results showed significant difference (F-value = 6.82; p < 0.001), with marked differences between roadsides and urban areas and less variation between urban and rural areas. SPI at roadside and residential areas were comparatively higher than rural sites and ranged between 1.83 ± 0.2–1.12 ± 0.14 mg kg−1 (Table 1).
Soil physiochemical characteristics and diversity indices correlated with the HM contaminated sites are presented in Table 2. The soil texture shows a sandy texture with higher percentage of silt and clay. The pH for soil samples was slightly acidic to neutral ranging from 6.60 ± 0.18 to 6.925 ± 0.110. Organic matter content was quite low (roadside = 0.710 ± 0.12; urban = 1.188 ± 0.19; rural = 0.719 ± 0.149) in all sites tested as the plant prefers to grow in desert type soils having high sand contents. The sample soils of roadside sites had a higher lime concentration (8.96 ± 0.77), followed by rural and urban areas. The lowest mean value of total bioavailable nitrogen was found in rural areas (0.060 ± 0.02), while the highest mean value of total nitrogen was identified in urban areas (0.142 ± 0.03). The results demonstrate that the nitrogen content in all habitats is higher, except rural areas, which has a low nitrogen concentration. Phosphorous content (mg kg−1) of soil in all the habitats was low. Potassium content was 97.72 ± 11.89 (mg kg−1) in the soil of rural areas, which is higher than the soil of all other habitats.
Table 2 shows diversity indices, origin, and sampling sites of C. procera reported from 15 different sites of Khyber Pakhtunkhwa, Pakistan. The plant was found in patches with lower species diversity and evenness. Carthamus lanatus, Cynodon dactylon, Xanthium stramonium, and Silybum marianum were the dominant species of the plant communities in the investigated areas. The Shannon diversity index was found to be highest for roadsides (2.13 ± 0.06). The lowest Shannon diversity index was found for rural areas (1.38 ± 0.00). Species diversity (H′), richness (Rs), and evenness (Eh) indices showed significant differences between the three habitats. Diversity within communities decreased with the increase in metal concentration in the soil, which is directly linked with species richness and Shannon diversity index. The diversity indices follow the order of roadside > urban areas > rural areas as presented in Table 2.
The HMs content of soil and C. procera are presented in Table 3, which shows the roadside areas having the highest concentrations of HMs followed by urban site compared to rural sites. The Zn and Pb concentrations in soil were within the range of permissible levels. However, the average content of Cd in soil ranged from 3.69 ± 0.05 to 0.90 ± 0.02 which was two times higher than the permissible value (Table 3). The highest concentration of Zn in plant (103.70 ± 3.19) was observed in roadside areas having significant differences from urban and rural site (p < 0.001). The average Cu concentration ranged from 23.45 ± 0.60 to 4.23 ± 0.66; Zn from 103.70 ± 3.19 to 26.15 ± 1.85; Pb from 19.45 ± 0.68 to 3.29 ± 0.50; and Cd from 2.275 ± 0.15 to 1.46 ± 0.08, respectively. The statistical analysis results in Table 3 shows that there is road to rural gradients and that the concentration differences are significant and influence the HMs concentrations, especially for Cu, Zn, and Cd.
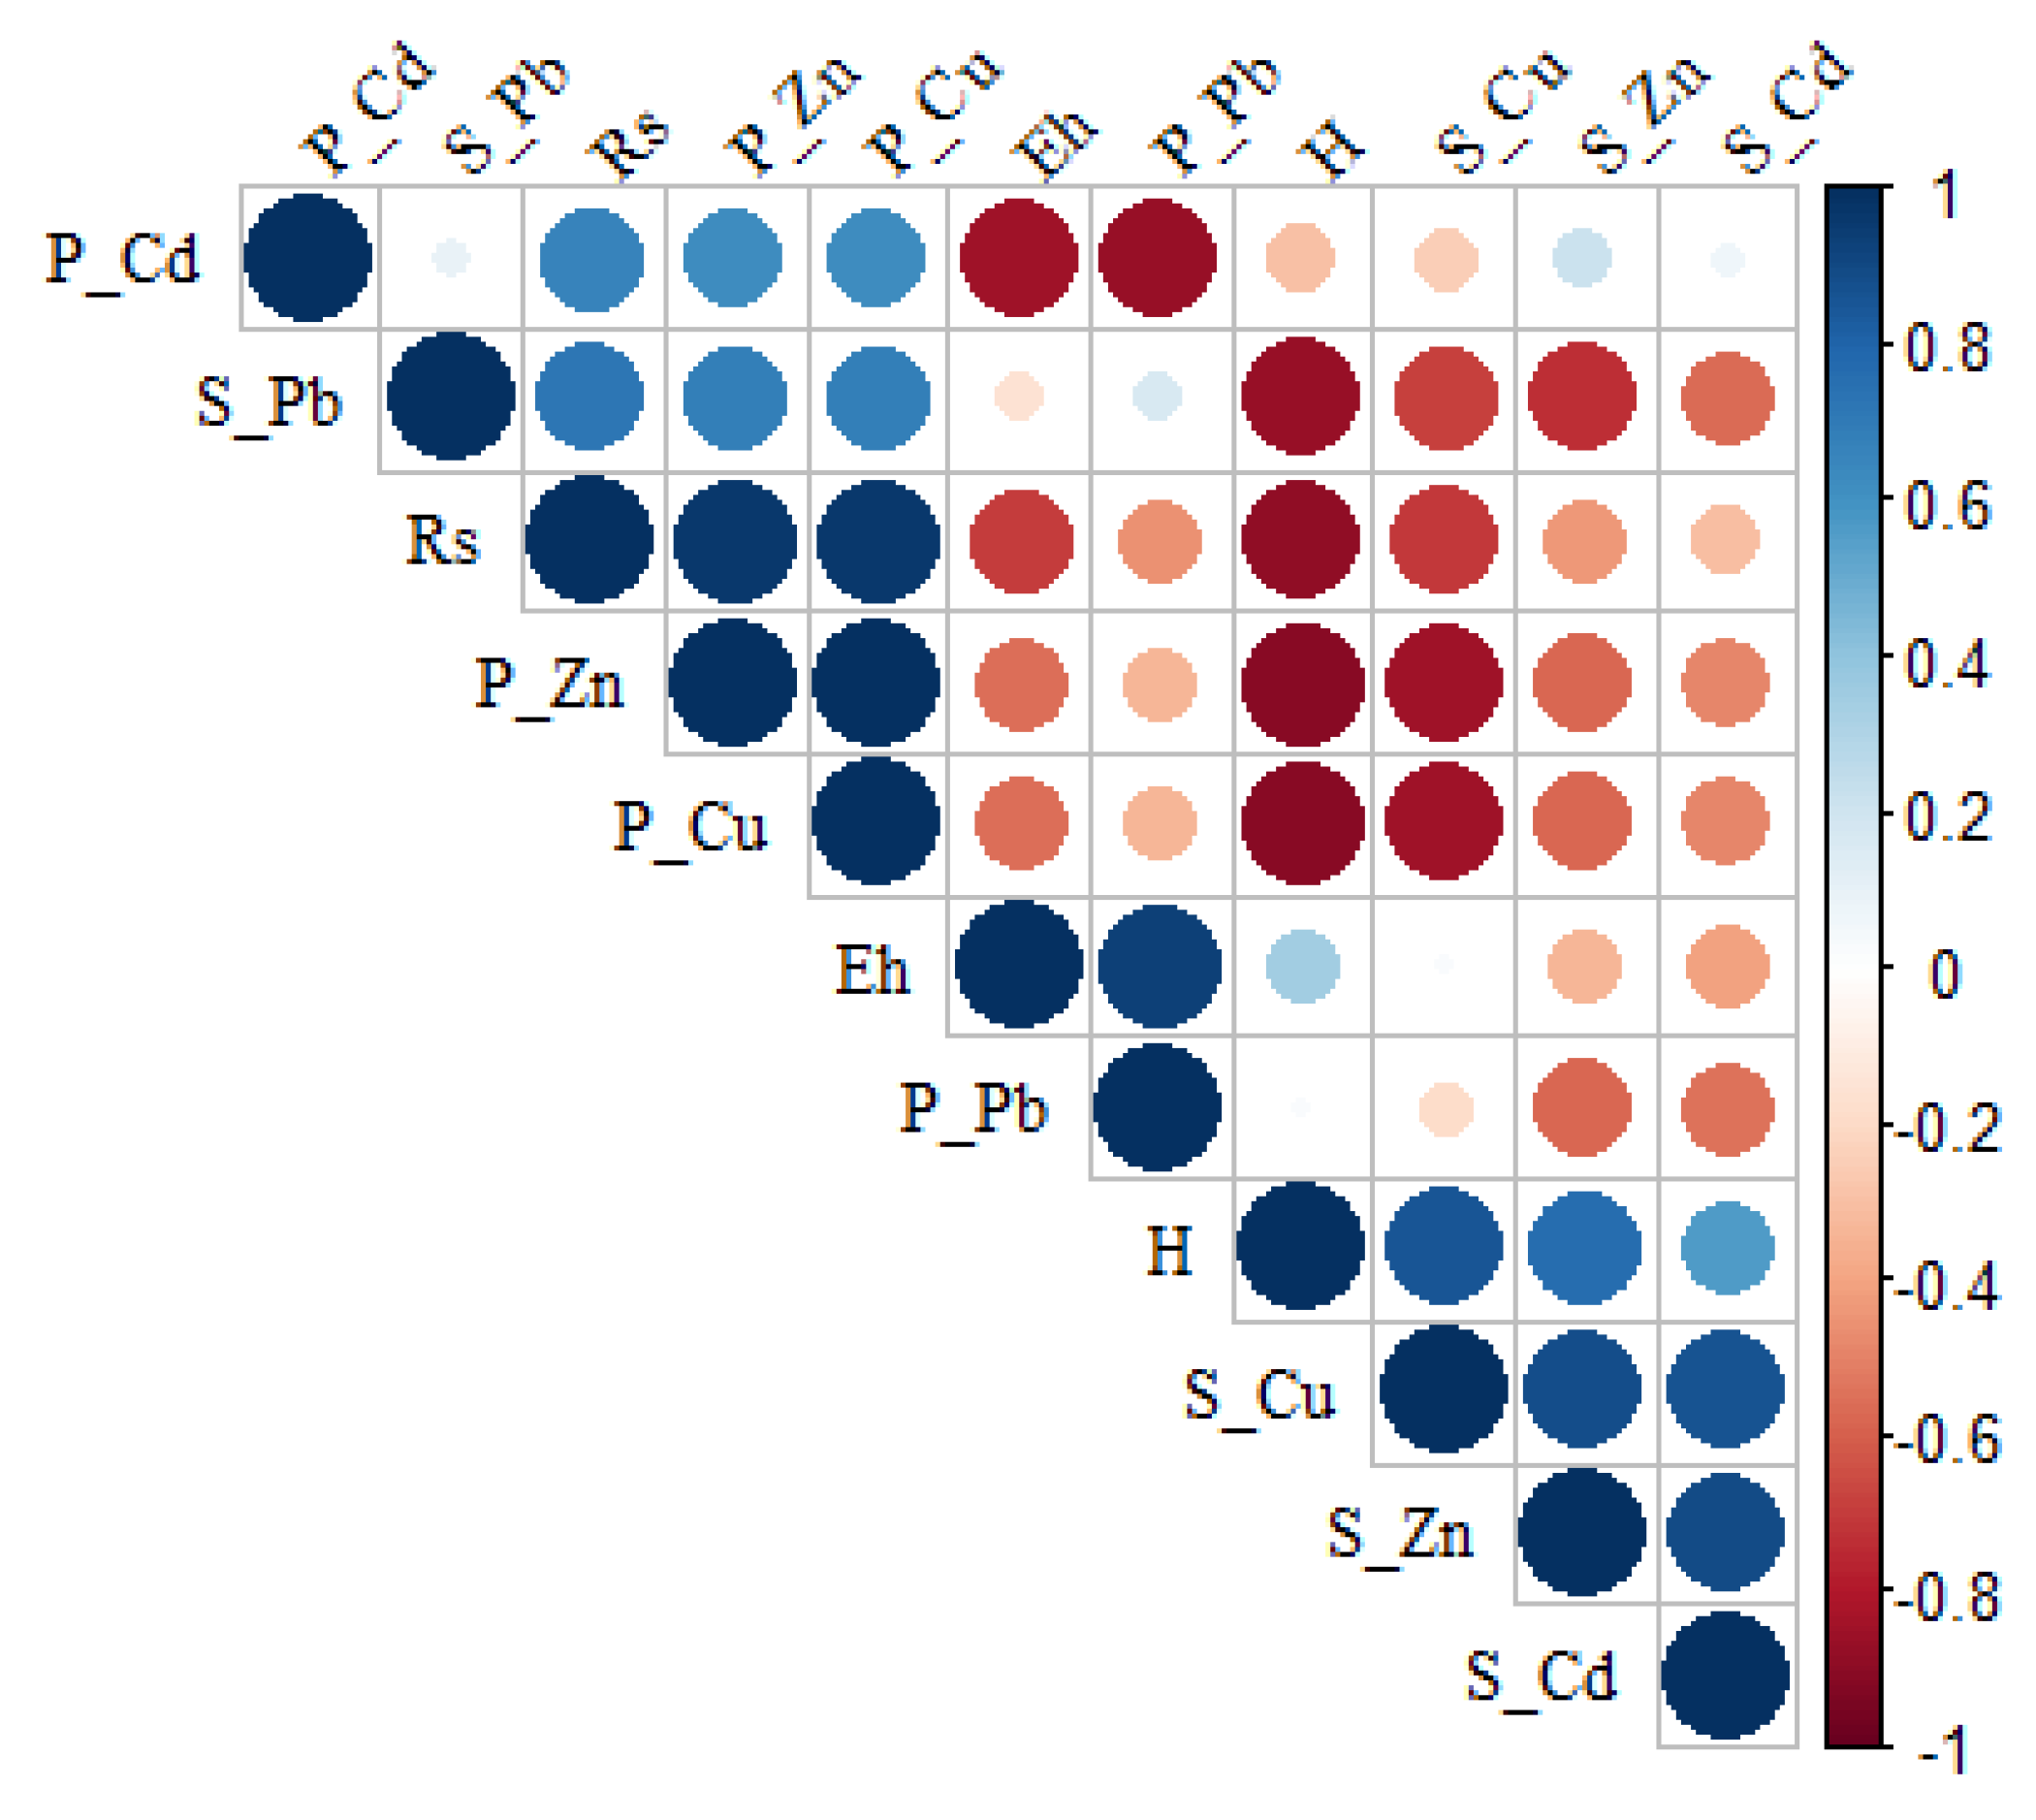
A correlation plot (Figure 3) was used for studying the association between species diversity indices and HM accumulation in soil and plant. The colour represents the degree of pairwise correlation with regards to the Pearson correlation coefficient. Diversity indices exhibited substantial negative associations with HMs in soil and plants, according to the Pearson correlation coefficient (Figure 3). Evenness index was negatively associated with Cu and Zn content in soil, but species richness was positively correlated with Cu and Zn content in the soil. The accumulation of HMs has an impact on the plant density in the community. Plant species diversity demonstrated a substantial positive correlation with metals.
Phytoremediation potential of plants for Pb, Zn, Cu, and Cd was indicated by a bioaccumulation factor (BAF) from soil to plant, and translocation factor (TF) from soil to plant organs presented in Table 4 and Table 5. The BAF in roadside areas was higher in root than the whole plant indicating that metal is retained in the root compared to its aerial parts. Simultaneously, the reverse is true for urban and control areas, which may be due to low metal concentration allowing for plant growth and favouring the transfer of metal to aerial portions, thus increasing the BAF. The BAF value for the root of plants growing on the roadside sites was more than 1, indicating its hyper accumulation ability and can be used efficiently in phytoremediation operations particularly for Zn and Cu. The BAF for Pb was found to be more than 1 in roadside areas for root, which suggested that C. procera can absorb and accumulate Pb (Table 4).
The translocation factor (TF) is an important indicator for the transportation of metal in living tissues, from root to stem (R-S), stem to leaves (S-L), and from leaves to flowers (L-F) of a plant body. Table 5 presents the TF of Zn, Pb, Cu, and Cd in different habitats. Translocation factors for roadside areas and urban areas show a similar pattern in all the studied sites. The TF value was less than 1.00 for R-S, and greater than 1.00 from S-L. Pb TF values for R-S and S-L were found to be higher than 1 in roadside areas. The TF values in most of the sites was more than 1, indicating the plant’s efficient ability to transport metal in the upper parts of the plant. TF for Zn is R-S ≥ to S-L > L-F. Zn translocation is decreased in floral parts so that floral parts may receive a lower quantity of Zn compared to Pb and Cu and Cd. The highest Cu translocation was from R-S followed by the S-L, and less translocation is for L-F. Cd was found to be less mobile compared to Pb, Zn and Cu. Cd translocation was found to be higher for L-F. The ANOVA result was significant, indicating significant differences in translocation among sites and plant parts. In many cases, the translocation factor was more than 1, indicating the ability of C. procera to accumulate and translocate high quantities of metal and potentially be used in phytoremediation practices.
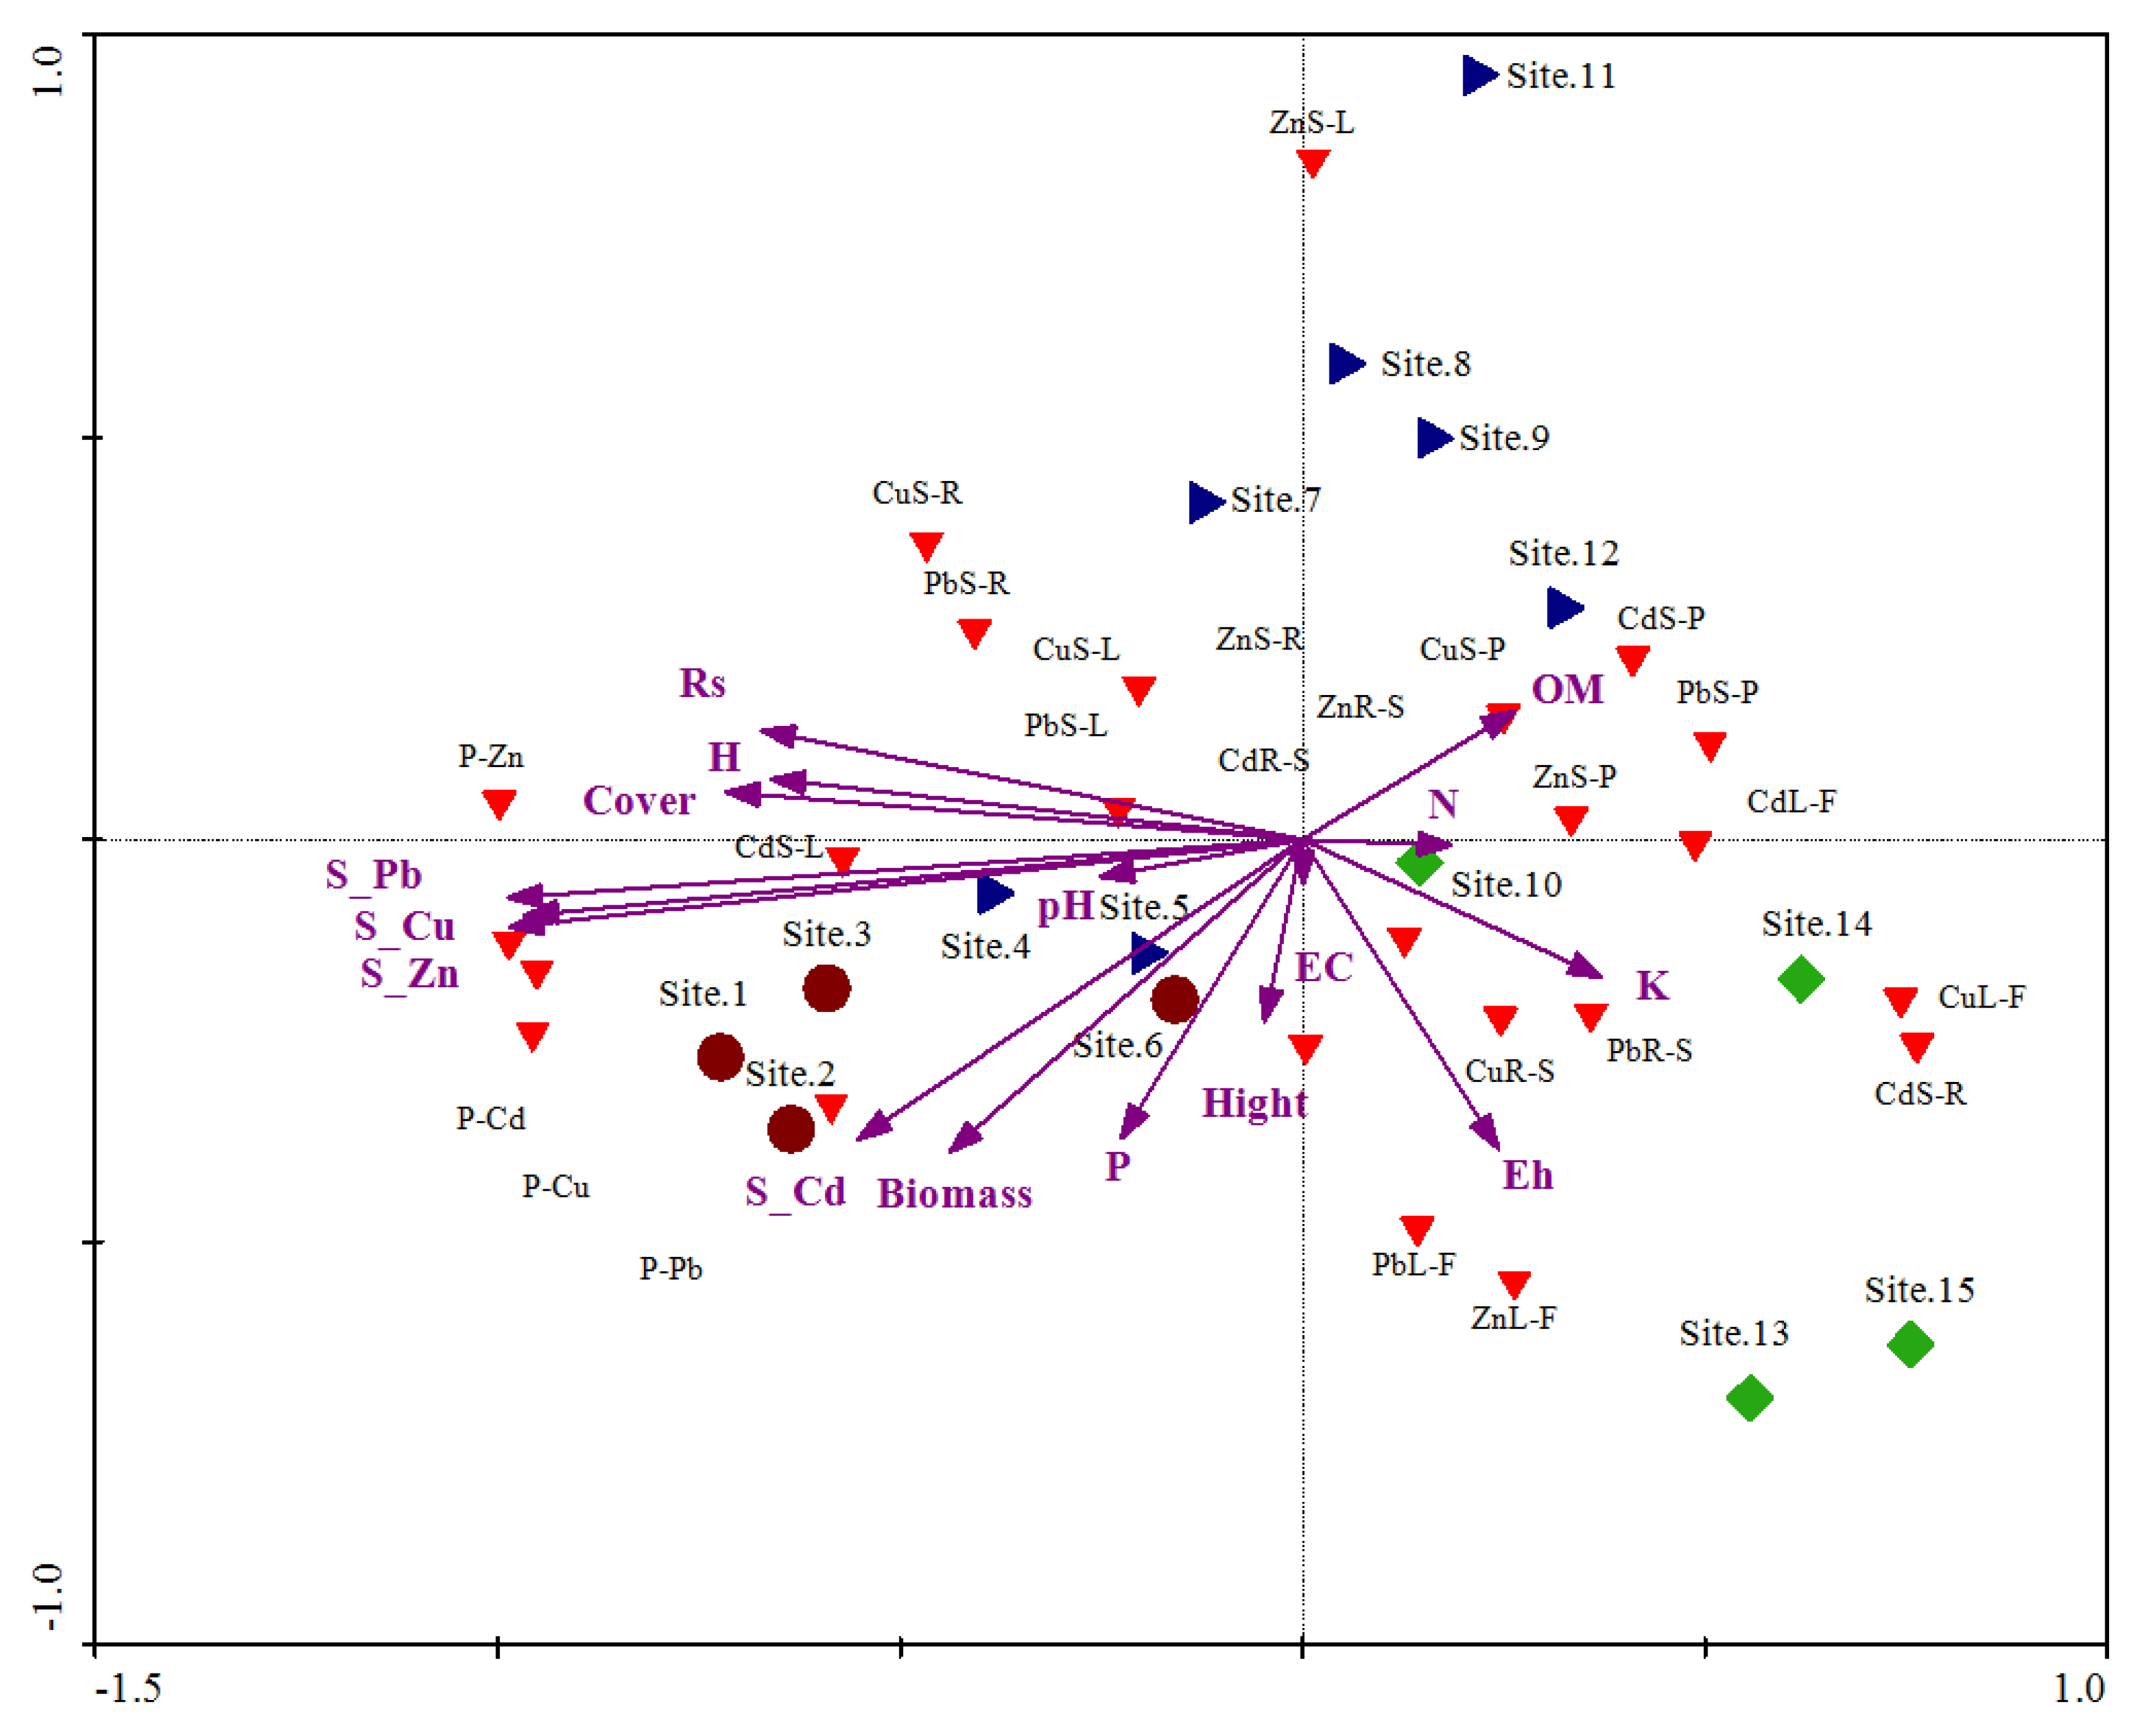
Principal component analysis (PCA) shows the relationship of plant–soil HM concentration, bioaccumulation, and translocation with soil physiochemical properties (Figure 4). The PCA biplot of samples and environmental data show a distinct scattering that was found to be impacted mostly by metal concentration of soil (Zn, Pb, and Cu), soil texture (clay, silt, and sand), organic matter, electrical conductivity, biomass, cover, and available water. Roadside sites are present at the bottom left side of plot and rural areas lie at the bottom right side, while urban areas are present between roadside areas and rural areas.
The first quadrant (on bottom left) of the PCA biplot indicated that roadside areas were mostly gathered under the influence of metal concentrations of soil, biomass, phosphorous, pH, and height of plants, while in the second quadrants (on bottom right), most of the environmental variables are clustered around electrical conductivity, potassium, and evenness index. Furthermore, the third and fourth quadrants of the PCA biplot elaborated that urban areas were assembled under the influence of diversity indices, nitrogen, organic matter, and cover of plants (Figure 4). The percent cumulative variance from the PCA shows 100% of the variance. Table 6 shows the variance extracted from the first 14 Axis where the Axis 1 shows 31.375% of the total variance, which gradually decreased to 0.332 for Axis 14.
HM accumulation in the soils and plant were compared with other studies conducted in Pakistan and other countries with guideline values. Cu and Cd concentrations in soil (15.24, 3.69) of roadside areas were higher due to vehicular emissions as compared to urban and rural areas. The result of the present work in comparison with Egypt [29] except the railway station, the thermal power plant area in India [46], and Riyadh and Ghaza [9], showing higher concentrations of HMs in soil and C. procera. Compared to Pakistan [47], Qatar [30], and India [31], all HM concentrations in addition to Pb and Zn (6.08, 32.18) were higher in the roadside areas. Similarly, Cd concentrations were higher compared to those found in roadside soil of India. Cu concentrations of the present study were less than those of the study conducted in Qatar, India and the study conducted in Egypt (Table 7), indicating that soils in Pakistan were less contaminated by Cu as compared to other countries but highly contaminated as compared to the WHO reference range.
The high concentration of these metals reported in Egyptian railways may be due to wastes generated during train maintenance. This explains why the concentrations of metals analyzed were somewhat higher than those observed in prior research from Egypt and other countries. This is because serious metal pollution has been recorded from several metal processing sections i.e., battery manufacturing and smelting sectors. The mean Pb and Zn contents of the current study (6.08 and 32.18, respectively) were lower than the permissible level (Table 7).

4. Discussion

The soil pollution index (SPI) is considered a key determinant of HMS contamination [53,54], and its value > 1 indicates a higher health risk [55]. Our results revealed that SPIs of roadside areas and residential areas range between 1.83 ± 0.27 and 1.12 ± 0.14 (Table 1), showing that the site was highly polluted. Similarly, Bose et al. (2008) and Alyemeni and Almohisen (2014) [56,57] reported HM pollution in industrial and residential areas, and densely populated commercial districts. Likewise, elevated Pb, Cd, Zn, and Cu were identified in soil and C. procera vegetation along roadside areas and urban areas in the current investigation, which might be attributed to traffic congestion and fast urbanization. Many researchers, for example, Apeagyei et al. [58], Modrzewska and Wyszkowski [59], Soltani et al. [60], and Trujillo-Gonzalez et al. [61], documented increasing HM contamination near roadways and urban areas. The increasing HMs pollution along roadways originates from various causes, including wear and tear of automotive tires, metals in catalysts, deterioration of different parts, and paint erosion [62,63]. Furthermore, uncontrolled migration from rural to urban regions has resulted in a rapid increase in industrial and home effluents, including HMs [62].
In the current investigation, HM pollution was identified to spread from various sources, e.g., in District Peshawar, the industrial zones at various sample sites added pollutants. Moreover, toy manufacturers and sugar mills are the principal HM pollutant sources in District Mardan. Furthermore, one of the primary sources of HMs in the Malakand region is dust particles produced from crushed plant industries. Our findings revealed substantial changes in Pb, Zn, Cu, and Cd contents in plant components from different habitats. The order of metal contents being root > stem > leaves > flower. Cd and Cu concentrations were found to be above the [64] permissible limit in all soil samples, but Pb and Zn concentrations were found to be within the acceptable range values.
HMs bioavailability is influenced by external (soil-related) and internal (plant-related) factors and is responsible for the plant’s ability to absorb HMs [65]. In external factors, soil texture of the studied groups shows a sandy texture, having low organic matter content, favouring bioavailability of HMs [66]. In addition, HMs may form complexes with organic matter, limiting their bioavailability. Organic matter content is known to impact metal bioavailability [67]. The pH varied from 6.60 ± 0.18 to 6.92 ± 0.110 for soil samples that were slightly acidic to neutral. The results obtained were compared to previous studies, which indicated that soil pH significantly impacted metal intake and solubility [68,69]. The electrical conductivity ranging from 256.85 ± 13.56 to 276.68 ± 35.84 µS/cm indicates a normal availability of metal in soil. These findings contrast to the data reported by Ullah and Khan [34].
It is reported by Byrne et al. [70] that HMs concentration negatively affects the diversity and abundance of species in an area. Similarly, soil metal concentration directly impacts species richness and the Shannon diversity index, impacting plant diversity [11]. The current results revealed that a community’s species richness and Shannon diversity index decreases with increased HM contents and substantially correlates. After long-term exposure of plant communities to HM-contaminated soil, plants may develop a mechanism to prevent or minimize the absorption of HMs [71]. In contrast, soil Cd and Cu levels revealed a favourable relationship with species diversity. Cu in the soil is crucial in controlling plant community species diversity [72].
The results in Table 3 show that the urban to rural gradients could significantly influence the HMs concentrations, especially for Cu, Zn, and Cd. Trends of decreasing HM accumulation with urban to rural gradients were also noted by Pouyat and Mcdonnell [64] in a study of HM accumulation in forest soil. In the present work, similar trends were observed in the Cu, Cd, Pb, and Zn concentrations, suggesting that these pollutants accumulated highly in roadside areas compared to rural areas. In rural areas, a high concentration of metals is attributed to the fact that these areas become a wasteland where C. procera grows abundantly. The HMs have been recorded in the order: roadside areas > residential areas > rural areas. In the present study, Zn contents in C. procera samples ranged from 103.70 mg kg−1 in roadside areas to 26.15 mg kg−1 in rural areas. Allen [73] found Zn concentrations in vascular plants between 15 and 100 mg kg−1, with 230 mg kg−1 being toxic. In contrast, Ghaderian and Ravandi [74] revealed that Zn concentrations in vascular plants ranged from 10 to 200 mg kg−1, with Zn essential plants [75]. In the unpolluted region, the zinc level in the upper horizon was 9 mg kg−1, whereas in the contaminated area, the zinc content averaged 71 mg kg−1 as reported by Degryse and Smolders [76]. Zn concentration in leaves of C. procera was shown to be safe in both rural and urban areas.
Cu is an essential element for photosynthesis and the metabolism of protein and carbohydrates [77]. The soil Cu concentrations ranged from 15.24 ± 0.96–3.82 ± 0.37 mg kg−1 at various locations and plant components, whereas the maximum permissible level for Cu concentration is 10 mg kg−1 in plants [78]. Consequently, the plants collected from the roadside were regarded as Cu-toxic. For photosynthesis and protein and carbohydrate metabolism, Cu is needed [77]. There may be harmful implications if copper levels in shoots or leaves exceed 20 mg kg−1 [75]. In biochemical methods, C. procera roots were used as a biosorbent to extract Cu from solutions with known amounts of the metal [79].
Pb has no benefit in plant nutrition and is found in plant tissues at concentrations of 1–10 mg kg−1 [74]. Toy manufacturing, printing and the oil industry produce contaminated water and exhaust gases, which contain Pb. Pb concentrations greater than 5 mg kg−1 are considered toxic to plants [8]. Pb levels in C. procera plants from roadside areas (19.45 ± 0.68) and urban areas (10.36 ± 0.89) were toxic, while rural areas (3.29 ± 0.50) were normal. It might be because Pb is mainly stationary in soil, lowering its bioavailability and subsequent plant absorption [80].
The concentration of Cd in the soil of different sites and plant parts was found in the range of 3.69 ± 0.05 to 0.90 ± 0.02 mg kg−1 for road and rural areas and 2.275 ± 0.15–1.46 ± 0.08 mg kg−1 for roadside and rural areas in plants, respectively. Furthermore, Cd is a hazardous element that occurs naturally, accompanying Zn. Cd is less readily absorbed by soil and organic matter, making it more readily available to plants [81]. Metal manufacturing, plastics, household wastes, automobile fossil fuels, and sewage are the most significant sources of Cd contamination. Plants in an unpolluted environment contain 0.01–0.30 mg kg−1 Cd [73]; hence, Cd concentrations in all tested environments were in the phytotoxic range.
Table 4 and Table 5 show the phytoremediation potential of Pb, Zn, Cu, and Cd using the BAF from soil to plant and the TF in plant parts. The BAF can assess the plants ability to take HMs from soil; however, it is not a precise estimate of HMs concentrations [82,83,84]. According to Sheoran et al. [85], if the BAF is <1, plants cannot be used for metal phytoextraction. Plants with a BAF value of <1 are not appropriate for metal phytoextraction [86]. Cd > Zn > Cu > Pb was the order of BAF for HMs by C. procera, which was similar to that reported by Al-Farraj and Al-Wabel [49] and Galal and Shehata [87] on Plantago major L. Zu et al. [88] showed that BAF >1 could suggest plant capacities for metal accumulation. BAF > 1 was recorded in C. procera plant tissues (Table 4). Similarly, D’Souza et al. [31] observed accumulation ratios under natural conditions and showed that C. procera has a robust phytoextraction potential. Pb and Cd accumulation in leaves was greater than in roots in the C. procera plant samples, suggesting that metals were more heavily allocated to leaves. Waleed [89] reported that C. procera is one of the most useful bioindicators for monitoring pollution levels in Mn, Cr, and Zn polluted areas.
The BAF in roadside areas was higher than 1 in root than the whole plant indicating that metal is retained in roots compared to aerial parts. Significant anthropogenic activities were present in the roadside sample, which may have contributed to the high metal content around the soil and plants. Simultaneously, the opposite is true for residential and control areas, which may be the cause of low metal concentrations, which would allow plant growth and favour metal transfer to aerial portions, thus increasing the transfer factor. The BAF was >1 at roadside areas, which indicates that C. procera can absorb and accumulate these metals [74]. Among the studied areas (road, urban, and rural), the Cu content range of BAF (BAF > 1) was significantly higher at roadside areas, which show the phytotoxicity of this metal. It was expected that this metal has a high concentration in soil because Cu is essential for plant growth [56,90]. BAF of Pb was less than one in roots, which suggested that Pb’s bioavailability is <1, and the plant can only absorb but not accumulate it. Pb concentration shows a significant accumulation of BAF between the root and the whole plant. The BAF for Cd in the studied areas was found to be less than 1.0 (Table 4), which suggests that C. procera can absorb and accumulate Cd but less efficiently than Pb, Zn, and Cu. The results reveal that the roots of plants tend to accumulate more Cd than the stems and leaves as was reported by [91]. Galal and Shehata [87] found that roadside plants had significant bioaccumulation of Cd. Cd uptake may have been linked to organic matter [43,92] and soil pH [87].
The TF is important in relocating metal in living tissues, from root to stem, stem to leaf, and from leaf to flower of a plant body. TFs for roadside and residential areas show a similar pattern at all the studied sites. The TF was <1 from root to stem and >1 from stem to leaf [90]. The results indicate that these metals are transferred marginally to the stem from the root zones but easily mobilize to the leaf if available in the stem [93]. The Pb TF from root to stem and leaf was >1 at roadside areas. The translocation factor in most of the sites was >1, indicating the plant’s ability to efficiently transport metal in the upper parts of the plant. The Zn TF order is the root to stem ≥ stem to leaf > leaf to flower. Zn translocation decreases in floral parts so that floral parts may receive a lower quantity of Zn than Pb and Cu and more Cd. The highest Cu translocation was from root to stem, followed by the stem to leaves, and less translocation from leaf to flowers. Cd was less mobile compared to Pb, Zn, and Cu. Cd translocation was found to be higher from leaves to flowers. Only plant species with a BAF and TF value of more than one have the potential to be employed for metal phytoextraction, according to Yoon et al. [23].
Many studies in Pakistan, e.g., [47] and abroad, e.g., [9,29,48], have shown similar patterns of HMs content in soils and C. procera plant parts. Compared to these reports, minor changes in mean concentrations were found due to traffic intensity, industry type, urbanization level, and residential sewage. The quantities of HMs in the soil and soil parameters, such as soil texture, pH, and organic matter, influence the concentration of HMs in plants [94].

5. Conclusions

The soils in the studied sites were highly contaminated, which is evident from the SPI. The study found that soil organic matter and textural properties affected the HM concentration. In addition, species diversity indices were also found to vary with changes in HM concentration. HMs contamination sources were anthropogenic and natural, as revealed from PCA analysis. Native plant species in the present study show a high ability to accumulate HMs in their tissues. The plants’ phytoremediation potential was evident from the BAF and TF. There was a low transfer rate of metals in the root zone, but metals are rapidly mobilized to the leaves once in the stem. HM uptake from soils must also be compared to airborne deposition of metals on plant surfaces. To better understand the distribution, accumulation, and sources of metal in the semi-arid areas, we need to conduct more extensive monitoring. This research work provides a preliminary understanding of the phytoremediation potential of the native plant species in Khyber Pakhtunkhwa, Pakistan. Further investigation is required to study the phytoremediation potential of other native plant species and compare their ability with non-native species of the regions.

Author Contributions

The study was designed and supervised by N.K.; The field and laboratory work, data analysis, and manuscript writing was carried out by S. and N.K.; K.A. contributed to manuscript writing and research design evaluation; M.E.H.K. contributed to statistical analysis and data refining and D.A.J. provided key background information on the phytoremediation potentials and edited the manuscript for language clarity. All authors have read and agreed to the published version of the manuscript.

Funding

This research received no external funding. A 10% discount on the APC was applied due to corresponding authors affiliation to Qatar National Library.

Institutional Review Board Statement

Not applicable.

Informed Consent Statement

Not applicable.

Data Availability Statement

All the data analyzed/generated are included and available in the manuscript.

Acknowledgments

We express our gratitude to the Master’s students enrolled in the Department of Botany and the people of Malakand Division who helped with the fieldwork for this project. We are also grateful to the Chairman Department of Chemistry, KUST, for analyzing HMs’ soil and plant samples. We extend our gratitude to Muhammad Sadiq, Pharmacy Department of the University of Malakand, for his untiring efforts in laboratory work. We also extend our gratitude to Michael Phillips, Academic Manager: Applied Research and Innovation, and College of the North Atlantic—Qatar for providing a laboratory space for this research.

Conflicts of Interest

I hereby declare that all the authors have participated in this study and the development of the manuscript. All the authors have read the final version and given consent for the article to be published in Applied Sciences.

References

  1. Baize, D.; Tercé, M. Les Éléments Traces Métalliques Dans Les Sols: Approches Fonctionnelles et Spatiales; Editions Quae: Versailles, France, 2002. [Google Scholar]
  2. Badawy, S.; Helal, M.; Chaudri, A.; Lawlor, K.; McGrath, S. Soil Solid-Phase Controls Lead Activity in Soil Solution. J. Environ. Qual. 2002, 31, 162–167. [Google Scholar] [CrossRef] [PubMed]
  3. Davis, M.A.; Grime, J.P.; Thompson, K. Fluctuating resources in plant communities: A general theory of invasibility. J. Ecol. 2000, 88, 528–534. [Google Scholar] [CrossRef] [Green Version]
  4. Singh, A.; Sharma, R.K.; Agrawal, M.; Marshall, F.M. Health risk assessment of heavy metals via dietary intake of foodstuffs from the wastewater irrigated site of a dry tropical area of India. Food Chem. Toxicol. 2010, 48, 611–619. [Google Scholar] [CrossRef]
  5. Saxena, G.; Purchase, D.; Mulla, S.I.; Saratale, G.D.; Bharagava, R.N. Phytoremediation of heavy metal-contaminated sites: Eco-environmental concerns, field studies, sustainability issues, and future prospects. Rev. Environ. Contam. Toxicol. 2019, 249, 71–131. [Google Scholar]
  6. Beyersmann, D.; Hartwig, A. Carcinogenic metal compounds: Recent insight into molecular and cellular mechanisms. Arch. Toxicol. 2008, 82, 493–512. [Google Scholar] [CrossRef]
  7. Sanyaolu, V.; Adeniran, A. Determination of Heavy Metal Fallout on the Surrounding Flora and Aquifer: Case Study of a Scrap Metal Smelting Factory in Odogunyan Area, Ikorodu, Lagos-State, Nigeria. Int. Res. J. Environ. Sci. 2014, 3, 93–100. [Google Scholar]
  8. Ross, S.M. Toxic Metals in Soil-Plant Systems; John Wiley and Sons Ltd.: Hoboken, NJ, USA, 1994. [Google Scholar]
  9. Al-Yemni, M.N.; Sher, H.; El-Sheikh, M.A.; Eid, E.M. Bioaccumulation of nutrient and heavy metals by Calotropis procera and Citrullus colocynthis and their potential use as contamination indicators. Sci. Res. Essays 2011, 6, 966–976. [Google Scholar]
  10. Angelovičová, L.; Fazekašová, D. Contamination of the soil and water environment by heavy metals in the former mining area of Rudňany (Slovakia). Soil Water Res. 2014, 9, 18–24. [Google Scholar] [CrossRef] [Green Version]
  11. Deng, J.; Li, B.; Zhang, S.; Li, Z.; Zu, Y.; He, Y.; Chen, J.; Li, T. Plant Species Diversity of Plant Communities and Heavy Metal Accumulation in Buffer Zone of Momianhe Stream Along a Long-Term Mine Wastes Area, China. Bull. Environ. Contam. Toxicol. 2021, 107, 1136–1142. [Google Scholar] [CrossRef] [PubMed]
  12. Lenart-Boroń, A.; Wolny-Koładka, K. Heavy metal concentration and the occurrence of selected microorganisms in soils of a steelworks area in Poland. Plant Soil Environ. 2015, 61, 273–278. [Google Scholar] [CrossRef] [Green Version]
  13. Chatterjee, S.; Chetia, M.; Singh, L.; Chattopadhyay, B.; Datta, S.; Mukhopadhyay, S. A study on the phytoaccumulation of waste elements in wetland plants of a Ramsar site in India. Environ. Monit. Assess. 2011, 178, 361–371. [Google Scholar] [CrossRef]
  14. Cao, R.X.; Ma, L.Q.; Chen, M.; Singh, S.P.; Harris, W.G. Phosphate-induced metal immobilization in a contaminated site. Environ. Pollut. 2003, 122, 19–28. [Google Scholar] [CrossRef]
  15. Mulligan, C.; Yong, R.; Gibbs, B. Remediation technologies for metal-contaminated soils and groundwater: An evaluation. Eng. Geol. 2001, 60, 193–207. [Google Scholar] [CrossRef]
  16. Igwe, J.; Abia, A. A bioseparation process for removing heavy metals from waste water using biosorbents. Afr. J. Biotechnol. 2006, 5, 518–522. [Google Scholar]
  17. Horsfall Jnr, M.; Spiff, A.I. Effects of temperature on the sorption of Pb2+ and Cd2+ from aqueous solution by Caladium bicolor (Wild Cocoyam) biomass. Electron. J. Biotechnol. 2005, 8, 43–50. [Google Scholar] [CrossRef] [Green Version]
  18. Ruiz, M.; Velasco, J. Nutrient bioaccumulation in Phragmites australis: Management tool for reduction of pollution in the Mar Menor. Water Air Soil Pollut. 2010, 205, 173–185. [Google Scholar] [CrossRef]
  19. Mahar, A.; Wang, P.; Ali, A.; Awasthi, M.K.; Lahori, A.H.; Wang, Q.; Li, R.; Zhang, Z. Challenges and opportunities in the phytoremediation of heavy metals contaminated soils: A review. Ecotoxicol. Environ. Saf. 2016, 126, 111–121. [Google Scholar] [CrossRef] [PubMed]
  20. Saraswat, S.; Rai, J. Phytoextraction potential of six plant species grown in multimetal contaminated soil. Chem. Ecol. 2009, 25, 1–11. [Google Scholar] [CrossRef]
  21. Nedunuri, K.; Lowell, C.; Meade, W.; Vonderheide, A.; Shann, J. Management practices and phytoremediation by native grasses. Int. J. Phytoremediat. 2009, 12, 200–214. [Google Scholar] [CrossRef]
  22. Antosiewicz, D.; Escudĕ-Duran, C.; Wierzbowska, E.; Skłodowska, A. Indigenous plant species with the potential for the phytoremediation of arsenic and metals contaminated soil. Water Air Soil Pollut. 2008, 193, 197–210. [Google Scholar] [CrossRef]
  23. Yoon, J.; Cao, X.; Zhou, Q.; Ma, L.Q. Accumulation of Pb, Cu, and Zn in native plants growing on a contaminated Florida site. Sci. Total Environ. 2006, 368, 456–464. [Google Scholar] [CrossRef]
  24. McGrath, S.P.; Zhao, F.-J. Phytoextraction of metals and metalloids from contaminated soils. Curr. Opin. Biotechnol. 2003, 14, 277–282. [Google Scholar] [CrossRef]
  25. Ginocchio, R.; Baker, A.J. Metallophytes in Latin America: A remarkable biological and genetic resource scarcely known and studied in the region. Rev. Chil. Hist. Nat. 2004, 77, 185–194. [Google Scholar] [CrossRef] [Green Version]
  26. Awolola, G.; Odeyinde, A.; Dosumu, O. Assessment of heavy metals concentrations in soil and siam weed. Niger. J. Soil Sci. 2007, 17, 130–132. [Google Scholar]
  27. Handique, G.; Handique, A. Proline accumulation in lemongrass (Cymbopogon flexuosus Stapf.) due to heavy metal stress. J. Env. Biol. 2009, 30, 299–302. [Google Scholar]
  28. Gadepalle, V.P.; Ouki, S.K.; Hutchings, T. Remediation of copper and cadmium in contaminated soils using compost with inorganic amendments. Water Air Soil Pollut. 2009, 196, 355–368. [Google Scholar] [CrossRef]
  29. Galal, T.M.; Farahat, E.A.; El-Midany, M.M.; Hassan, L.M. Nutrients and heavy metals accumulation by the giant milkweed Calotropis procera (Aiton) WT Aiton in urbanized areas, Egypt. Rend. Lincei 2016, 27, 241–250. [Google Scholar] [CrossRef]
  30. Usman, K.; Al Jabri, H.; Abu-Dieyeh, M.H.; Alsafran, M.H. Comparative assessment of toxic metals bioaccumulation and the mechanisms of chromium (Cr) tolerance and uptake in Calotropis procera. Front. Plant. Sci. 2020, 11, 883. [Google Scholar] [CrossRef]
  31. D’Souza, R.J.; Varun, M.; Masih, J.; Paul, M.S. Identification of Calotropis procera L. as a potential phytoaccumulator of heavy metals from contaminated soils in Urban North Central India. J. Hazard. Mater. 2010, 184, 457–464. [Google Scholar] [CrossRef]
  32. Chirenje, T.; Ma, L.; Reeves, M.; Szulczewski, M. Lead distribution in near-surface soils of two Florida cities: Gainesville and Miami. Geoderma 2004, 119, 113–120. [Google Scholar] [CrossRef]
  33. Crnković, D.; Ristić, M.; Antonović, D. Distribution of heavy metals and arsenic in soils of Belgrade (Serbia and Montenegro). Soil Sediment. Contam. 2006, 15, 581–589. [Google Scholar] [CrossRef]
  34. Ullah, R.; Khan, N.; Ali, K.; Khan, M.E.H.; Jones, D.A. Screening of Xanthium strumarium (IAPS) Growing on Abandoned Habitats in Khyber Pakhtunkhwa, Pakistan: Perspectives for Phytoremediation. Appl. Sci. 2021, 11, 11704. [Google Scholar] [CrossRef]
  35. Ali, A.; Khan, T.A.; Ahmad, S. Analysis of Climate Data of Khyber Pakhtunkhwa, Pakistan. Int. Res. J. Eng. Technol. IRJET 2018, 5, 4266–4282. [Google Scholar]
  36. Awofolu, O. A survey of trace metals in vegetation, soil and lower animal along some selected major roads in metropolitan city of Lagos. Environ. Monit. Assess. 2005, 105, 431–447. [Google Scholar] [CrossRef] [PubMed]
  37. Yeomans, J.; Bremner, J. Carbon and nitrogen analysis of soils by automated combustion techniques. Commun. Soil Sci. Plant Anal. 1991, 22, 843–850. [Google Scholar] [CrossRef]
  38. Gee, G.W.; Or, D. 2.4 Particle-size analysis. Methods Soil Anal. Part. 2002, 4, 255–293. [Google Scholar]
  39. Zhang, Z.-h.; Hu, G.; Ni, J. Effects of topographical and edaphic factors on the distribution of plant communities in two subtropical karst forests, southwestern China. J. Mt. Sci. 2013, 10, 95–104. [Google Scholar] [CrossRef]
  40. Fan, R.; Wang, C.; Chu, Z.; Chen, S. Study on Spatial Distribution of OM, N, P in Surface Soil around Lake Chaohu. Water Resour. Prot. 2013, 5, 585–590. [Google Scholar]
  41. Nelson, D.W.; Sommers, L.E. Total carbon, organic carbon, and organic matter. Methods Soil Anal. Part 3 Chem. Methods 1996, 5, 961–1010. [Google Scholar]
  42. Allen, R.; Pereira, L.; Raes, D.; Smith, M.; Ab, W. Allen_FAO1998. Food Agric. Organ. Rome Italy 1998, 300, 1–15. [Google Scholar]
  43. Liu, W.-X.; Liu, J.-W.; Wu, M.-Z.; Li, Y.; Zhao, Y.; Li, S.-R. Accumulation and translocation of toxic heavy metals in winter wheat (Triticum aestivum L.) growing in agricultural soil of Zhengzhou, China. Bull. Environ. Contam. Toxicol. 2009, 82, 343–347. [Google Scholar] [CrossRef] [Green Version]
  44. Wu, Q.; Leung, J.Y.; Geng, X.; Chen, S.; Huang, X.; Li, H.; Huang, Z.; Zhu, L.; Chen, J.; Lu, Y. Heavy metal contamination of soil and water in the vicinity of an abandoned e-waste recycling site: Implications for dissemination of heavy metals. Sci. Total Environ. 2015, 506, 217–225. [Google Scholar] [CrossRef] [PubMed]
  45. Curtis, J.T.; Mcintosh, R.P. The interrelations of certain analytic and synthetic phytosociological characters. Ecology 1950, 31, 434–455. [Google Scholar] [CrossRef]
  46. Prajapati, S.K. Heavy metal speciation of soil and Calotropis procera from thermal power plant area. Proc. Int. Acad. Ecol. Environ. Sci. 2014, 4, 68. [Google Scholar]
  47. Khalid, N.; Noman, A.; Sanaullah, T.; Akram, M.A.; Aqeel, M. Vehicle pollution toxicity induced changes in physiology, defence system and biochemical characteristics of Calotropis procera L. Chem. Ecol. 2018, 34, 565–581. [Google Scholar] [CrossRef]
  48. Rani, P.; Kumar, A.; Arya, R.C. Ricinus communis and Calotropis procera as Putative Plant Species for the Phytostabilization of Tannery Contaminated Soil: A Dynamic Approach. KnE Life Sci. 2018, 17, 10–18. [Google Scholar]
  49. Al-Farraj, A.; Al-Wabel, M. Heavy metals accumulation of some plant species grown on mining area at Mahad AD’Dahab, Saudi Arabia. J. Appl. Sci. 2007, 7, 1170–1175. [Google Scholar] [CrossRef] [Green Version]
  50. Al-Qahtani, K.M. Assessment of heavy metals accumulation in native plant species from soils contaminated in Riyadh City, Saudi Arabia. Life Sci. J. 2012, 9, 384–392. [Google Scholar]
  51. Kabata-Pendias, A. Behavioural properties of trace metals in soils. Appl. Geochem. 1993, 8, 3–9. [Google Scholar] [CrossRef]
  52. Ul Islam, E.; Yang, X.-E.; He, Z.-L.; Mahmood, Q. Assessing potential dietary toxicity of heavy metals in selected vegetables and food crops. J. Zhejiang Univ. Sci. B 2007, 8, 1–13. [Google Scholar] [CrossRef] [PubMed] [Green Version]
  53. Hakanson, L. An ecological risk index for aquatic pollution control. A sedimentological approach. Water Res. 1980, 14, 975–1001. [Google Scholar] [CrossRef]
  54. Dubey, M.; Ujjania, N. Heavy metal contamination and pollution load index in estuarine environment of Tapi river, India. Asian Journal of Microbiology, Biotechnology and Environmental Sciences. Asian J. Microbiol. Biotechnol. Environ. Sci. 2021, 23, 456–459. [Google Scholar]
  55. Hasnaoui, S.E.; Fahr, M.; Keller, C.; Levard, C.; Angeletti, B.; Chaurand, P.; Triqui, Z.E.A.; Guedira, A.; Rhazi, L.; Colin, F. Screening of native plants growing on a Pb/Zn mining area in eastern Morocco: Perspectives for phytoremediation. Plants 2020, 9, 1458. [Google Scholar] [CrossRef]
  56. Bose, S.; Vedamati, J.; Rai, V.; Ramanathan, A. Metal uptake and transport by Tyaha angustata L. grown on metal contaminated waste amended soil: An implication of phytoremediation. Geoderma 2008, 145, 136–142. [Google Scholar] [CrossRef]
  57. Alyemeni, M.N.; Almohisen, I.A. Traffic and industrial activities around Riyadh cause the accumulation of heavy metals in legumes: A case study. Saudi J. Biol. Sci. 2014, 21, 167–172. [Google Scholar] [CrossRef] [PubMed] [Green Version]
  58. Apeagyei, E.; Bank, M.S.; Spengler, J.D. Distribution of heavy metals in road dust along an urban-rural gradient in Massachusetts. Atmos. Environ. 2011, 45, 2310–2323. [Google Scholar] [CrossRef]
  59. Modrzewska, B.; Wyszkowski, M. Trace metals content in soils along the state road 51 (northeastern Poland). Environ. Monit. Assess. 2014, 186, 2589–2597. [Google Scholar] [CrossRef] [Green Version]
  60. Soltani, N.; Keshavarzi, B.; Moore, F.; Tavakol, T.; Lahijanzadeh, A.R.; Jaafarzadeh, N.; Kermani, M. Ecological and human health hazards of heavy metals and polycyclic aromatic hydrocarbons (PAHs) in road dust of Isfahan metropolis, Iran. Sci. Total Environ. 2015, 505, 712–723. [Google Scholar] [CrossRef]
  61. Trujillo-González, J.M.; Torres-Mora, M.A.; Keesstra, S.; Brevik, E.C.; Jiménez-Ballesta, R. Heavy metal accumulation related to population density in road dust samples taken from urban sites under different land uses. Sci. Total Environ. 2016, 553, 636–642. [Google Scholar] [CrossRef]
  62. Suzuki, K.; Yabuki, T.; Ono, Y. Roadside Rhododendron pulchrum leaves as bioindicators of heavy metal pollution in traffic areas of Okayama, Japan. Environ. Monit. Assess. 2009, 149, 133–141. [Google Scholar] [CrossRef]
  63. Monaci, F.; Moni, F.; Lanciotti, E.; Grechi, D.; Bargagli, R. Biomonitoring of airborne metals in urban environments: New tracers of vehicle emission, in place of lead. Environ. Pollut. 2000, 107, 321–327. [Google Scholar] [CrossRef]
  64. Pouyat, R.; McDonnell, M. Heavy metal accumulations in forest soils along an urban-rural gradient in southeastern New York, USA. Water Air Soil Pollut. 1991, 57, 797–807. [Google Scholar] [CrossRef]
  65. Shukla, S.K.; Singh, K.; Singh, B.; Gautam, N.N. Biomass productivity and nutrient availability of Cynodon dactylon (L.) Pers. growing on soils of different sodicity stress. Biomass Bioenergy 2011, 35, 3440–3447. [Google Scholar] [CrossRef]
  66. Greaney, K.M. An assessment of heavy metal contamination in the marine sediments of Las Perlas Archipelago, Gulf of Panama. Sch. Life Sci. Heriot-Watt Univ. Edinb. 2005, 5, 2–5. [Google Scholar]
  67. Yoo, M.S.; James, B.R. Zinc extractability as a function of pH in organic waste-amended soils. Soil Sci. 2002, 167, 246–259. [Google Scholar] [CrossRef]
  68. Ma, Z.; Chen, K.; Li, Z.; Bi, J.; Huang, L. Heavy metals in soils and road dusts in the mining areas of Western Suzhou, China: A preliminary identification of contaminated sites. J. Soils Sediments 2016, 16, 204–214. [Google Scholar] [CrossRef]
  69. Ghosh, M.; Singh, S. A review on phytoremediation of heavy metals and utilization of it’s by products. Asian J. Energy Environ. 2005, 6, 18. [Google Scholar]
  70. Byrne, P.; Wood, P.; Reid, I. The impairment of river systems by metal mine contamination: A review including remediation options. Crit. Rev. Environ. Sci. Technol. 2012, 42, 2017–2077. [Google Scholar] [CrossRef]
  71. Pietrzykowski, M.; Antonkiewicz, J.; Gruba, P.; Pająk, M. Content of Zn, Cd and Pb in purple moor-grass in soils heavily contaminated with heavy metals around a zinc and lead ore tailing landfill. Open Chem. 2018, 16, 1143–1152. [Google Scholar] [CrossRef]
  72. Séleck, M.; Bizoux, J.-P.; Colinet, G.; Faucon, M.-P.; Guillaume, A.; Meerts, P.; Piqueray, J.; Mahy, G. Chemical soil factors influencing plant assemblages along copper-cobalt gradients: Implications for conservation and restoration. Plant Soil 2013, 373, 455–469. [Google Scholar] [CrossRef] [Green Version]
  73. Allen, S. Chemical Analysis of Ecological Materials, 2nd ed.; Blackwell: Oxford, UK, 1989. [Google Scholar]
  74. Ghaderian, S.M.; Ravandi, A.A.G. Accumulation of copper and other heavy metals by plants growing on Sarcheshmeh copper mining area, Iran. J. Geochem. Explor. 2012, 123, 25–32. [Google Scholar] [CrossRef]
  75. Borkert, C.; Cox, F.; Tucker, M. Zinc and copper toxicity in peanut, soybean, rice, and corn in soil mixtures. Commun. Soil Sci. Plant Anal. 1998, 29, 2991–3005. [Google Scholar] [CrossRef]
  76. Degryse, F.; Smolders, E. Mobility of Cd and Zn in polluted and unpolluted Spodosols. Eur. J. Soil Sci. 2006, 57, 122–133. [Google Scholar] [CrossRef] [Green Version]
  77. Fageria, N. The Use of Nutrients in Crop Plants; CRC Press, Taylor and Francis Group: London, UK, 2009. [Google Scholar]
  78. Nazir, R.; Khan, M.; Masab, M.; Rehman, H.U.; Rauf, N.U.; Shahab, S.; Ameer, N.; Sajed, M.; Ullah, M.; Rafeeq, M. Accumulation of heavy metals (Ni, Cu, Cd, Cr, Pb, Zn, Fe) in the soil, water and plants and analysis of physico-chemical parameters of soil and water collected from Tanda Dam Kohat. J. Pharm. Sci. Res. 2015, 7, 89. [Google Scholar]
  79. Mubeen, H.; Naeem, I.; Taskeen, A. Phytoremediation of Cu (II) by Calotropis procera roots. N. Y. Sci. J. 2010, 3, 1–5. [Google Scholar]
  80. Lombi, E.; Tearall, K.L.; Howarth, J.R.; Zhao, F.-J.; Hawkesford, M.J.; McGrath, S.P. Influence of iron status on cadmium and zinc uptake by different ecotypes of the hyperaccumulator Thlaspi caerulescens. Plant. Physiol. 2002, 128, 1359–1367. [Google Scholar] [CrossRef] [Green Version]
  81. Mejáre, M.; Bülow, L. Metal-binding proteins and peptides in bioremediation and phytoremediation of heavy metals. Trends Biotechnol. 2001, 19, 67–73. [Google Scholar] [CrossRef]
  82. Bi, X.; Ren, L.; Gong, M.; He, Y.; Wang, L.; Ma, Z. Transfer of cadmium and lead from soil to mangoes in an uncontaminated area, Hainan Island, China. Geoderma 2010, 155, 115–120. [Google Scholar] [CrossRef]
  83. Ratko, K.; Snežana, B.; Dragica, O.-P.; Ivana, B.; Nada, D. Assessment of heavy metal content in soil and grasslands in national park of the lake plateau of the NP “Durmitor” Montenegro. Afr. J. Biotechnol. 2011, 10, 5157–5165. [Google Scholar]
  84. Xiao, R.; Bai, J.; Zhang, H.; Gao, H.; Liu, X.; Wilkes, A. Changes of P, Ca, Al and Fe contents in fringe marshes along a pedogenic chronosequence in the Pearl River estuary, South China. Cont. Shelf Res. 2011, 31, 739–747. [Google Scholar] [CrossRef]
  85. Sheoran, V.; Sheoran, A.; Poonia, P. Role of hyperaccumulators in phytoextraction of metals from contaminated mining sites: A review. Crit. Rev. Environ. Sci. Technol. 2010, 41, 168–214. [Google Scholar] [CrossRef]
  86. Fitz, W.J.; Wenzel, W.W. Arsenic transformations in the soil–rhizosphere–plant system: Fundamentals and potential application to phytoremediation. J. Biotechnol. 2002, 99, 259–278. [Google Scholar] [CrossRef]
  87. Galal, T.M.; Shehata, H.S. Bioaccumulation and translocation of heavy metals by Plantago major L. grown in contaminated soils under the effect of traffic pollution. Ecol. Indic. 2015, 48, 244–251. [Google Scholar] [CrossRef]
  88. ZU, Y.-q. Hyperaccumulator of Pb, Zn, and Cd in herbaceous grown on lead-zinc mining area in Yunnan, China. Environ. Int. 2005, 31, 755–762. [Google Scholar]
  89. Waleed, J. Response of Calotropis procera for urban, suburban and sewage pollution. Umm. Al-Qura. Univ. J. Sci. Med. Eng. 2006, 18, 31–40. [Google Scholar]
  90. Sulaiman, F.R.; Hamzah, H.A. Heavy metals accumulation in suburban roadside plants of a tropical area (Jengka, Malaysia). Ecol. Process. 2018, 7, 1–11. [Google Scholar] [CrossRef]
  91. Bonanno, G.; Giudice, R.L. Heavy metal bioaccumulation by the organs of Phragmites australis (common reed) and their potential use as contamination indicators. Ecol. Indic. 2010, 10, 639–645. [Google Scholar] [CrossRef]
  92. Zarcinas, B.A.; Ishak, C.F.; McLaughlin, M.J.; Cozens, G. Heavy metals in soils and crops in Southeast Asia. Environ. Geochem. Health 2004, 26, 343–357. [Google Scholar] [CrossRef]
  93. Juen, L.L.; Aris, A.Z.; Ying, L.W.; Haris, H. Bioconcentration and translocation efficiency of metals in paddy (Oryza sativa): A case study from Alor Setar, Kedah, Malaysia. Sains Malays. 2014, 43, 521–528. [Google Scholar]
  94. Bešter, P.K.; Lobnik, F.; Eržen, I.; Kastelec, D.; Zupan, M. Prediction of cadmium concentration in selected home-produced vegetables. Ecotoxicol. Environ. Saf. 2013, 96, 182–190. [Google Scholar] [CrossRef]
Figure 1. Map of study area with sampling points in Khyber Pakhtunkhwa, Pakistan. Note: PES (Peshawar Motorway), MBP (Mardan bypass), TEA (Teera adda), HAM (Hazara Motorway), MAN (Mansehra), AMG (Amaan Ghara), ROC (Robina clinic), YAH (Yar hussin), KHA (Khyber Agency), SHA (Shangla), PAG (Pakhtun Ghari), NAK (Nakot), SHI (Shinkyari), GUA (Gulabad), BAD (Badwan).
Applsci 12 01003 g001
Figure 2. Cluster dendrogram establishing three major groups of contaminated sites based on soil pollution index (SPI).
Applsci 12 01003 g002
Figure 3. Correlation plot showing association between species diversity indices and HMs accumulation in soil and plants of the study area. Note: The colour represents the degree of pairwise correlation with regards to the Pearson correlation coefficient, P (plant): S (soil).
Applsci 12 01003 g003
Figure 4. PCA-biplot of 15 contaminated sites superimposed with the corresponding influencing factors.
Applsci 12 01003 g004
Table 1. ANOVA following Bonferroni post-hoc test.
HabitatsStandsSites CodesSPI Mean ± SECV (%)
Road side1, 4, 2, 3PES, HAM, MBP, TEA1.83 ± 0.27 a30.42
Urban5, 6, 7, 8, 10, 9, 11MAN, AMG, ROC, YAH, KHA, SHA, PAG1.12 ± 0.14 b34.96
Rural12, 13, 14, 15NAK, SHI, GUA, BAD0.86 ± 0.10 b29.71
F-value--6.8426-
p-value--0.0093-
Note: SPI (soil pollution index); site codes are same as that in Figure 2. Different superscript letters (a, b) represents significant variations between groups.
Table 2. Physiochemical properties of soil samples among different groups following Bonferroni post-hoc test.
FactorsRoadsideUrbanRuralF-Valuep-Value
Clay %32.50 ± 3.58 a32.112 ± 2.35 a32.89 ± 3.23 a1.590.24
Silt %31.54 ± 2.45 a30.73 ± 2.03 a33.86 ± 2.65 b6.040.0153 **
Sand %35.76 ± 3.09 a37.156 ± 2.38 ab33.23 ± 2.29 b6.620.0115 **
pH (1:5)6.925 ± 0.110 a6.895 ± 0.101 a6.60 ± 0.18 a0.530.60
OM %0.710 ± 0.12 a1.188 ± 0.19 b0.719 ± 0.149 ab0.890.43
EC (dS m−1)275.79 ± 29.91 a256.85 ± 13.56 b276.68 ± 35.84 ab0.490.62
P (mg kg−1)4.12 ± 0.35 a4.72 ± 0.29 ab4.22 ± 0.26 a0.490.62
K (mg kg−1)93.25 ± 11.07 a84.55 ± 6.82 a97.72 ± 11.89 ab2.420.13
Lime %8.96 ± 0.77 a7.39 ± 0.73 ab8.02 ± 1.02 ab2.990.09
N %0.107 ± 0.034 a0.142 ± 0.03 ab0.060 ± 0.02 c1.220.33
AW %0.129 ± 0.004 a0.128 ± 0.004 a0.13 ± 0.006 b7.930.006 **
Biomass (g)98.18 ± 16.97 a78.21 ± 14.58 b71.44 ± 28.12 bc2.110.16
Rs7.5 ± 1.5 a6.42 ± 0.36 ba5.75 ± 0.36 b2.540.12
H′2.13 ± 0.06 a1.82 ± 0.04 b1.38 ± 0.00 b2.930.05
Eh0.955 ± 0.01 a0.904 ± 0.004 ab0.943 ± 0.01 a0.990.39
Note: The data shows the mean and standard deviation from studied areas. Different superscript letters a, b, c (within each group) show a significant difference among the group (p < 0.05, LSD test). ** p < 0.01, OM (organic matter), EC (electrical conductivity), P (phosphorus), K (potassium), N (nitrogen), AW (available water), Rs (species richness), H’ (Shannon index), Eh (evenness index).
Table 3. Analysis of HMs concentrations (mg kg−1) in soil and Calotropis procera plants from roadside, urban, and rural areas of the study area.
MetalsRoadsideUrbanRuralF-Valuep-ValueP.L
Cu (Soil)15.24 ± 0.96 a8.32 ± 0.42 b3.82 ± 0.37 c32.70921.38 × 10−5 ***8.39
Zn (Soil)32.18 ± 0.72 a21.25 ± 0.56 b10.26 ± 0.97 c23.42427.18 × 10−5 ***4.19
Pb (Soil)6.08 ± 0.34 a2.69 ± 0.24 b1.00 ± 0.06 b21.40557.21 × 10−5 ***8.15
Cd (Soil)3.69 ± 0.05 a1.79 ± 0.08 b0.90 ± 0.02 b25.81784.49 × 10−5 ***0.31
Cu (Plant)23.45 ± 0.60 a12.63 ± 0.55 b4.23 ± 0.66 c37.24957.12 × 10−5 ***10
Zn (Plant)103.70 ± 3.19 a60.08 ± 3.17 b26.15 ± 1.85 c18.50730.0002 **60
Pb (Plant)19.45 ± 0.68 a10.36 ± 0.89 b3.29 ± 0.50 c17.13350.0003 **5.0
Cd (Plant)2.275 ± 0.15 a1.103 ± 0.04 b1.46 ± 0.08 b7.94570.0063 **0.1
Note: ** p < 0.01, *** p < 0.001; P.L (permissible level); HMs concentration and P.L are measured in mg kg−1. Different superscript letters (a, b, c) represent significant variations between groups.
Table 4. Bioaccumulation factor of HMs from soil to root and soil to Calotropis procera intact-plant.
HMsBAF (S/R)F-Valuep-ValueBAF (S/P)F-Valuep-Value
RoadsideUrbanRuralRoadsideUrbanRural
Zn3.64 ± 0.07 a1.38 ± 0.07 a0.43 ± 0.06 a1.640.171.56 ± 0.08 b0.41 ± 0.05 b0.46 ± 0.04 a7.900.003 ***
Cu1.1 ± 0.14 a2.37 ± 0.03 a0.38 ± 0.03 a1.230.370.79 ± 0.06 a0.40 ± 0.03 b0.45 ± 0.02 a1.280.34
Pb1.83 ± 0.27 a0.71 ± 0.13 a1.75 ± 0.08 a0.490.680.62 ± 0.07 b0.55 ± 0.06 a0.99 ± 0.07 b4.860.02 *
Cd0.47 ± 0.05 a0.67 ± 0.07 a0.80 ± 0.07 a0.580.430.44 ± 0.04 a0.56 ± 0.03 b0.71 ± 0.05 b7.980.002 ***
Note: *** (p < 0.001), * (p < 0.05); different superscript letter (a, b) show significant differences; BAF (bioaccumulation factor); S/R (Soil to root); S/P (soil to whole plant tissue).
Table 5. Translocation factor (mobility potential) of HMs from below to aboveground structural parts in Calotropis procera among the groups. ANOVA analysis.
MetalZnF-Valuep-ValueCuF-Valuep-Value
RoadsideUrbanRuralRoadsideUrbanRural
TF (R-S)1.11 ± 0.07 a1.46 ± 0.53 b0.92 ± 0.28 c7.880.006 ***1.26 ± 0.15 a1.0 ± 0.12 b1.06 ± 0.25 b2.220.12
TF (S-L)1.43 ± 0.52 a1.52 ± 0.41 a1.26 ± 0.24 a0.560.61.10 ± 0.13 a1.46 ± 0.23 b1.1 ± 0.38 ab0.100.63
TF (L-F)0.80 ± 0.20 a0.56 ± 0.06 a0.68 ± 0.06 a2.940.02 *0.89 ± 0.13 a0.62 ± 0.11 a0.38 ± 0.07 a1.070.31
MetalPb Cd
TF (R-S)0.96 ± 0.05 a0.81 ± 0.14 b0.83 ± 0.15 b2.070.081.89 ± 0.13 a0.74 ± 0.18 a0.96 ± 0.14 a2.130.23
TF (S-L)1.04 ± 0.16 a1.10 ± 0.13 a1.10 ± 0.17 a1.080.532.70 ± 0.28 a1.34 ± 0.22 b1.04 ± 0.13 b0.560.57
TF (L-F)0.82 ± 0.17 a0.75 ± 0.07 a0.90 ± 0.17 a2.770.05 *0.56 ± 0.06 a1.0 ± 0.12 b0.80 ± 0.25 ab9.530.008 **
Note: * (p < 0.05), ** (p < 0.01), *** (p < 0.001); TF (translocation factor), R-S (root to stem), S-L (stem to leaf), L-F (leaf to flower), different superscript (significant difference).
Table 6. Summary statistics of PCA axis related with Calotropis procera.
AxisEigenvalue% of VarianceCum.% of Var.Broken-Stick Eigenvalue
17.53031.37531.3753.776
23.21613.40044.7752.776
32.84611.86056.6352.276
42.3409.75066.3861.943
51.7827.42673.8111.693
61.7307.20781.0181.493
71.3755.73086.7481.326
81.0744.47691.2241.183
90.7623.17494.3981.058
100.5512.29496.6920.947
110.4191.74498.4360.847
120.1800.75099.1850.756
130.1160.48299.6680.673
140.0800.332100.0000.596
Table 7. Comparison of metal concentration (mg kg−1) in soils and plants of the present study to other studies.
CountrySiteSoilPlantReference
CuCdPbZnCuCdPbZn
PakistanRoadside15.243.696.0832.1823.452.2719.45103.7Present study
Urban8.321.792.6921.2512.631.1010.3660.08Present study
Rural3.820.901.0010.264.231.463.2926.15Present study
QatarIndustrial area29.40.042.5ND57.30.41.6ND[30]
IndiaTannery contaminated site36.95ND16.00ND27.64ND10.84ND[48]
Control site11.12ND10.56ND13.95ND11.95ND
Saudi ArabiaRiyadh0.120.39NDND0.526.53NDND[9]
Gazan0.290.34NDND0.921.81NDND
EgyptResidential areas2.20.214.512.418.526.421.396.5[29]
Roadside2.60.270.026.616.922.270.0122.4
Fallow lands12.70.36.817.013.529.647.669.5
Railways60.34.822.4202.924.226.972.958.5
ControlND0.825.4NDND2.712.4ND[31]
RiverbankND1.426.4NDND3.832.5ND
IndiaRoadsideND1.530.6NDND3.645.5ND
IndustrialND2.8134NDND6.6135.7ND
ResidentialND2.034.4NDND4.847ND
Saudi ArabiaMining area483201056734.4ND15.383.3[49]
IndiaThermal power plant area2.620.052.824.65ND0.140.884.98[46]
Saudi ArabiaRiyadh801.0040.882049.041.58.8191.0[50]
PakistanM-2 PakistanND0.342.5796.82ND0.131.2446.34[47]
Faisalabad-Sarghoda roadND0.342.86114.0ND0.222.6147.68
ControlND0.0010.0030.49ND0.000.008.52
Permissible level 8.390.318.1544.1910.000.105.0060.00[4,51,52]
Note: ND = not detected; bold letters show higher concentration than permissible level.
Publisher’s Note: MDPI stays neutral with regard to jurisdictional claims in published maps and institutional affiliations.

