1. Introduction
The issue of monitoring the structural condition of bridges is becoming a top priority worldwide. As is well known, any infrastructure undergoes a progressive deterioration of its structural conditions due to aging by normal service loads and environmental conditions. At the same time, it may suffer serious damages or collapse due to natural phenomena, such as earthquakes or strong winds. For this reason, it is essential to rely on efficient and widespread monitoring techniques [
1] applied throughout the entire road network. Most of the literature concerning dynamic identification deals with the estimation of the modal parameters (frequencies, damping coefficients and mode shapes) of a structure, starting from the measurement of both the dynamic input and structural response signals. In the past, the dynamic identification of the modal characteristics of buildings was generally based on force vibration tests involving impact tests or other complex setups, applying several types of input exciters directly in situ [
2]. In this context, it is customary to refer to the modal analysis based on artificial forced excitation as Experimental Modal Analysis (EMA), which presupposes the use of both known input and structural response measurements to estimate modal parameters. However, EMA tests normally interfere with the operating condition of structures, and as a consequence, they may not be conducted routinely and economically. Therefore, in recent decades, dynamic tests based on ambient vibrations methods have rapidly gained ground, especially in the structural health monitoring (SHM) field, leading to the development of the Operational Modal Analysis (OMA) [
3,
4,
5] branch. Specifically, OMA is a class of procedures which pertains to the identification of the structural modal properties [
6,
7] based on vibration data collected when the structures are under their operating conditions [
8,
9]. Thus, these procedures are particularly attractive for civil engineers concerned with the safety of monitoring buildings and infrastructures, since no initial excitation or measured external excitation is required. OMA is the leading way for monitoring, as it is quick and cheap; however, since the external force is not recorded, the identification methods must be more sophisticated and based on stochastic mechanics [
10,
11,
12,
13].
Regarding the risk of corrosion of rebars in reinforced concrete structures, this represents one of the most serious degradation phenomena for all infrastructures [
14,
15]. In fact, if not diagnosed in time, properly monitored and effectively counteracted, it can lead to disastrous consequences on the safety of people and structures [
16,
17]. For this reason, international legislation has, for several decades, introduced reference standards and guidelines for assessing this risk, demanding, in this regard, compliance with the requirements for the durability of the structures. Indeed, a design necessity required by national and international design standards is the service life of a civil structure, that is to say the time, expressed as a duration, during which the structure must maintain the same safety requirements of the construction period without prejudice to normal maintenance activities [
18,
19]. However, in the absence of functional monitoring activity, ordinary and extraordinary maintenance interventions are implemented when the manifestations of degradation become conspicuous and are, consequently, in an almost irreversible phase [
20,
21]. An evaluation of the economic damage caused by supervisory negligence of the corrosion risk was conducted by Prof. De Sitter of the University of Eindhoven. In his report [
22], he constructs the cost curve relating to the maintenance of the works, denoting exponential growth in the costs of intervention and repairs of the works due to the lack or late maintenance. In particular, the “De Sitter’s Law of Fives” is summarized as follows: “Now think about that—a little extra investment early in the early aging of the structure will significantly reduce long term expenses. When maintenance is neglected, repairs, when they become essential, will generally equal five times maintenance costs. If repairs are not carried out, rehabilitation costs will be five times repair costs”. For the phenomenon of degradation due to corrosion of the reinforcement elements of the structures, chlorides and atmospheric CO2 are some of the major aggressive agents [
23,
24,
25]. In particular, the oxidation of metal reinforcements occurs under two conditions. On the one hand, when the pH is below a certain value (<pH 11), a phenomenon occurs when the concrete becomes carbonated [
26], and on the other hand, it occurs when the chlorides exceed a certain threshold concentration [
27].
Generally, the action of carbon dioxide basically consists of the neutralization of the lime by hydrolysis of the cement, with a consequent reduction in the initial alkalinity of the concrete (pH, approximately 12.5). Carbonated concrete, in fact, has a pH value of about 9.5, far below the critical value for maintaining the passive layer of the reinforcing rods. The destruction of the passivating protective film can also occur as a result of the attack of Cl- ions. The corrosion mechanism, in this case, is expressed in an incisive and localized manner (pitting), with a significant reduction in the resistant section of the reinforcements [
28].
In this context, the important link between research and high-level engineering applications is clear. Further, since the monitoring of the bridge is not only a matter of structural mechanical behavior, this paper aims at introducing an integrated procedure for structural and material monitoring.
Regarding structural monitoring, in this paper, an innovative procedure for monitoring based on Vehicle by Bridge Interaction (VBI) will be presented. The validity of this procedure has been investigated theoretically in recent studies for the first time [
29,
30]. In this context, the analysis is performed using a common vehicle, fully equipped with several accelerometers, to record the vertical accelerations of the test car while passing over the bridge. Specifically, both traditional monitoring techniques based on Operational Modal Analysis (OMA) identification methods and innovative ones based on the VBI have been applied on the same bridge near the city of Dubai. It should be noted that the latter approach is very competitive, since no equipment is required on the structure, but only a few sensors in the vehicle [
31]. Furthermore, thanks to the use of a limited number of sensors, it follows that the computational burden is significantly reduced if compared to semi-automated or automated methodologies [
32,
33]. The results of the preceding experimental tests suggest that a VBI approach used for monitoring purposes is particularly reliable for the identification of the first bridge’s frequency. These results were further supported by the traditional OMA test, conducted on the same bridge, which led to similar outcomes with acceptable discrepancies.
On the other hand, regarding both the concrete degradation and the corrosion risk, that is to say the material monitoring, a non-invasive method based on electrochemical sensors embedded in the concrete cover of the bridge’s structural elements is presented. This was carried out in order to measure pH and chlorides in structural concrete, to verify the state of the degradation and to evaluate the aging in a certain time frame. The proposed experimental method is based on the measurement of the electrode potential of a 1-mm-diameter sensor inserted into the concrete during the casting or post-jet phase. The electrode potential can be measured using two types of reference electrodes, with liquid junction or in a solid state. This method offers the advantage of achieving a predictive diagnosis of deterioration and an accurate estimate of the risk of corrosion of the reinforcement [
34]. Furthermore, a new, sulfate-selective electrode is currently under experimental study to validate its functionality, and its setup is introduced below. Finally, an automatic data transmission system based on GSM technology has been used to achieve continuous updates on the chemical–physical parameters in those cases of hardly accessible points of the structure.
Actually, these studies have been developed in two different bridges in Dubai due to logistical problems. However, this situation does not decrease the efficiency of either method applied separately; on the contrary, it displays a strong image if they are applied to the same bridge.
Unfortunately, the authors did not have the aforementioned opportunity. Since the obtained results were not used for cross-information, but were complementary, the authors proposed an integrated procedure for bridge monitoring and damage detection with the purpose of setting up a smart structure, through the sensors in the bridge as well as the sensors in the vehicles passing on it, to predict even ab initio damage, with knowledge of the degradation condition of the materials of the bridge and the change of its dynamic parameters. In this way, it should be possible to develop a SHM-based procedure which takes into account different parameters of the structure and their evolution in time.
Finally, it is important to underline that the main achievement of the integrated approach proposed herein is to monitor the bridges in a continuous way, providing a reliable and competitive SHM method in terms of cost and ease of execution. In this regard, it is crucial to determine the changes in time of the bridge frequencies, the modal parameter on which this article is focused. This is because these shifts are strictly linked to the stiffness changes; therefore, they are a good indicator of the damage occurring in the structure. Furthermore, understanding the variation in the strength of the concrete is fundamental if the structure is always in safe conditions, considering all the active loads.
2. Experimental Tests for the Dynamic Identification of a Bridge
Based on previous theoretical considerations, with the aim of testing the reliability of the proposed integrated approach, a large experimental investigation was conducted over a bridge in the city of Dubai (UAE). Specifically, a full SHM procedure based on OMA was performed to identify the modal parameters of the bridge—in particular, its main natural frequencies. Afterwards, these results were taken as a reliable benchmark to validate the VBI-based approach which was later tested.
2.1. Bridge Monitored
Interchange 12 (
Figure 1), a bridge of the highway E88 in the Emirate of Ajman (on the east side of the city of Dubai, UAE), was selected for the tests based on VBI.
The structure is a three-span reinforced concrete bridge with two internal supports while both ends of the bridge are simply supported. The central span is 8 m high, and the adjacent ones are 30 m long and 15 m long, respectively, for a total length of 60 m (
Figure 2).
Furthermore, a trellis system, consisting of 4 longitudinal beams connected by 13 transverse beams, supports a 7-m-wide roadway, together with two cantilevered sidewalks of 200 cm.
2.2. OMA Test
In this section, the experimental results of the identification of the structural dynamic parameters of the bridge “Interchange 12” are reported.
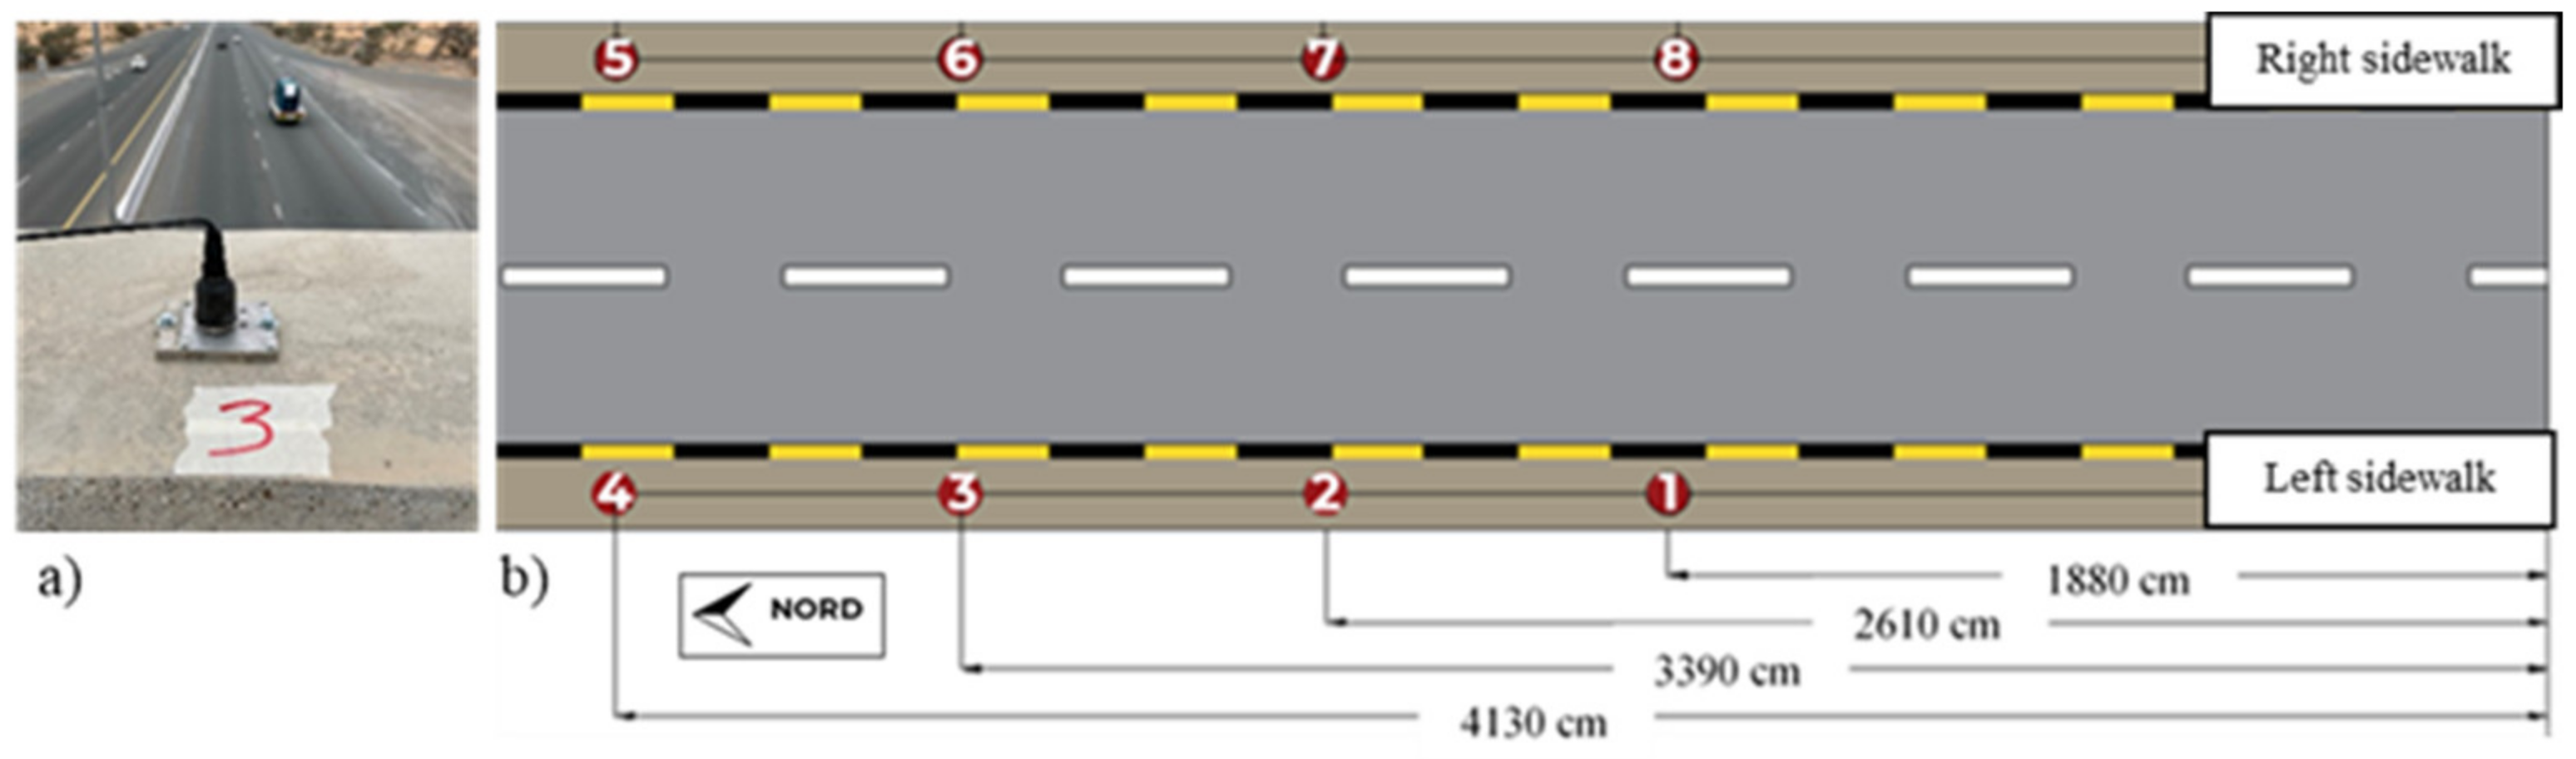
As already mentioned, with the aim of validating the proposed approach, a preliminary traditional OMA identification was performed. Using various accelerometers directly positioned over the bridge, the main frequencies of the structure were obtained. Specifically, eight high-sensitivity piezoelectric mono-axial accelerometers (PCB 393A03), were chosen to record the response of the bridge acquiring the vertical acceleration at various points of the structure. Further, all of the sensors were connected to the QuantumX MX840 module from HBM, which acquired the signal with a sampling rate of 600 Hz. Then, four accelerometers were symmetrically positioned according to the bridge’s structural configuration, in the main span, and the other two were placed on each secondary span (see
Figure 3).
Data from the eight accelerometers were acquired and processed in the MATLAB environment. In particular, several tests were performed with the bridge under ambient vibrations for a total duration of 31 min. In order to investigate the bridge’s response under various load cases, which determines the different levels of structural excitation, the acquisitions were carried out in three different cases:
- -
Case 1: regular vehicular traffic;
- -
Case 2: heavy vehicular traffic;
- -
Case 3: heavy vehicular traffic introducing a speed bump on the deck.
Specifically, in Case 1, two ordinary cars made repeated passages on the bridge during the acquisitions. In Case 2, two vans were used to simulate a heavier vehicular traffic condition. Furthermore, the speed bump adopted in Case 3 makes the increase of the stress level possible, thanks to the impulsive load generated through the numerous passages of heavy vehicles over it. It should be noticed that, in all the three cases, an additional noise component is always present, and is given by traffic on the motorway below the bridge.
Once the signals were acquired, a band-pass filter was used, choosing a band of frequencies between 0.2 Hz and 40 Hz. Then, the respective PSD functions were determined, following the Welch’s Method [
35], by partitioning the signal recorded into 186 sub-signals of 10 s. Finally, a Hanning window was employed, with an overlap of 50% between the segments.
The results are reported in
Figure 4,
Figure 5 and
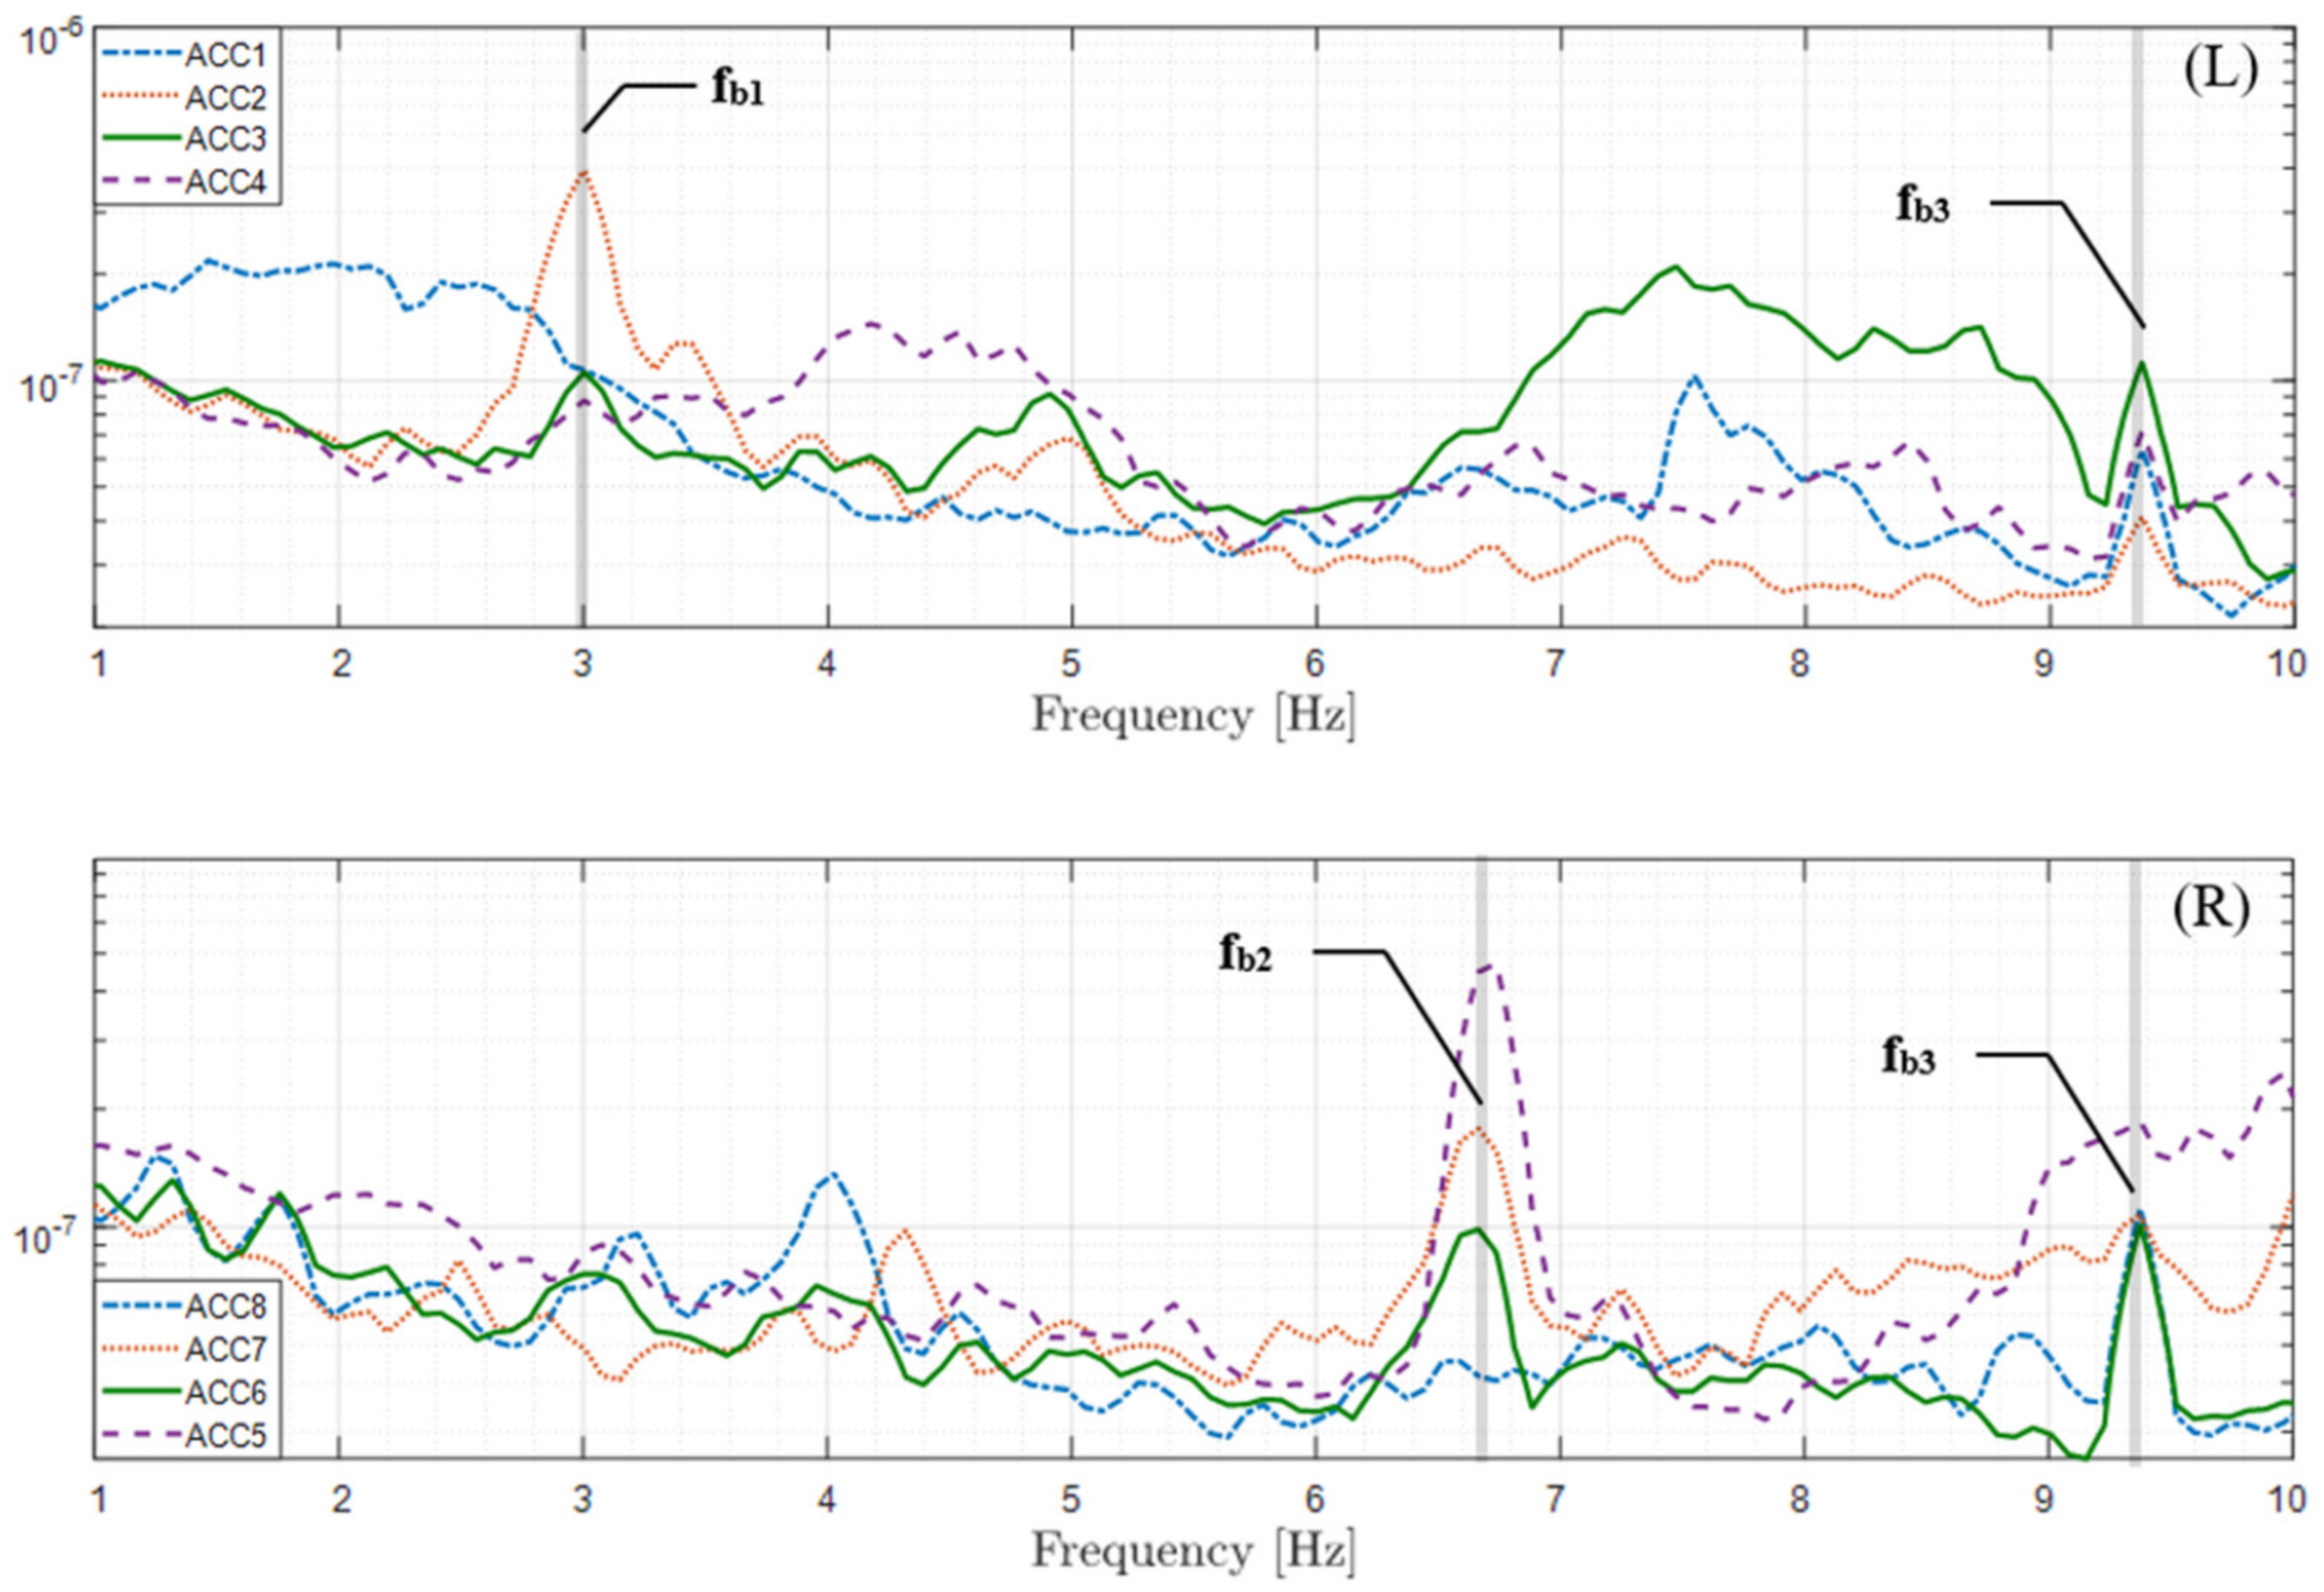
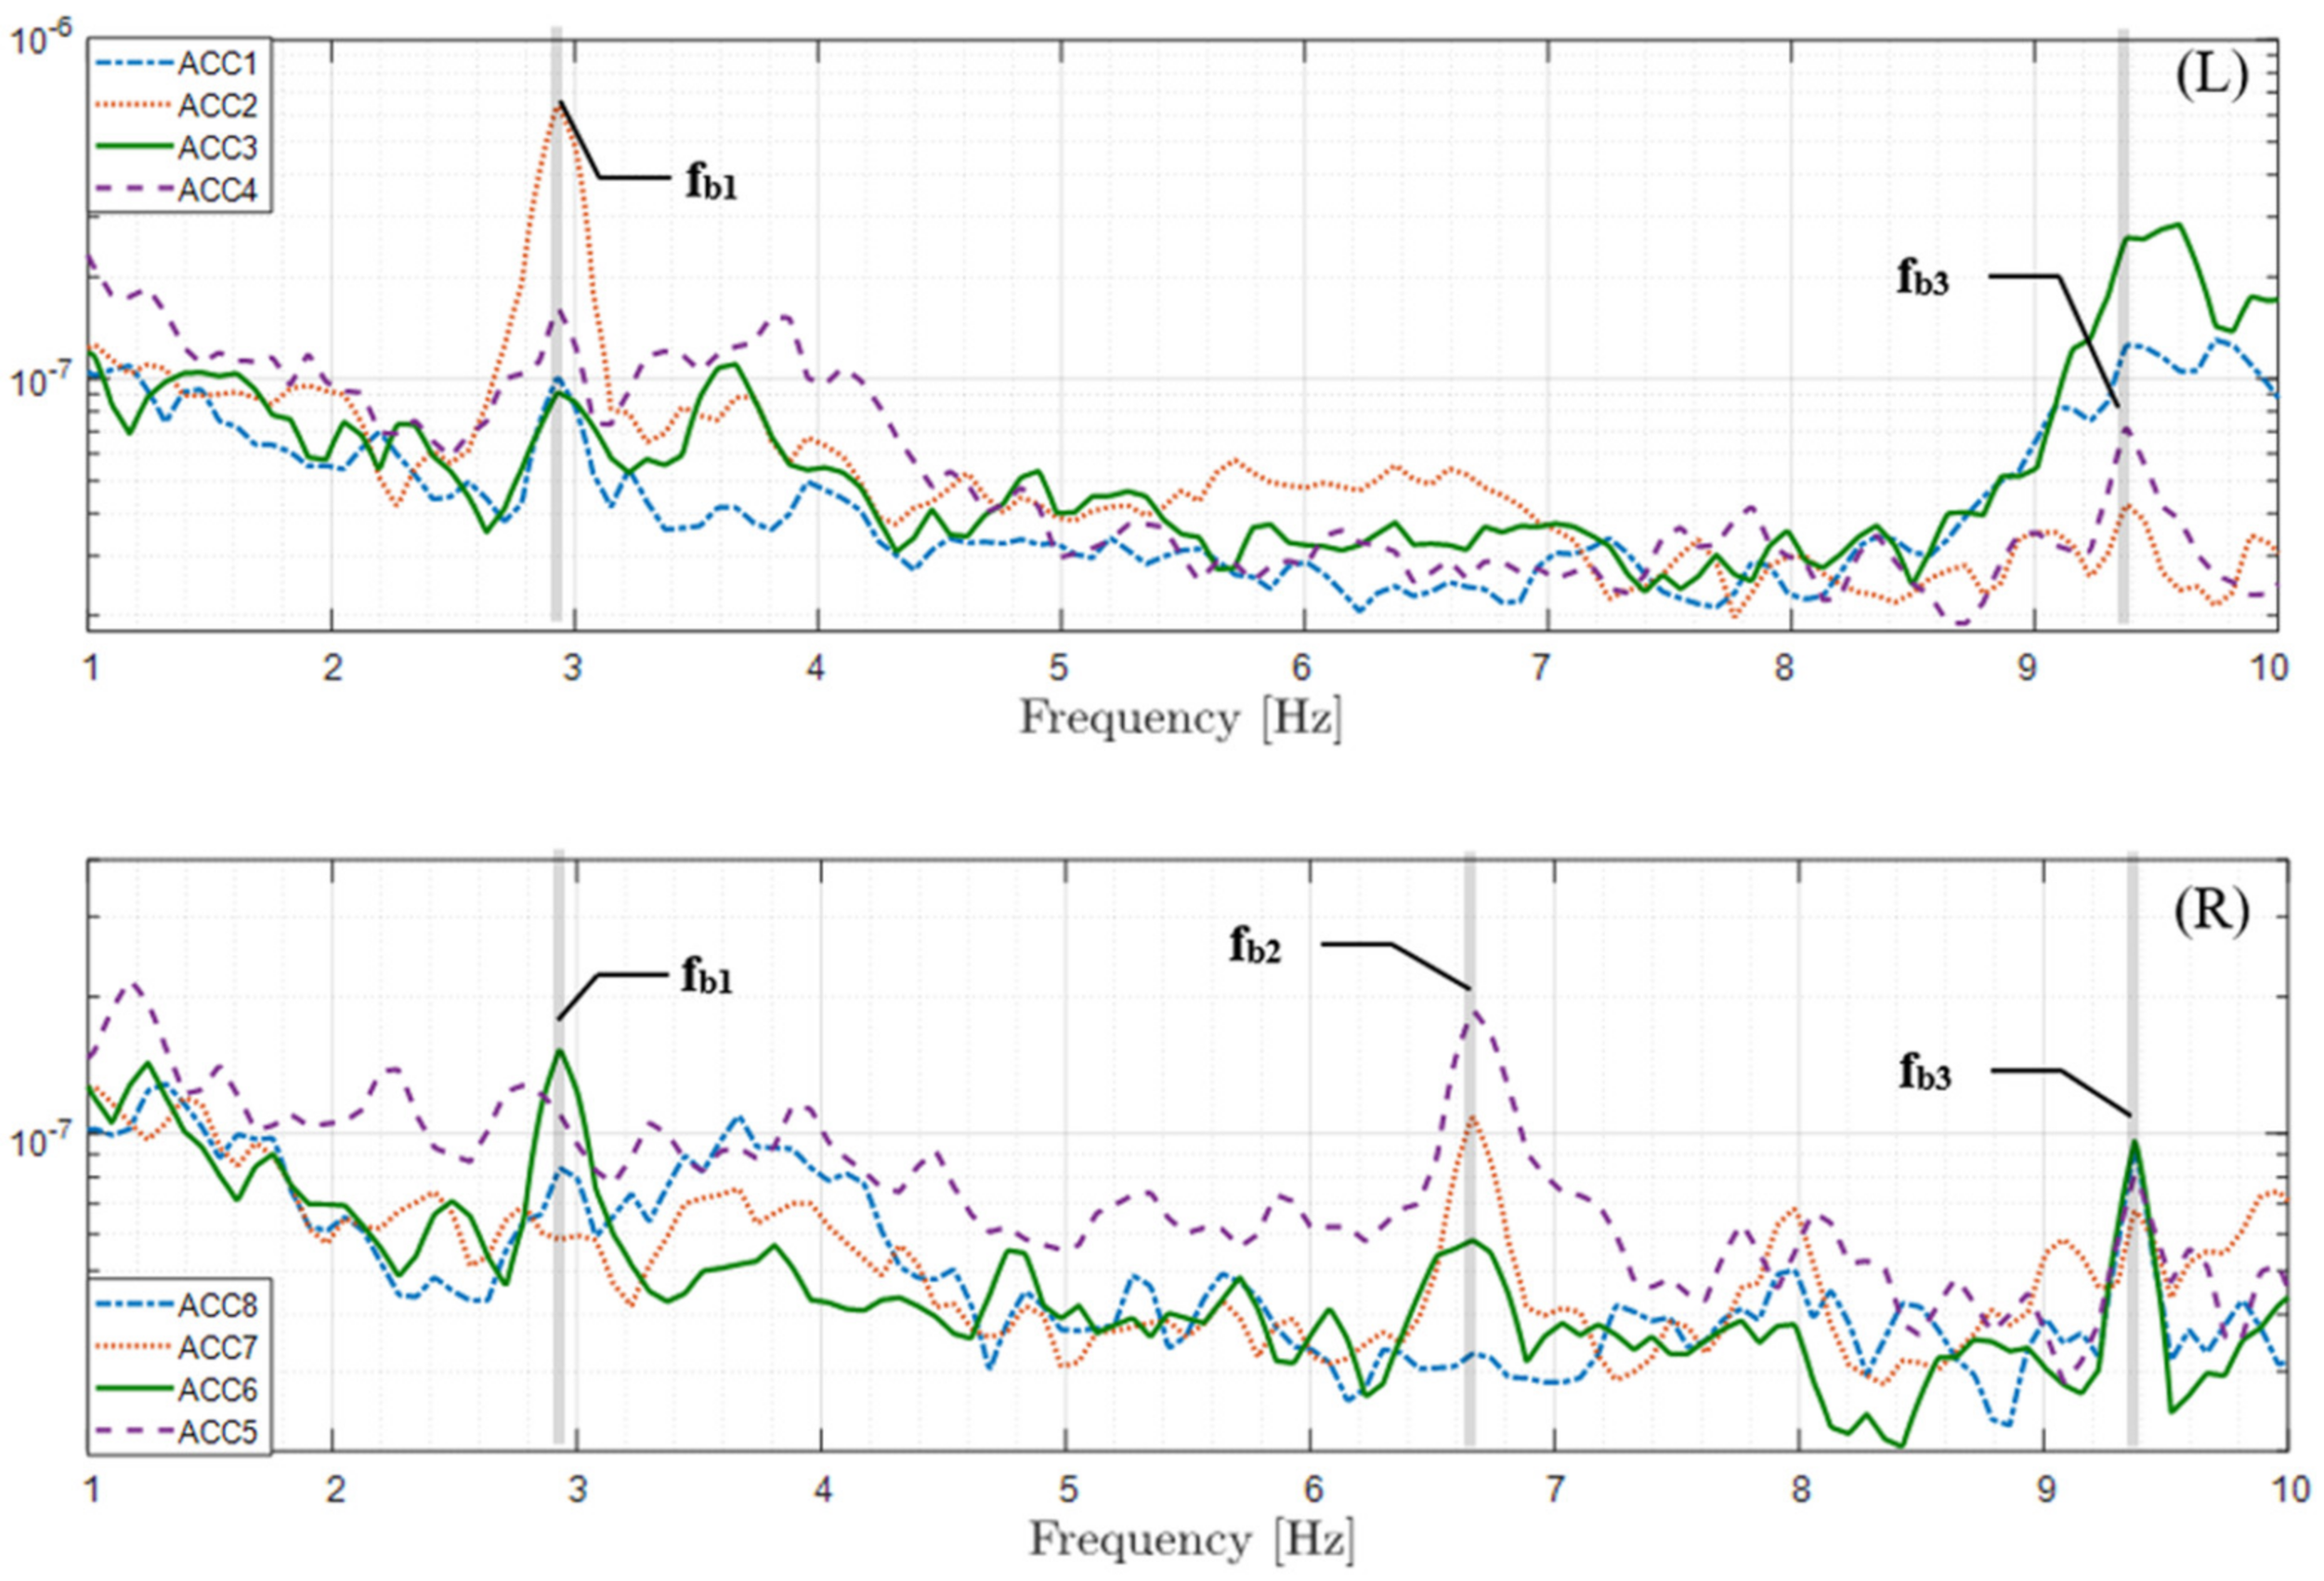
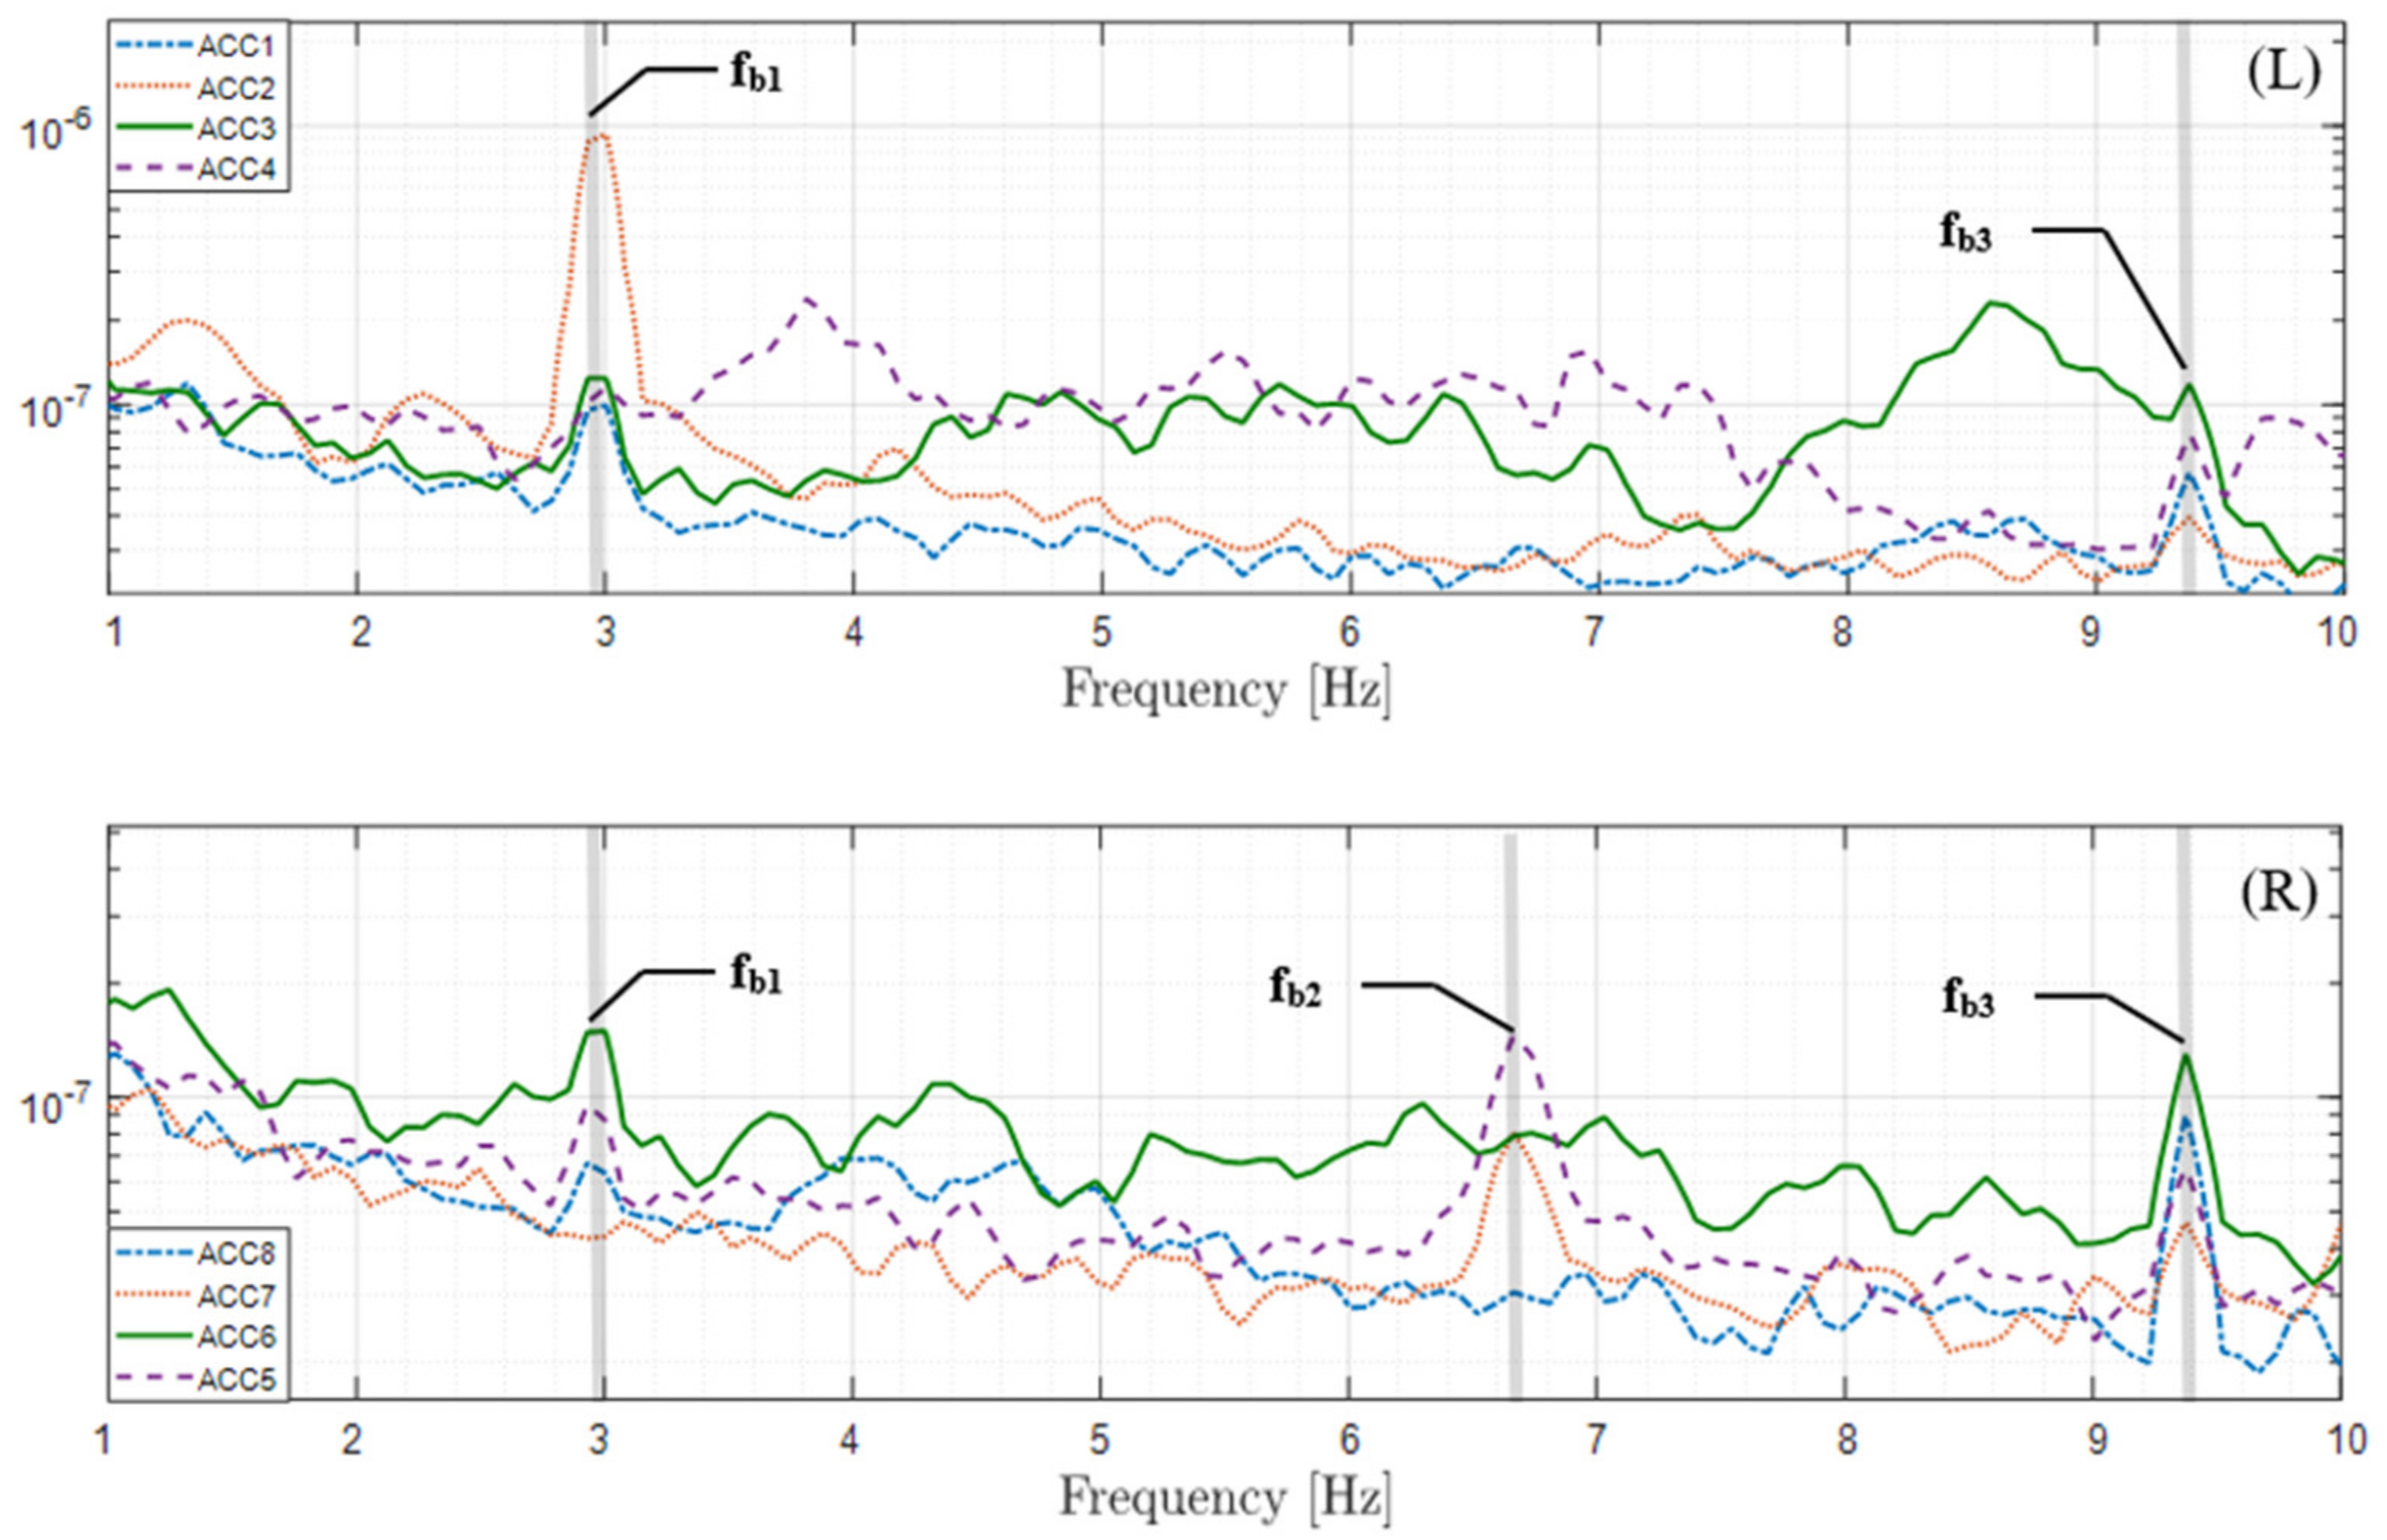
Figure 6. They are organized by separately showing the PSDs obtained from the data acquired through the accelerometers 1–4, positioned on the left sidewalk, and those positioned on the other sidewalk, namely accelerometers 5–8.
Figure 4,
Figure 5 and
Figure 6, as well as
Table 1, show that the frequencies obtained in the three cases are consistent with each other. Specifically, the first frequency, at 3.0 Hz, can clearly be detected in all cases, with the largest discrepancy of 0.07 Hz occurring between Case 3 and Case 2. Moreover, the second frequency
fb2 is clearly identified only through the data acquired by the accelerometers placed on the right sidewalk. This difference may be due to the correspondence of a torsional mode at this frequency. Finally, another frequency, referred to as
fb3, is detectable at 9.4 Hz. It is worth to notice that, in this case, the discrepancies related to all cases are negligible.
Starting with these considerations, it is possible to assume that the first frequency of the bridge is 3.0 Hz, while the other structural frequencies are 6.7 Hz and 9.4 Hz.
2.3. VBI Test
With the aim of identifying the main frequencies of the aforementioned bridge (Interchange 12) in a cost-effective way, the proposed VBI-based identification procedure was experimentally investigated. As far as the acquisition system is concerned, a single piezoelectric accelerometer was used to record the vertical acceleration of a car moving over the structure several times. The vehicle used for this test is a Tesla model 3 2021 edition, as shown in
Figure 7.
The rationale behind this choice is to avoid acquiring random vibrations due to the internal combustion engine. In this regard, the difference in noise between the two engines (the internal combustion engine, that is to say, the traditional one, and the electric engine) is reported in
Figure 8. Specifically, the comparison was carried out using a hybrid vehicle in which the two engines were both present.
However, the decision of an electric vehicle is also justified considering the spread of electric as well as hybrid cars occurring in recent years. Hence, these kinds of vehicles are expected to be the most widely used, and, therefore, may be employed for this type of monitoring. Moreover, it should be noted that, according to the up-to-date literature, electric cars have never been used in experimental tests regarding a VBI-based technique.
Further, piezoelectric accelerometer PCB-models 393B04, whose characteristics are listed in
Table 2, was chosen to record the vehicle’s vertical acceleration. This sensor, in particular, presents crucial characteristics for the purpose of the study, such as a high sensitivity, a low weight, a wide band of frequencies and a compact size. To give it a direct connection with the car’s chassis, it was positioned over one of the right front seat guides. Furthermore, a signal conditioner (PCB 485B39) was used to connect the sensor to the PC and to make the signal digital. Finally, the signal was recorded using Spectraplus software, with a sampling rate of 4000 Hz.
2.3.1. Identification of the Vehicle Frequencies
A preliminary phase of the tests concerns the identification of the instrumented vehicle frequencies in order to distinguish these from those of the bridge [
36]. The test was carried out on a flat, straight road, driving for approximately 130 s with a variable speed between 5 and 30 km/h. The data acquired were, therefore, analyzed using an algorithm based on the Matlab environment. Notably, a band-pass filter, excluding frequencies outside the frequency range 0.5 and 30 Hz, was applied to the response acquired. Then, starting from that acquisition, the PSD function was determined by following the Welch method, dividing the whole recording in a set of 10-s segments and using a Hanning window with a 50% overlap between the sub-signals. Consequently,
Figure 9 shows the PSD function, obtained in accordance with the above, of the vehicle response.
In particular, two vehicle frequencies can be detected in the PSD function, namely
and
. As known, a car is a complex system from a mechanical point of view, and consequently, many frequencies characterize it [
37]. Furthermore, several factors influence its behavior during the motion. The rocking phenomenon is one of the main motions, and this is caused by the condition of the road surface, which differently stresses the four wheels [
38]. Specifically, a corresponding rocking mode is associated with this phenomenon. This mode, together with the vertical and lateral ones, characterize the dynamic behavior of the vehicle.
2.3.2. Experimental Tests on the Bridge and Data Analysis
To demonstrate the reliability of the technique proposed regarding the modal identification of a bridge, many tests were carried out on a real structure. Specifically, 20 passages, 10 for each direction of travel, at 5 km/h were pursued with the instrumented vehicle, with an almost total absence of traffic. Every signal recorded, about 20-s long, was analyzed in the frequency domain in Matlab environment and processed as follows:
Every signal collected was manipulated with a band-pass filter with a band of frequencies of 0.5–30 Hz, and a detrend procedure was also carried out.
A Tukey window function was applied with a length equal to that of the response acquired and the cosine fraction value was set to 0.9.
The auto PSDs of the windowed signals were determined using the standard Welch procedure. For the application of this procedure, the record was divided into two 10-s segments with an overlap of 50% between them.
The average of all PSDs was calculated, and the bridge frequencies were identified using a traditional peak-picking procedure.
According to the identification procedure just reported,
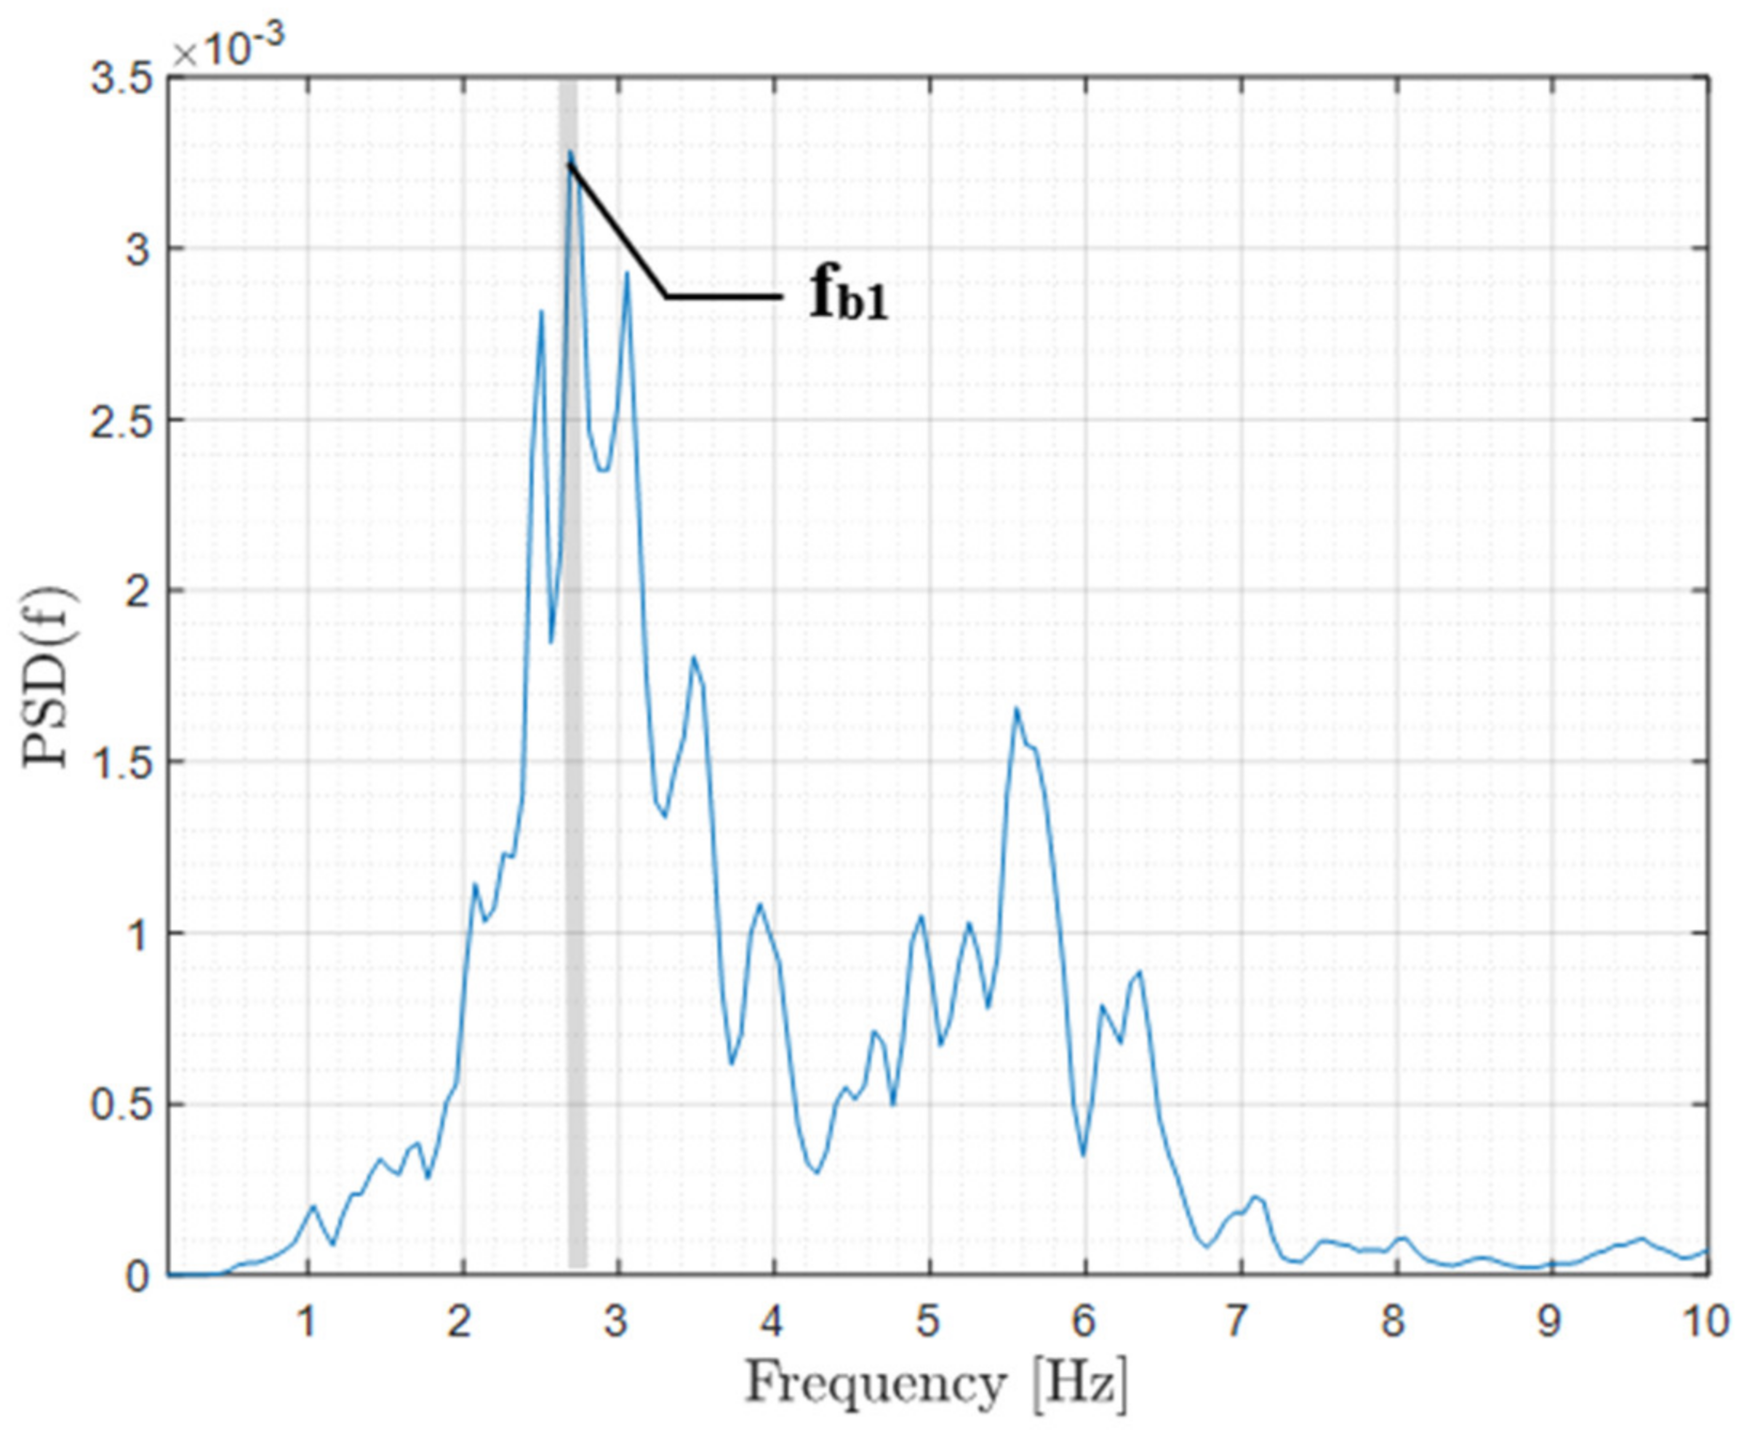
Figure 10 shows the outcome obtained as a result of the VBI-based test.
It should be noticed that the first peak of the PSD, namely , is very close to the first frequency identified by adopting the traditional OMA approach. Note that a discrepancy of 10% exists between the two values. This gap, although it is considerable, may be tolerable, because what matters in this approach is the detection of the change in the frequency values over a long period of time, not the exact values obtained using different SHM methods. In addition, another frequency is evident at about 5.6 Hz. This one, comparing the results with those obtained following the OMA method, could not be attributed to the bridge. Nevertheless, it should be important to stress that to identify even only the first frequency is a significant result for the preliminary method proposed herein, based on VBI.
3. Method Proposed for Corrosion Evaluation
As already mentioned, the method proposed herein allows for the detection of both pH and chloride ions concentration by measuring the potential difference between a 1-mm-diameter electrode used as sensor and embedded in the concrete, and an electrode used as a reference. The sensors can be inserted into the concrete, i.e., from 1 to 3 cm in depth, during the casting phase (pre-casting), or they can be placed directly into the concrete on existing structures. Regarding the measurements of the chlorides, the pertinent electrode is composed of a silver wire covered with an AgCl film. Furthermore, as for the pH measurements, an iridium wire coated with an oxide layer of iridium, obtained through a high-temperature oxidation process, is used as an electrode.
Potential data are translated into concentration data by performing a calibration, particularized for each sensor, resulting from laboratory tests with standards as a reference. The results, in terms of correlations of the sensor calibration, are fully consistent with the Nernst equation. It should be noted that the TEM detection and monitoring system, as well as all non-destructive diagnostic methods (CnD), should be considered additional and complementary to the analytical laboratory procedures, in compliance with a holistic methodological approach.
The physical principle of the sensors previously introduced is based on Nernst’s equation [
39]:
where
E is the electrode potential,
E0 is the standard potential,
R is the gas constant (J/mol*K),
T is the absolute temperature,
z is the number of exchanged electrons,
F is the Faraday constant,
ared is the activity of reduced species,
aox is the activity of oxidized species and
υi is the stoichiometric coefficient. Using the Cu/CuSO
4 electrode, potential values lower than 10 mV are expected if the environment of the concrete is kept alkaline. In the presence of carbonation phenomena, the potential fall could be even higher than 30 mV. During the installation and maintenance phase of the stations, tests needed to be carried out by analyzing the powders, in order to better determine the measurement uncertainty and verify the data’s reliability [
40].
A peculiar aspect of detection by sensors is that the measurement is carried out on the free ions present in the capillary pores of the concrete, while the analytical ones of the laboratory are conducted on the powders extracted from the concrete in place. The latter are affected by an intrinsic variability due to the different contributions of the individual components (aggregates and binder) [
41].
Furthermore, in order to assess the degree of corrosion and to estimate the damage of the structures (estimated service life), the gradient and the speed of variation of the measured parameters could be more useful than their analytical precision. Thus, continuous monitoring is necessary. The monitoring procedure involves the use of at least three sensors for detecting the chloride concentration, and as many sensors to measure the pH. All these sensors are placed inside the concrete cover at different depths (e.g., 1 cm, 2 cm, 3 cm), in order to estimate, in addition to the local chemical parameters, the speed of penetration of both chlorides and CO2.
Moreover, with the aim of evaluating concrete degradation by means of the sulfates, a new sensor was developed to monitor the concentration of sulfate ions in the concrete.
3.1. Laboratory Analysis on the Corrosion Detection
The sulfate-based electrode was built by electrochemical sulfation of a silver wire with a diameter of 0.6 mm. Complete sulfation of the wire surface was achieved by imposing a constant current density of 10 µA cm−2 for 24 h in 0.1 M sulfuric acid solution. The process was conducted in a two-electrode cell, where the silver wire acted as the working electrode and a platinum mesh as the counter electrode.
The sensor was tested in an aqueous solution at pH 12 (KOH), with different Na2SO4 concentrations, ranging from 0.2 to 1 M. The Open Circuit Potential (OCP) was measured in a two-electrode cell, where AgSO4 wire acted as the working electrode and Hg/HgO as the reference electrode. All electrochemical tests were conducted using three different electrodes obtained in the same conditions. In addition, OCP measurements at different sulfate concentrations were repeated three times for each electrode. All the electrochemical measurements were carried out using a Parstat mod 2273 potentiostat/galvanostatic.
The sensor was electrochemically characterized by OCP tests to assess its sensitivity to variations in sulfate concentration. The tests were carried out in alkaline to simulate a condition similar to concrete pH. The aqueous solution contained different concentrations of sulfate ions. Regarding the duration of the tests, 100 s was the time required for OCP value stabilization, and, for this reason, it was set as the duration of each test.
Figure 11A shows OCP measurements for a single electrode at different sulfate concentrations. These curves were used to construct the calibration line of the sensor. In particular, the value of stationary OCP of the electrode was reported in comparison with the concentration of sulfate ions present in the solution in
Figure 11A.
The aforementioned calibration line, together with the standard deviation related to each point, are reported in
Figure 11B. The very low standard deviation values led us to conclude that the sulfate sensor had excellent reproducibility. Specifically, the equation of the sensor calibration line was extrapolated by linear regression, and is given as:
where
b represents the slope of the curve, and
E0 is the intercept. The values of
b and
E0 are the averages of the values obtained from the tests performed using three different electrodes. These values are consistent with Nernstian behavior, and they are, therefore, a sign of good functioning of the sensor. These results, indeed, demonstrate the good sensitivity and reproducibility of the manufactured sensors.
However, the authors specify that research on sensor optimization for sulfates is still ongoing. In particular, the possibility to make the sensor directly selective for chloride ions will be investigated by surrounding the sensitive part with a solid-state membrane selective for sulfate ions, which can work inside the concrete. The membrane will consist of a homogeneous mixture of sulfides and sulfates concerning various metals, in order to obtain an ion-selective system for sulfate ions. Furthermore, a simpler system will be also tested, in which the sensing element of the sensor will be coated with montmorillonite. This mineral has the property of preventing the diffusion of chloride ions. Finally, both modified sensors will be tested both in liquid solution and inside concrete.
3.2. Experimental Tests Regarding the Corrosion Detection in a Bridge of The United Arab Emirates, UAE
To evaluate the reliability of the non-invasive method for the detection of the concrete degradation, the Ghalilah bridge was tested.
This bridge (
Figure 12), belonging to the highway E11 in the Emirate of Ras Al Khaima (on the north side of the city of Dubai, UAE), is a multi-span reinforced concrete bridge with five internal supports, while both ends of the bridge can be depicted as simply supported.
As can be seen in
Figure 13, each span, 9 m high, is approximately 11 m long, for a total length of 69 m.
Furthermore, a trellis system, consisting of five longitudinal transverse beams, supports a 9-m-wide roadway, including two cantilevered sidewalks of approximately 2 m.
Temlab stations (
Figure 14) are equipped with a local acquisition and processing system (Edge Computing) and data transmission via IOT protocols (such as MQTT and/or OPC-UA). The architecture of the platform makes managing both electrochemical and physical-mechanical sensor data (in static and/or dynamic mode) possible if the structure is properly instrumented, following the philosophy of the “Smart City” and the “Smart Road”.
Temlab, in collaboration with researchers from the University of Palermo and researchers from the Ministry of Energy Infrastructure of the United Arab Emirates (UAE), conducted a pilot project for the remote monitoring of the corrosion risk of the Wadi Ghalilah bridge. The monitoring station was equipped with three Cl and pH sensors, connected both to the copper sulfate counter electrode (liquid junction) and to the activated carbon pseudo-reference electrode.
Remote monitoring is facilitated by the use of a dashboard (
Figure 15), in this case, Grafana, which allows the user to view the values of the current parameters at a glance and to acquire the historical data. In addition, it is possible to set alarms when the threshold values, as determined by the user, are exceeded. In this regard,
Figure 16 shows the detection of the mV data of the sensors read by the Grafana software.
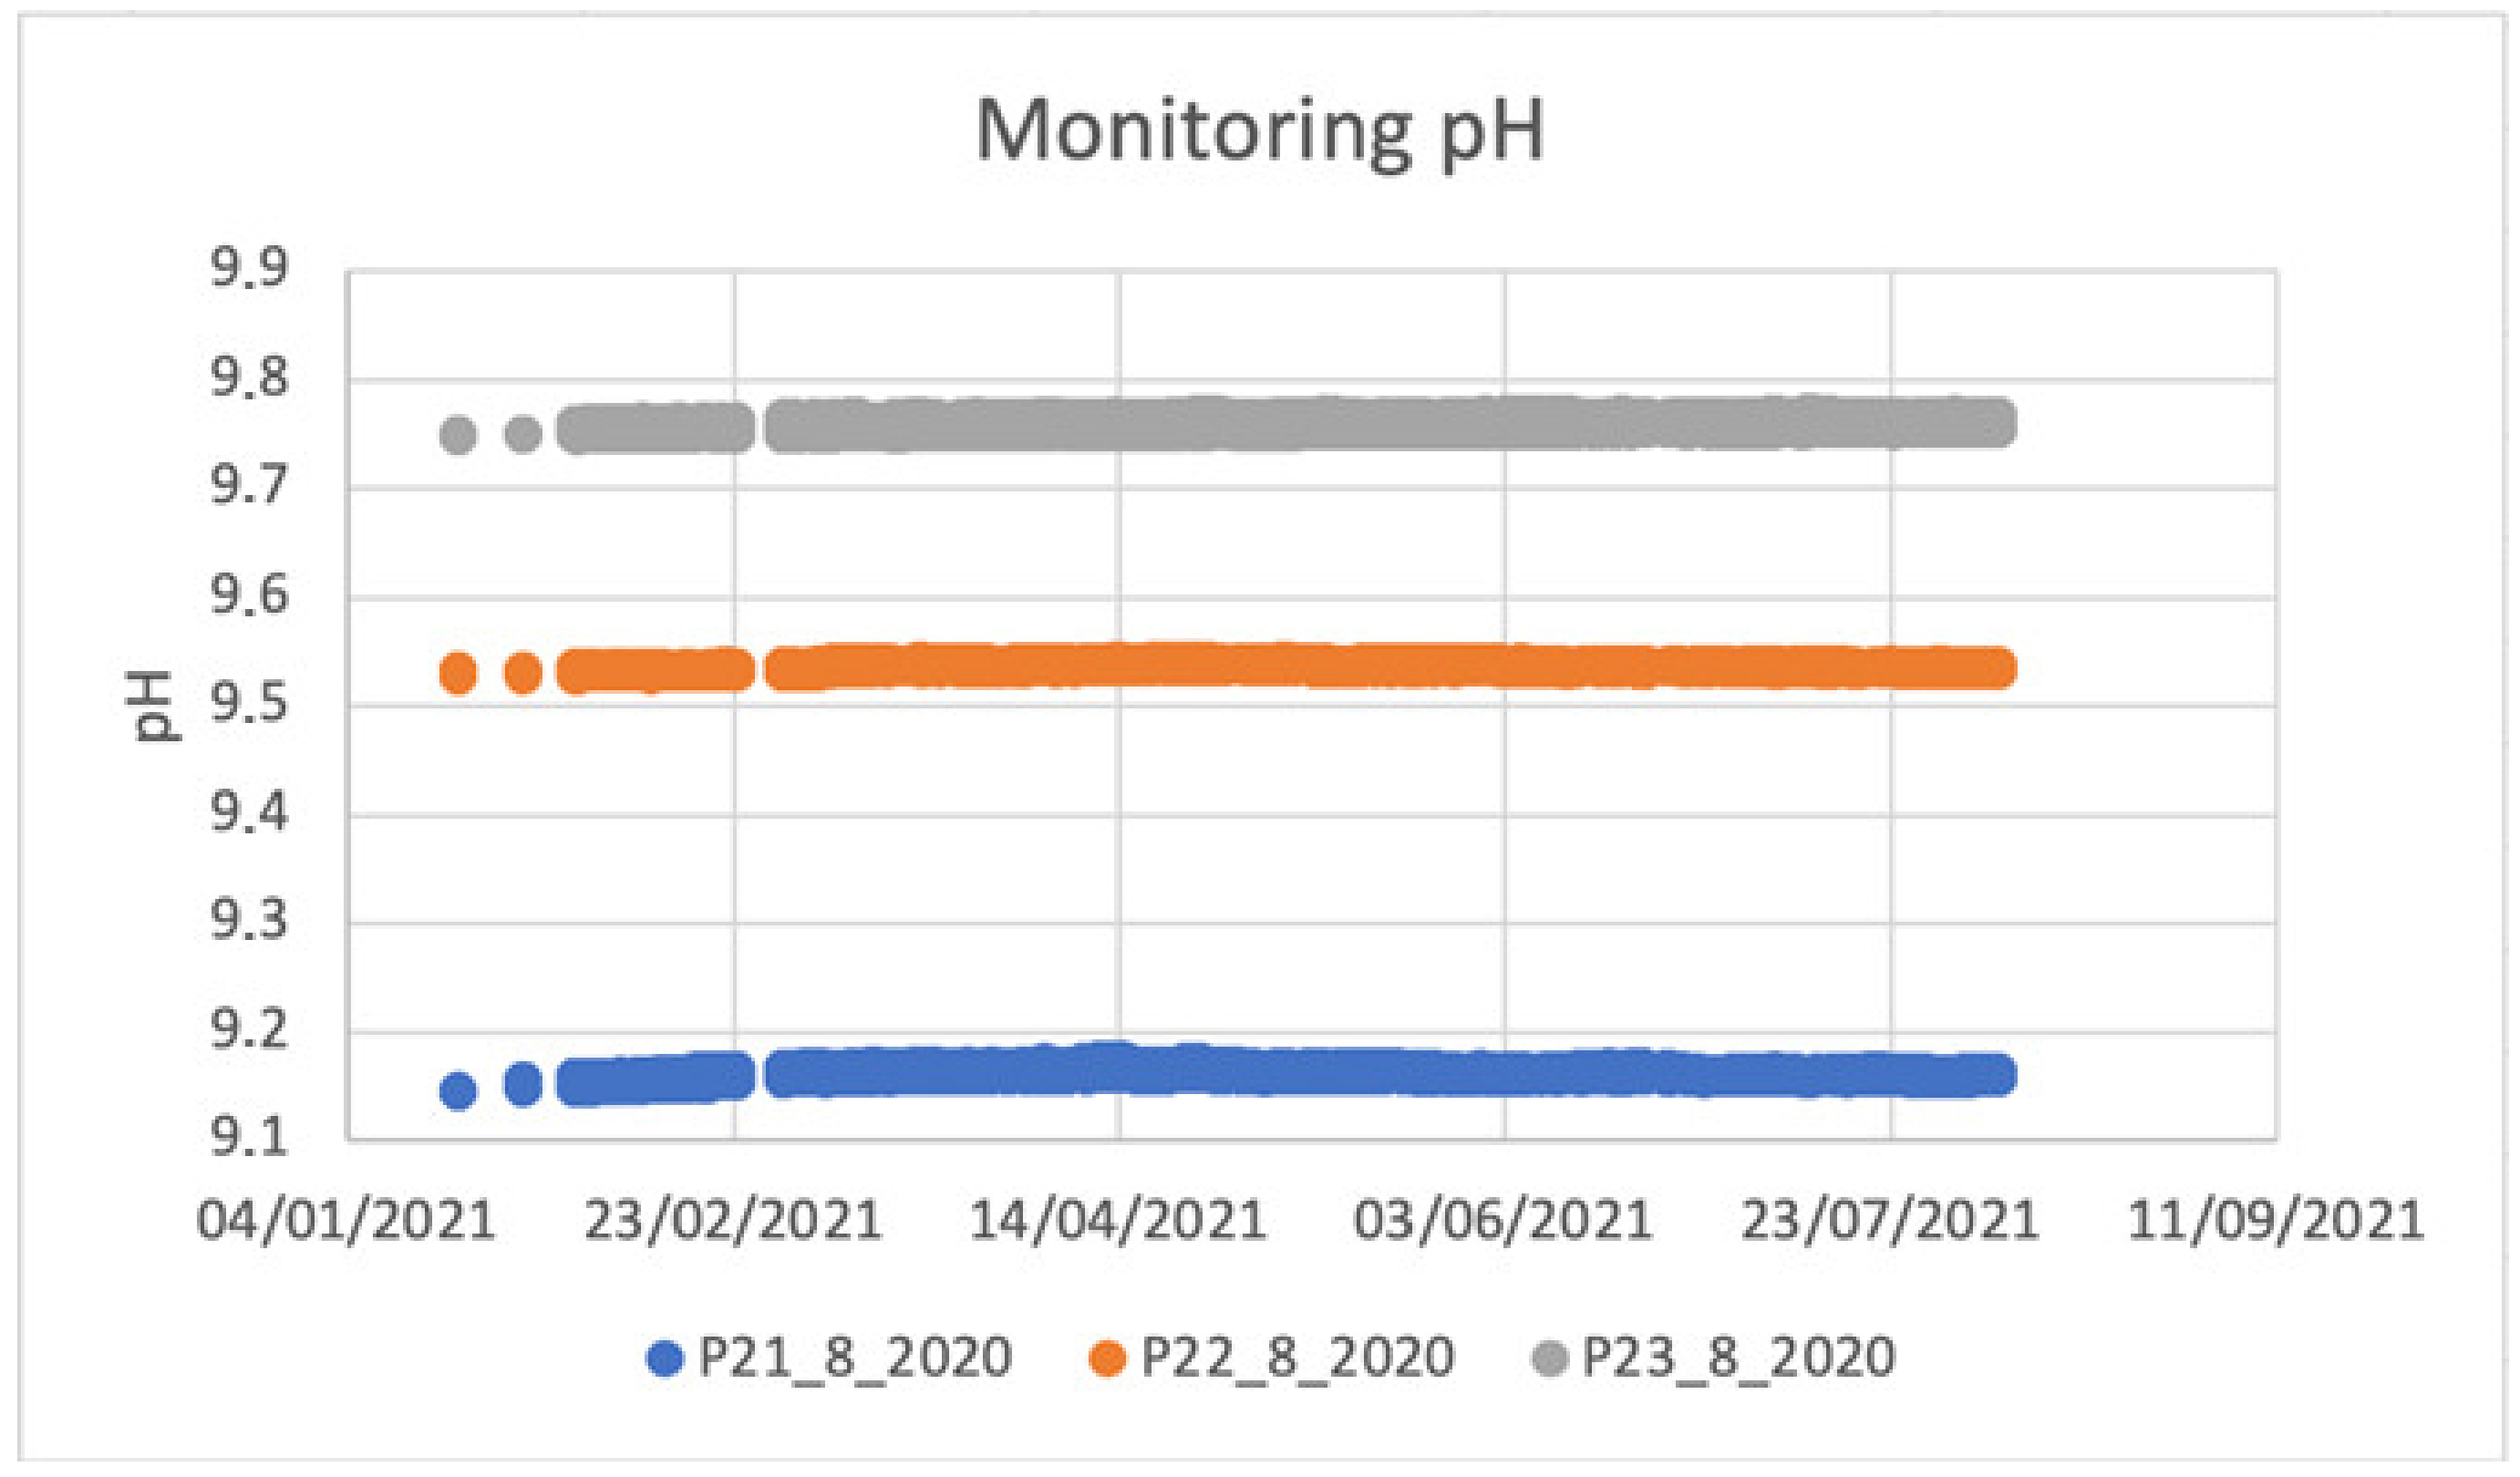
Figure 17 and
Figure 18 show the trend of variation in the pH and in the chloride ion concentration, respectively. The data are detected by the sensors embedded in the concrete of the structure. The sensors are inserted at different depths (1 cm, 2 cm and 3 cm). This choice was made in order to estimate the penetration gradient of the carbon dioxide, responsible, as known, for carbonation, and to evaluate the possible decrease in both the pH and the chloride values. Specifically, the low level of pH reported in
Figure 14 demonstrates that the concrete cover of the Wadi Ghalilah bridge is carbonated.
It is worth specifying that the chemical monitoring is obviously not capable of providing indications of the damage to the structure, as it is focused on the detection of vulnerability conditions of the concrete’s structural elements. Nonetheless, the assessment of the condition of the concrete cover is a strategic step in undertaking actions in order to protect the reinforcements against the risk of corrosion. It is also useful for estimating the residual life of a structure (residual life predictions).
4. Conclusions
In this paper, an integrated procedure for bridge monitoring and damage detection has been introduced. It has the purpose to set up a smart structure through the sensors in the bridge, as well as the sensors in the vehicles passing on it.
For both complementary results, tests have been developed considering real structures. Specifically, a significant experimental investigation was carried out to further assess the reliability of the innovative VBI-based technique, proposed by using, for the first time, an electric car as a mobile monitoring station. Note that, in order to acquire the vehicle response, a single piezoelectric accelerometer is properly positioned on the car. Finally, the results of the tests have been validated by comparison with those obtained from traditional OMA methods, providing a good correspondence. From the results shown, it emerges that this is a promising procedure, which makes it possible to obtain dynamic information of the structures without using sensors on the bridge, thus greatly reducing the costs of wide-scale infrastructural monitoring. For this reason, further investigations are needed to definitively make this method competitive in comparison to the traditional ones.
Moreover, several tests have been developed for detecting the deterioration of the materials. In particular, the degradation of concrete was continuously monitored by the use of sensors for chloride ions and pH sensors immersed directly in concrete, both in situ and by remote measure. Furthermore, a new sensor for sulfate ions was developed and tested.
Finally, it is important to underline that the main achievement of the integrated approach proposed herein is to monitor the bridges in a continuous way, providing a reliable and competitive SHM method in terms of cost and ease of execution. In this regard, to determine the changes in time of the bridge frequencies, the modal parameter on which this article is focused, is crucial. These shifts are, therefore, strictly linked to stiffness changes, and these are good indicators of the damage that is occurring within the structure. Furthermore, it is fundamental to know the variation in the strength of the concrete, in order to better understand whether the structure is always in safe conditions, considering all the active loads.


 ,
, 


