Article

Investigation on Spray Morphology, Droplet Dynamics, and Thermal Characteristics of Iso-Pentane Flashing Spray Based on OpenFOAM

State Key Laboratory of Multiphase Flow in Power Engineering, Xi’an Jiaotong University, Xi’an 710049, China
*
Author to whom correspondence should be addressed.
Appl. Sci. 2022, 12(24), 12899; https://doi.org/10.3390/app122412899
Submission received: 31 October 2022 / Revised: 29 November 2022 / Accepted: 12 December 2022 / Published: 15 December 2022
(This article belongs to the Section Fluid Science and Technology)

Abstract

:
Leakage of high-pressure hydrocarbon liquid from a vessel or pipe may easily result in a two-phase flashing spray due to the rapid pressure drop, which might produce catastrophic consequences. Understanding the flashing spray process is essential to prevent these consequences and minimize the impact. This paper conducted a numerical study through OpenFOAM to investigate the two-phase behavior of flashing spray using a volatile and flammable substance of iso-pentane. The evolution of spray morphology and the distributions of droplet temperature, diameter, and velocity under various initial injection pressures (Pinj) and temperatures (Tinj) were investigated. The simulation result showed good agreement with the experimental result in spray morphology under various Pinj and Tinj. The simulation results indicate that a higher Pinj causes a larger gas phase diffusion length, while Tinj contributes little to this length. However, increasing the Pinj and Tinj shortens the liquid penetration distance. Near the nozzle exit field of about 10 mm, liquid droplets experience a rapid decrease in diameter and velocity along the spray central axis. Meanwhile, spray presents an obvious expansion via the introduction of a spray angle as the input boundary condition of the simulation and droplet temperature has a large gradient toward the radial direction within this field. Droplets in the spray’s downstream region achieved a more stable state with less change in droplet diameter, velocity, and temperature.

1. Introduction

Flashing spray often occurs when high-pressure liquid is discharged into a low-pressure environment below its saturation pressure. The sudden pressure drop causes superheated liquid, which leads to a violent flashing spray and two-phase mixture flow. The fast expansion of vapor bubbles within the spray zone, particularly near the nozzle exit, shatters the liquid bulk in terms of explosion atomization. After that, under the influences of shear force due to the velocity difference between the liquid and gas phases, liquid viscosity, surface tension force, and flow instability, droplets continue to break up, experiencing the secondary atomization and creating a fine mist. Flashing spray has extensively existed in a variety of scientific and engineering fields, such as seawater desalination [1], flashing spray cooling in heat dissipation for high power chips [2], cryogen spray cooling in laser dermatology [3,4], and fuel spray in combustion engines [5,6]. It also holds a particular interest in the chemical or nuclear industry for accidental release of flammable and toxic high-pressure liquids or pressure-liquefied gases to the environment from a vessel or pipe in the form of a small hole. This accidental release may easily result in an explosive flashing spray and a two-phase mixture due to the rapid pressure drop between the vessel/pipe and the environment. This violent flashing spray could cause catastrophic consequences, such as explosions, fires, injuries, and serious local pollution [7,8,9,10].
Since the early 1990s, the European Union has been carrying out a series of research projects (STEP programs) aimed at understanding the two-phase flow behavior of chemical hazards. In the laboratory, various chemicals were injected from a straight tube nozzle with different operating conditions to simulate the flash spray that occurred in the leakage accidents. Various measurement technologies were also adopted to study the dynamic behavior rules of droplets in gas–liquid two-phase flow in flash atomization. For example, Hervieu and Veneau [11] employed a Phase Doppler Particle Analyzer (PDPA) to evaluate droplet size and velocity within a jet at the exit of a discharge pipe of a liquid propane storage tank during a sudden blowdown. Their study indicated that strong evaporation took place along the jet direction and higher pressure caused more intense flashing and thus smaller droplets. Allen [12,13] used an LDA system and a Malvern particle sizer to measure the centerline and lateral profiles of droplet velocity and size in a propane liquid flashing spray. He pointed out that careful and detailed data analysis was required to obtain valid data. Cleary et al. [14] and Witlox et al. [15] utilized a 2D Phase Doppler Anemometry to characterize droplet kinematics and spray quality in a nonflashing to flashing water spray. They developed droplet size correlations for different regimes of spray. Later, Witlox et al. [16] and Kay et al. [17] conducted a further investigation of droplet size and dispersion in the scaled experiments for a range of volatilities (water, cyclohexane, butane, and propane) and superheats, in which the previous size correlations were improved. Some other researchers used more volatile mediums to investigate the spray and thermal characteristics of the flashing spray. Typically, Yildiz et al. [18,19], Aguilar et al. [20,21], and Zhou et al. [3,22,23] employed refrigerants of R134a, R404A, and R407C to generate a fully flashing spray. The spray morphology, droplet diameter, velocity, and temperature were comprehensively investigated using intrusive and nonintrusive techniques. Guo et al. [24] employed a high-speed camera and the particle image velocimetry (PIV) method to capture the morphological characteristics and measure the velocity of an R134a leakage jet and develop an empirical two-phase mass outflow rate model to predict the possible leakage accidents. These experimental studies have offered fundamental research methodology and valuable insight into the complicated two-phase flashing spay, as well as provided some empirical or semiempirical models for damage prediction. On the other hand, some numerical approaches are also introduced for the study of spray leakage and droplet flows. Hulsbosch-Dam et al. developed a model to predict the particle size distribution following the release of pressurized supercritical CO2 [25]. Calay et al. [26] conducted a modeling study on R134a and propone flashing sprays using commercial software of Star-CD and found a large discrepancy existing between the experimental observations and the CFD simulations. It was pointed out that the boundary conditions and submodels used should be carefully chosen to capture all possible scenarios. Lim et al. [27] applied a CFD method with ANSYS FLUENT to optimize a mitigation system designed for installing a physical barrier against hydrogen fluoride and chlorine leaking from industrial facilities. Malekzadeh and Roohi [28] studied the droplet formation and droplet flow under different flow parameters using OpenFOAM. They proposed a classification of two-phase flow regimes for the T-junction microchannel based on the numerical results. Zhou et al. [29] introduced the open-source code of OpenFOAM to explore the two-phase behavior of volatile R404A flashing spray. Their result obtained matched the experimental data reasonably.
Iso-pentane is one kind of highly volatile and easily flammable hydrocarbon with a saturation temperature of 300.98 K at atmospheric pressure. An accidental release from the high-pressure tank or pipe is highly likely to cause a hazardous two-phase flashing spray, which can be hard to notice in the beginning stage of leakage until causing great harm to human safety and the environment. Understanding iso-pentane flashing spray characteristics can be helpful to predict and evaluate possible leakage accidents in industrial applications and subsequently minimize their impact. In this study, a three-dimensional numerical simulation of a small-scale, two-phase flashing spray under different initial temperatures and pressures was conducted to explore the complex phenomenon of iso-pentane release, using a modified sprayFoam solver in OpenFOAM. The simulation results are validated by the experimental data with regard to spray morphology for iso-pentane flashing spray. The spray morphology, penetration distance, global distributions of droplet diameter, droplet velocity, and droplet temperature were fully studied and analyzed in this study.

2. Physical Model of Iso-Pentane Flashing Spray

The flashing phenomenon of iso-pentane is a typical multiphase process mainly involving the transportation between the liquid and gas phases. Thus, among all the reputed multiphase simulation algorithms, the Lagrangian–Eulerian algorithm is a good choice to study flashing spray due to its ability to trace a massive number of tiny droplets [30,31,32,33,34].
The Lagrangian–Eulerian includes the continuous gas phase and the discrete liquid phase. The gas phase is described by the Eulerian algorithm, where the continuity equation, momentum equation, species conservation equation, energy equation, and k-ε turbulence transport model are utilized for the closure of time-averaged governing equations. The liquid-phase droplets are described by Lagrangian balls, which are initialized in the nozzle exit by various submodels. It is worth mentioning that tracking every liquid droplet in the Lagrangian approach requires a sufficiently large number of computation resources. Alternatively, people usually pack the droplets with similar characteristics into a particle called a “parcel”. Each parcel represents several liquid droplets having analogous locations, velocities, sizes, and temperatures.

2.1. Gas Phase Equations

The gas phase in a flashing spray simulation is computed by the Eulerian approach and coupled with droplet behavior calculated by Lagrangian submodels.

2.1.1. The Continuity Equation

In the continuity equation, the evaporation of the droplets S evap is coupled as the source term of the gas phase, which is introduced as follows:
ρ t + ( ρ U ) = S evap   ,
where ρ stands for the density of the working medium; U is the velocity vector, and / t is the partial differential operator of time.

2.1.2. The Momentum Equation

In addition, the droplet momentum is utilized as a source term S mom in the RANS turbulence equation as follows:
ρ U t + ( ρ U U ) μ e f f U · μ e f f [ ( U ) T 2 3 t r ( ( U ) T ) I ] = ρ g   p + S mom ,
in which the turbulence function is closed by the Standard k - ε turbulence model given in Equations (3) and (4); μ e f f is the effective dynamic viscosity; and are the divergence operator and the gradient operator; t r (   ) is the trace of a matrix; I is the identity matrix, and g is the acceleration of gravity.
Equation k:
t ( ρ k ) = · ρ D k k + P t u r b ρ ϵ ,
Equation ε:
t ( ρ ϵ ) = · ρ D ϵ ϵ + C 1 ϵ k P turb + C 3 2 3 k · U C 2 ρ ϵ 2 k
where k is turbulent kinetic energy; Dk is effective diffusivity for k; Pturb is turbulent kinetic energy production rate; ϵ is turbulent kinetic energy dissipation rate; Dϵ is Effective diffusivity for ϵ; C1, C2 and C3 are the model coefficients.

2.1.3. The Species Equation

The transformation by the evaporation of the droplets is introduced in the species equation as a source term S e v a p , i
ρ Y i t + ( ρ U Y i ) · μ e f f Y i = S e v a p , i ,
where the Y i is the mass fraction of each component.

2.1.4. The Energy Equation

The energy equation contains the heat transfer between the gas phase and droplets:
ρ h s t + ( ρ U h s ) α e f f h s = P t + S h e a t ,
where h s is the specific enthalpy; α e f f is the effective thermal diffusivity, and P t is the full derivative of pressure.
All the source terms mentioned above are calculated by Lagrangian submodels in the discrete liquid droplet phase.

2.2. Liquid Phase Equations

The discrete part of the model considers the droplets as Lagrangian particles that develop in accordance with specific physical models for movement, breaking up, boiling, evaporation, dispersion, and heat transfer.

2.2.1. Injection Model

Based on the actual spray pattern of the experimental result, i.e., spray images captured by a high-speed camera, this paper chose the full cone spray injection model as the injection model. The initial direction of the droplet was determined by the preset spray cone angle, which was obtained by the binary images of spray captured by the high-speed camera.
The initial velocity of the droplet u 0 is calculated based on the pressure difference between the injection pressure p 0 and the ambient pressure p b . The velocity equation is shown as follows:
u 0 = 2 ( p 0 p b ) ρ l    
where ρ l is the liquid density of droplet parcel.
The initial droplet diameter distribution is also predefined using the Rosin–Rammler distribution based on experimental data measured by PDPA. The volume cumulative distribution function V c of Rosin–Rammler is:
V c = 1 exp [ ( D d ) n ]  
where   V c is the percentage volume of the droplet that has a diameter smaller than D , and d and n are the distribution parameters in the Rosin–Rammler distribution.

2.2.2. Droplet Motion Model

The main forces on the droplets are the drag force F D caused by the velocity difference between the discrete phase and the continuous phase and the gravity force F g . The total force equation is as follows:
  F = F D + F g = m p d U p , i d t ,
where m p and U p , i represent the mass of droplets and the component of droplet velocity in i direction, respectively.
The drag force F D is calculated as follows,
F D = m p 18 μ eff ρ p D p 2 C D R e p 24 ( U U p ) ,
where ρ p is the liquid density; D p is the droplet diameter; U is the gas velocity; R e p is the Reynolds number, and C D is the drag coefficient dependent on R e p expressed as follows:
C D = { 24 R e p ( 1 + 0.15 R e p 0.678 ) ,     R e 1000 0.44                                                                 ,     R e > 1000

2.2.3. Droplet Breakup Model

As for the droplet breakup model, the widely used Reitz–Diwakar model is applied. The breakup process of droplets can be divided into bag breakup and stripping breakup according to the difference in the Weber number. The calculation of the Weber number in the droplets is as follows:
W e = ρ g | U U p | 2 D p 2 σ ,
{ W e < C b a g                                               bag   breakup   W e R e 0.5 C s t r i p                 stripping   breakup   ,
where σ is the surface tension of droplet; the C s t r i p and C b a g are the stripping and bag breakup coefficients, respectively. According to a previous study [35], the C s t r i p and C b a g are 0.5 and 6, respectively.
Both breakup modes above obey the following differential equations:
dD p dt = D p D stable t br
The difference in breakup modes causes different droplet equilibrium diameter sizes and crushing times.
{ D stable = 2 C bag σ ρ g u rel 2                 bag   breakup D stable = 4 C strip 2 σ 2 ρ g u rel   3 μ eff                 stripping   breakup ,
{ t br = C bag D d ρ l D d σ                   bag   breakup t br   = C strip D d u rel ρ l ρ g                   stripping   breakup ,
where the u rel = | U U p | is the relative velocity between gas and liquid.

2.2.4. Droplet Evaporation/Boiling Model

The liquid droplets that are produced when high-pressure iso-pentane is discharged into a low-pressure environment encounter a significant pressure drop and quickly reach the superheated state. Accordingly, depending on the spray’s initial and external conditions, both the equilibrium evaporation model and the nonequilibrium boiling model should be taken into account. Specifically, when the saturated vapor pressure of the liquid corresponding to its initial temperature is higher than the ambient pressure, the nonequilibrium boiling model has to be applied.
When boiling occurs, the mass transfer of liquid droplets is mainly caused by the superheated flash m ˙ f l a s h and external heat transfer m ˙ t .
d m d t = m ˙ f l a s h + m ˙ t
According to the empirical correlation brought up by Adachi [36], the mass transfer rate caused by the superheated flash is expressed as follows:
m ˙ f l a s h = π d 2 α S ( T T b ) h v ,
where the overall heat transfer coefficient is calculated by the following:
α S = { 760 × ( T T b ) 0.26 ,   0 < T T b < 5 27 × ( T T b ) 2.33 ,   5 T T b < 25 13,800 × ( T T b ) 0.39 ,   25 T T b
On the other hand, the mass transfer caused by the external factor is calculated by
m ˙ t = π d κ c p S h 1 + m ˙ f l a s h m ˙ t ln [ 1 + ( 1 + m ˙ f l a s h m ˙ t ) B t ] ,
where κ, cp, Sh, and Bt are thermal conductivity, specific heat, Sherwood number, and the Spalding heat transfer number, respectively.
The evaporation rate under the equilibrium evaporation can be obtained considering the mass diffusion and Stefan flow as follows:
d m d t = π d S h D s ρ s ln ( 1 + B k ) ,
where Ds and Bk are the mass diffusion coefficient and mass transfer number, respectively.

2.2.5. Droplet Heat Transfer Model

Given that the radiative heat transfer can be neglected due to the small temperature difference, the heat exchange of droplets is mainly caused by convection and evaporation.
mc p dT dt = hA ( T T ) f heat dm dt h v
The convective heat transfer coefficient can be obtained by the dimensionless number Nusselt number N u , calculated by the Ranz–Marshall heat transfer model.
N u = 2 + 0.6 R e 1 2 P r 1 3
Additionally, the convective heat transfer correction coefficient f heat in the Ranz–Marshall heat transfer model is as follows:
f heat = [ c p , v m ˙ π dkNu c p , v m ˙ ( e π dkNu 1 ) ]

2.2.6. Droplet Dispersion Model

In order to simulate turbulent dispersion, the “StochasticDispersionRAS” model from OpenFOAM is applied to generate velocity perturbations at random using the kinetic energy of the RANS turbulence model.

3. Simulation Setup

3.1. Parameter Setup

The numerical model applied in this paper was modified based on sprayFoam solver in open source C++ code library OpenFOAM-2.4.0. The initial parameters including temperature, pressure, and nozzle diameter for the numerical study as shown in Table 1 were all based on our previous experiment conditions. To exhibit the influences of inject pressures and superheat degrees on iso-pentane flashing spray, four initial injection pressures of 1.2, 1.5, 1.8, and 2.1 MPa and three initial injection temperatures of 50, 60, 70, and 80 °C were chosen in the simulation (16 cases in total). Each case experienced a flashing spray process due to the rapid pressure drop from the initial high pressure to the low atmospheric pressure (below the saturation pressure corresponding to the initial injection temperature).
An adjustable run time step algorithm was used to improve computing performance while maintaining temporal accuracy and numerical stability. The thermoproperties of iso-pentane, such as density, viscosity, surface tension, etc., obtained from the NIST-REFPROP 9.1 database were added into the OpenFOAM material library. Furthermore, the calculation method of the thermophysical properties in OpenFOAM was recompiled by the interpolation method rather than the original regression method.
In addition, as mentioned in Section 2.2.1, the spray cone angles and diameter distribution parameters acquired from the experiment under different inject conditions are shown in Table 2.

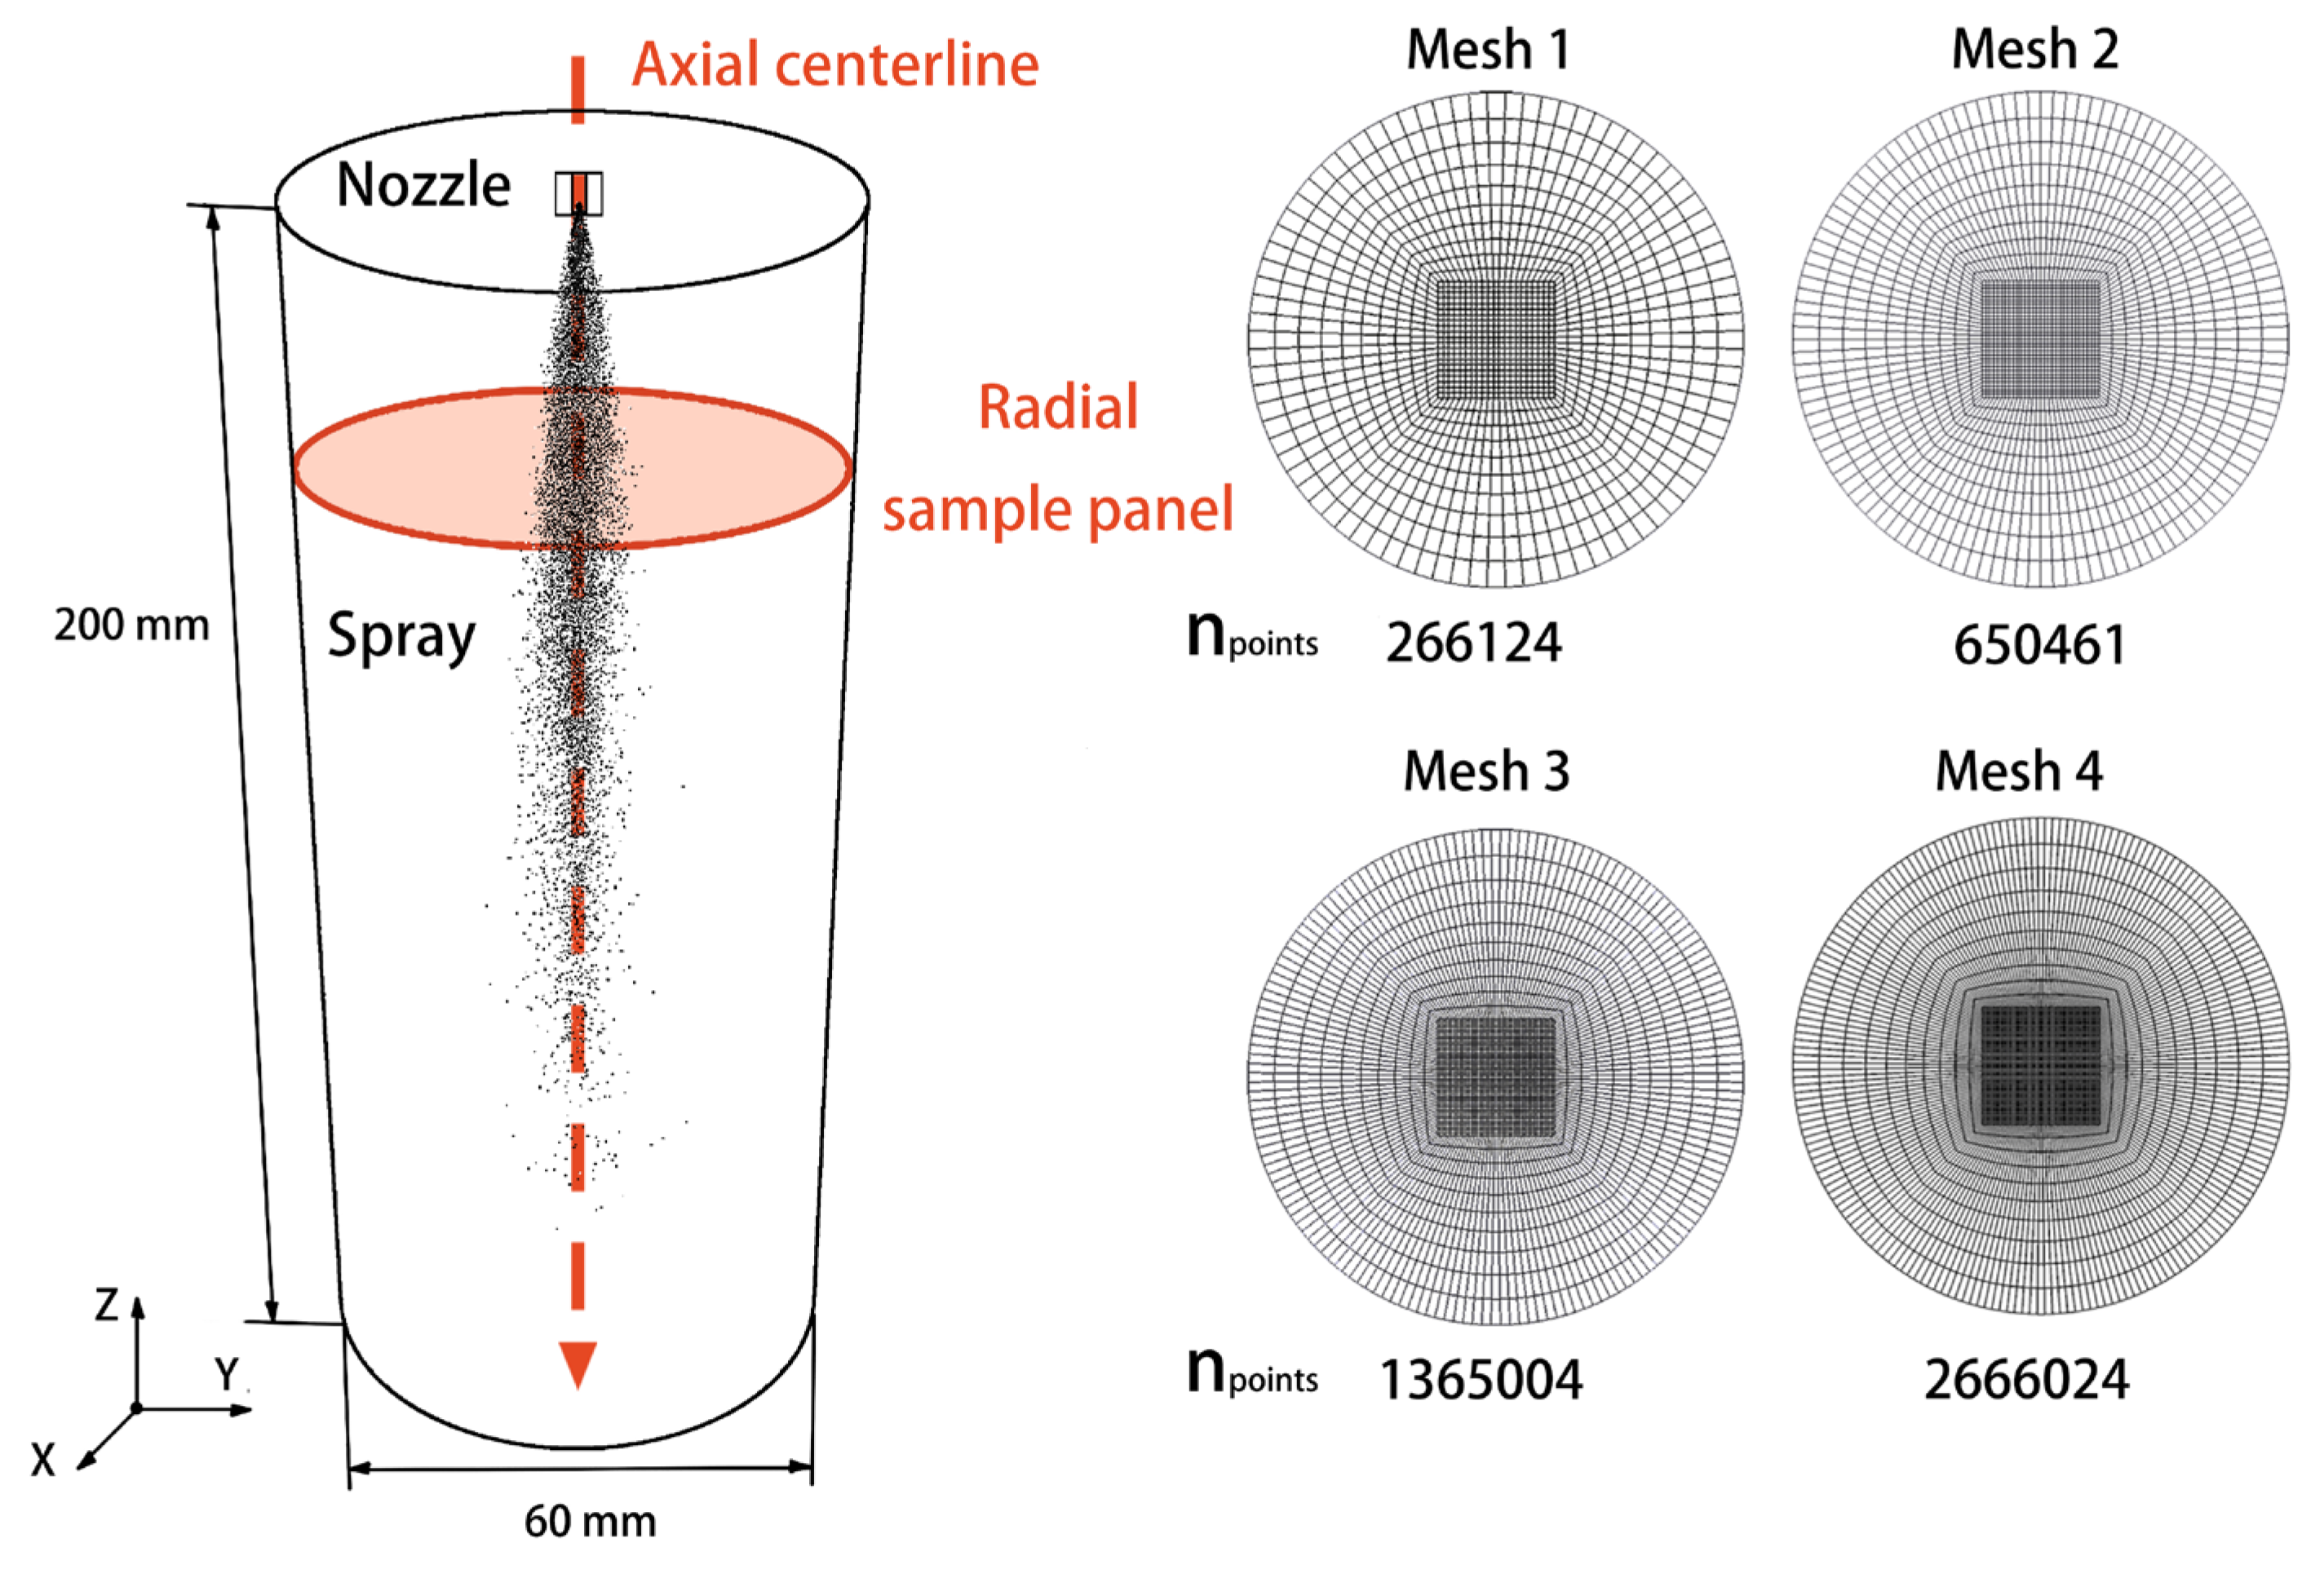
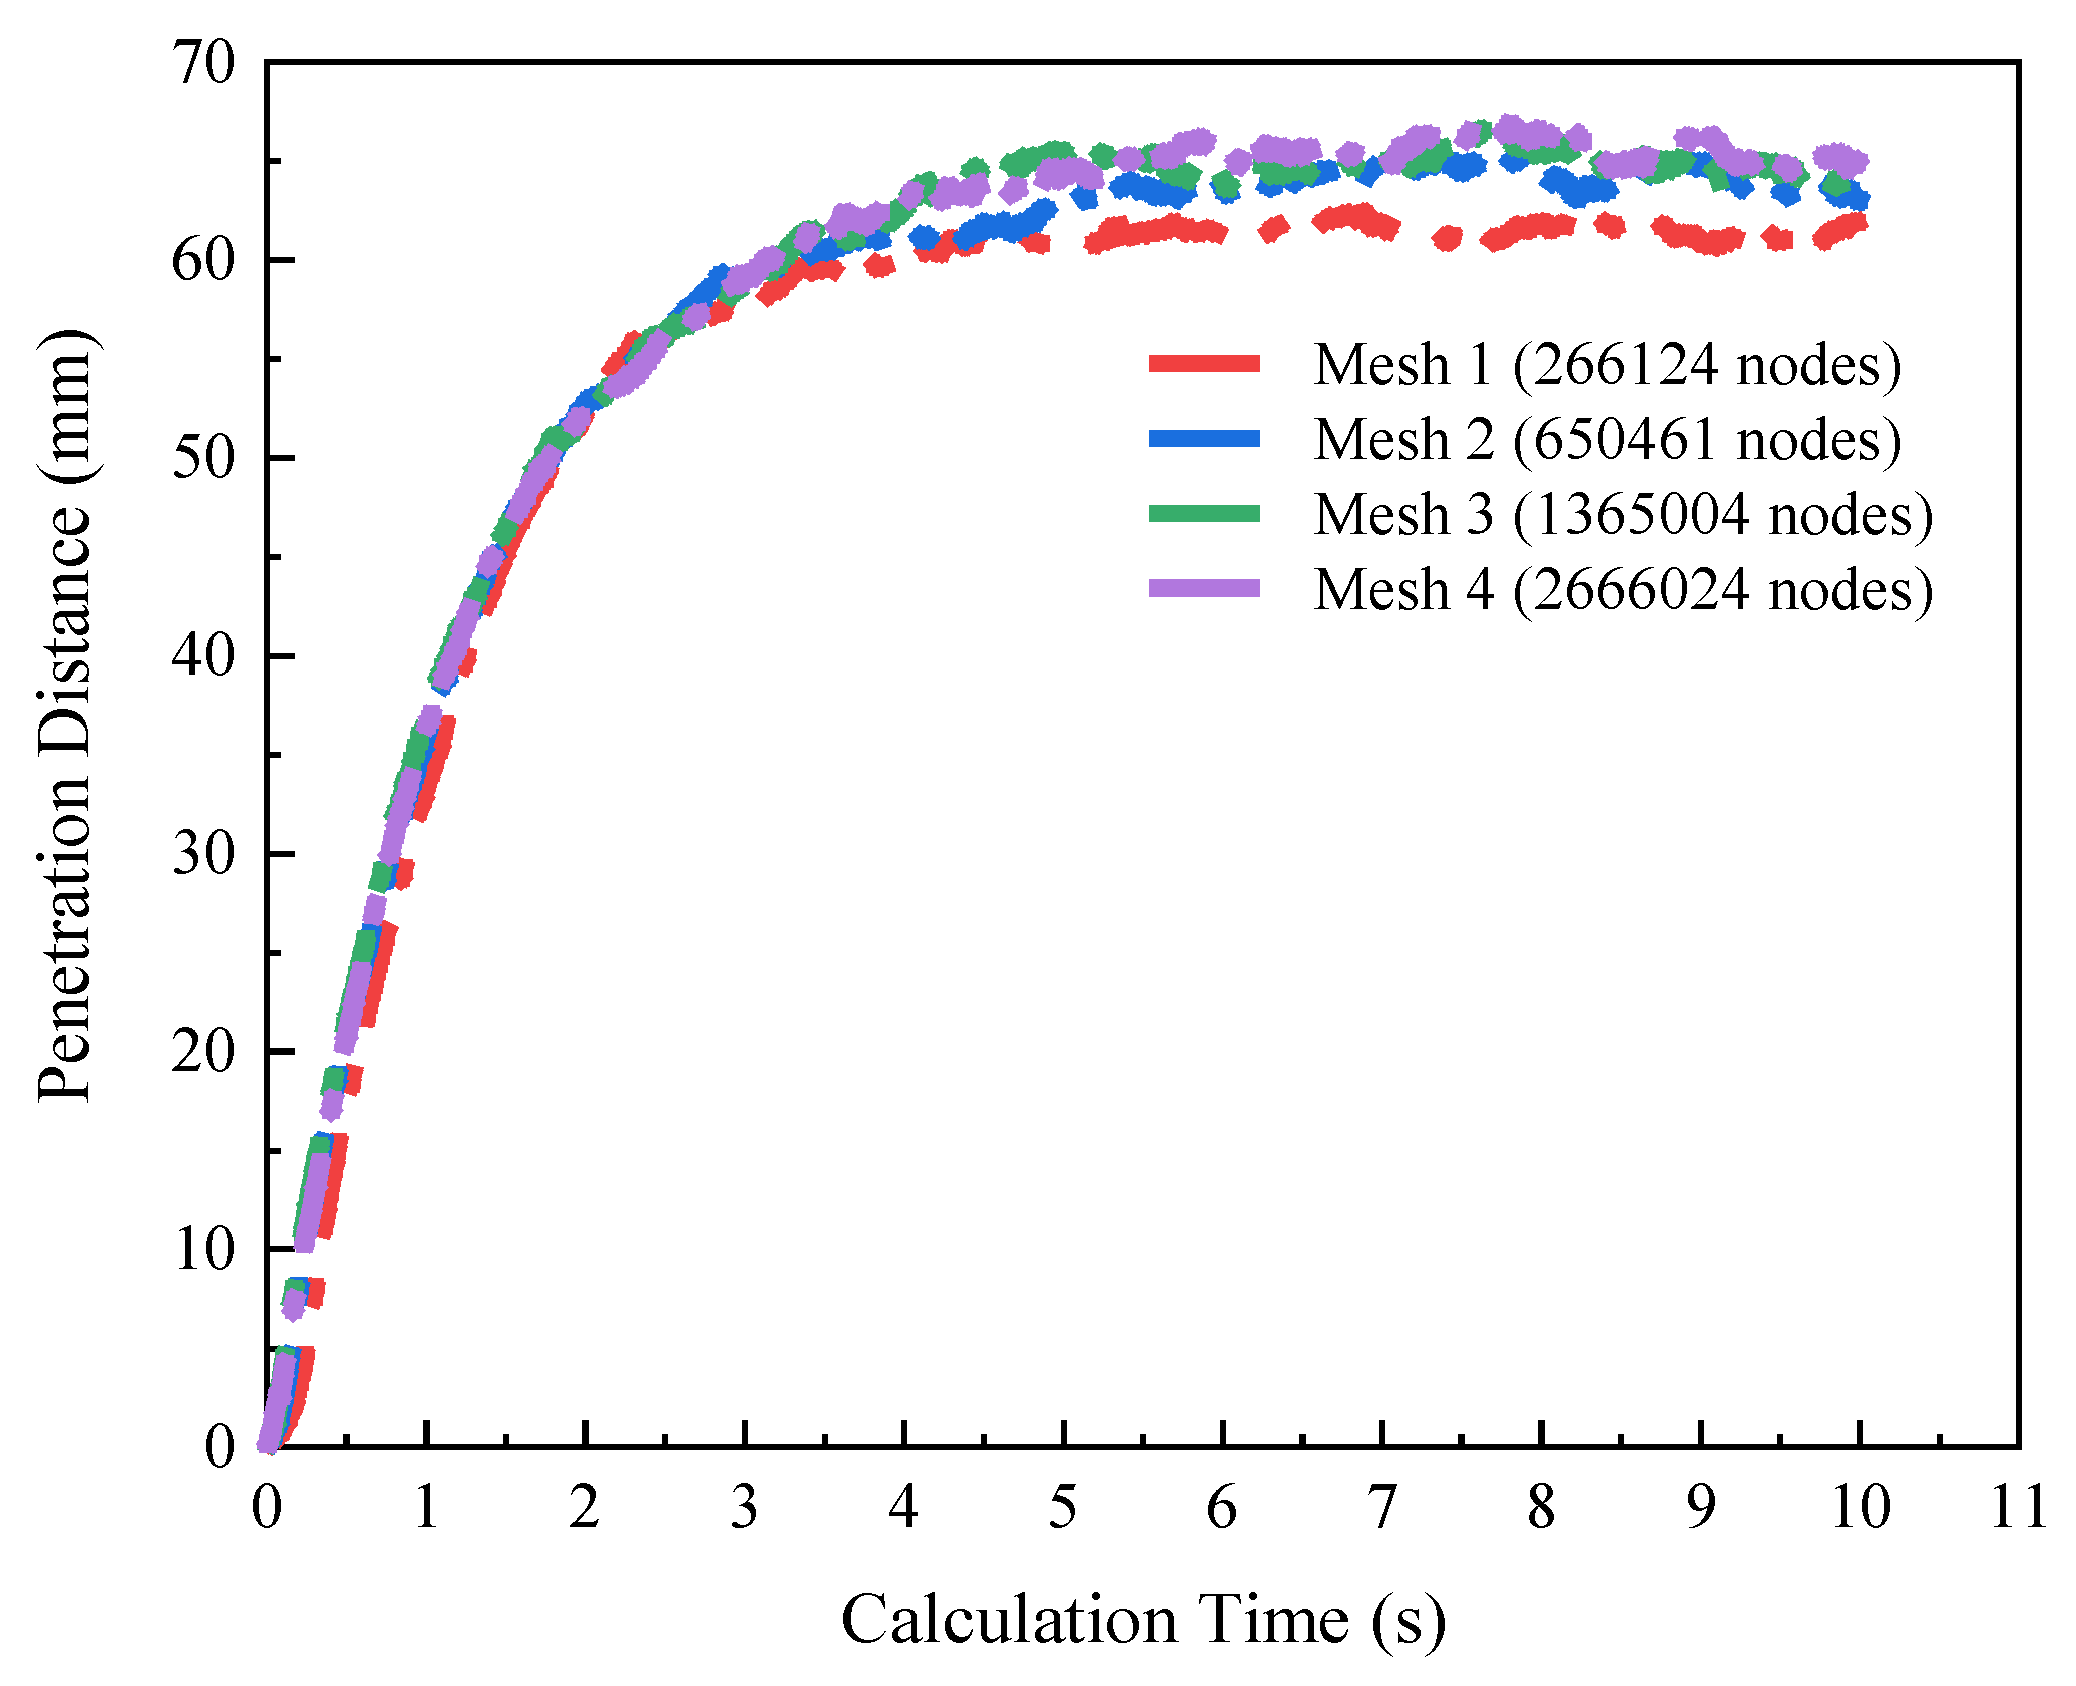
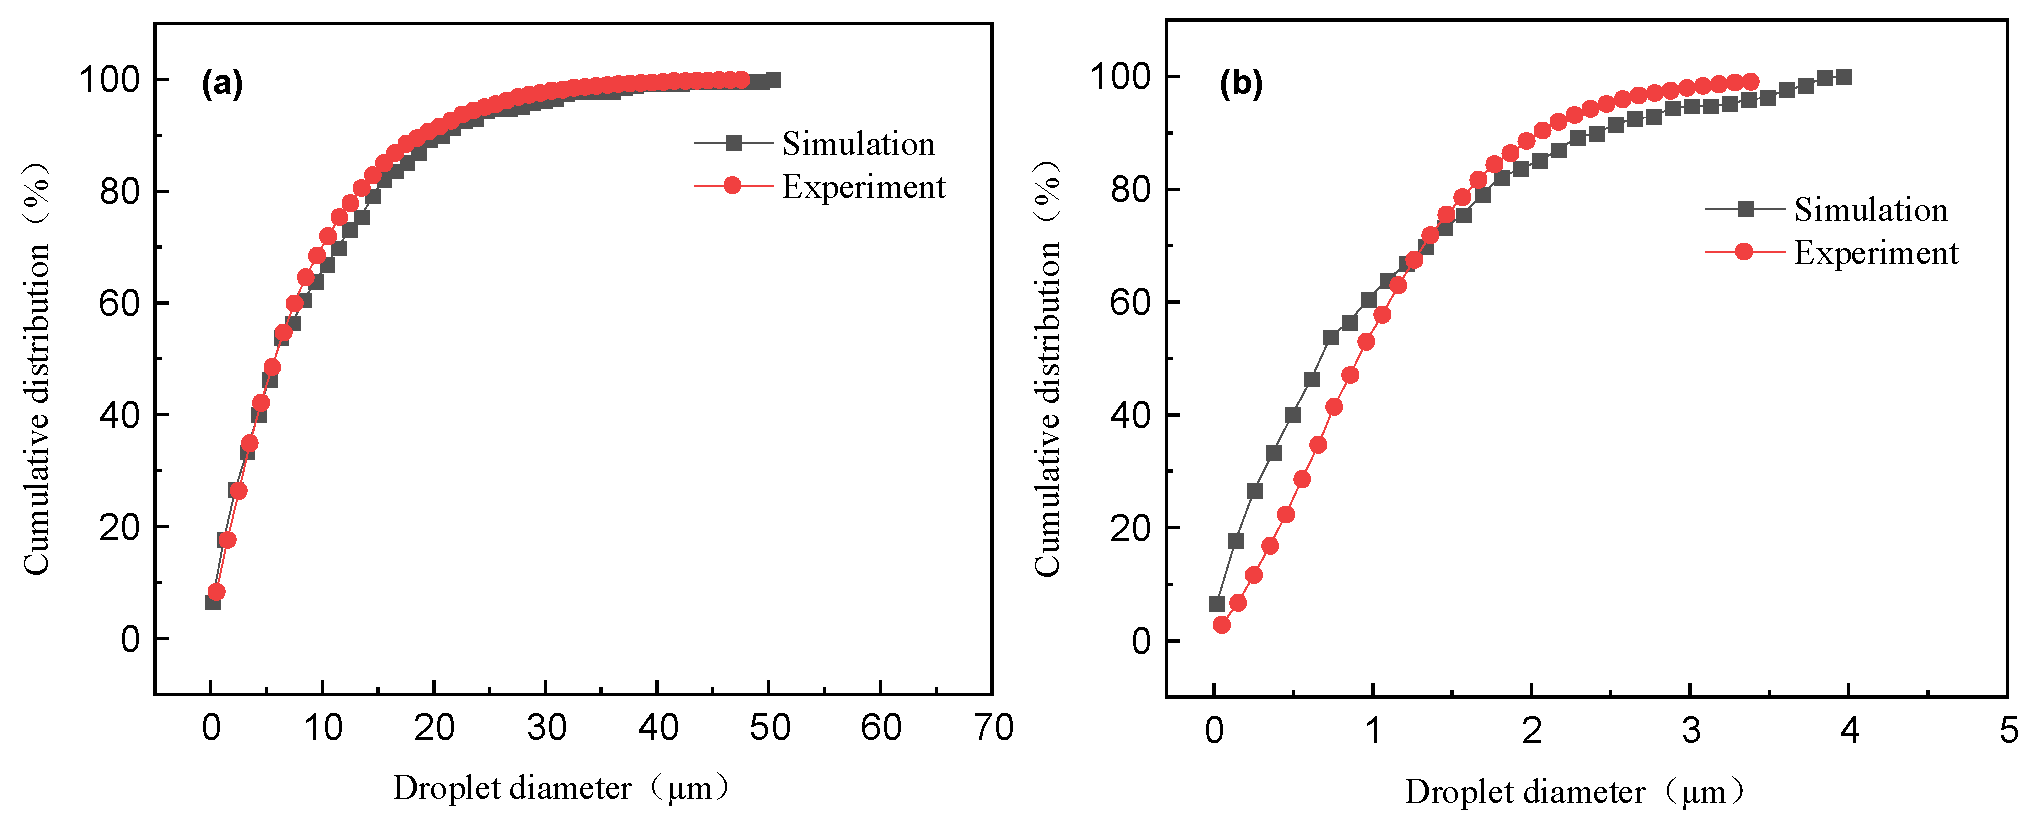
3.2. Grid Independence Test and Model Validation

In consideration of the spray diffusion area, the computational domain was set as a cylinder with a radius of 30 mm and a height of 200 mm, where the injection nozzle was placed at the center of the top surface as shown in Figure 1. Because the simulation result highly relied on mesh quality and the spray droplets mainly took place in the center area of the computational domain, this paper introduced a central regular hexahedral mesh into the cylindrical grid to save calculation cost and guarantee calculation precision.
However, unlike the usual concept that the smaller mesh can lead to a better result, for the Lagrangian–Eulerian algorithm, the mesh volume should be smaller than the parcel size but not too small to cause a bubble size problem [37,38]. Thus the mesh size of the spray simulation domain should be carefully tested. Based on the above principles, the grid independence test was carried out among 4 different meshes (Figure 1), which contained the nodes ( n p o i n t ) of 266124, 650461, 1365004, and 2666024, respectively. In addition, the spray tip penetration, as the most common parameter for mesh independence testing in fuel spray of internal combustion engines, was used to evaluate the grid quality. As shown in Figure 2, the time-dependent spray penetration distances tended to coincide as the mesh nodes exceed 650461. Specifically, as the mesh node number increased from 650461 (mesh 2) to 1365004 (mesh 3) and to 2666024 (mesh 4), the accuracy of the simulation compared with mesh 4 only improved a little (about 1%), while the calculation time almost doubled. Therefore, Mesh 2 with 650461 nodes was chosen for subsequent calculation because of the trade-off between the computational efficiency and accuracy.
Droplet diameter distribution is a highly sensitive parameter in spray simulation. To validate the numerical model in this work, we firstly compared the simulation result of droplet diameter distribution with the experimental result measured by PDPA. Figure 3 shows the comparison of the droplet diameter distribution under the initial condition of 1.5 MPa and 70 °C at 5 mm and 80 mm away from the nozzle tip. The result shows that the simulated diameter distribution agrees well with the experimental data.

4. Results

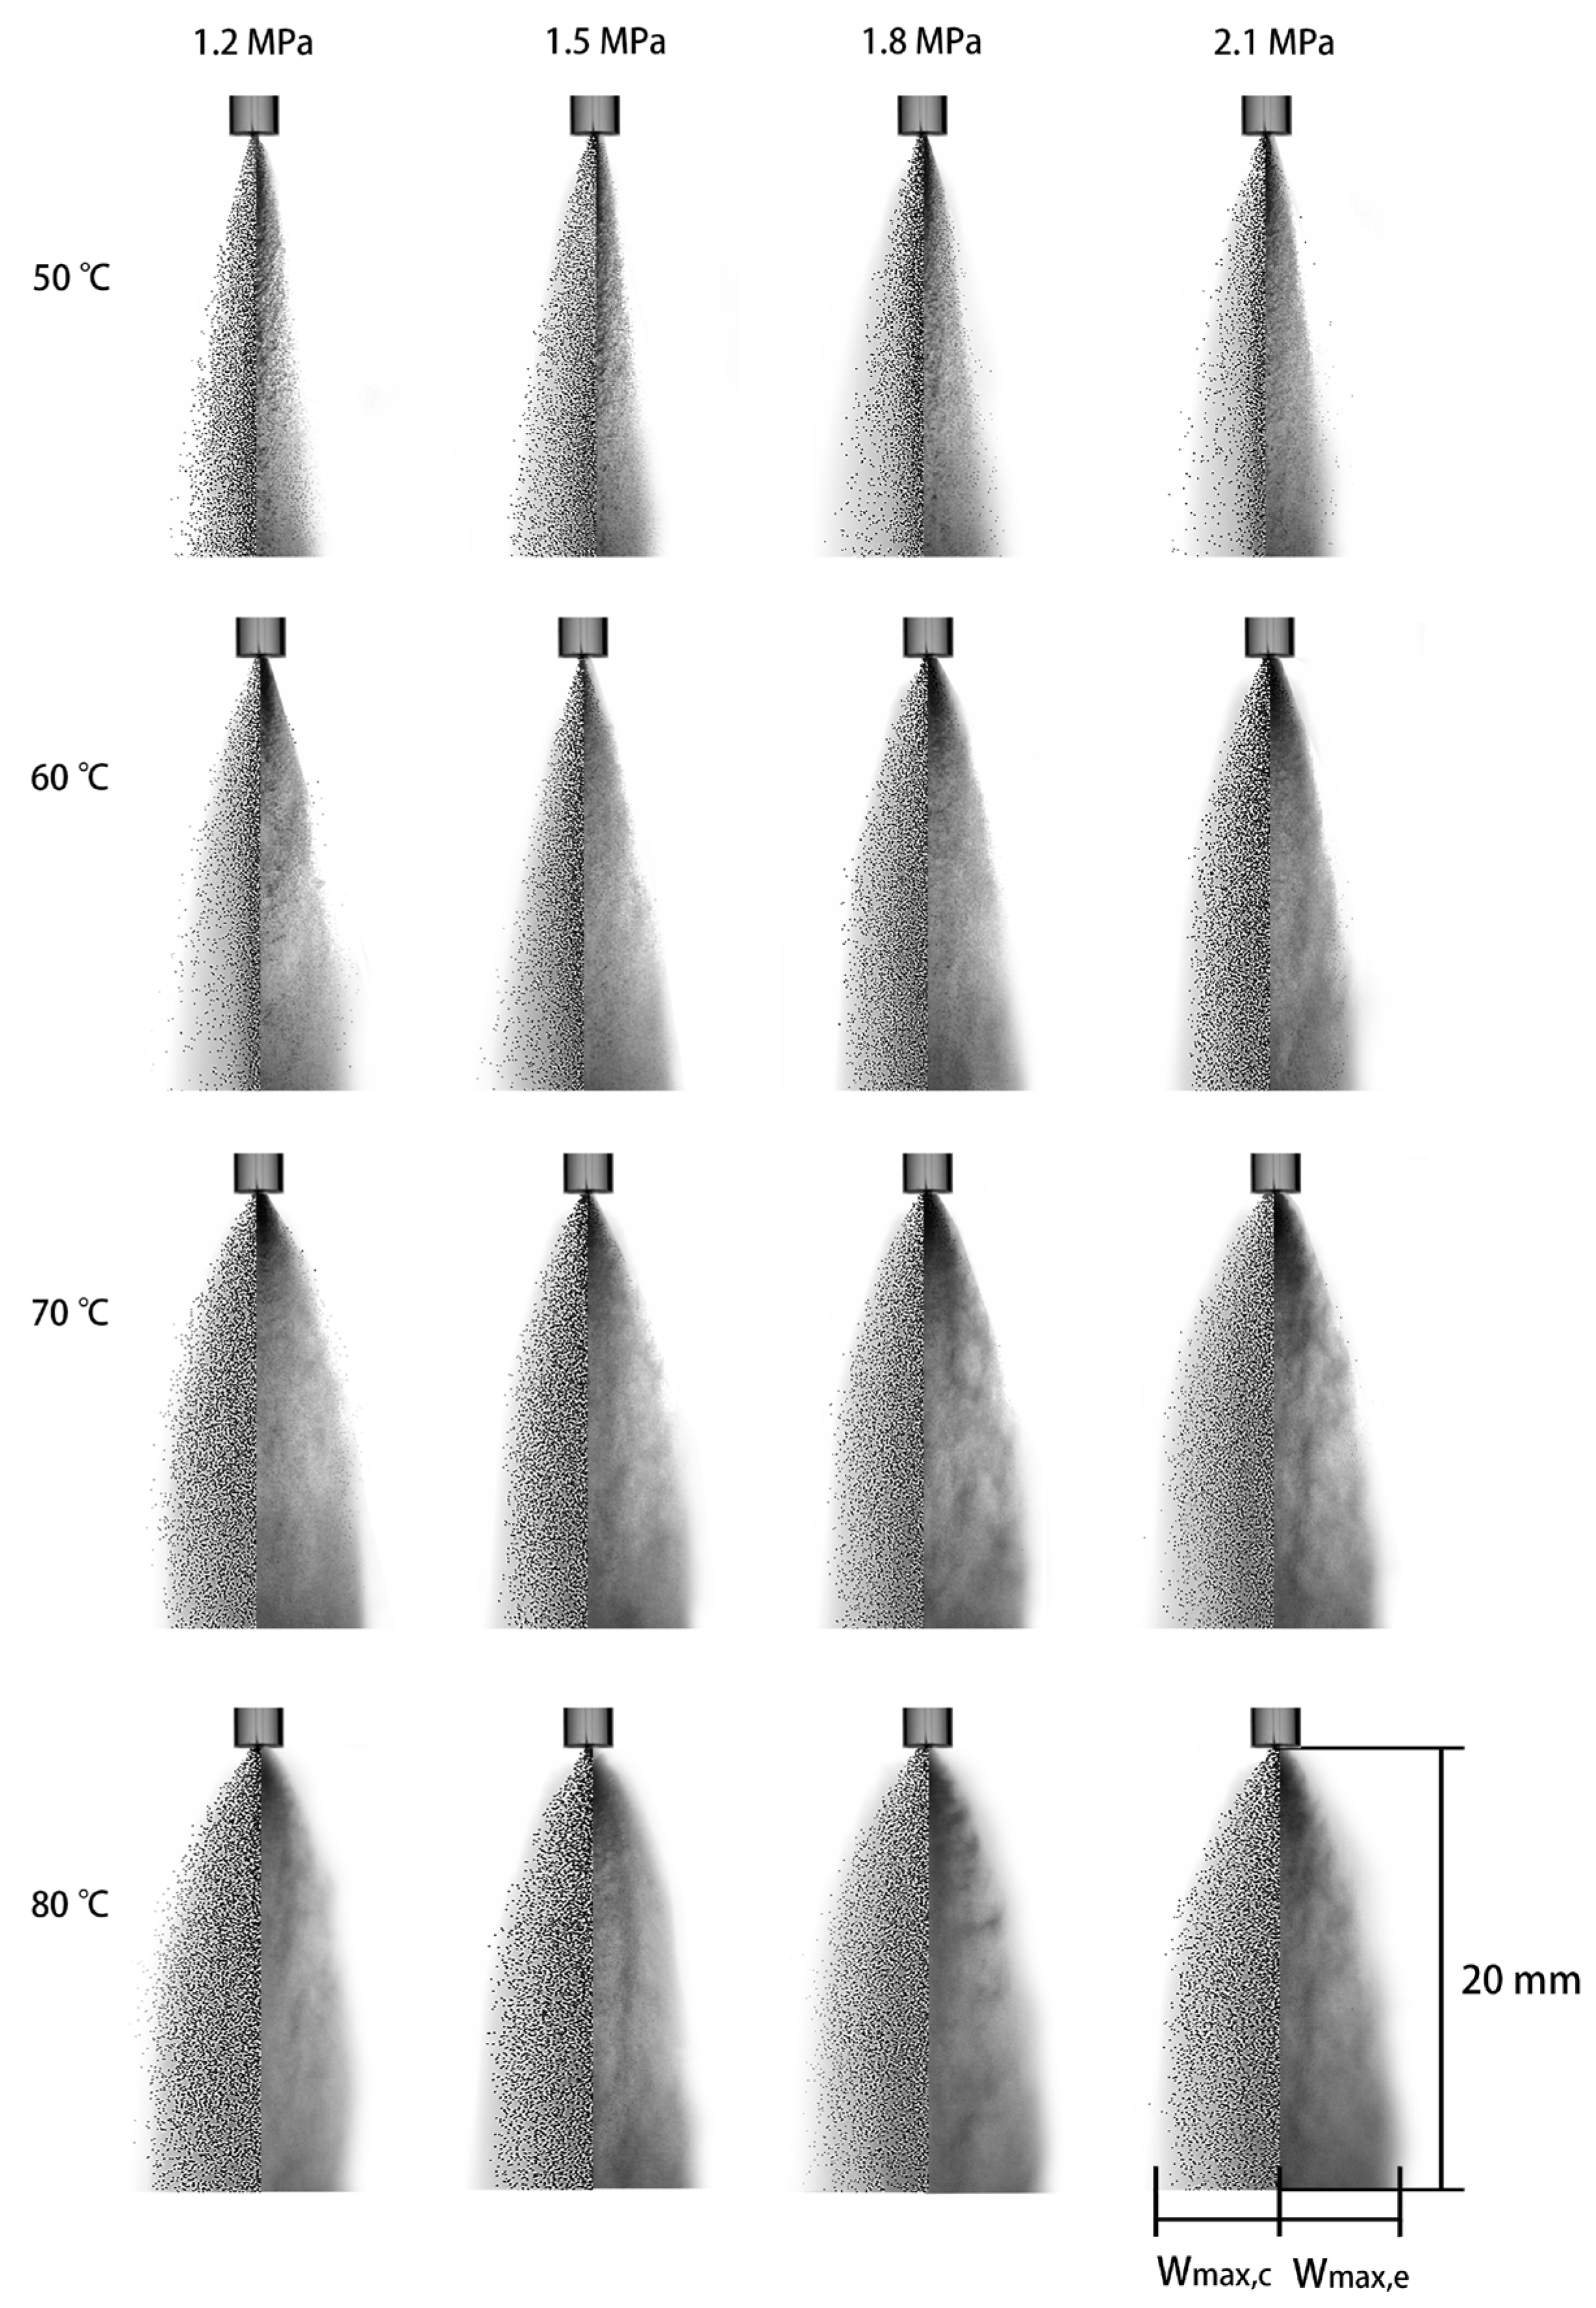
4.1. Spray Morphology

Firstly, the simulation result of spray morphology (left half) near the nozzle field within 20 mm under four initial injection pressures (Pinj) and four initial injection temperatures (Tinj) is presented in Figure 4. To further validate the simulation result, the experimental result of the spray images (right half) obtained by a high-speed camera (Fastcam SA-Z, Photron) with a backlit illumination method is also presented for comparison. As can be seen from Figure 4, the simulative and experimental results agree with each other reasonably under all 16 experimental conditions. The spray angle and expansion area toward the lateral direction both increase with the increment of initial injection pressure and temperature. However, the initial temperature has a more significant effect on the spray morphology compared with the injection pressure. That is, increasing the initial temperature from 50 °C to 80 °C leads to an obvious increase in the spray angle and expansion width at all injection pressures, while the increase in the spray angle and expansion width is far weaker if one changes the injection pressure. This can be explained by the fact that increasing the initial temperature enhances the superheat degree of the flashing spray, while increasing the injection pressure only enhances the discharging rate and initial velocity. As we know, the governing factor of flashing spray is the nonequilibrium thermodynamics due to a rapid release of unstable energy of superheat liquid through the explosive atomization. As a result, a higher superheat degree produces a more violent flashing atomization, accompanied by a larger spray angle and expansion width near the nozzle field. Lastly, it should be mentioned that the initial spray expansion of the simulated results in the radial direction was realized through the introduction of the spray angle extracted from the near-nozzle field spray images recorded by the high-speed camera.
Figure 5 shows the overall spray morphology combining both liquid droplets and diffusion gas mixture, mainly to examine the initial injection pressure and temperature on the penetration distance of iso-pentane flashing spray (0.05 s after injection). The results indicate that a higher injection pressure causes a larger penetration distance of the gas phase, while the injection temperature has less influence on it. To better illustrate this, Figure 6 plots the variation of the penetration distance of the gas and liquid (droplet) phases under different conditions. The droplet penetration distance is the distance that 95% of the droplets’ total mass traveled. In addition, the gas diffusion length is defined as the distance where the iso-pentane gas concentration is reduced to 5% in the spray axial direction. Figure 6a shows that the gas diffusion length nearly presents a linear increase with the injection pressure. This is because a higher injection pressure could induce a larger discharging velocity of spray at the nozzle exit, which makes the total spray have more energy to fly further in the axial direction. However, increasing the initial injection temperature mainly exerts an influence on the spray angle and radial width due to the more violent release of superheat energy, while having much less influence on the spray axial penetration distance. In Figure 6b, a dimensionless number Δ T * / ( P I n j / P   b ) is introduced to present the relation between the liquid penetration distance and different operating conditions. There are two parts in this dimensionless number: (a) Superheat degree of the spray is characterized by Δ T * = T 0 T s a t ( P b ) T s a t ( P I n j ) T s a t ( P b ) and (b) Inject pressure of the spray is represented as P I n j / P   b . Unlike the gas phase variation, the liquid penetration distance shows a tendency to decline as the inject pressure and temperature rise. This can be explained by the fact that a higher injection pressure and temperature both facilitate the atomization quality with a smaller droplet size and a more dispersed spray. This accelerates the vaporizing rate of droplets, and, as a result, droplets disappear earlier due to the complete evaporation of liquid droplets. On the other hand, the transition from liquid droplets to vapor in return results in a larger penetration distance of the gas phase. Therefore, a high inject pressure and temperature produce a spray with a more intense radial expansion and less liquid penetration length toward the axial direction, and the spray is less likely to deposit liquid pools at the leakage point. However, a further gas diffusion distance and smaller droplets of the leaked substance might easily mix with the air as aerosol and travel by wind.

4.2. Spray Temperature and Vapor Concentration

Figure 7 presents the temperature and vapor concentration distributions of the gas phase under the condition of an initial injection temperature of 50 °C and a pressure of 1.2 MPa. As can be seen, a low temperature zone locates in the spray’s central area with a high vapor concentration. The temperature gradually increases, and the vapor concentration decreases from the spray center. This can be explained by two aspects. Firstly, the droplet density is far higher at the spray center than that at the spray periphery demonstrated in Figure 7. As a result, a large number of evaporated droplets needs to absorb more energy from their ambient vapor–gas mixture and meanwhile, generates more vapor, leading to a lower temperature and a higher vapor concentration in the spray’s central area. However, the vapor is more likely to interact with the surrounding gas at the spray periphery through diffusion and convection, which helps to enhance the gas phase temperature and decrease vapor concentration.

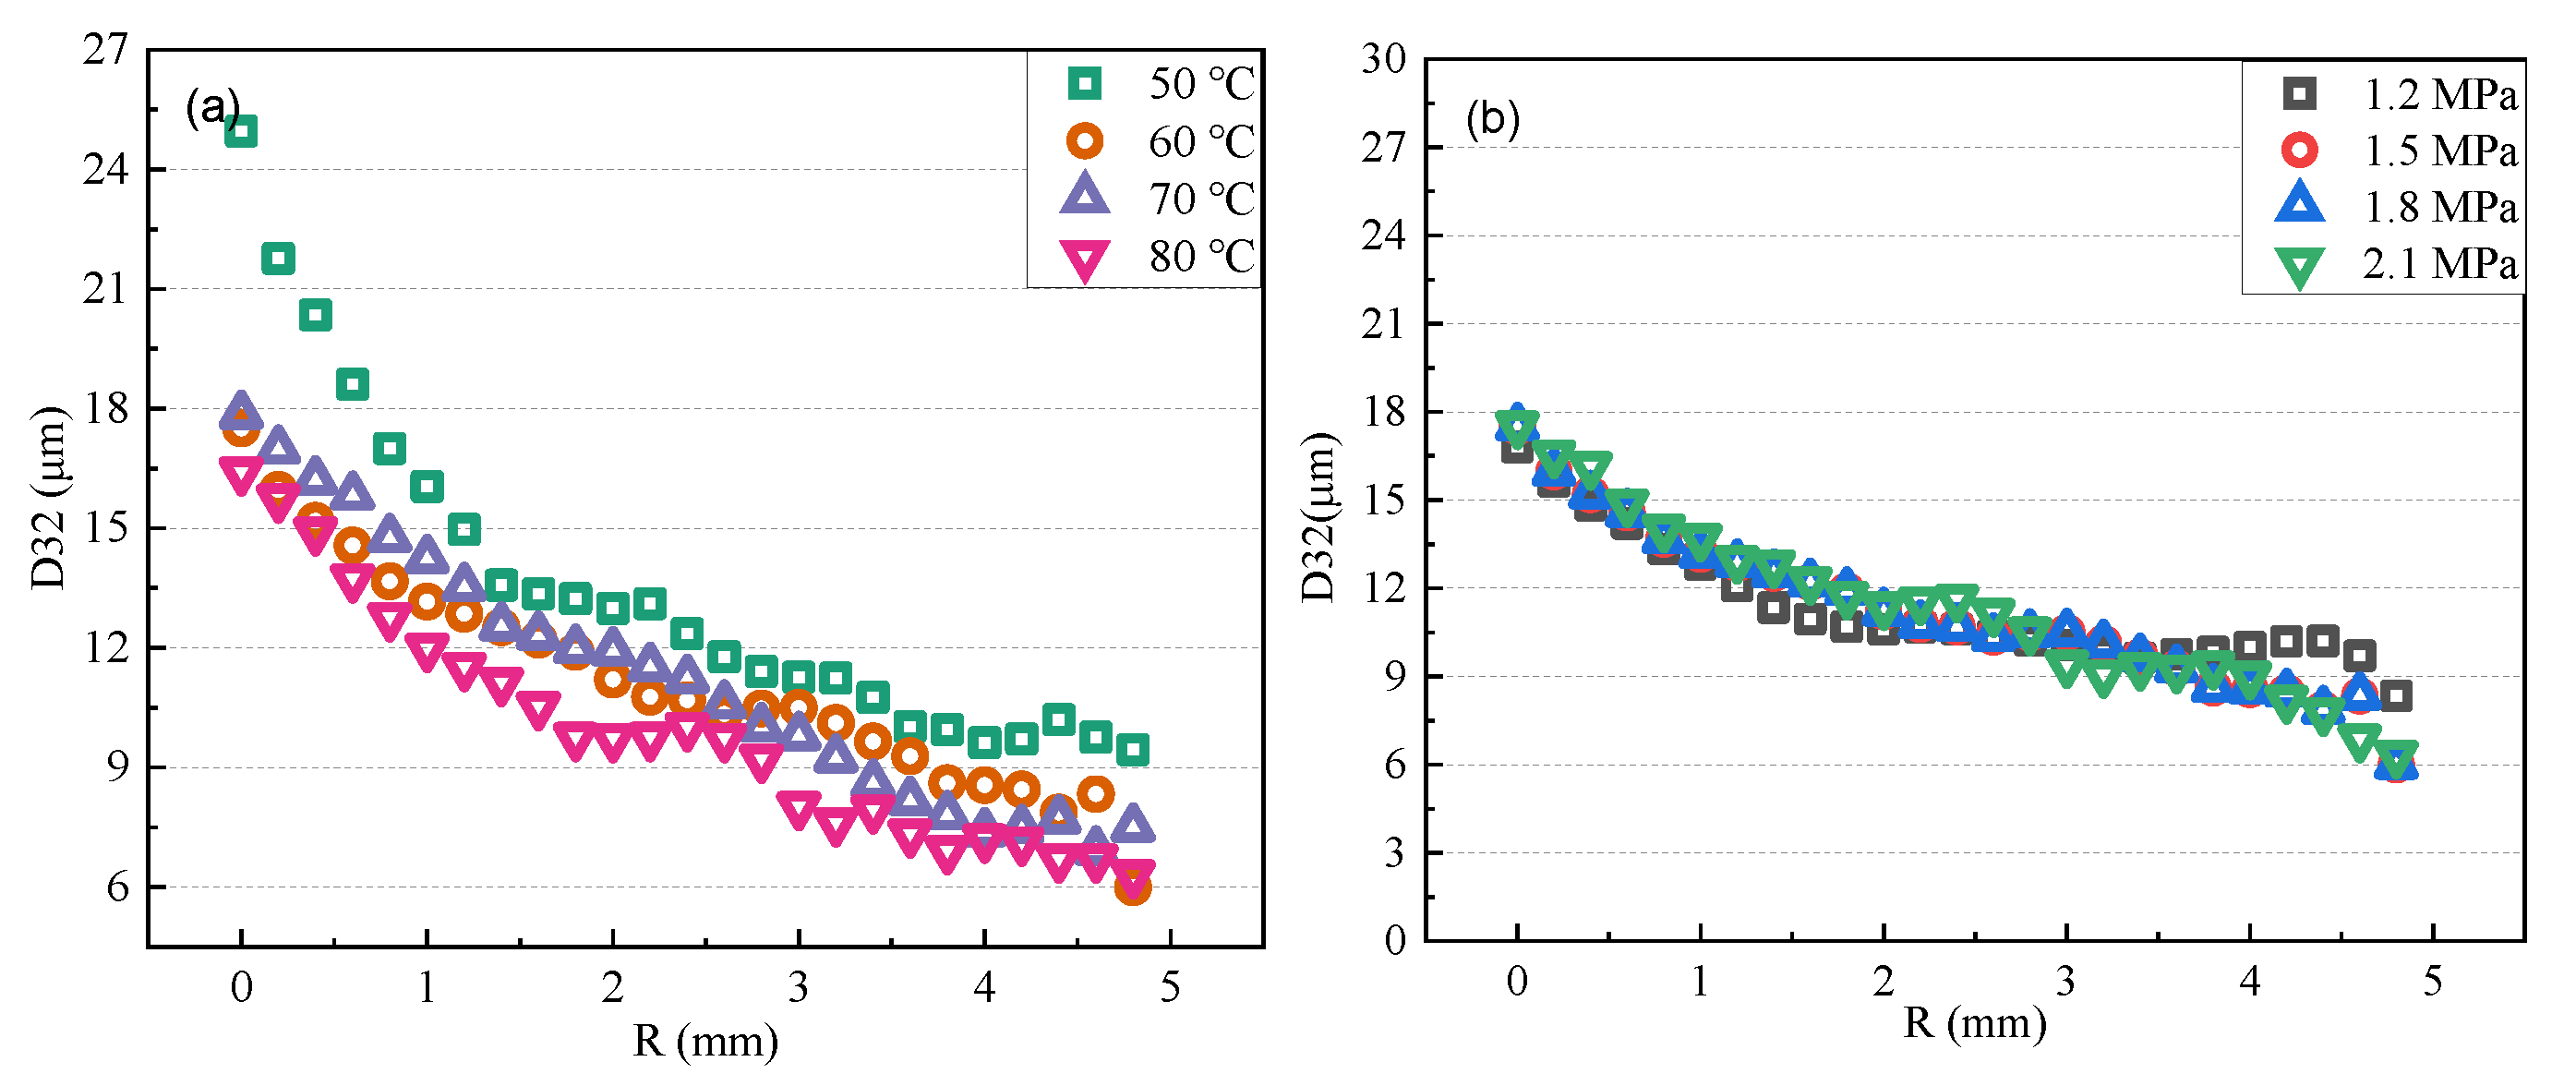
4.3. Spray Droplet Diameter Distribution

Figure 8 presents the effects of injection temperature and pressure on the variation of the Sauter droplet diameter (D32) in the spray axial direction (Z). As can be seen in the figure, the diameter of the droplets decreases violently in a rather short distance (about 10 mm) outside of the nozzle exit and then changes little in the far field. The difference in inject pressures and inject temperatures also indicates little influence on the sharp decrease process, but they have a significant effect on the final stable droplet diameter. A higher injection temperature and pressure all contribute to a smaller droplet diameter at the spray downstream region. The reason for the rapid decrease is mainly due to the sudden release of superheated iso-pentane liquid, which shutters liquid bulk into smaller droplets and causes intense evaporation. After that, the droplets established a balance between drag force and surface tension force in their surface and achieved a relatively uniform distribution in the far area of injection. In addition, the figure shows that the injection temperature contributes little to the droplet penetration distance. However, a lower injection pressure can actually lead to further droplet penetration before full evaporation. This observation is consistent with the result shown in Figure 6. As discussed before, a high pressure and inject temperature are beneficial to the spray breakup process, creating smaller droplets and finer atomization. This will shorten the penetration distance of the liquid droplet due to the more intense evaporation.
Figure 9 exhibits the effects of the injection temperature and pressure on the D32 variation along the spray’s radial direction (R). The droplet diameter decreases smoothly in the radial plane of iso-pentane flashing spray, exhibiting a Gaussian distribution. A higher injection temperature leads to smaller droplets in the radial direction, while the injection pressure affects the radial diameter distribution much less. The possible explanation is that increasing the injection superheat degree leads to an increase in the spray angle and expansion width, causing a more intense evaporation rate in the radial panel.

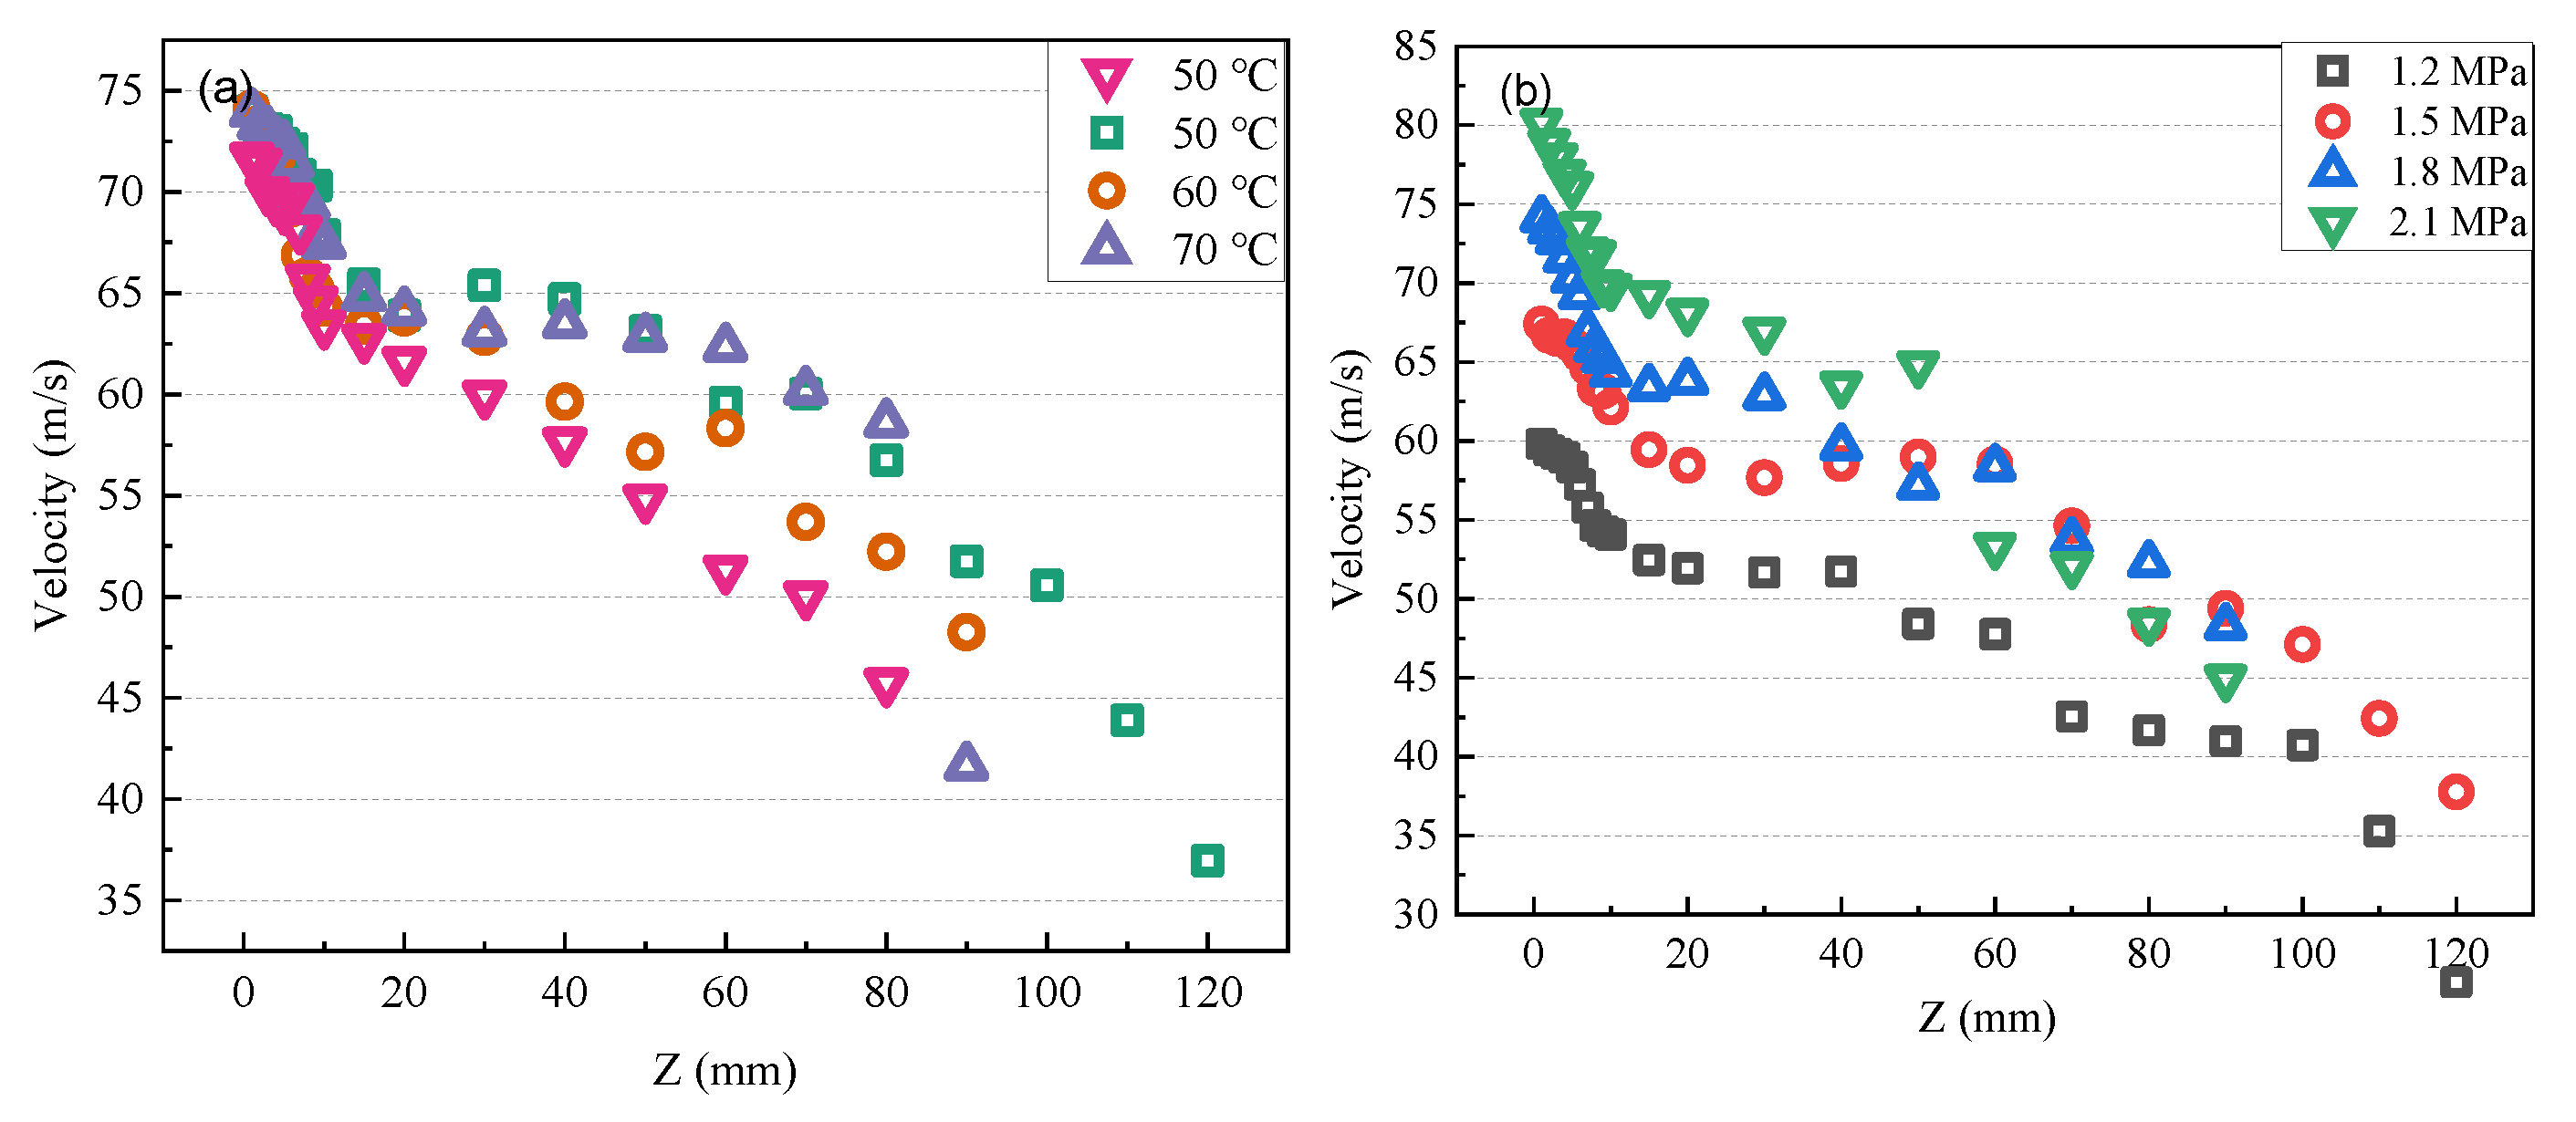
4.4. Spray Droplet Velocity Distribution

Figure 10 shows the variation of droplet velocity in the axial direction, which is another crucial factor determining the shape and behavior of the flashing spray. As the figure presents, the changing pattern of the droplet velocity can be also divided into two stages just as the droplet diameter. In the first stage, the velocity of the droplets d declines sharply due to the violent release of liquid superheat in the near-field of the nozzle exit. In the second stage, the velocity of the spray droplets gradually decreases. The figure also points out that the inject pressure has a more significant influence on droplet velocity than on the inject temperature. A higher injection pressure generates a larger droplet velocity and a decreasing rate along the spray’s central axis.
Figure 11 presents the variation of droplet velocity in the radial direction under different injection conditions. As revealed in this figure, the inject temperature has little influence over the droplet velocity at the radial plane. The injection pressure has a more significant effect on droplet velocity in the spray’s center. As the droplet reaches the spray’s periphery, the velocity distribution of spray tends to be uniform.

5. Conclusions

In this paper, a numerical study based on OpenFOAM was conducted to investigate the macrospray morphology and microdroplet behavior of iso-pentane two-phase flashing spray to simulate the accidental release due to leakage of a high-pressure hydrocarbon liquid in the form of a small hole. The effects of the initial injection pressure and temperature on iso-pentane flashing spray were examined and analyzed.
The numerical result of the spray morphology shows good agreement with the images captured by the experiments at all spray conditions. Through the introduction of the spray angle as one of the input boundary conditions in the numerical study, which were extracted from the near-nozzle field spray images, the simulation can reasonably reflect the rapid expansion of the flashing spray in the radial direction. The radial expansion is greatly enhanced as the initial temperature is increased, while it is less affected by the injection pressure. The initial injection pressure has a more significant effect on the diffusion length of the gas phase in the axial direction. However, increasing the initial injection pressure and superheat both contribute to a decrease in the droplet penetration distance because of the better atomization and a more intense evaporation of smaller droplets.
The gas temperature and vapor concentration profile of the spray suggest that a cold and highly concentrated area exists in the central spray area. Furthermore, droplets in the near-field of the nozzle exit (about 10 mm away from nozzle exit) evaporate intensively due to the quick release of the superheated liquid bulk, causing a rapid decline in the droplet diameter and droplet velocity. Afterward, when the droplets travel downstream, the changing rates of the droplet temperature, diameter, and velocity slow down. Both a higher overheat degree and injection pressure cause smaller droplets and a more substantial evaporation. Moreover, the study points out that a higher temperature can lead to a more homogeneous droplet diameter distribution in the spray’s radial direction, while the inject pressure is the major factor that affects droplet velocity distribution in both the axial and radial directions of iso-pentane flashing spray.

Author Contributions

Conceptualization, Z.-F.Z. and D.-Q.Z.; methodology, D.-Q.Z., S.-Y.C. and J.-F.W.; software, D.-Q.Z. and H.-J.X.; validation, J.-F.W. and B.C.; formal analysis, Z.-F.Z. and D.-Q.Z.; investigation, D.-Q.Z., H.-J.X. and S.-Y.C.; writing—original draft preparation, D.-Q.Z.; writing—review and editing, Z.-F.Z.; visualization, J.-F.W.; supervision, Z.-F.Z. and B.C.; project administration, Z.-F.Z.; funding acquisition, Z.-F.Z. All authors have read and agreed to the published version of the manuscript.

Funding

This research was funded by National Natural Science Foundation of China (52176163) and the aerospace science funding (2019ZB070002). Thanks are also given to the Fundamental Research Funds for the Central Universities and Cyrus Tang Foundation.

Institutional Review Board Statement

Not applicable.

Informed Consent Statement

Not applicable.

Data Availability Statement

The data presented in this study are available on request from the corresponding author.

Conflicts of Interest

The authors declare no conflict of interest.

References

  1. Wang, J.; Cao, B.; Zhang, R.; Li, P. Spray-coated tough thin film composite membrane for pervaporation desalination. Chem. Eng. Res. Des. 2022, 179, 493–501. [Google Scholar] [CrossRef]
  2. Xu, R.; Wang, G.; Jiang, P. Spray Cooling on Enhanced Surfaces: A Review of the Progress and Mechanisms. J. Electron. Packag. 2021, 144, 010802. [Google Scholar] [CrossRef]
  3. Zhou, Z.-F.; Chen, B.; Wang, R.; Wang, G.-X. Comparative investigation on the spray characteristics and heat transfer dynamics of pulsed spray cooling with volatile cryogens. Exp. Therm. Fluid Sci. 2017, 82, 189–197. [Google Scholar] [CrossRef]
  4. Zhou, Z.-f.; Chen, B.; Wang, R.; Bai, F.-l.; Wang, G.-x. Coupling effect of hypobaric pressure and spray distance on heat transfer dynamics of R134a pulsed flashing spray cooling. Exp. Therm. Fluid Sci. 2016, 70, 96–104. [Google Scholar] [CrossRef]
  5. Zhou, Z.F.; Murad, S.H.M.; Tian, J.M.; Camm, J.; Stone, R. Experimental investigation on heat transfer of n -pentane spray impingement on piston surface. Appl. Therm. Eng. 2018, 138, 197–206. [Google Scholar] [CrossRef]
  6. Qiu, S.; Xiao, D.; Zhang, X.; Wang, S.; Wang, T.; Li, X.; Xu, M. Experimental investigations of the phase change impacts on flash boiling spray propagations and impingements. Fuel 2022, 312, 122871. [Google Scholar] [CrossRef]
  7. Tardáguila, R.D.; Herranz, L.E. Attenuation of radioactive releases from NPP under accident conditions: An experimental research on risk-dominant scenarios. Chem. Eng. Res. Des. 2013, 91, 603–613. [Google Scholar] [CrossRef]
  8. Lee, J.J.; Yun, H.S.; Cho, Y.J.; Park, J.H. Empirical analysis of a steam explosion in a slag yard based on a field investigation and 3D explosion damage simulation. Process Saf. Environ. Prot. 2020, 136, 126–135. [Google Scholar] [CrossRef]
  9. Wu, F.; Yu, H.; Pan, X.; Zang, X.; Hua, M.; Wang, H.; Jiang, J. Experimental study of methanol atomization and spray explosion characteristic under negative pressure. Process Saf. Environ. Prot. 2022, 161, 162–174. [Google Scholar] [CrossRef]
  10. Guo, X.; Zhang, H.; Pan, X.; Zhang, L.; Hua, M.; Zhang, C.; Zhou, J.; Yan, C.; Jiang, J. Experimental and numerical simulation research on fire suppression efficiency of dry powder mediums containing molybdenum flame retardant additive. Process Saf. Environ. Prot. 2022, 159, 294–308. [Google Scholar] [CrossRef]
  11. Hervieu, E.; Veneau, T. Experimental determination of the droplet size and velocity distributions at the exit of the bottom discharge pipe of a liquefied propane storage tank during a sudden blowdown. J. Loss Prev. Process Ind. 1996, 9, 413–425. [Google Scholar] [CrossRef]
  12. Allen, J.T. Laser-based measurements in two-phase flashing propane jets. Part one: Velocity profiles. J. Loss Prev. Process Ind. 1998, 11, 291–297. [Google Scholar] [CrossRef]
  13. Allen, J.T. Laser-based measurements in two-phase flashing propane jets. Part two: Droplet size distribution. J. Loss Prev. Process Ind. 1998, 11, 299–306. [Google Scholar] [CrossRef]
  14. Cleary, V.; Bowen, P.; Witlox, H. Flashing liquid jets and two-phase droplet dispersion: I. Experiments for derivation of droplet atomisation correlations. J. Hazard. Mater. 2007, 142, 786–796. [Google Scholar] [CrossRef] [PubMed]
  15. Witlox, H.; Harper, M.; Bowen, P.; Cleary, V. Flashing liquid jets and two-phase droplet dispersion: II. Comparison and validation of droplet size and rainout formulations. J. Hazard. Mater. 2007, 142, 797–809. [Google Scholar] [CrossRef] [PubMed]
  16. Witlox, H.W.M.; Harper, M.; Oke, A.; Bowen, P.J.; Kay, P. Sub-cooled and flashing liquid jets and droplet dispersion I. Overview and model implementation/validation. J. Loss Prev. Process Ind. 2010, 23, 831–842. [Google Scholar] [CrossRef]
  17. Kay, P.J.; Bowen, P.J.; Witlox, H.W.M. Sub-cooled and flashing liquid jets and droplet dispersion II. Scaled experiments and derivation of droplet size correlations. J. Loss Prev. Process Ind. 2010, 23, 849–856. [Google Scholar] [CrossRef]
  18. Yildiz, D.; Rambaud, P.; Van Beeck, J.; Buchlin, J. Evolution of the spray characteristics in superheated liquid jet atomization in function of initial flow conditions. In Proceedings of the 10th International Conference on Liquid Atomization and Spray Systems, Kyoto, Japan, 27 August – 1 September 2006. [Google Scholar]
  19. Yildiz, D.; van Beeck, J.P.A.J.; Riethmuller, M.L. Feasibility Exploration of Laser-based Techniques for Characterization of a Flashing Jet. Part. Part. Syst. Charact. 2004, 21, 390–402. [Google Scholar] [CrossRef]
  20. Aguilar, G.; Majaron, B.; Verkruysse, W.; Zhou, Y.; Nelson, J.S.; Lavernia, E.J. Theoretical and experimental analysis of droplet diameter, temperature, and evaporation rate evolution in cryogenic sprays. Int. J. Heat Mass Transf. 2001, 44, 3201–3211. [Google Scholar] [CrossRef]
  21. Vu, H.; García-Valladares, O.; Aguilar, G. Vapor/liquid phase interaction in flare flashing sprays used in dermatologic cooling. Int. J. Heat Mass Transf. 2008, 51, 5721–5731. [Google Scholar] [CrossRef]
  22. Zhou, Z.-F.; Hu, M.-Y.; Xin, H.; Chen, B.; Wang, G.-X. Experimental and theoretical studies on the droplet temperature behavior of R407C two-phase flashing spray. Int. J. Heat Mass Transf. 2019, 136, 664–673. [Google Scholar] [CrossRef]
  23. Zhifu, Z.; Weitao, W.; Bin, C.; Guoxiang, W.; Liejin, G. An experimental study on the spray and thermal characteristics of R134a two-phase flashing spray. Int. J. Heat Mass Transf. 2012, 55, 4460–4468. [Google Scholar] [CrossRef]
  24. Guo, X.; Tan, W.; Liu, L.; Liu, C.; Zhu, G. Experimental study of liquefied gas dynamic leakage behavior from a pressurized vessel. Process Saf. Environ. Prot. 2021, 151, 20–27. [Google Scholar] [CrossRef]
  25. Hulsbosch-Dam, C.E.C.; Spruijt, M.P.N.; Necci, A.; Cozzani, V. Assessment of particle size distribution in CO2 accidental releases. J. Loss Prev. Process Ind. 2012, 25, 254–262. [Google Scholar] [CrossRef]
  26. Calay, R.K.; Holdo, A.E. Modelling the dispersion of flashing jets using CFD. J. Hazard. Mater. 2008, 154, 1198–1209. [Google Scholar] [CrossRef]
  27. Lim, H.; Um, K.; Jung, S. A study on effective mitigation system for accidental toxic gas releases. J. Loss Prev. Process Ind. 2017, 49, 636–644. [Google Scholar] [CrossRef]
  28. Malekzadeh, S.; Roohi, E. Investigation of Different Droplet Formation Regimes in a T-junction Microchannel Using the VOF Technique in OpenFOAM. Microgravity Sci. Technol. 2015, 27, 231–243. [Google Scholar] [CrossRef]
  29. Zhou, Z.-F.; Lu, G.-Y.; Chen, B. Numerical study on the spray and thermal characteristics of R404A flashing spray using OpenFOAM. Int. J. Heat Mass Transf. 2018, 117, 1312–1321. [Google Scholar] [CrossRef]
  30. Liao, Y.; Lucas, D. Computational modelling of flash boiling flows: A literature survey. Int. J. Heat Mass Transf. 2017, 111, 246–265. [Google Scholar] [CrossRef]
  31. Price, C.; Hamzehloo, A.; Aleiferis, P.; Richardson, D. Numerical modelling of droplet breakup for flash-boiling fuel spray predictions. Int. J. Multiph. Flow 2020, 125, 103183. [Google Scholar] [CrossRef]
  32. Gerbino, F.; Tretola, G.; Morgan, R.; Atkins, P.; Vogiatzaki, K. Influence of the initial droplet distribution on the prediction of spray dynamics in Eulerian-Lagrangian simulations. Int. J. Multiph. Flow 2021, 141, 103642. [Google Scholar] [CrossRef]
  33. Liu, K.; Moore, C.; Balachandar, S. A physics-based advanced Euler-Lagrange framework for droplet-droplet interaction in dense spray systems. In Proceedings of the ILASS-Americas 30th Annual Conference on Liquid Atomization and Spray Systems, Tempe, AZ, USA, 12–15 May 2019. [Google Scholar]
  34. Balachandar, S. A scaling analysis for point–particle approaches to turbulent multiphase flows. Int. J. Multiph. Flow 2009, 35, 801–810. [Google Scholar] [CrossRef]
  35. Reitz, R.D. Modeling atomization processes in high-pressure vaporizing sprays. At. Spray Technol. 1987, 3, 309–337. [Google Scholar]
  36. Adachi, M.; McDonell, V.G.; Tanaka, D.; Senda, J.; Fujimoto, H. Characterization of Fuel Vapor Concentration Inside a Flash Boiling Spray; 0148-7191; SAE Technical Paper: Warrendale, PA, USA, 1997; p. 970871. [Google Scholar] [CrossRef]
  37. Sungkom, R.; Derksen, J.J.; Khinast, J.G. Modeling of aerated stirred tanks with shear-thinning power law liquids. Int. J. Heat Fluid Flow 2012, 36, 153–166. [Google Scholar] [CrossRef]
  38. Dapelo, D.; Bridgeman, J. Computational fluid dynamics modelling of unconfined gas mixing of wastewater sludge in a full scale anaerobic digester. In Proceedings of the Fifteenth International Conference on Civil, Structural and Environmental Engineering Computing; Civil-Comp Press: Stirlingshire, UK, 2015; 270 p. [Google Scholar] [CrossRef]
Figure 1. Schematic diagram of the computational domain.
Applsci 12 12899 g001
Figure 2. Spray tip penetration for various grid sizes.
Applsci 12 12899 g002
Figure 3. Comparison of droplet diameter distribution between experiment and simulation. (a) Droplet diameter distribution of spray 5 mm away from the nozzle exit; (b) Droplet diameter distribution of spray 80 mm away from the nozzle exit.
Applsci 12 12899 g003
Figure 4. Experimental and numerical results of spray patterns with different injection pressures and temperatures (The left parts of spray images are simulation results; the right parts of spray images are experimental results).
Applsci 12 12899 g004
Figure 5. Overall spray morphology of iso-pentane flashing spray at varied T i n j (50–80 °C) and P i n j (1.2–2.1 MPa).
Applsci 12 12899 g005
Figure 6. Variation of penetration distance with initial injection pressure and temperature. (a) gas diffusion length; (b) droplet penetration distance.
Applsci 12 12899 g006
Figure 7. Temperature of gas phase and vapor concentration distributions of gas phase under the condition of initial injection temperature of 60 °C and pressure of 1.5 MPa. (a) Gas temperature distribution; (b) Vapor concentration distribution.
Applsci 12 12899 g007
Figure 8. Effects of injection temperature and pressure on the variation of droplet D32 diameter along spray central axis. (a) Effect of Tinj on D32 variation under Pinj = 1.5 MPa; (b) Effect of Pinj on D32 variation under Tinj = 60 °C.
Applsci 12 12899 g008
Figure 9. Effects of injection temperature and pressure on the variation of droplet D32 diameter along spray’s radial direction. (a) Effect of Tinj on D32 variation under Pinj = 1.5 MPa; (b) Effect of Pinj on D32 variation under Tinj = 60 °C.
Applsci 12 12899 g009
Figure 10. Effects of injection temperature and pressure on the variation of droplet velocity along spray’s central axis. (a) Effect of Tinj on velocity variation under Pinj = 1.5 MPa; (b) Effect of Pinj on velocity variation under Tinj = 60 °C.
Applsci 12 12899 g010
Figure 11. Effects of injection temperature and pressure on the variation of droplet velocity along spray radial direction. (a) Effect of Tinj on velocity variation under Pinj = 1.5 MPa; (b) Effect of Pinj on velocity variation under Tinj = 60 °C.
Applsci 12 12899 g011
Table 1. Initial parameters for numerical study.
ParametersValue
Ambient temperature (K)300
Ambient pressure (MPa)0.1
Iso-pentane initial temperature (°C)50, 60, 70, and 80
Iso-pentane inject pressure (MPa)1.2, 1.5, 1.8, and 2.1
Diameter of the nozzle (mm)0.6
Duration of injection (ms)10
Maximum droplet diameter (um)60
Minimum droplet diameter (um)0.5
Parcels per second20,000,000
Table 2. Spray cone angles and diameter distribution parameters for injection model.
Inject
Pressure
(MPa)
Inject
Temperature (°C)
Spray Cone
Angle (°)
Distribution
Parameter d
Distribution
Parameter n
1.2508.8210.961.021
1.55011.4610.531.032
1.85018.2310.331.039
2.15021.569.841.045
1.26016.079.551.071
1.56026.669.381.059
1.86027.458.521.033
2.16031.388.560.995
1.27032.168.481.045
1.57036.378.491.014
1.87041.288.481.045
2.17042.498.961.030
1.28045.218.521.023
1.58046.528.351.015
1.88047.208.421.009
2.18047.958.381.012
Publisher’s Note: MDPI stays neutral with regard to jurisdictional claims in published maps and institutional affiliations.

