1. Introduction
Object detection is one of the most important fields in computer vision, which includes two tasks: object classification and object localization. Object localization generally refers to using a rectangular bounding box to frame the location of an object, which is also called bounding box regression. Bounding box regression is one of the most basic components of object detection algorithms.
At present, most research enhances the application performance by proposing a better network structure [
1,
2,
3,
4] or improving the optimizer [
5,
6,
7,
8]. In addition, loss function [
9,
10,
11,
12,
13] is also a good direction for improvement. The loss function, or cost function, is used to evaluate the inconsistency between the predicted value and the true value. The optimization process of the neural network is the process of minimizing the loss function. The smaller the loss function is, the better the network performs. In object detection algorithms, loss functions include regression loss function and classification loss function. For the regression loss function, most of the existing methods use MSE Loss [
14], the
-norm Loss, and so on to perform bounding box regression. Yet, the actual indicator for evaluating regression box detection is IoU [
15], while the
-norm Loss is not equivalent. Some detection boxes may have the same size of
-norm Loss, but IoU may vary greatly. Therefore, most studies use a series of IoU Losses instead of other regression losses. For example, the MSE Loss function is replaced by the CIoU Loss function in the YOLOv4 algorithm.
Although IoU Loss is well equivalent to the index of regression box detection, when the ground truth detection box and the predicted detection box do not intersect, the loss of IoU is 0 and there is no gradient backpropagation, which makes the process of learning and training impossible. Besides, it is difficult for the IoU Loss to precisely represent the overlap ratio and to accurately judge the regression effect of the overlapping area alone. Hence, in recent years, people have conducted in-depth research on IoU Loss, and successively proposed the GIoU Loss [
16]. GIoU Loss eliminates the risk of loss becoming 0 by introducing the concept of a minimum closure area to solve the problem that IoU is not sensitive to the scale of the target object and unable to directly optimize the condition that the ground truth detection box does not overlap with the predicted detection box. Different from IoU Loss, GIoU Loss not only pays attention to overlapping areas, but also to other non-overlapping areas, which better reflects the overlap ratio.
GIoU Loss is able to make up for the deficiencies of IoU. Unfortunately, it is hard for GIoU to improve the instability of the regression box in the training process. At the same time, when the ground truth detection box completely overlaps with the predicted detection box, GIoU Loss is unable to accurately obtain the exact positions of the two; that is, the overlap ratio of the two remains unchanged, so that GIoU Loss completely degenerate to IoU Loss. Therefore, Wang et al. [
17] put forward the more advanced DIoU Loss and CIoU Loss. This kind of loss is more suitable for the bounding box regression mechanism than GIoU Loss. The area problem is normalized to the distance problem, and the regression is faster and more stable by combining the aspect ratio. However, the calculation process of DIOU Loss function only includes the overlapping area and center distance of the the ground truth detection box and the predicted detection box, which ignores the aspect ratio of the two boxes.The aspect ratio of CIOU describes the relative value, which has some ambiguity and does not consider the balance of difficult samples.
In this paper, we propose a NGIoU Loss by adding a new bounding box for bounding box regression, which is different from the approach of introducing the distance and aspect ratio of CIoU Loss and DIoU Loss. When the two boxes overlap, the new bounding box well replaces the containing box and carries out a series of calculations. In this manner, the overlap ratio will be obtained, and the risk of GIoU Loss degenerating into IoU Loss will be eliminated. Inspired by the distance normalization in the DIoU Loss, the coefficient of then penalty term in overlapping is adjusted appropriately. The NGIoU Loss is easily incorporated into the state-of-the-art object detection algorithms. In addition, NGIoU Loss will be employed as a criterion in non-maximum suppression (NMS), which is similar to CIoU and DIoU.
In the experiments, NGIoU Loss has been applied to several algorithms, such as YOLOv4 [
18,
19], YOLOv5, SSD [
20,
21,
22,
23], and YOLACT [
24]. Moreover, NGIoU Loss is evaluated on two popular benchmark datasets PASCAL VOC 2007 (Everingham et al. [
20]) and MS COCO 2017 (Lin et al. [
25]).
The work contribution is summarized as follows: (1) A new bounding box is added. The NGIoU Loss works efficiently even though the overlap ratio of the two remains unchanged. (2) The coefficient of penalty term in overlapping is adjusted appropriately. The NGIoU Loss has a better performance than GIoU and DIoU. (3) Different regression functions are used to compare diverse object detection algorithms under different baselines to verify the effectiveness of the algorithm.
2. Related Work
2.1. Object Detection
For a long time, the bounding box regression has been adopted as an essential component in many representative object detection frameworks [
26].These detectors are divided into two categories: one-stage detectors and two-stage detectors. A separate module with generation region proposals is called a two-stage detector (e.g., R-CNN series [
27,
28,
29]). The process of creating a region proposal, also known as the first stage, attempts to develop a series of candidate boxes to screen these regions that may contain objects. The candidates are also generated, which are assisted in subsequent work detection tasks in the second stage. Compared with two-stage detectors, the efficiency of one-stage detectors(e.g., SSD series) is greatly improved, although at the expense of accuracy.
2.2. Loss Function for Bounding Box Regression
Loss function, for bounding box regression, plays a significant role in object detection. The
-norm loss functions are usually used in bounding box regression. They are sensitive to different scales. Early works claim that the L-norm Loss is represented by L1 and L2 losses and assesses the error between the predicted bounding box and the ground truth box by computing the standard deviation or squared deviation between the two. Recent works replace them with IoU-based loss functions. The IoU Loss is the first attempt to include IoU in the regression loss, and it is a success. However, when there is no overlap between the two shapes, the IoU value is 0, so it is hard for the IoU Loss to optimize the regression result. GIoU solves this problem by using closed regions to ensure that the value between two shapes without overlapping regions is not zero, thus greatly improving the reliability of the IoU method. Following GIoU, a number of IoU-based bounding box representations and losses have evolved, including DIoU (which focuses on the distance between two shapes), CIoU (which considers the aspect ratio), PIoU [
30] (which is recommended for the rotating target identification) and Updated-IoU [
31] (which concentrates on the overlap areas and predicts object localization to obtain the higher position accuracy performance). Therefore, we propose NGIoU Loss by adding a new bounding box, which prevents the NGIoU Loss from completely degrading to IoU Loss.
2.3. Non-Maximum Suppression
Common object detection algorithms in recent years end up finding multiple rectangular boxes that may be objects in an image, and then do a category classification probability for each box. Non-maximum suppression means that multiple candidate boxes are obtained by the classifier, and the probability value of the candidate boxes belonging to the category is sorted according to the category classification probability obtained by the classifier.The boxes, whose probability value exceed the threshold value, are deleted, and the remaining boxes are selected with the highest score. Soft-NMS is proposed by Bodla et al. [
21], which adopted a continuous function called IoU. Soft-NMS penalized the detection score of neighbors. The 3D IoU-Net(Li et al. [
32]) includes an Attentive Corner Aggregation (ACA) module by aggregating a local point cloud feature. NGIoU is deployed as a criterion in the non-maximum suppression (NMS) in this work.
2.4. Analysis to IoU and GIoU Losses
Algorithm 1 provides the pseudocode of IoU Loss and GIoU Loss.
IoU is a common indicator for evaluating the regression box detection. As a distance measure, IoU has the characteristics of non-negative, scale invariance, identity, symmetry, triangle inequality and so on. and losses are designed to calculate and add the losses of the four coordinates of the regression box, respectively, which may ignore their associativity and is hard to adapt to the evaluation indicator, IoU.
Therefore, for two-dimensional object detection tasks, it is best to use IoU as the objective function. Between optimizing the indicator itself and replacing the loss function, the former is the best choice. Nevertheless, if IoU is directly used as the loss function, the training may not converge. As observed by line 6 of Algorithm 1, when the predicted regression box and the ground truth regression box have no intersection, that is, , and IoU is 0, there is no moving gradient to carry out learning and training. Meanwhile, the scale invariance of IoU will make the IoU Loss unable to accurately describe the overlap ratio of the predicted regression box and the ground truth regression box .
In view of the aforementioned shortcomings of the IoU Loss, Rezatofighi et al. [
16] proposed GIoU Loss. GIoU introduces the minimum closed convex shape
that surrounds the predicted regression box and the ground truth regression box when there is no overlap. From line 7 of Algorithm 1, GIoU adds a penalty term
on the basis of IoU. When the intersection of the two boxes is 0, GIoU still accurately measures the distance between them. It is observed by line 8 of Algorithm 1 that when the intersection is 0,
will fall into a platform area and no moving gradient is provided, while the penalty term of
will make the predicted box move to the ground truth box and speed up the regression.
| Algorithm 1 IoU and GIoU Loss function |
- Input:
The predicted regression box and the ground truth regression box . , . - Output:
IoU Loss, GIoU Loss. - 1:
Condition: Guarantee . - 2:
The area of the predicted regression box and the ground truth regression box is as follows: . - 3:
The intersection C of the predicted regression box and the ground truth regression box: The upper left coordinate of C: , , . The lower right coordinate of C: , , . Area: . - 4:
The union D of the predicted regression box and the ground truth regression box: Area: . - 5:
The minimum closed convex shape surrounding the predicted regression box and the ground truth regression box : The upper left coordinate of : , , . The lower right coordinate of : , , . Area: . - 6:
. - 7:
. - 8:
, .
|
Although GIoU alleviates the non-overlapping problem of IoU, when the predicted regression box and the ground truth regression box completely overlap, the minimum closed convex shape surrounding the predicted regression box, and the ground truth regression box is equal to the larger regression box. Then, the penalty term is 0, the GIoU Loss will degenerate into IoU Loss. Thereby, GIoU is unable to obtain the overlap ratio between the predicted regression box and the ground truth regression box.
3. NGIoU Loss
Aiming at the aforementioned problem of GIoU Loss, this paper proposes a New Generalized Intersection over Union (NGIoU) Loss based on a new bounding box regression. Algorithm 2 demonstrates the novel loss function, as follows.
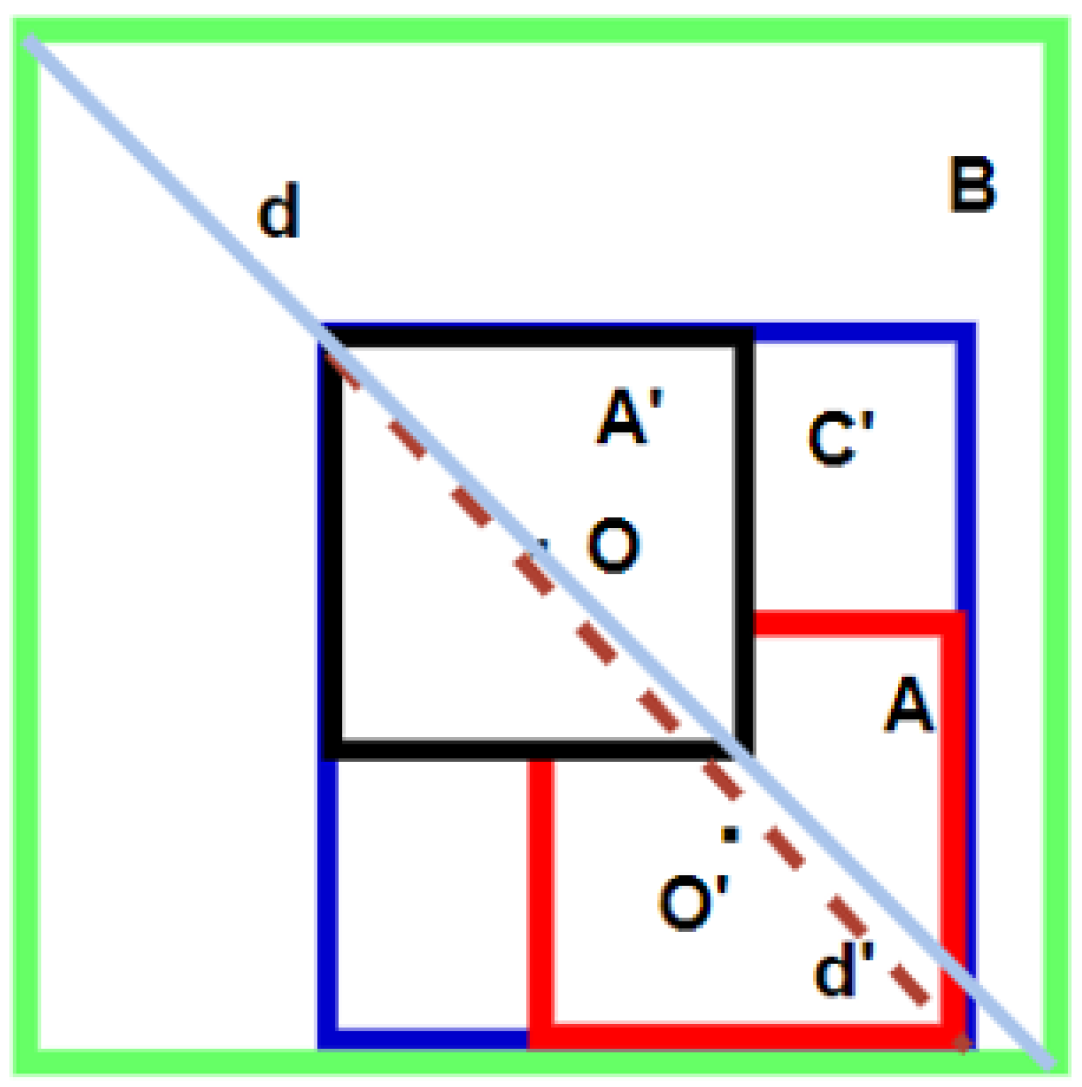
The core of this algorithm is line 7 of Algorithm 2. NGIoU Loss is explained in
Figure 1. Where,
and B share the center O.
is the center of A, d is the line segment connecting the upper left corner and the lower right corner of figure B, and
is the line segment connecting the upper left corner and the lower right corner of
.
As observed in
Figure 1, when
,
, the penalty term
in line 5 makes
. It means that IoU stays unchanged and equals to
, so that the loss is constant and no moving gradient is obtained. Thus, we make a congruent figure
with A centered on the center O of B. The positional relationship between B and A is replaced by that between
and A, that is, the penalty term calculated by A and
is used to substitute for the penalty term 0 of A and B. As the penalty term is no longer 0, in the case of overlapping, the predicted regression box will move to the ground truth regression box, speeding up the regression of the bounding box.
| Algorithm 2 NGIoU bounding box loss function |
- Input:
The predicted regression box A and the ground-truth regression box B. - Output:
NGIoU Loss - 1:
Find the smallest closed convex shape C surrounding A and B. - 2:
If , add a new bounding box D that has the same center as B and is congruent with A, and find the smallest closed convex shape surrounding A and D. The line between the upper left corner and the lower right corner of is . - 3:
If , add a new bounding box D that has the same center as A and is congruent with B, and find the smallest closed convex shape surrounding A and D. The line between the upper left corner and the lower right corner of is . - 4:
The line between the upper left corner and the lower right corner of A is . The line between the upper left corner and the lower right corner of B is . - 5:
. - 6:
. - 7:
where, . - 8:
.
|
DIoU Loss takes into account the distance between the center points of the regression box and the object, and uses the ratio of the Euclidean distance between the center points of the two boxes. The minimum length of the diagonal enclosing the two boxes is used to replace the penalty term of GIoU, which makes the regression faster, more effective and more stable. It is observed from
Figure 1 that when two boxes overlap, by replacing B with
, the diagonal length is changed from d to
. The length becomes shorter, but the Euclidean distance between the center points of the boxes remains unchanged. That is to say, the denominator decreases and the numerator remains unchanged, which makes the whole penalty term larger, the regression unstable and it fluctuates greatly.
Hence, inspired by the distance normalization method in DIoU Loss proposed by Wang [
17], we adjust the coefficient of the penalty term in the case of the overlapping. The definition of scale factor
is as follows:
where
o and
are the center points,
is the Euclidean distance,
is the diagonal length of the smallest closed box covering the two boxes. Since the condition discussed here is overlapping,
is the diagonal length of B and
is the diagonal length of A. Similarly,
is obtained by adding the bounding box.
The following figures show IoU Loss, GIoU Loss, and NGIoU Loss at different positions when the predicted regression box overlaps with the ground-truth regression box.
As observed from
Figure 2, when A is in the different positions within B, IoU Loss and GIoU Loss remain unchanged. It means that the moving gradient is unable to be obtained and the regression speed decreases. Nevertheless, NGIoU Loss decreases continuously as A approaches B until the center points of A and B overlap, as shown in
Figure 2c. According to
Figure 1, when the center points of A and B coincide and
and A completely overlap, the minimum closed convex shape surrounding A and
is
. At this time, the penalty term of NGIoU becomes 0, and the NGIoU Loss is equal to GIoU Loss and IoU Loss.
To sum up, NGIoU Loss retains the characteristics of GIoU Loss, but modifies its shortcomings. Thereby, NGIoU Loss is used as a substitute for GIoU Loss in computer vision tasks, which provides a new and effective algorithm for a series of IoU Loss.
4. Experimental Simulation
In this part, NGIoU Loss is applied to the popular two-dimensional object detection task to evaluate the performance. In this paper, YOLOv4, YOLOv5, SSD, and YOLACT are used to train.
As a standard data set, PASCAL VOC Dataset is a benchmark to measure the ability of image classification and recognition, and is also one of the most widely used data sets for classification, object detection, and semantic segmentation. It consists of 9963 images with 24,640 objects. The data are split around 50% train and 50% test, among which objects from 20 predefined categories have been marked with bounding boxes.
MS COCO dataset is a large-scale object detection, segmentation, and captioning data set, which targets the scene understanding. It contains 91 object categories, 328,000 images and 2,500,000 labels. Up to now, it is the largest semantic segmentation data set, with 80 categories and more than 330,000 images. Compared with the PASCAL VOC Dataset, the image background of MS COCO is more complex, the number of objects is larger, and the object size is smaller. As a consequence, the task on MS COCO dataset is more difficult. For the detection task, the standard to measure the quality of a model is more inclined to use the detection results on the MS COCO dataset.
In this paper, all the results have been reported using the same performance indicators as the 2018 MS COCO Challenge, which include calculating the mean average precision (mAP) of the specific value of the IoU threshold on different types of labels. The main performance measurement used in this benchmark is shown by AP, which is the average value mapping of different IoU thresholds, that is,
The computer configuration used in the experiment is Intel Core i7-8300H CPU, 8GB RAM, and the GPU is GeForce GTX 2080Ti.
4.1. YOLOv4 Algorithm Based on PASCAL VOC 2007
YOLOv4 algorithm is a popular object detection algorithm of the YOLO series. It has made many improvements in training skills on the basis of YOLOv3, such as the replacement of activation function, improvement of the loss function, and so on. We use some tuning methods of the YOLOv4 algorithm to train. In terms of the network structure, the code uses SPP and PANet structures. In terms of activation function, the currently popular Mish activation function is used to replace the Leaky ReLU function in the YOLOv3 algorithm. At the same time, mosaic data augmentation is used to splice images from the data set.
In this paper, the weights of pre-training on PASCAL VOC 2007 training set are also used to carry out transfer learning. The PASCAL VOC 2007 Dataset is divided into a training set and a validation set according to the ratio of 9:1. A total of 100 epochs are trained, which are divided into two parts. The first 50 epochs freeze partial weights, and the last 50 epochs train after unfreezing.
Table 1 shows the performance comparison of YOLOv4 under different loss functions. The same performance indicators,
,
and
are used.
It is observed from
Table 1 that the CIoU Loss function has the best performance in AP75, and its effect is generally better than the GIoU Loss function. The NGIoU Loss function has the best effect in AP and AP50, 1.15% and 1.82% higher than GIoU. Compared with the CIoU Loss function, NGIoU has a certain competitiveness.
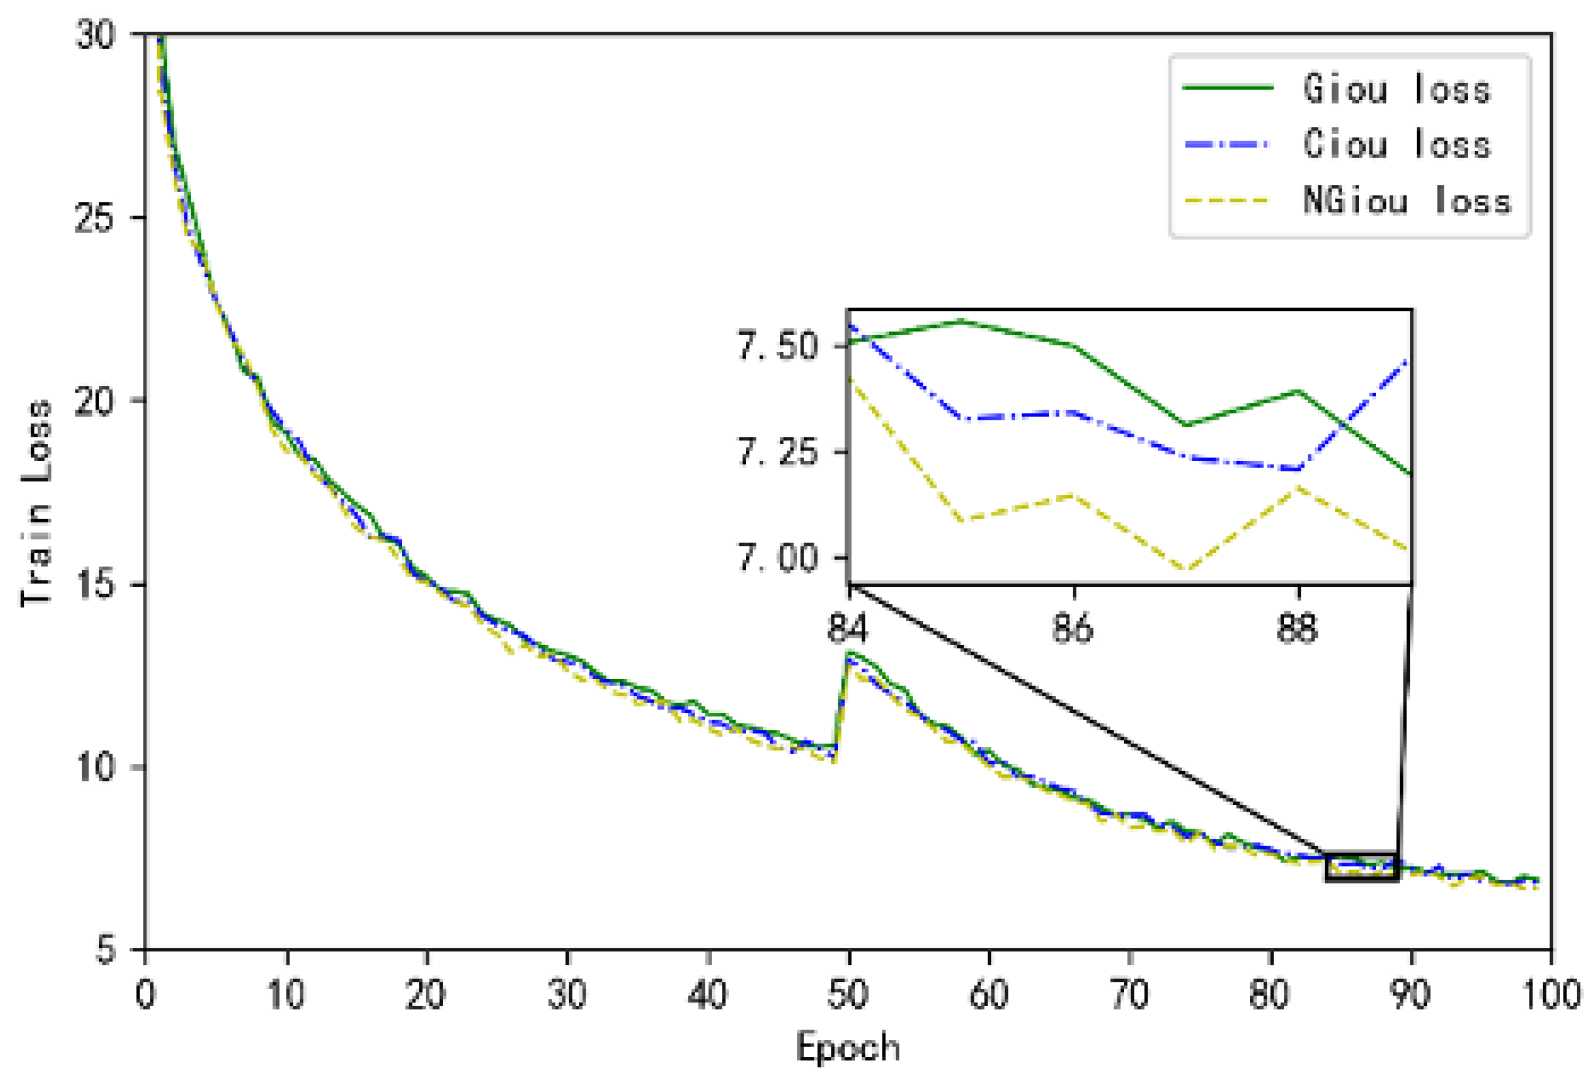
As observed from
Figure 3, the loss function proposed in this paper provides a moving gradient and speeds up the decline of the loss value, thus better compensating for the deficiencies of the GIoU Loss function.
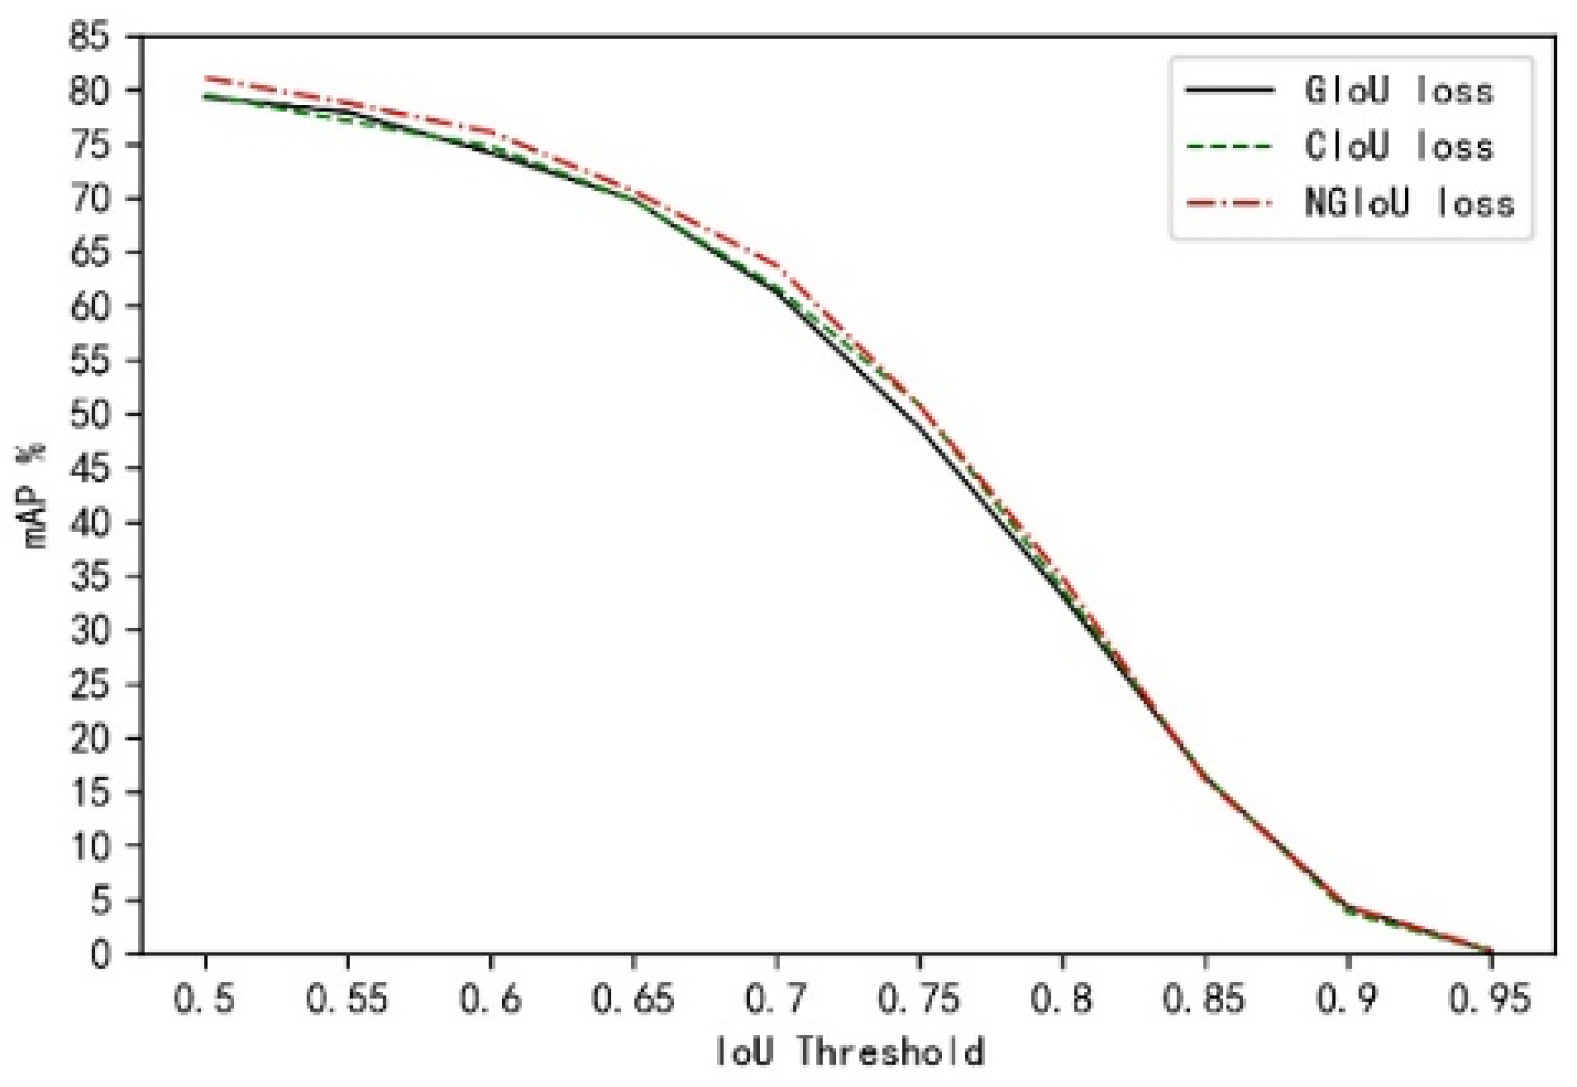
The following
Figure 4 shows the comparison of performance indicator curves of different loss functions under different IoU thresholds. It is observed from
Figure 4 that under different IoU thresholds, the mAP trained by CIoU and GIoU Loss functions is generally higher than that trained by GIoU Loss function. Especially, when IoU thresholds are between 0.6 and 0.8, the mAPs gradually overlap in the later stage. Compared with the CIoU Loss function, the mAP of our algorithm improves a bit, and there is no obvious difference in the mAP until the IoU threshold is 0.75.
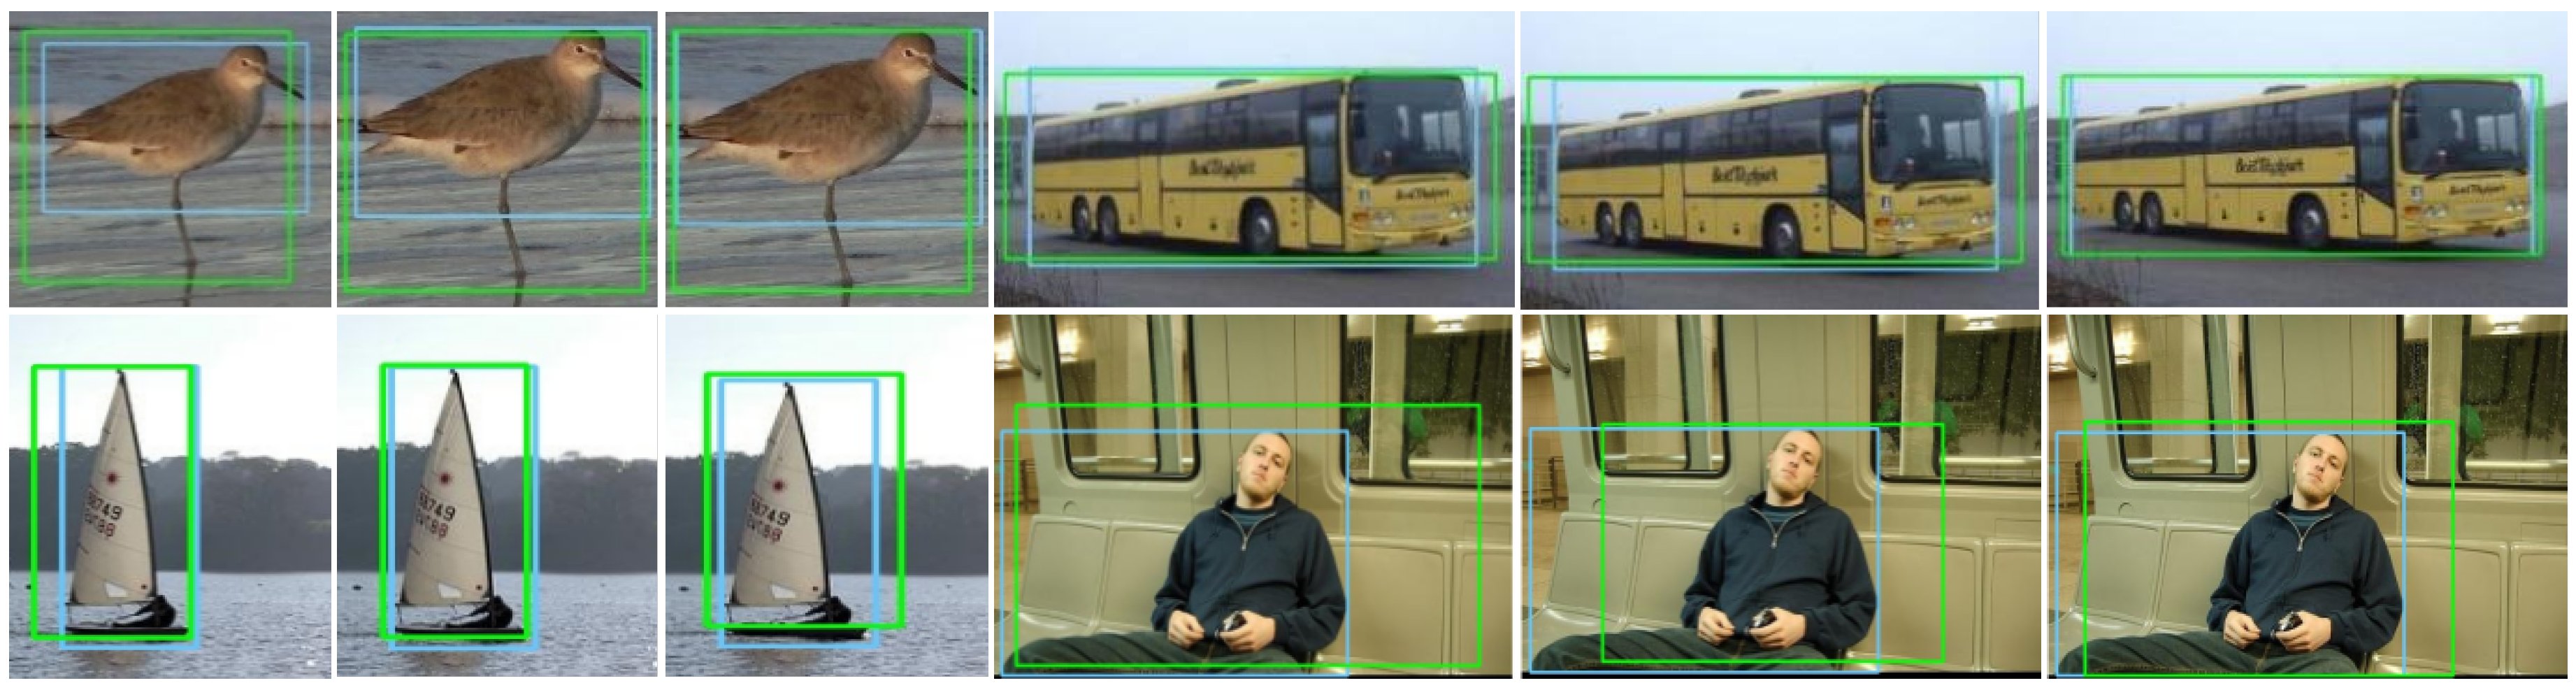
Figure 5 and
Figure 6 show the single object detection results and test results trained with GIoU, CIoU, and NGIoU Loss functions from left to right. Blue boxes in
Figure 5 refer to true values, and green boxes refer to predicted values. It is observed from
Figure 5 that, for different detection objects, the NGIoU Loss proposed in this paper has a higher overlap ratio of target detection and a larger IoU. From
Figure 6, it is observed that the vehicle and people will be detected more accurately by using NGIoU Loss function. Relatively speaking, the use of GIoU Losses may lead to missed and false detection. Accordingly, the NGIoU Loss function based on a new bounding box regression accelerates the regression. It makes up for the deficiency that the GIoU Loss function completely degenerates into the IoU Loss function in the case of bounding boxes completely overlapping, so that the loss obtains moving gradients and separates from the platform area.
4.2. YOLOv5 Algorithm Based on PASCAL VOC 2007
YOLOv5 is slightly inferior to YOLOv4 in performance, but has significantly improved flexibility and speed. YOLOv5 is chosen as the one-stage anchor-based model, which applies Auto Learning Bounding Box Anchors. Backbone is CSPDarknet53, including Focus network structure. A mix of mosaic data augmentation and cutmix data augmentation is used to splice images from the data set. In order to speed up the training efficiency of the model and increase the number of positive samples, during the training, each real box will be predicted by multiple prior bounding boxes, score sorting and non-maximum suppression screening are also used to obtain prediction boxes. The metrics used in the experiments to measure the precision of the method are the mAP (mAP50) and the Recall Rate, which separately measure the precision of detection and the degree of missed detection. The Pytorch framework is used for this experiment. In terms of experimental parameters, the SGD optimizer is used with the Momentum being 0.9, and no weight decay is set. The initial learning rate is set to , and Cosine Annealing LR is used. The batch size is set to 8.
Table 2 shows the results of the various Loss function compared to the YOLOv5 algorithm. It is observed from
Table 2 that the NGIoU Loss function has the highest mAP value (86.79%). The YOLOv5 model with NGIoU Loss function does not achieve the highest ap value when predicting objects of boat, bottle, sheep and other categories. Although the overall ap value is improved, the improvement of NGIoU Loss function has certain limitations. In addition, The network training time with NGIoU loss function is 49 minutes shorter than that with the GIoU Loss function, and has slight advantages over those with the CIoU loss function.
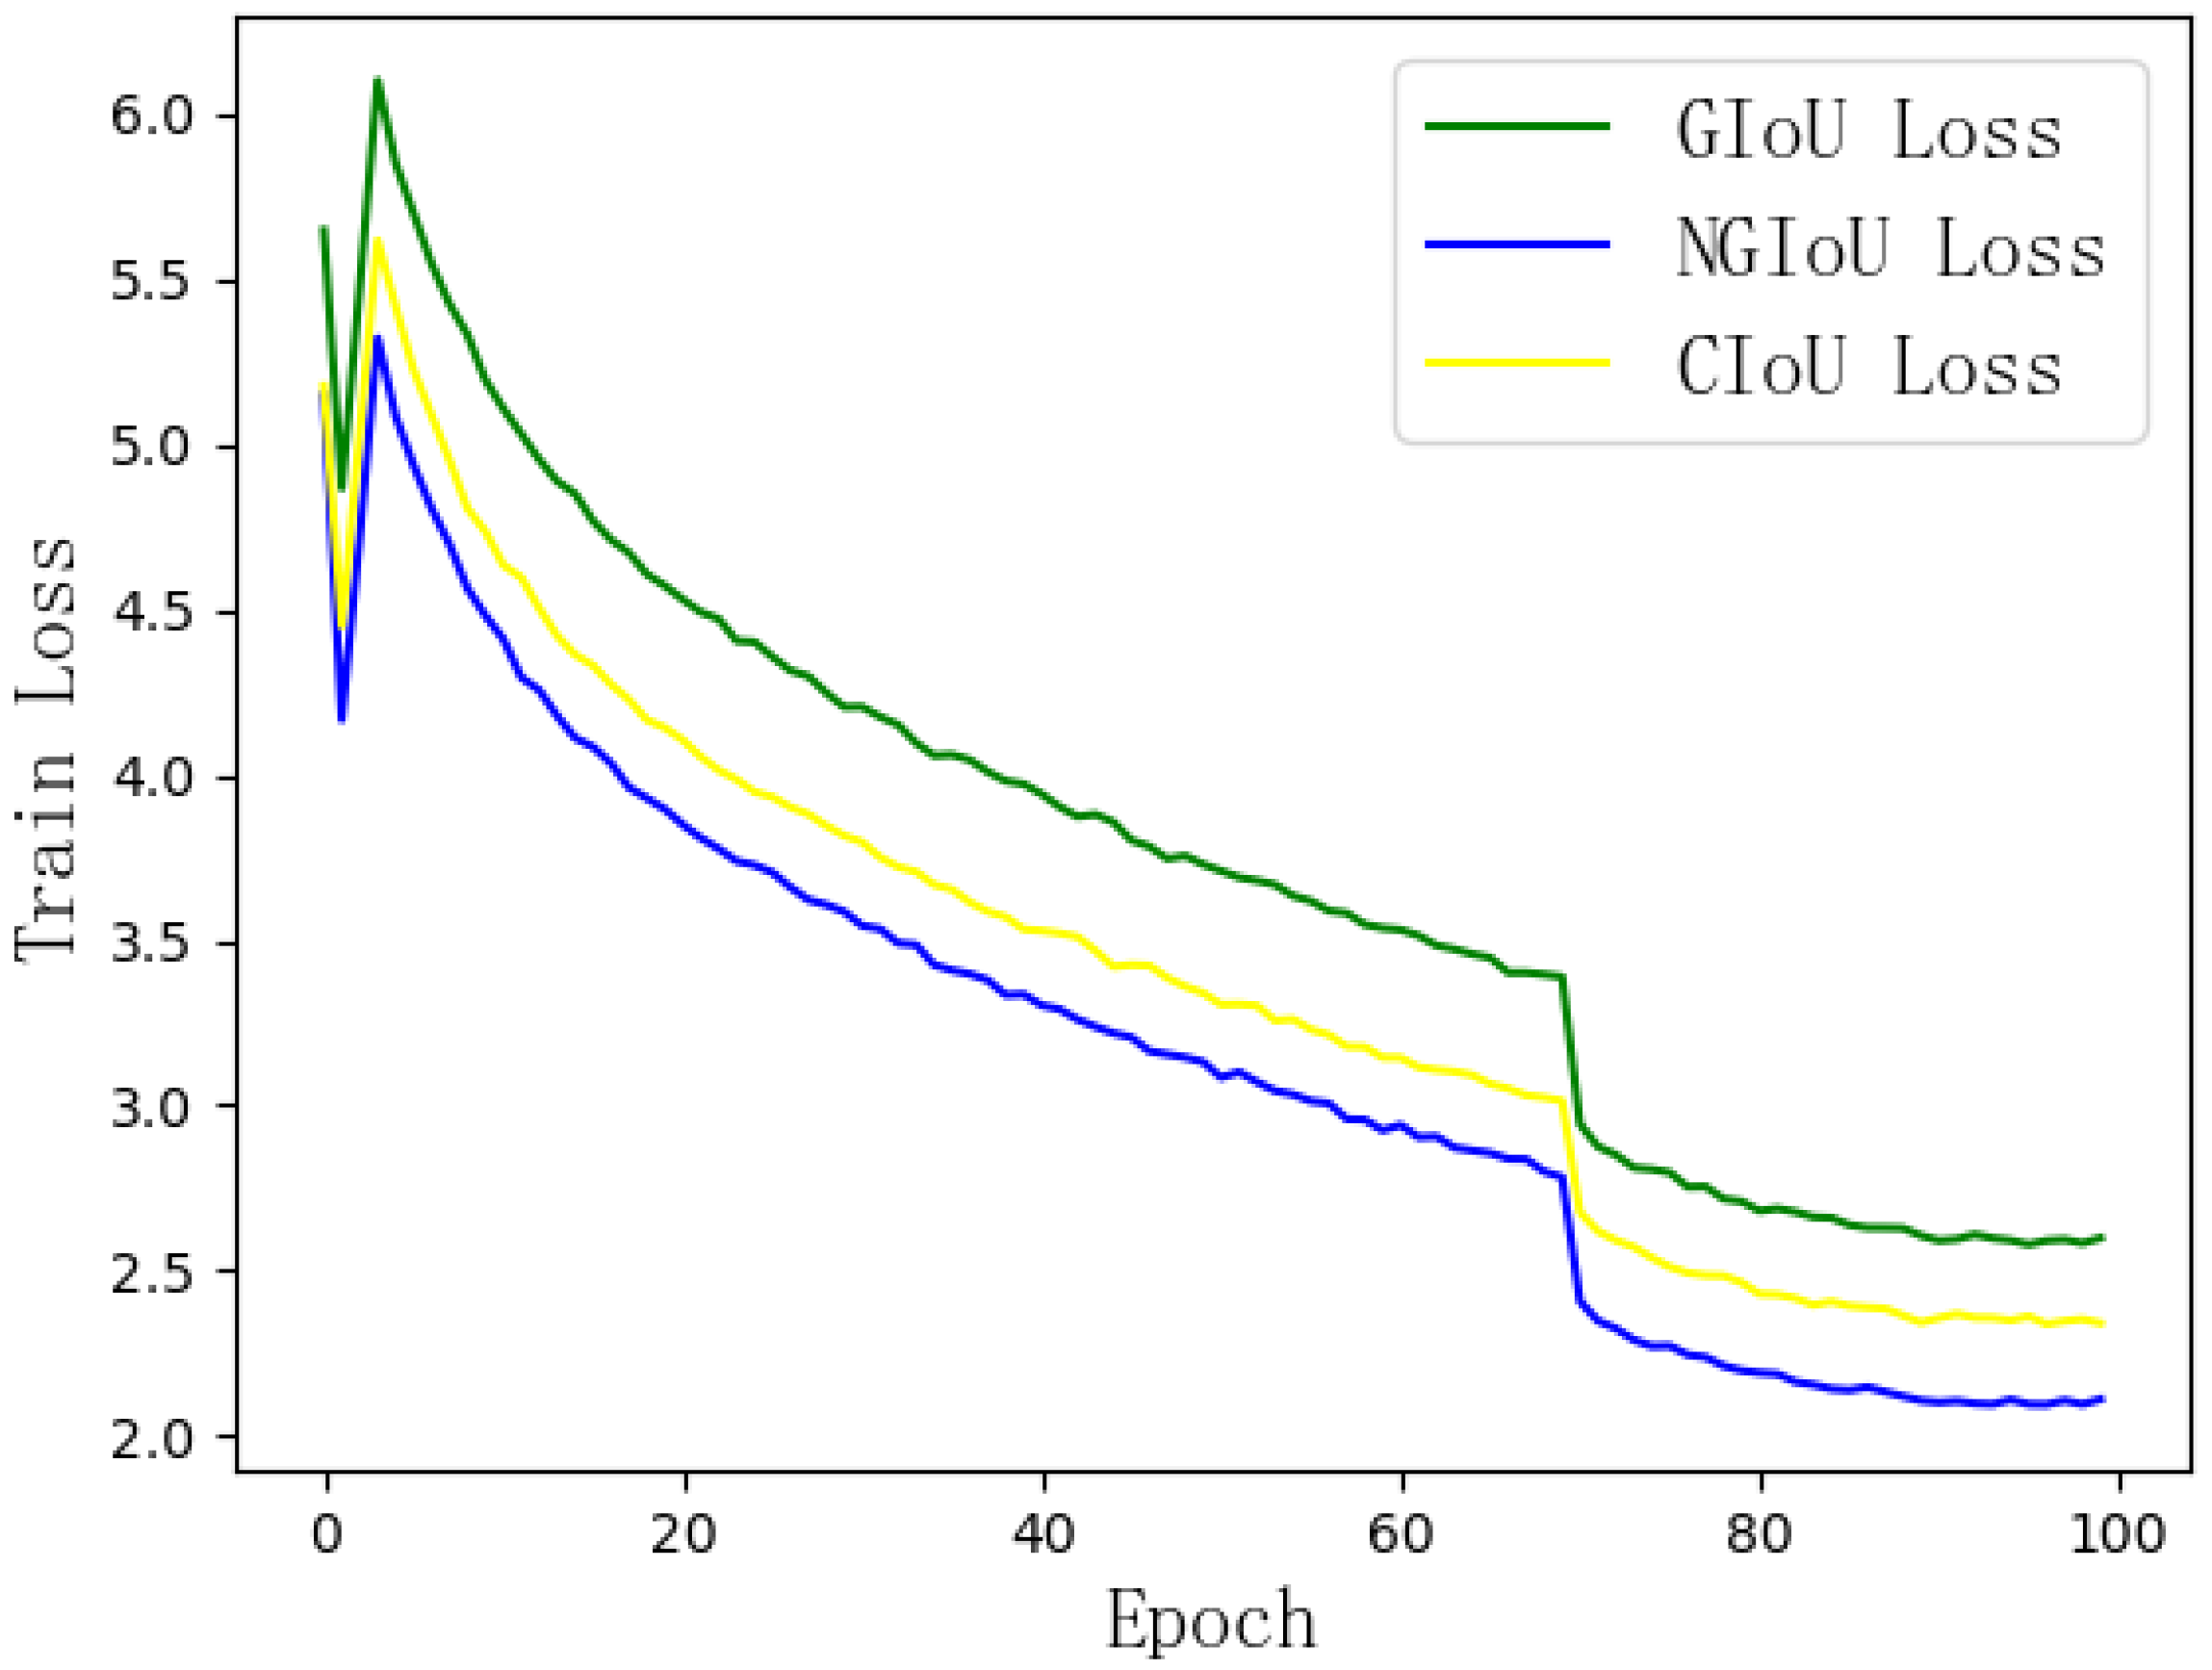
Figure 7 shows the train loss obtained by using different loss functions on the YOLOv5 model. It is clearly observed that the convergence speed of NGIOU Loss is better than that of the CIoU Loss and GIoU Loss, which proves that NGIoU Loss has better performance.
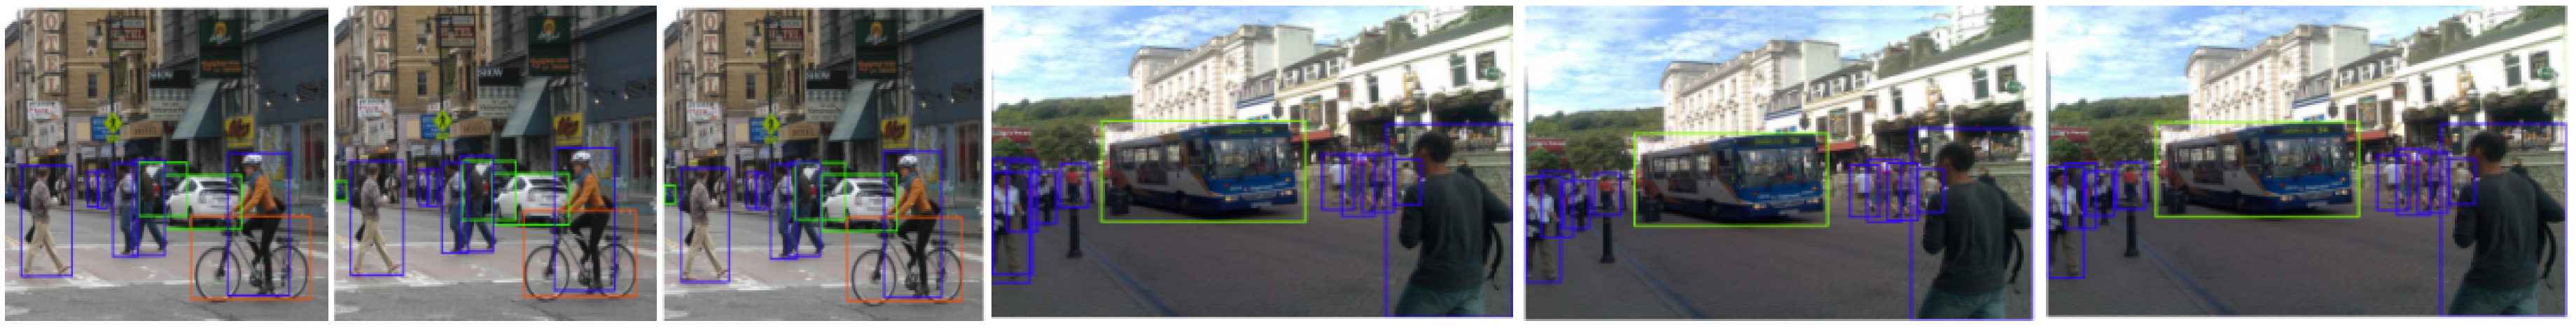
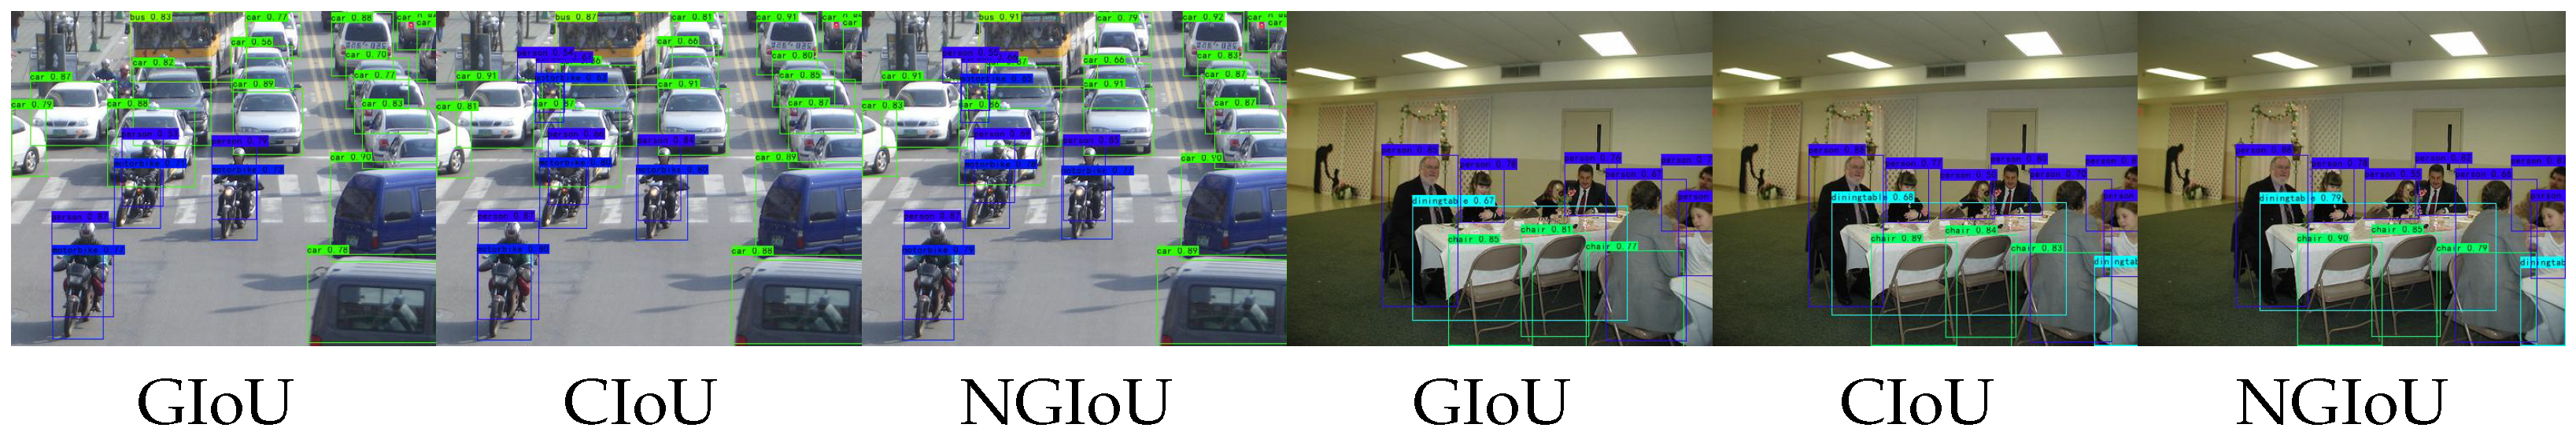
Figure 8 shows object detection results of the predicted boxes trained by using GIoU, CIoU, and NGIoU regression loss functions in the YOLOv5 algorithm. It is observed from the picture that compared with GIoU Loss, NGIou Loss and CIoU Loss are able to predict more objects, even though the overlapping area of the two objects is large. Different from CIoU Loss, the value of the NGIoU prediction box is higher than that of the CIoU prediction box, which proves that the NGIoU Loss has a better performance of prediction.
4.3. SSD Algorithm Based on PASCAL VOC 2007
The SSD algorithm is one of the mainstream one-stage algorithms. Compared with the YOLO algorithm, it is more advantageous in speed. In this paper, 60,000 iterations are performed on the PASCAL VOC 2007 training set and tested on the PASCAL VOC 2007 test set. In order to obtain better training results, this paper carries out transfer learning and uses the pre-trained weights on PASCAL VOC 2007 and 2012 data sets, which are trained by using the Smooth L1 Loss function, GIoU Loss function, and NGIoU Loss function, respectively. The results are shown in the table below.
As observed from
Table 3, regression loss functions of the IoU series are generally higher than Smooth L1 regression losses in AP, as well as 1% higher in AP75. Compared with GIoU Loss, the NGIoU Loss proposed in this paper improves a bit, which verifies the feasibility of the NGIoU Loss.
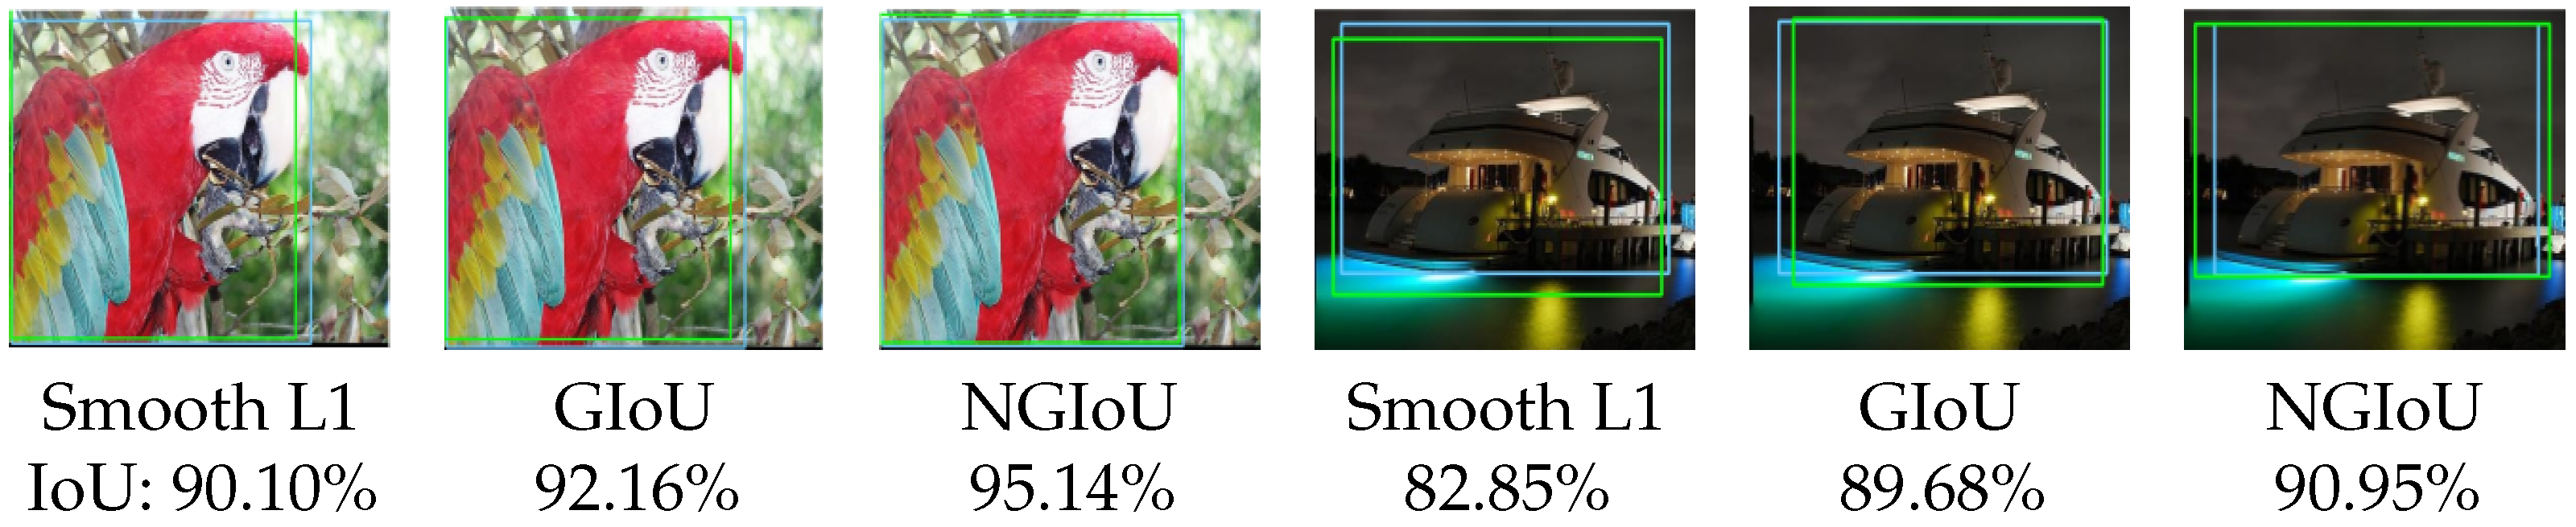
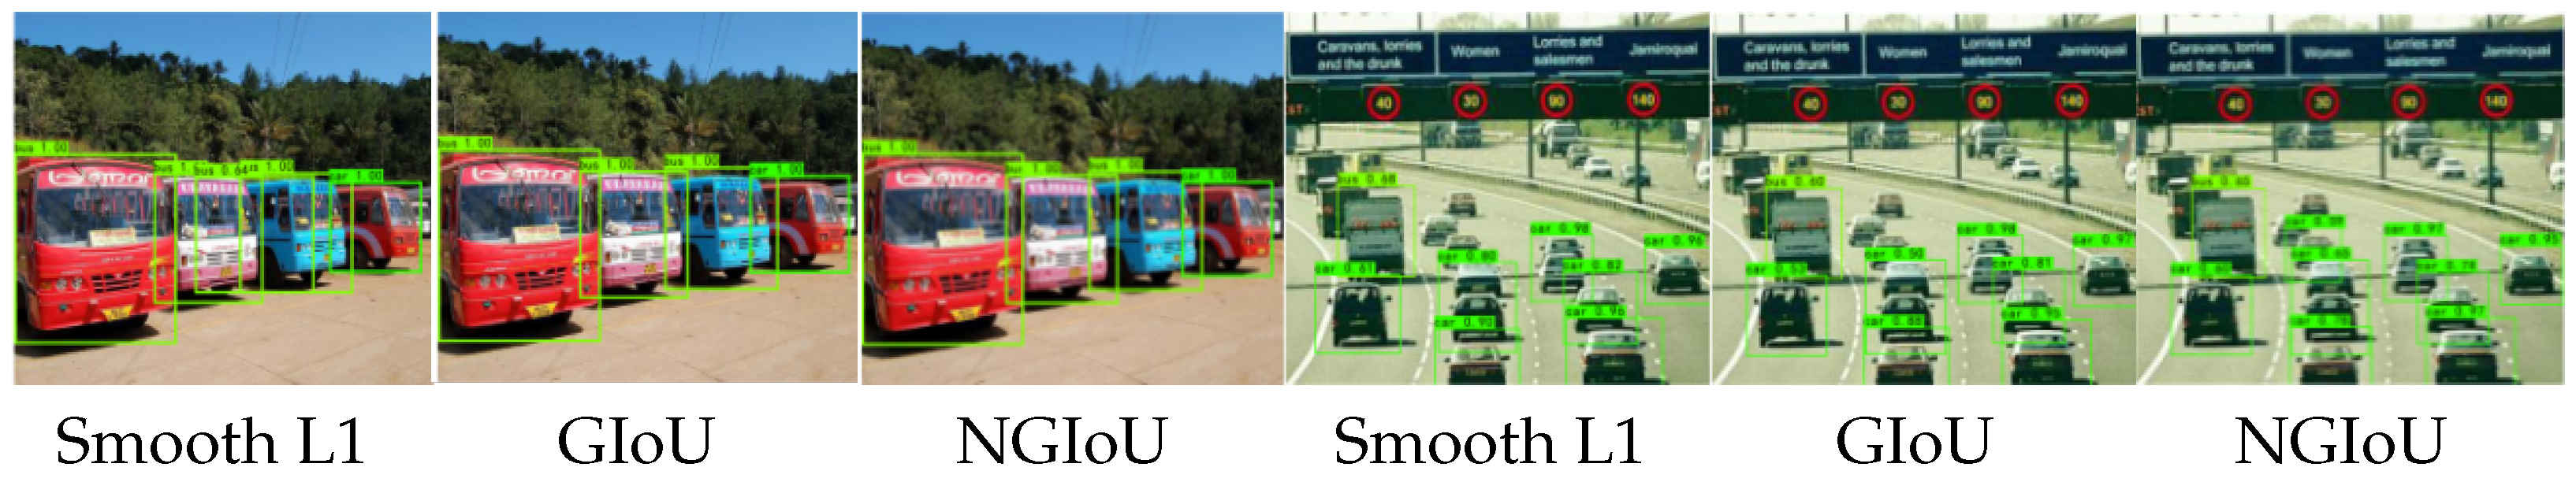
Figure 9 shows the single object detection results of ground truth boxes and predicted boxes trained by using Smooth L1, GIoU, and NGIoU regression loss functions in the SSD algorithm. The figure is marked with the IoU values of ground truth boxes and predicted boxes. Compared with the original Smooth L1 regression loss, the replacement of the IoU series of regression loss functions greatly improves regression accuracy, which will be clearly observed from the figure and the values. In
Figure 10 of the multi-object detection, the Smooth L1 regression loss function is easy to cause missed and false detection, and the IoU series of loss functions improve this situation.
Although the regression loss function proposed in this paper speeds up the regression, provides moving gradients, makes up for the shortcomings of the GIoU Loss function and increases the accuracy of regression positioning, it has some weaknesses. Since the object detection loss function includes regression loss, classification loss, and confidence loss, the improvement of the regression function may affect the accuracy of other aspects. In this paper, only regression accuracy is taken into account, and the influences on classification accuracy and confidence is not considered, as shown in the figure above.
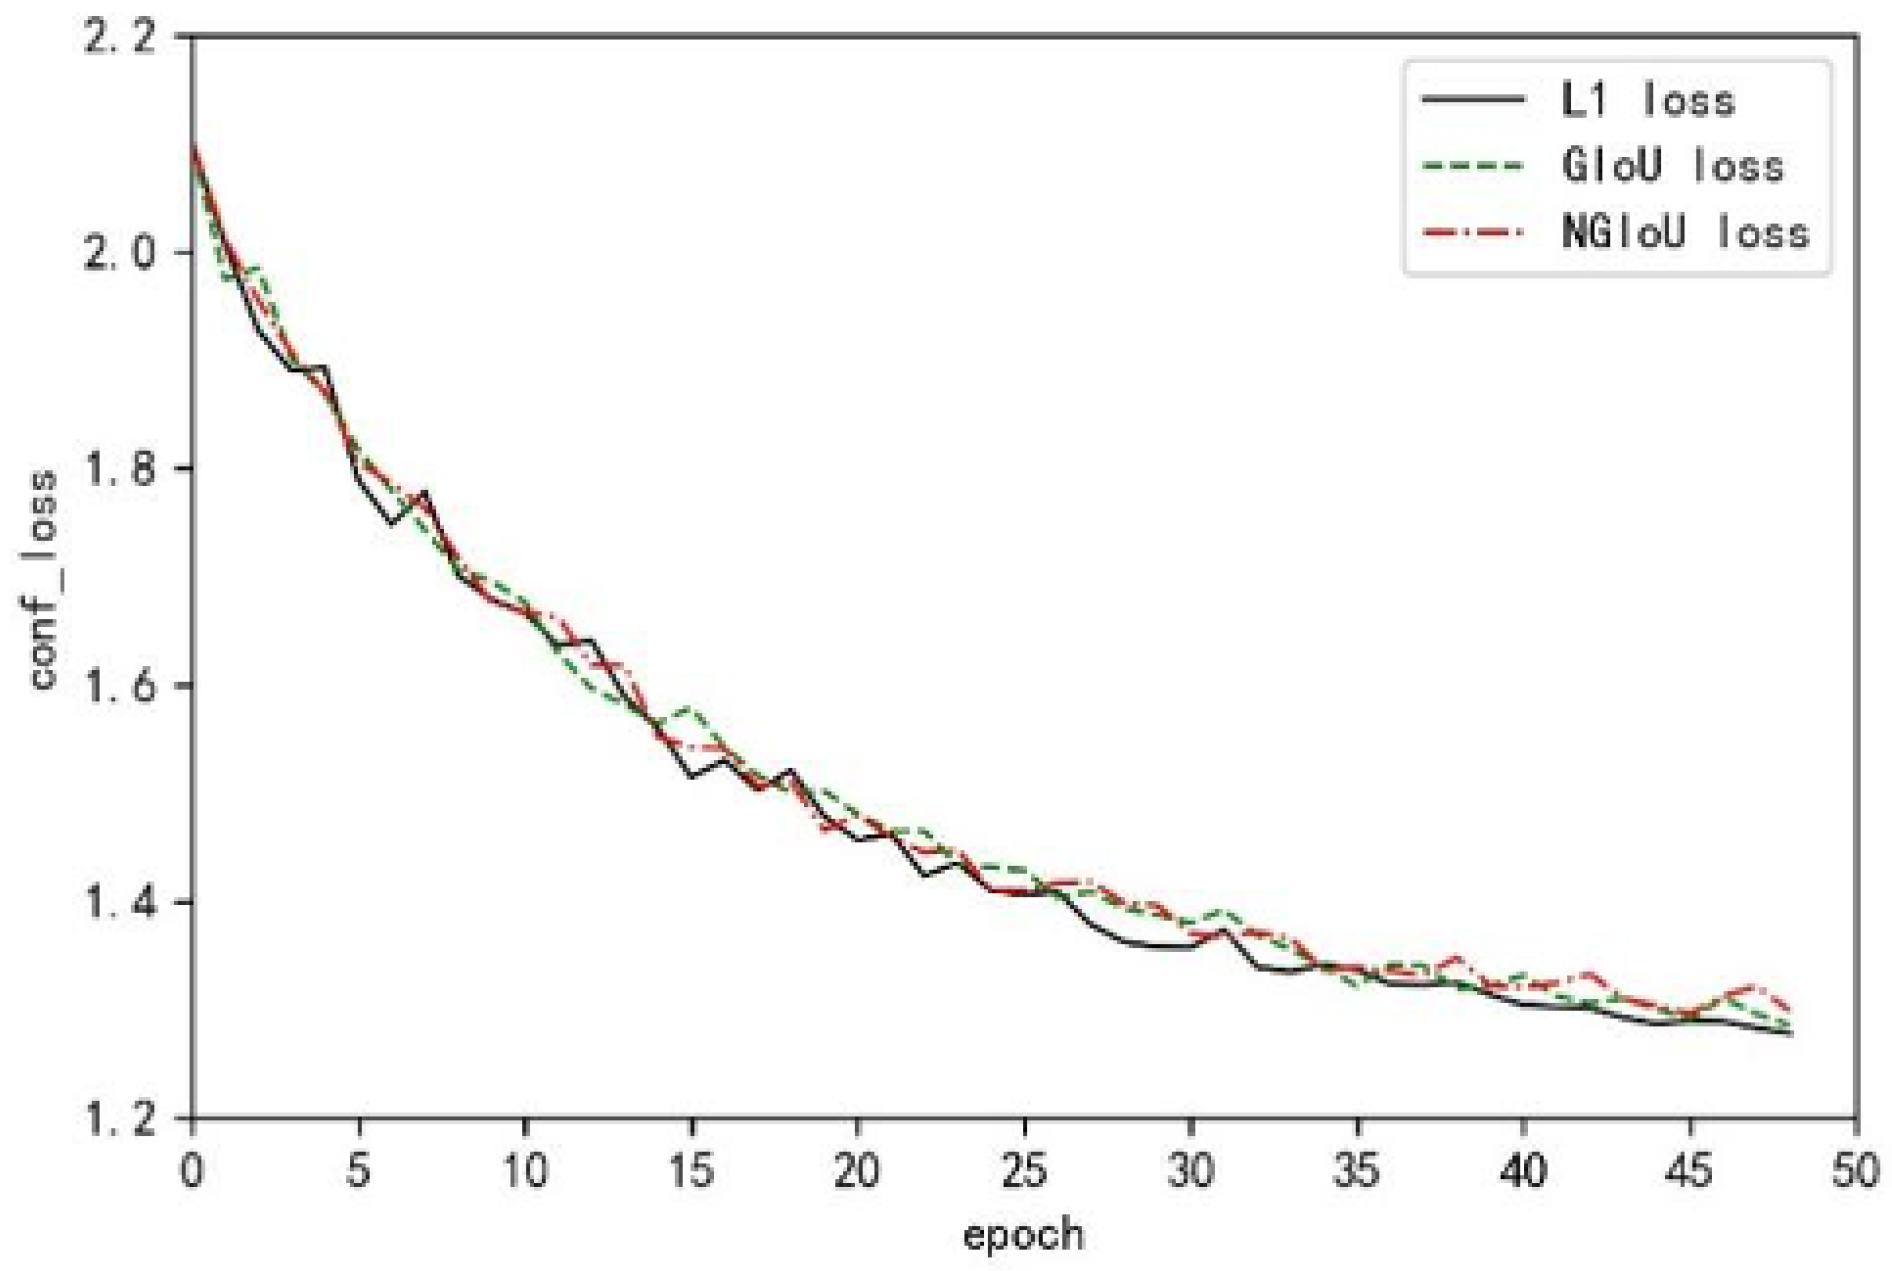
It is observed from
Figure 11 that the confidence loss increases by replacing the regression loss function. When using Smooth L1 Loss function, the loss of confidence is the smallest. When using the IoU series regression loss functions, the confidence loss increases with little difference. From the example of vehicle detection in
Figure 10, it is clear that the confidence of the vehicle detected by NIoU Loss in
Figure 10 (right) is the smallest, and that by the Smooth L1 Loss function is the largest. Meanwhile,
Figure 10 (left) shows little difference. It is explained that the smaller the detection object is, the worse the confidence detection effect of NIoU Loss will be. Nevertheless, for large detection objects, it has little influence.
4.4. YOLACT Algorithm Based on MS-COCO
The YOLACT [
24] algorithm is a simple, fully convolutional model for real-time instance segmentation. It achieves instance segmentation by adding a Mask branch to the one-stage detector. In video detection, YOLACT provides more stable Mask results in the time domain than Mask R-CNN, and achieves a challenging performance on the MS COCO dataset. Therefore, ResNet101-FPN is chosen as the backbone, and the default parameters reported and the number of iterations on each benchmark are used to strictly follow their training protocols. Smooth L1 Loss function, GIoU Loss function, CIoU Loss function, and NGIoU Loss function are used for iterative training on the MS COCO 2017 data set. The performance index AP and
are used to evaluate and compare the performance of the regression box and Mask of the YOLACT algorithm under different loss functions. The results are shown in the following table.
Taking into account the performance measurements based on IoU,
Table 4 shows that the positioning accuracy using the IoU series regression loss functions is generally higher than the benchmark results (using SL1 Losses), reflecting the advantage of the IoU series regression loss functions adapting to IoU detection indicators. In the IoU series regression loss functions, it is observed that the training results of NGIoU Loss proposed in this paper show the optimal performance effect not only in terms of regression but also in terms of segmentation. Although the CIoU Loss has a poor effect on improving the performance of the bounding box regression, it has a good effect on improving the performance of segmentation.
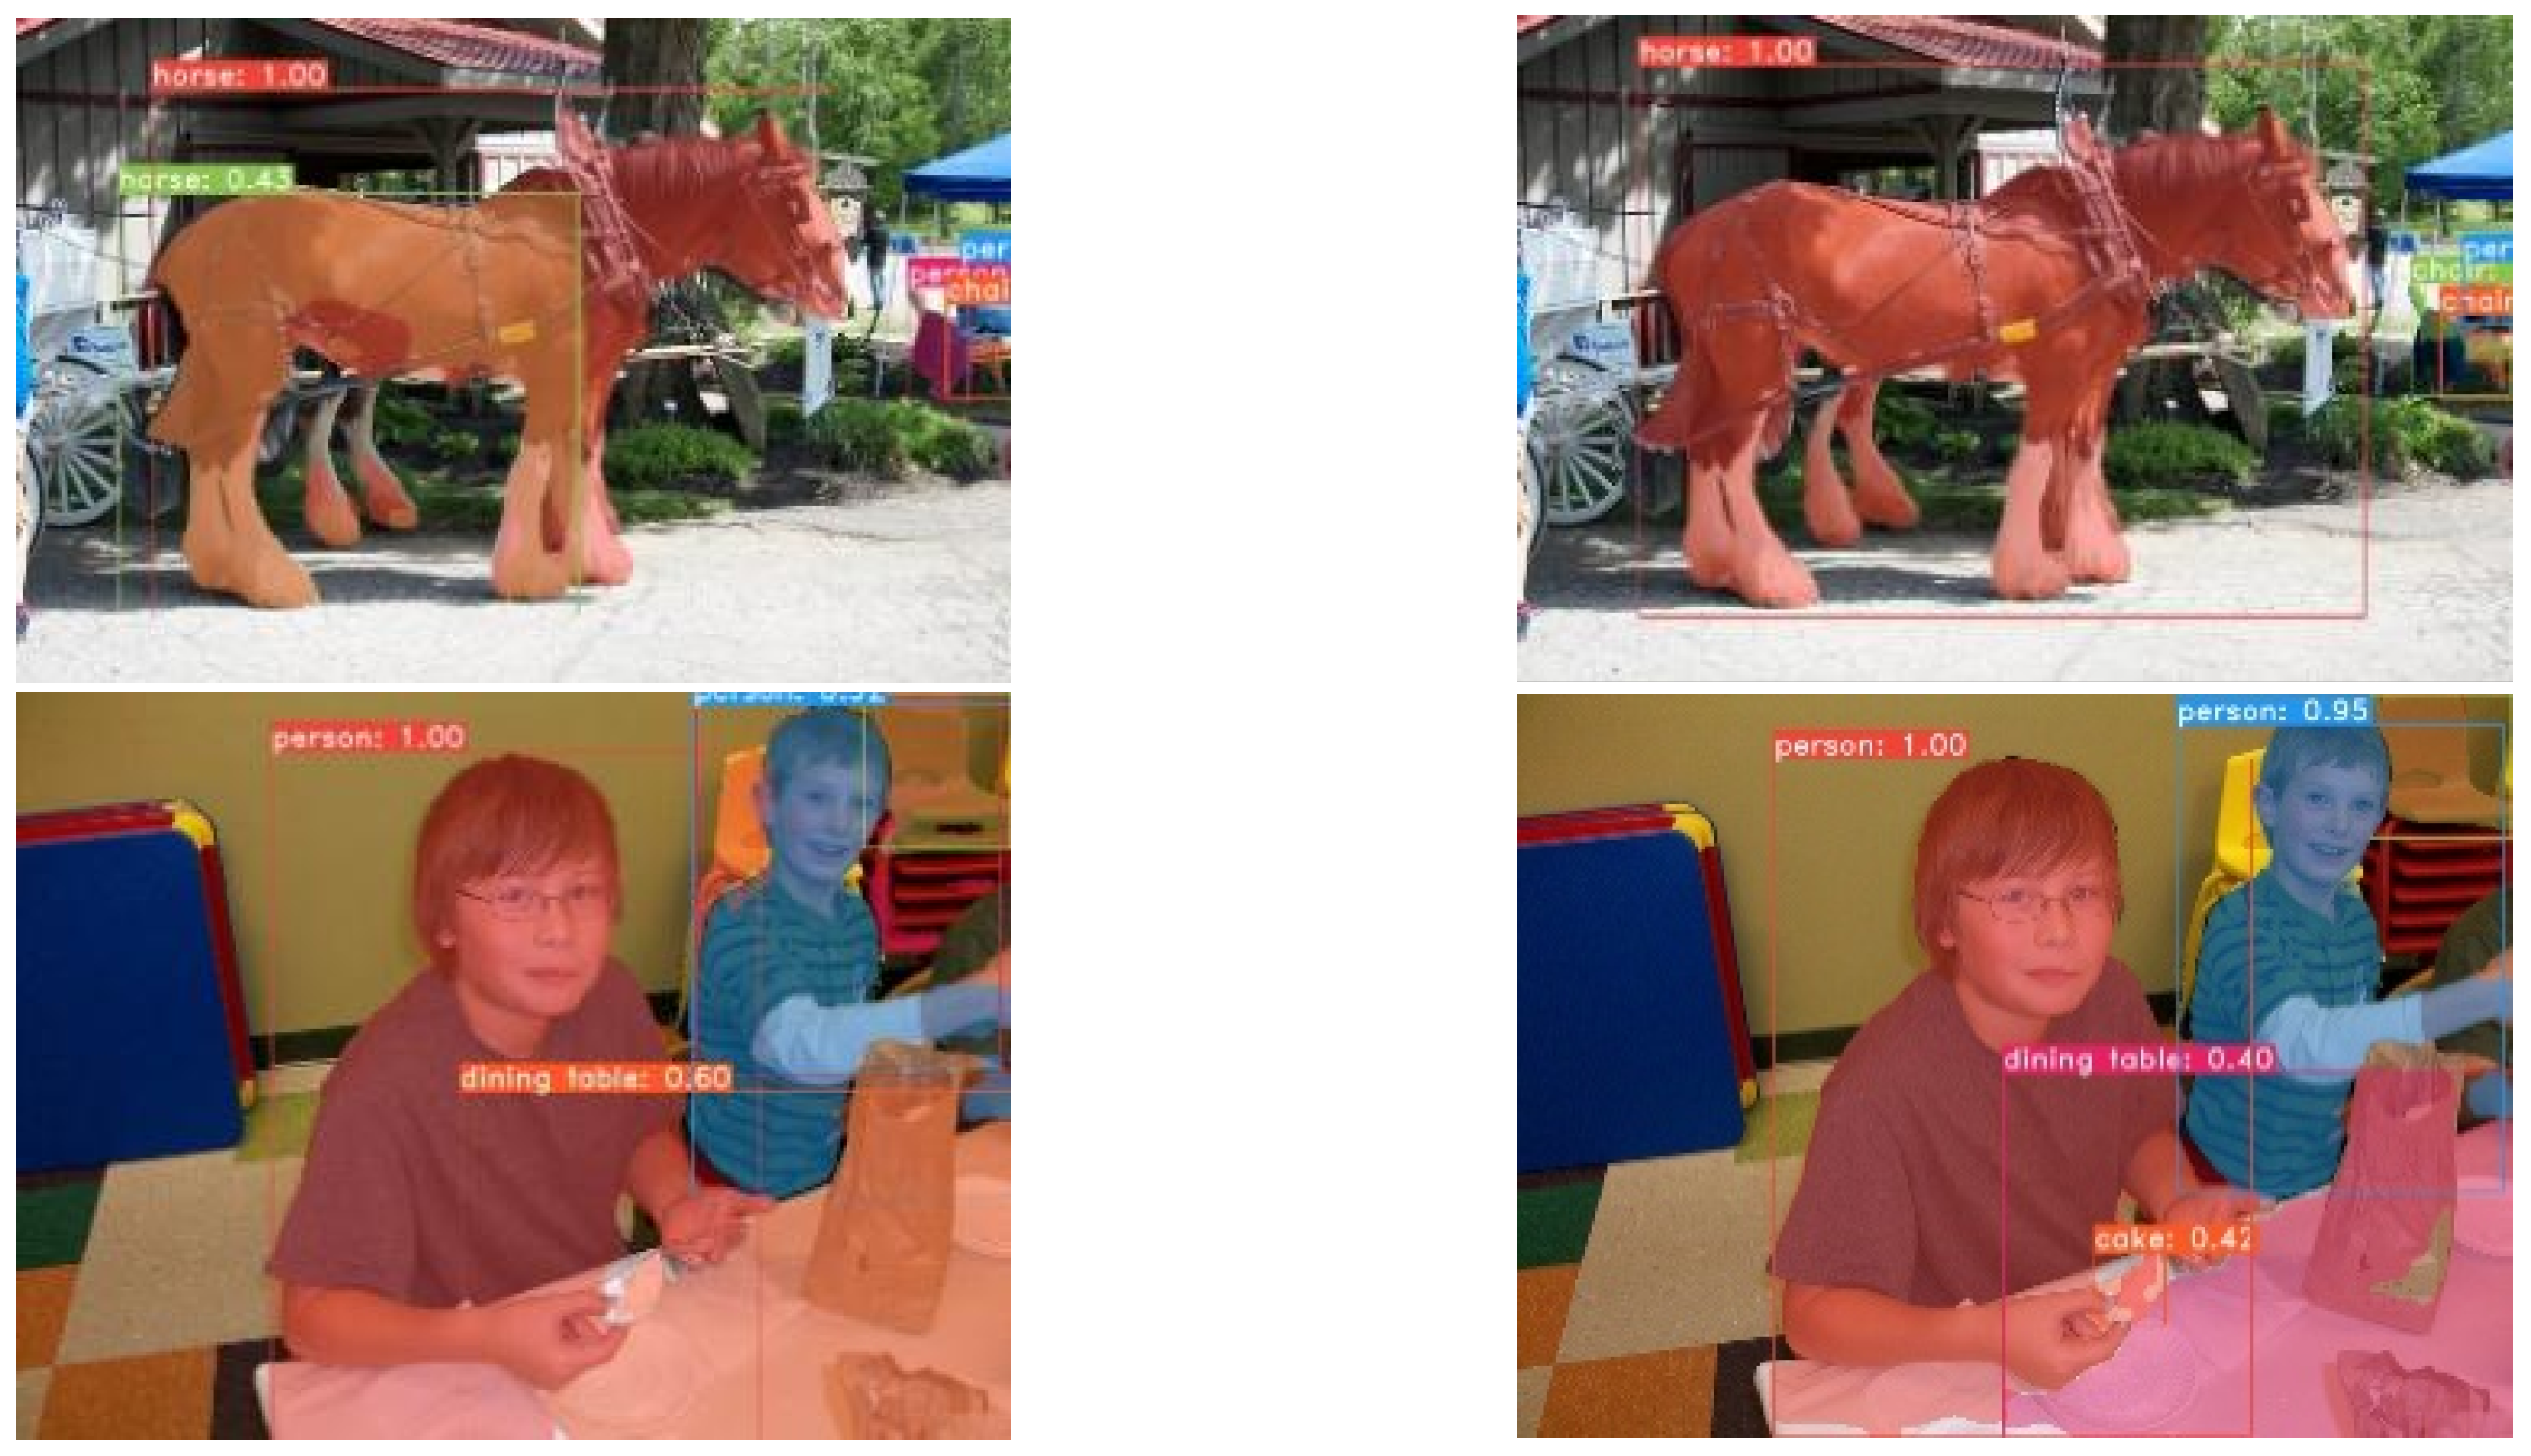
As observed from
Figure 12, the NGIoU Loss function proposed in this paper is not prone to missed or false detection in the aspect of detection, which improves the effect of object detection. At the same time, in the aspect of object segmentation, the detected object is segmented more completely. Nevertheless, just like the aforementioned experiments, the confidence is affected, and it is found that the confidence of some targets has decreased. Therefore, the algorithm in this paper still has a lot of room for improvement.
5. Conclusions
In this paper, a new generalized intersection over the union loss based on a new bounding box regression is proposed when the predicted box overlap with the regression box. By adding a bounding box regression, the loss will not fall into a plateau when the predicted box overlaps with the ground-truth box. Otherwise, the moving gradient makes the predicted box quickly moving to the ground-truth box and accelerating the regression. Experiment results demonstrate that compared with the GIoU Loss function, the NGIoU Loss function proposed in this paper makes the regression faster and more stable. In the two-dimensional target detection task, the NGIoU Loss function well replaces the GIoU Loss function, which provides a new and effective algorithm for the IoU series regression loss functions.
Nevertheless, our algorithm still has some shortcomings. Firstly, the penalty term coefficient needs more theoretical support to adjust and find the best loss function. Secondly, the AP of the YOLOv4 algorithm does not run to the best effect, and needs further improvement. Finally, we only modify the loss function and improve the positioning effect of object detection, but do not consider the impact on other aspects, such as the confidence of detection.
In the future work, it is planned to introduce two regression boxes for weighting, adjust the proportion coefficient of penalty terms and balance the proportion of penalty terms. This expansion and weighting as a loss may have a great potential to improve the performance of the target detection framework.
Author Contributions
Conceptualization, C.T. and Q.H.; methodology, C.T., Q.H. and F.Q.; software, C.T.; validation, C.T. and Q.H.; formal analysis, C.T. and F.Q.; investigation, Q.H. and F.Q.; resources, C.T., X.Y. and F.Q.; data curation, C.T. and Q.H.; writing—original draft preparation, C.T.; writing—review and editing, Q.H. and F.Q.; visualization, X.Y.; supervision, X.Y.; project administration, C.T., X.Y. and Q.H.; funding acquisition, C.T., X.Y. and F.Q. All authors have read and agreed to the published version of the manuscript.
Funding
This work was supported by the National Natural Science Foundation of China 61971297.
Institutional Review Board Statement
Not applicable.
Informed Consent Statement
Not applicable.
Data Availability Statement
All data included in this study are available upon request by contact with the corresponding author.
Conflicts of Interest
We declared that they have no conflict of interest to this work. We declared that we do not have any commercial or associative interest that represents a conflict of interest in connection with the work submitted.
References
- Simonyan, K.; Zisserman, A. Very deep convolutional networks for large-scale image recognition. arXiv 2014, arXiv:1409.1556. [Google Scholar]
- Szegedy, C.; Liu, W.; Jia, Y.; Sermanet, P.; Reed, S.; Anguelov, D.; Erhan, D.; Vanhoucke, V.; Rabinovich, A. Going Deeper with Convolutions. In Proceedings of the IEEE Conference on Computer Vision and Pattern Recognition, Boston, MA, USA, 7–12 June 2015; pp. 1–9. [Google Scholar]
- He, K.; Zhang, X.; Ren, S.; Sun, J. Identity Mappings in Deep Residual Networks. In European Conference on Computer Vision; Springer: Cham, Switzerland, 2016; pp. 630–645. [Google Scholar]
- Huang, G.; Liu, Z.; Van Der Maaten, L.; Weinberger, K.Q. Densely Connected Convolutional Networks. In Proceedings of the IEEE Conference on Computer Vision and Pattern Recognition, Honolulu, HI, USA, 21–26 July 2017; pp. 4700–4708. [Google Scholar]
- Li, W.; Zhang, Z.; Wang, X.; Luo, P. Adax: Adaptive gradient descent with exponential long term memory. arXiv 2020, arXiv:2004.09740. [Google Scholar]
- Shi, Z.; Liu, R. Online and Stochastic Universal Gradient Methods for Minimizing Regularized Hölder Continuous Finite Sums in Machine Learning. In Pacific-Asia Conference on Knowledge Discovery and Data Mining; Springer: Cham, Switzerland, 2015; pp. 369–379. [Google Scholar]
- Khan, A.H.; Cao, X.; Li, S.; Katsikis, V.N.; Liao, L. BAS-ADAM: An ADAM based approach to improve the performance of beetle antennae search optimizer. IEEE/CAA J. Autom. Sin. 2020, 7, 461–471. [Google Scholar] [CrossRef]
- Kingma, D.P.; Ba, J. Adam: A method for stochastic optimization. arXiv 2014, arXiv:1412.6980. [Google Scholar]
- Wen, Y.; Zhang, K.; Li, Z.; Qiao, Y. A Discriminative Feature Learning Approach for Deep Face Recognition. In European Conference on Computer Vision; Springer: Cham, Switzerland, 2016; pp. 499–515. [Google Scholar]
- Lin, T.Y.; Goyal, P.; Girshick, R.; He, K.; Dollár, P. Focal Loss for Dense Object Detection. In Proceedings of the IEEE International Conference on Computer Vision, Venice, Italy, 22–29 October 2017; pp. 2980–2988. [Google Scholar]
- Wang, F.; Cheng, J.; Liu, W.; Liu, H. Additive margin softmax for face verification. IEEE Signal Process. Lett. 2018, 25, 926–930. [Google Scholar] [CrossRef]
- Palmer, C.N.; Irvine, A.D.; Terron-Kwiatkowski, A.; Zhao, Y.; Liao, H.; Lee, S.P.; Goudie, D.R.; Sandilands, A.; Campbell, L.E.; Smith, F.J.; et al. Common loss-of-function variants of the epidermal barrier protein filaggrin are a major predisposing factor for atopic dermatitis. Nat. Genet. 2006, 38, 441–446. [Google Scholar] [CrossRef] [PubMed]
- Bouchard, G. Clustering and Classification Employing Softmax Function Including Efficient Bounds. U.S. Patent 8065246B2, 22 November 2011. [Google Scholar]
- Pokharel, R.; Príncipe, J.C. Kernel Classifier with Correntropy Loss. In Proceedings of the the 2012 International Joint Conference on Neural Networks (IJCNN), Brisbane, QLD, Australia, 10–15 June 2012; pp. 1–6. [Google Scholar]
- Yu, J.; Jiang, Y.; Wang, Z.; Cao, Z.; Huang, T. Unitbox: An Advanced Object Detection Network. In Proceedings of the 24th ACM International Conference on Multimedia, Amsterdam, The Netherlands, 15–19 October 2016; pp. 516–520. [Google Scholar]
- Rezatofighi, H.; Tsoi, N.; Gwak, J.; Sadeghian, A.; Reid, I.; Savarese, S. Generalized Intersection over Union: A Metric and a Loss for Bounding Box Regression. In Proceedings of the IEEE/CVF Conference on Computer Vision and Pattern Recognition, Long Beach, CA, USA, 15–20 June 2019; pp. 658–666. [Google Scholar]
- Zheng, Z.; Wang, P.; Liu, W.; Li, J.; Ye, R.; Ren, D. Distance-IoU Loss: Faster and Better Learning for Bounding Box Regression. In Proceedings of the AAAI Conference on Artificial Intelligence, New York, NY, USA, 7–12 February 2020; Volume 34, pp. 12993–13000. [Google Scholar]
- Zhu, Q.; Zheng, H.; Wang, Y.; Cao, Y.; Guo, S. Study on the evaluation method of sound phase cloud maps based on an improved YOLOv4 algorithm. Sensors 2020, 20, 4314. [Google Scholar] [CrossRef] [PubMed]
- Bochkovskiy, A.; Wang, C.Y.; Liao, H. YOLOv4: Optimal Speed and Accuracy of Object Detection. arXiv 2020, arXiv:2004.10934. [Google Scholar]
- Everingham, M.; Van Gool, L.; Williams, C.K.; Winn, J.; Zisserman, A. The pascal visual object classes (voc) challenge. Int. J. Comput. Vis. 2010, 88, 303–338. [Google Scholar] [CrossRef]
- Bodla, N.; Singh, B.; Chellappa, R.; Davis, L.S. Soft-NMS–Improving Object Detection with One Line of Code. In Proceedings of the IEEE International Conference on Computer Vision (ICCV), Venice, Italy, 22–29 October 2017; pp. 5561–5569. [Google Scholar]
- Ma, R.; Chen, C.; Yang, B.; Li, D.; Wang, H.; Cong, Y.; Hu, Z. CG-SSD: Corner Guided Single Stage 3D Object Detection from LiDAR Point Cloud. arXiv 2022, arXiv:2202.11868. [Google Scholar] [CrossRef]
- Yang, Z.; Zheng, Q.; Zhou, J.; Yin, Z. AFESSD: Object Detector for Natural Gas Pipeline Construction Scene. J. Phys. Conf. Ser. 2022, 2209, 012013. [Google Scholar] [CrossRef]
- Bolya, D.; Zhou, C.; Xiao, F.; Lee, Y.J. Yolact: Real-Time Instance Segmentation. In Proceedings of the IEEE/CVF International Conference on Computer Vision, Seoul, Republic of Korea, 27 October–2 November 2019; pp. 9157–9166. [Google Scholar]
- Lin, T.Y.; Maire, M.; Belongie, S.; Hays, J.; Perona, P.; Ramanan, D.; Dollár, P.; Zitnick, C.L. Microsoft Coco: Common Objects in Context. In European Conference on Computer Vision; Springer: Cham, Switzerland, 2014; pp. 740–755. [Google Scholar]
- Felzenszwalb, P.F.; Girshick, R.B.; Mcallester, D.; Ramanan, D. Object Detection with Discriminatively Trained Part-Based Models. IEEE Trans. Softw. Eng. 2010, 32, 1627–1645. [Google Scholar] [CrossRef] [PubMed]
- Zheng, Q.; Li, Z.; Zhang, Z.; Bao, Y.; Jian, S. ThunderNet: Towards Real-Time Generic Object Detection on Mobile Devices. In Proceedings of the IEEE/CVF International Conference on Computer Vision, Seoul, Republic of Korea, 27 October–2 November 2019. [Google Scholar]
- Konrad, A.; McDonald, J.; Villing, R. VGQ-CNN: Moving Beyond Fixed Cameras and Top-Grasps for Grasp Quality Prediction. In Proceedings of the 2022 International Joint Conference on Neural Networks (IJCNN), Padua, Italy, 18–23 July 2022; pp. 1–8. [Google Scholar]
- Ren, J.; Wang, Y. Overview of Object Detection Algorithms Using Convolutional Neural Networks. J. Comput. Commun. 2022, 10, 18. [Google Scholar]
- Chen, Z.; Chen, K.; Lin, W.; See, J.; Yu, H.; Ke, Y.; Yang, C. PIoU Loss: Towards Accurate Oriented Object Detection in Complex Environments. In European Conference on Computer Vision; Springer: Cham, Switzerland, 2020. [Google Scholar]
- Tran, T.H.G.; Tran, D.K.; Nguyen, H.S.H. An Updated IoU Loss Function for Bounding Box Regression. In Proceedings of the International Conference on Artificial Intelligence and Big Data in Digital Era, Ho Chi Minh City, Vietnam, 18–19 December 2021; Springer: Cham, Switzerland, 2022; pp. 13–22. [Google Scholar]
- Li, J.; Luo, S.; Zhu, Z.; Dai, H.; Krylov, A.S.; Ding, Y.; Shao, L. 3D IoU-Net: IoU guided 3D object detector for point clouds. arXiv 2020, arXiv:2004.04962. [Google Scholar]
Figure 1.
NGIoU loss function.
Figure 1.
NGIoU loss function.
Figure 2.
The comparisons of losses at different locations under overlapping conditions.
Figure 2.
The comparisons of losses at different locations under overlapping conditions.
Figure 3.
The comparison of total loss values trained by using different regression loss functions.
Figure 3.
The comparison of total loss values trained by using different regression loss functions.
Figure 4.
The mAP comparison of different loss functions corresponding to different IoU thresholds.
Figure 4.
The mAP comparison of different loss functions corresponding to different IoU thresholds.
Figure 5.
Single object detection results of ground truth boxes and predicted boxes trained by using GIoU, CIoU, and NGIoU Loss functions in YOLOv4.
Figure 5.
Single object detection results of ground truth boxes and predicted boxes trained by using GIoU, CIoU, and NGIoU Loss functions in YOLOv4.
Figure 6.
Test results of training weights by using GIoU, CIoU and NGIoU Loss functions in YOLOv4.
Figure 6.
Test results of training weights by using GIoU, CIoU and NGIoU Loss functions in YOLOv4.
Figure 7.
The comparison of total loss values trained by using different regression loss functions.
Figure 7.
The comparison of total loss values trained by using different regression loss functions.
Figure 8.
Object detection results of predicted boxes trained by using GIoU, CIoU, and NGIoU regression loss functions in the YOLOv5 algorithm.
Figure 8.
Object detection results of predicted boxes trained by using GIoU, CIoU, and NGIoU regression loss functions in the YOLOv5 algorithm.
Figure 9.
Single object detection results of ground truth boxes and predicted boxes trained by using Smooth L1, GIoU, and NGIoU regression loss functions in the SSD algorithm.
Figure 9.
Single object detection results of ground truth boxes and predicted boxes trained by using Smooth L1, GIoU, and NGIoU regression loss functions in the SSD algorithm.
Figure 10.
Test results of training weights by using Smooth L1, GIoU, and NGIoU regression loss functions in the SSD algorithm.
Figure 10.
Test results of training weights by using Smooth L1, GIoU, and NGIoU regression loss functions in the SSD algorithm.
Figure 11.
The comparison of confidence loss values trained by using different regression loss functions.
Figure 11.
The comparison of confidence loss values trained by using different regression loss functions.
Figure 12.
Test results of weight trained by using GIoU and NGIoU regression loss functions in the YOLACT algorithm.
Figure 12.
Test results of weight trained by using GIoU and NGIoU regression loss functions in the YOLACT algorithm.
Table 1.
The comparison of performance indicators with different loss functions in the YOLOv4 algorithm.
Table 1.
The comparison of performance indicators with different loss functions in the YOLOv4 algorithm.
| Loss | AP | AP50 | AP75 |
|---|
| GIoU | 46.53% | 79.30% | 48.72% |
| CIoU | 46.81% | 79.52% | 50.81% |
| Relative improv. % | 0.28% | 0.22% | 2.09% |
| NGIoU | 47.68% | 81.12% | 50.77% |
| Relative improv. % | 1.15% | 1.82% | 2.05% |
Table 2.
The comparison of performance indicators with different loss functions in the YOLOv5 algorithm.
Table 2.
The comparison of performance indicators with different loss functions in the YOLOv5 algorithm.
| Class Name | GIOU | CIOU | NGIOU |
|---|
| pottedplant | 65.18% | 64.25% | 67.09% |
| chair | 75.05% | 75.65% | 75.68% |
| boat | 77.21% | 77.60% | 77.01% |
| bottle | 77.36% | 77.77% | 77.65% |
| diningtable | 83.91% | 83.52% | 84.91% |
| sofa | 84.19% | 85.27% | 86.54% |
| tvmonitor | 87.46% | 86.46% | 86.03% |
| sheep | 87.84% | 88.01% | 87.76% |
| aeroplane | 93.76% | 92.42% | 93.34% |
| bird | 86.56% | 86.97% | 87.05% |
| cow | 92.37% | 93.25% | 92.18% |
| person | 91.64% | 91.39% | 92.01% |
| bicycle | 93.66% | 93.97% | 93.98% |
| motorbike | 90.86% | 93.18% | 93.26% |
| horse | 92.45% | 92.68% | 93.23% |
| cat | 89.88% | 90.04% | 90.51% |
| train | 90.65% | 90.34% | 90.89% |
| dog | 89.88% | 90.65% | 90.66% |
| bus | 93.70% | 92.99% | 93.90% |
| car | 94.23% | 94.81% | 95.06% |
| mAP | 85.06% | 86.22% | 86.79% |
| training time | 658 min | 613 min | 609 min |
Table 3.
The comparison of performance indicators with different loss functions in the SSD algorithm.
Table 3.
The comparison of performance indicators with different loss functions in the SSD algorithm.
| Loss | AP | AP75 |
|---|
| Smooth L1 | 45.44% | 47.52% |
| GIoU | 45.91% | 48.49% |
| NGIoU | 45.97% | 48.65% |
Table 4.
The comparison of performance indicators with different loss functions in the YOLACT algorithm.
Table 4.
The comparison of performance indicators with different loss functions in the YOLACT algorithm.
| Loss | AP | AP75 |
|---|
| Box | Mask | Box | Mask |
|---|
| SL1 | 31.5 | 29.1 | 32.4 | 30.1 |
| GIoU | 32.4 | 29.5 | 34.1 | 30.6 |
| CIoU | 32.2 | 29.6 | 33.9 | 30.9 |
| NGIoU | 32.5 | 29.6 | 34.4 | 31.0 |
| Publisher’s Note: MDPI stays neutral with regard to jurisdictional claims in published maps and institutional affiliations. |
© 2022 by the authors. Licensee MDPI, Basel, Switzerland. This article is an open access article distributed under the terms and conditions of the Creative Commons Attribution (CC BY) license (https://creativecommons.org/licenses/by/4.0/).


