Article

Creep Simulation and Validation for a Finite Element Analysis of Expanded Polystyrene-Based Cushioning Systems

1
Department of Bio-Industrial Machinery Engineering, Pusan National University, Miryang 50463, Republic of Korea
2
Appliance Advanced Technology R&D Group, LG Electronics, Changwon 51533, Republic of Korea
3
Department of Logistic Packaging, Kyungbuk College of Science, Chilgok 39913, Republic of Korea
*
Author to whom correspondence should be addressed.
Appl. Sci. 2022, 12(24), 12663; https://doi.org/10.3390/app122412663
Submission received: 15 October 2022 / Revised: 1 December 2022 / Accepted: 6 December 2022 / Published: 10 December 2022

Abstract

:
The creep strain resistance of expanded polystyrene (EPS) is important; thus, time-dependent creep properties of EPS have been of significant interest. This study is a part of the computer-aided engineering (CAE) prediction-technology development for the inclination of unitized loads of packaged appliances applied to EPS-based cushioning systems. Creep properties are validated to ensure finite element analysis (FEA) reliability regarding the creep behavior of EPS-based cushioning systems. The elastic modulus and Poisson’s ratio (EPS elastic properties) as well as creep properties (plastic properties) were measured. The EPS density range was 16–30 kg/m3, and the temperature range was 0–60 °C. Because the measured mechanical properties were not temperature-dependent, only their density dependence was analyzed. The EPS behavior, measured over 12 h, exhibited a significant creep amount and rate, depending on the applied stress level. FEA was performed on 7-day-long EPS creep, using the measured EPS elastic and plastic properties. The FEA and experimental results were strongly concordant. These EPS creep validation results are expected to improve the reliability of FEA for creep behavior studies of EPS-based cushioning systems.

1. Introduction

Expanded polystyrene (EPS) is manufactured from expandable polystyrene beads that are fused and molded using dry saturated steam. The final product is low-density EPS foam, which has a closed-cell structure, wherein 95% of the volume is occupied by air. EPS is ultra-lightweight and has excellent insulation, cushioning, waterproofing, and soundproofing properties; thus, it is used for various purposes in various industrial fields. The biggest advantage of using EPS as a cushioning packaging material for products is the ability to mass-produce uniform-quality standardized products.
The EPS cushion curve is essential for designing EPS-based cushioning systems; appropriate amounts of cushioning materials are determined based on this curve [1]. However, because EPS is a viscoelastic material, it exhibits time-dependent creep; therefore, the fixing of the packaged product becomes loosened and unexpected frictional motion may occur frequently, partially damaging the product and/or destroying the outer package. In addition, when packaged products are loaded in multiple stages in a logistics warehouse for a long time, the accumulated amount of the EPS creep deformation in each package causes deflection and inclination of the unitized load, which ultimately affects stability. This phenomenon becomes more severe for local loads, when the product’s center of gravity becomes biased. Therefore, for optimizing EPS-based cushioning systems, the creep behavior, which is the viscoelastic property of EPS, should be analyzed and accounted for. In addition, the creep behavior should be validated, for ensuring the FEA reliability and convergence, when used for designing EPS-based cushioning systems.
In general, the compressive creep behavior of a material proceeds in three steps, as shown in Figure 1: (1) primary (transient creep), (2) secondary (steady-state creep), and (3) tertiary (accelerating creep). In the primary step, the strain increases with decreasing strain rate. In the second step, the strain increases linearly with time, yielding a constant strain rate. The tertiary step is characterized by a rapid strain increase, which rapidly leads to failure. However, the actual creep behavior of a material varies significantly, depending on the applied stress: stabilizing after transient creep, leading to destruction after rapidly progressing through the three creep steps, or fully proceeding with the three creep steps.
The creep behavior, from instantaneous elastic strain to steady-state creep after loading, can be described by the Burgers model, given in Equation (1). The constants of this model allow a quantitative understanding of the characteristics of the different creep phases. In the Burgers model, the Maxwell and Kelvin elements are connected in series. The spring of the Maxwell element represents instantaneous elastic strain while the dashpot represents a non-reversible viscous flow. The Kelvin element describes delayed elasticity. Many thermoplastics exhibit continuously decreasing creep rates, with zero strain-rate asymptotes [2]. Nevertheless, the creep behavior of such plastics may still be described by the Burgers model over a finite time span.
ε ( t ) = σ o / E o + σ o / E r { 1 e x p ( t / τ r ) } + ( σ o / η v ) t
where, Eo is the instantaneous elastic modulus (Pa), Er is the retarded elastic modulus (Pa), ηv and ηr are the viscosity coefficient of the dashpot [Pa·s], and τr is the retardation time (=ηr/Er) (s).
The short- and long-term dimensional stability of plastic parts at elevated temperatures is an essential design requirement for many applications, including electrical connectors and various automotive applications. Because characterizing the creep performance of plastics is of primary importance in these applications, significant effort has focused on predicting and analyzing the plastics’ creep behavior. However, because these parts are often subjected to prolonged loads, creep analysis is difficult and has obvious limitations. Therefore, rapid and reliable prediction of the plastics’ creep behavior is very important for designing plastic products subjected to prolonged loads [3].
Many simplified constitutive equations have been proposed for describing the time-dependent transient and steady-state creep behavior, starting with instantaneous elastic strain of plastics after loading [3,4,5,6,7,8]. Carriere et al. [6] presented short-term (600 s) creep test results for selected polymers, in terms of hyperbolic sine and exponential functions. Deng et al. [7] predicted the long-term creep behavior of a certain polyethylene using a time–temperature superposition and an analytical formula for 30–120 min-long creep tests. Akinay et al. [8] also attempted to predict the long-term creep behavior of polymeric materials from short-term (2 h) creep test results. Gnip et al. [9,10] has published an empirical equation for predicting long-term creep behavior from creep data measured by applying a compressive stress of (0.25–0.45) σ10% to EPS. Sudduth [11] described all three phases of creep (i.e., primary, secondary, and tertiary creep phases) for high-density polyethylene, using a novel unifying mathematical model derived from the relationship between the constant strain rate, creep, and stress relaxation. Dropik et al. [12] modeled the primary creep behavior of polypropylene using the Maxwell model in the FEA framework, and reported that the experimental and FEA results agreed well at low stress levels, but the discrepancy was large at high stress levels.
To date, studies on EPS have mainly been conducted on an experimental analysis of creep behavior, or an analytical formula for predicting long-term creep behavior from short-term creep measurements, using EPS as a construction material (e.g., underground structures). On the other hand, when EPS is used as a packaging cushioning material, the loading period is short, and especially in the case of home appliance packaging, it is calculated as about one week due to the distribution characteristics of the product. Research results on the behavior of EPS when it is used as a cushioning packaging material, or the material properties for CAE of the EPS-based cushioning system, are insufficient.
The purpose of this study was to validate the EPS creep behavior, for Improving FEA reliability with respect to EPS-based cushioning systems. Because this study was conducted as a part of the computer-aided engineering (CAE) prediction technology development for preventing fall accidents of packaged appliances stacked in multiple stages (unitized loads) in logistics warehouses, the variables and the scope of the study are reflected this scenario.

2. Experimental Design and FE Modeling

2.1. Experimental Materials

The experimental material used in this study was EPS, at four density levels: 16, 20, 25, and 30 kg/m3. The measured physical properties were Young’s modulus, Poisson’s ratio, 12 h creep, and 7-day creep. The dimension of the test specimen applied in this study was W × D × H = 50 × 50 × 50 mm3, the minimum dimension prescribed by ISO 844 [13]. In addition, four levels (0, 20, 40, and 60 °C) were selected in the range of 0 to 60 °C, considering the temperature range experienced during the distribution process according to the scenario of this study, and the changes in the physical properties of the EPS at high temperatures [12,13,14]. Prior to the experiments, the prepared test specimens were conditioned for 6 h under controlled temperature [13].

2.2. Experimental Apparatus and Methods

EPS is a viscoelastic material, and its uniaxial compression stress–strain curve (SS curve) is shown in Figure 2. Because the EPS compressive strength is usually expressed as the stress (10% strain strength) at 10% strain in the case of 50 mm3 samples [13,14,15,16], 10% strain was set as the EPS reference strain level in this study. The elastic modulus was calculated from the compression SS curve by three methods: (1) as the slope of the initial proportional portion (initial tangent modulus and Young’s modulus), (2) as the slope of the line segment connecting the 10% strain point on the curve (secant modulus), and (3) as the slope of the tangent line at the 10% strain point on the curve (tangent modulus).
The EPS Poisson’s ratio is the ratio of the horizontal strain to the vertical strain, for a uniaxially compressed test specimen under a compression test with a loading rate of 12.5 mm/min. To measure the horizontal displacement on both sides of a test specimen, a jig was designed, in which two linear variable differential transformers (LVDTs) were installed in a horizontal straight line facing each other (Figure 3). The SS curve was measured by placing a test specimen centrally between the two parallel plates of the compression-testing machine and compressing it to 80% of the original thickness at a compression rate of 10% of its original thickness per minute [13].
The uniaxial compression creep test equipment was composed of a hardware system consisting of a dead load addition part, a linear displacement-measuring part, a specimen compression part, a load-measuring part, and a software system for continuously measuring and analyzing the specimen’s displacement with time (Figure 4). During the creep test, five levels of applied stress were arbitrarily selected under a 10% strain strength, for each EPS density scenario. The creep test was conducted in two ways: the 12-h-long creep test was performed for analyzing the short-term creep response after loading, while the 7-day-long creep test was performed for validating the FEA results for the creep behavior of EPS-based cushioning systems.

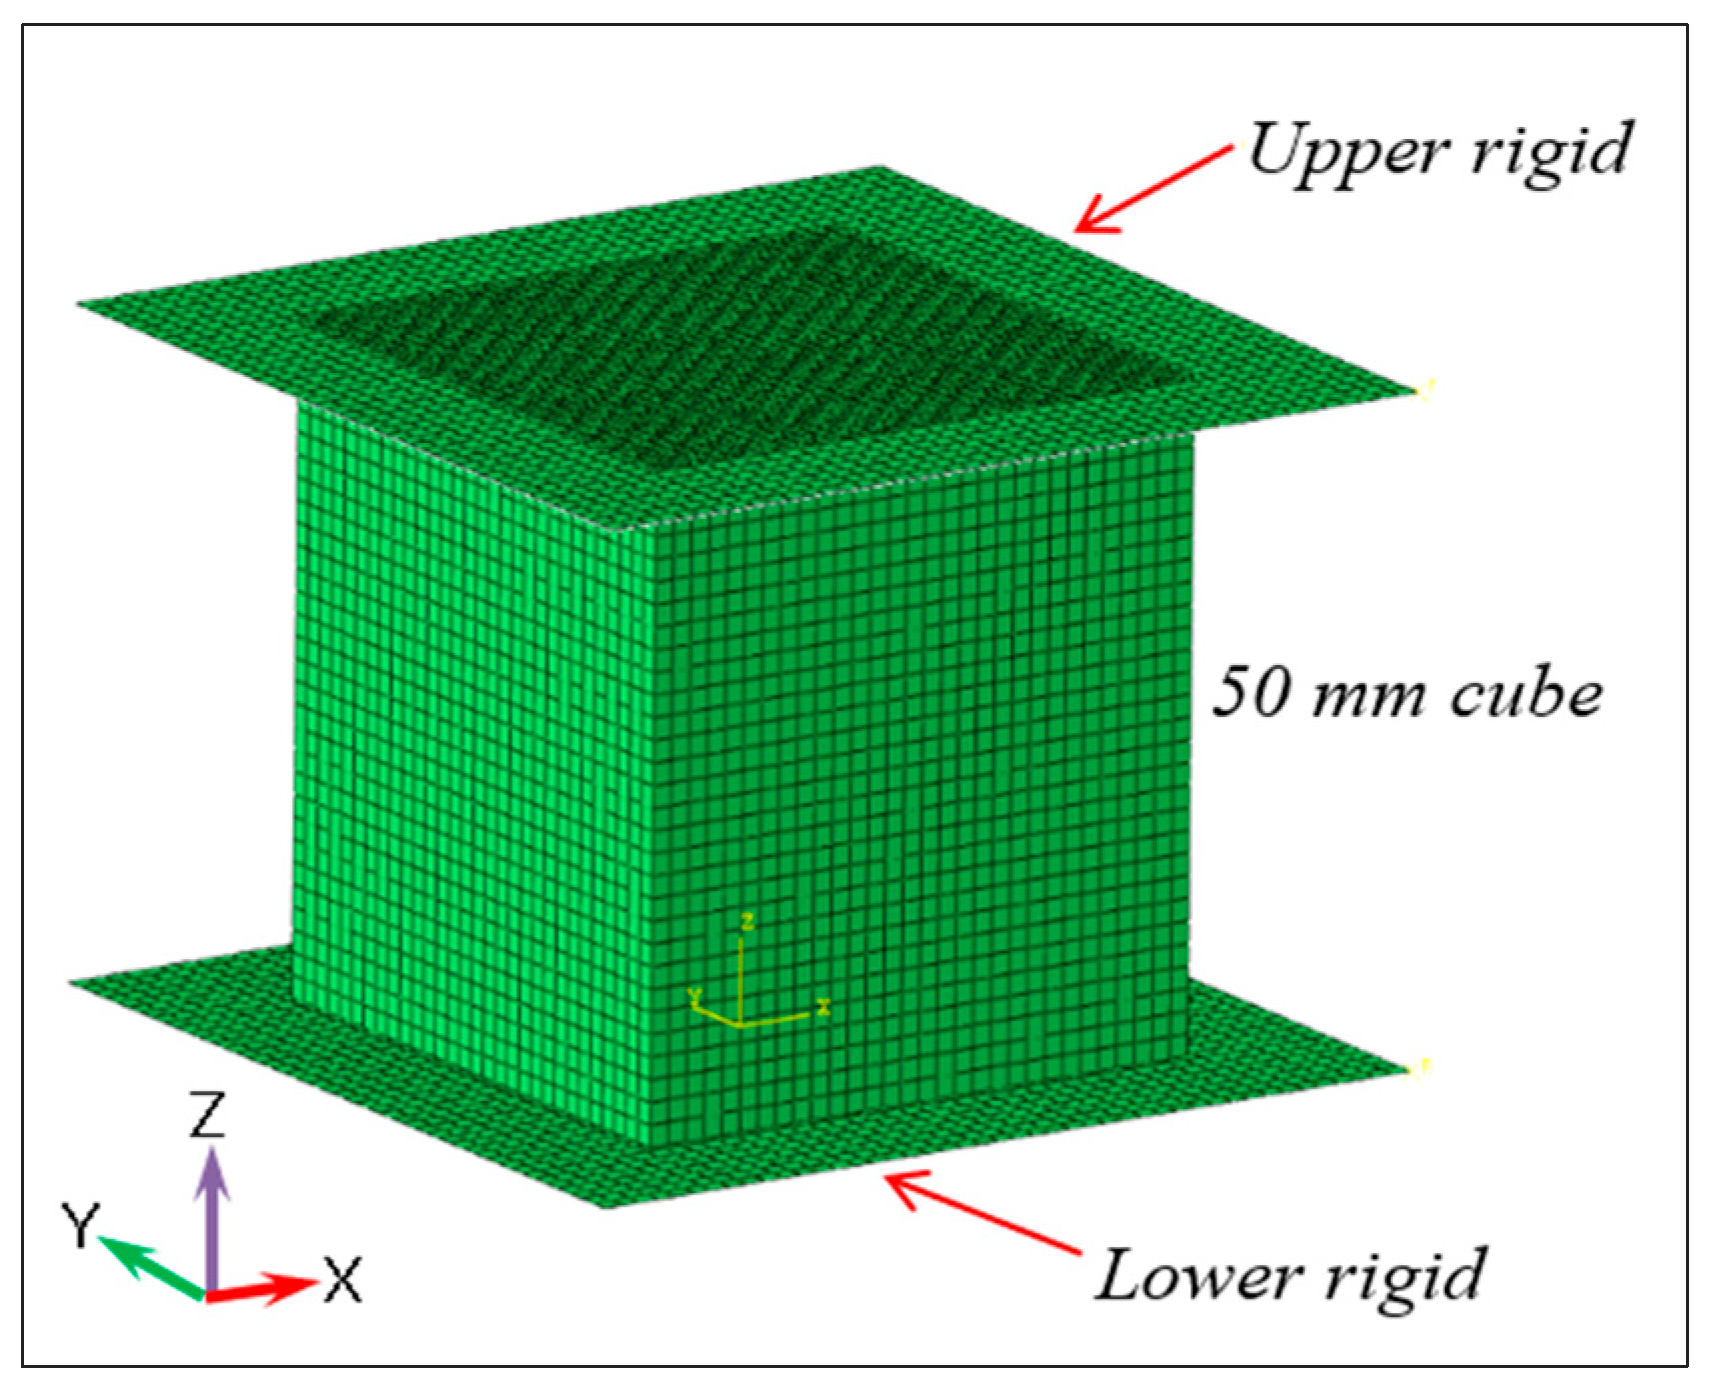
2.3. FE Modeling and Analysis Procedures

The FE EPS model mimicked the 50 × 50 × 50 mm3 specimen that was used in the creep test (Figure 5). The mesh size of the model was 5 mm, and the total number of nodes and elements was 2744 and 2197, respectively. A steel plate was used at the top and bottom of the EPS specimen to evenly distribute the stress throughout the specimen. In the FEA, frictional contact conditions were applied between the model and the upper and lower plates, and while both the translation and rotation of the lower rigid part were constrained, approximately 50% of the 10% strain strength for each EPS density scenario was imposed on the upper rigid plate in the z-direction. The coefficient of friction between the steel plate and the EPS block did not show a large error when comparing the FEA results for several stages in the range of 0.5–0.8, so a single value of 0.75 was applied.
FEA was performed in two steps, using ABAQUS S/W (Ver 2017) as a post-processor. Step 1 corresponded to the analysis of the instantaneous elastic strain, and Young’s modulus and Poisson’s ratios (the EPS elastic properties) were used. Step 2 corresponded to the analysis of the time-dependent creep strain, and 7-day-long creep data were used for the EPS viscoelastic properties.

3. Results and Discussion

3.1. Mechanical Properties of EPS

EPS is a viscoelastic material and follows a trajectory in the three-dimensional stress–strain–time space. In the SS curve (Figure 2), the material’s strength is inferred as the proportional limit and 10% strain strength. As shown in Table 1, both strength indexes clearly increased with density, but no clear temperature dependence was observed for temperatures in the 0–60 °C range, which was sufficient for statistical verification. Table 2 shows the changes in the density of EPS by temperature condition for the EPS test specimen applied to the measurement of mechanical properties shown in Table 1. Although the density decreased with the temperature increase within the range of 0–60 °C, the decrease rate was 0.81–1.38%, which does not seem to have significantly affected mechanical properties. However, continuous research is needed on the temperature dependence of EPS strength outside this temperature range. Awol [14] reported that the 10% strain strength of EPS decreased with increasing temperature, for temperatures below 0 °C and above 45 °C; however, no effect was observed at other temperatures. However, according to the literature [15,16], the polystyrene resin (present in raw EPS) is a thermoplastic resin, and it is known that the resin itself softens at high temperatures (>70 °C) and undergoes displacement (e.g., expansion or contraction), which affects its mechanical properties. However, the effect of the temperature change (−1743 °C) on the EPS shock absorption and vibration transmission properties was reportedly significantly smaller than that of expanded polyethylene (EPE) [17]. Figure 6a,b show an example of a SEM image before and after 50% compression, respectively.
Table 3 lists the results obtained for various elastic moduli using the raw data in Table 1, with only the density as a parameter. In each case, the elastic modulus increased with density, and in the statistical significance test, all items and sections, except for a specific density section of the tangent modulus, were significant. Compared with the initial tangent modulus of the initial proportional portion (Young’s modulus), the secant modulus was approximately 35–38%, and the tangent modulus was approximately 5–9%. This was because the secant and tangent moduli considered the plastic property area of the material. In addition, the error range of the initial tangent modulus was larger than that of the other moduli, which was attributed to the difference in judgment when determining the initial proportional portion of the curve. It has been reported that this initial tangent modulus is also affected by test parameters such as the loading rate and specimen size [14,18]. This value increased as the loading rate decreased or the specimens’ dimensions increased.
Poisson’s ratio quantifies the lateral pressure of the specimen on adjacent structural elements for a given vertical load on the specimen. The dependence of Poisson’s ratio on the EPS density is shown in Figure 7. With increasing density, the EPS Poisson’s ratio increased almost linearly, and was approximately 0.095–0.175 for densities in the 16–30 kg/m3 range, agreeing well with previously published results [14,15,16].

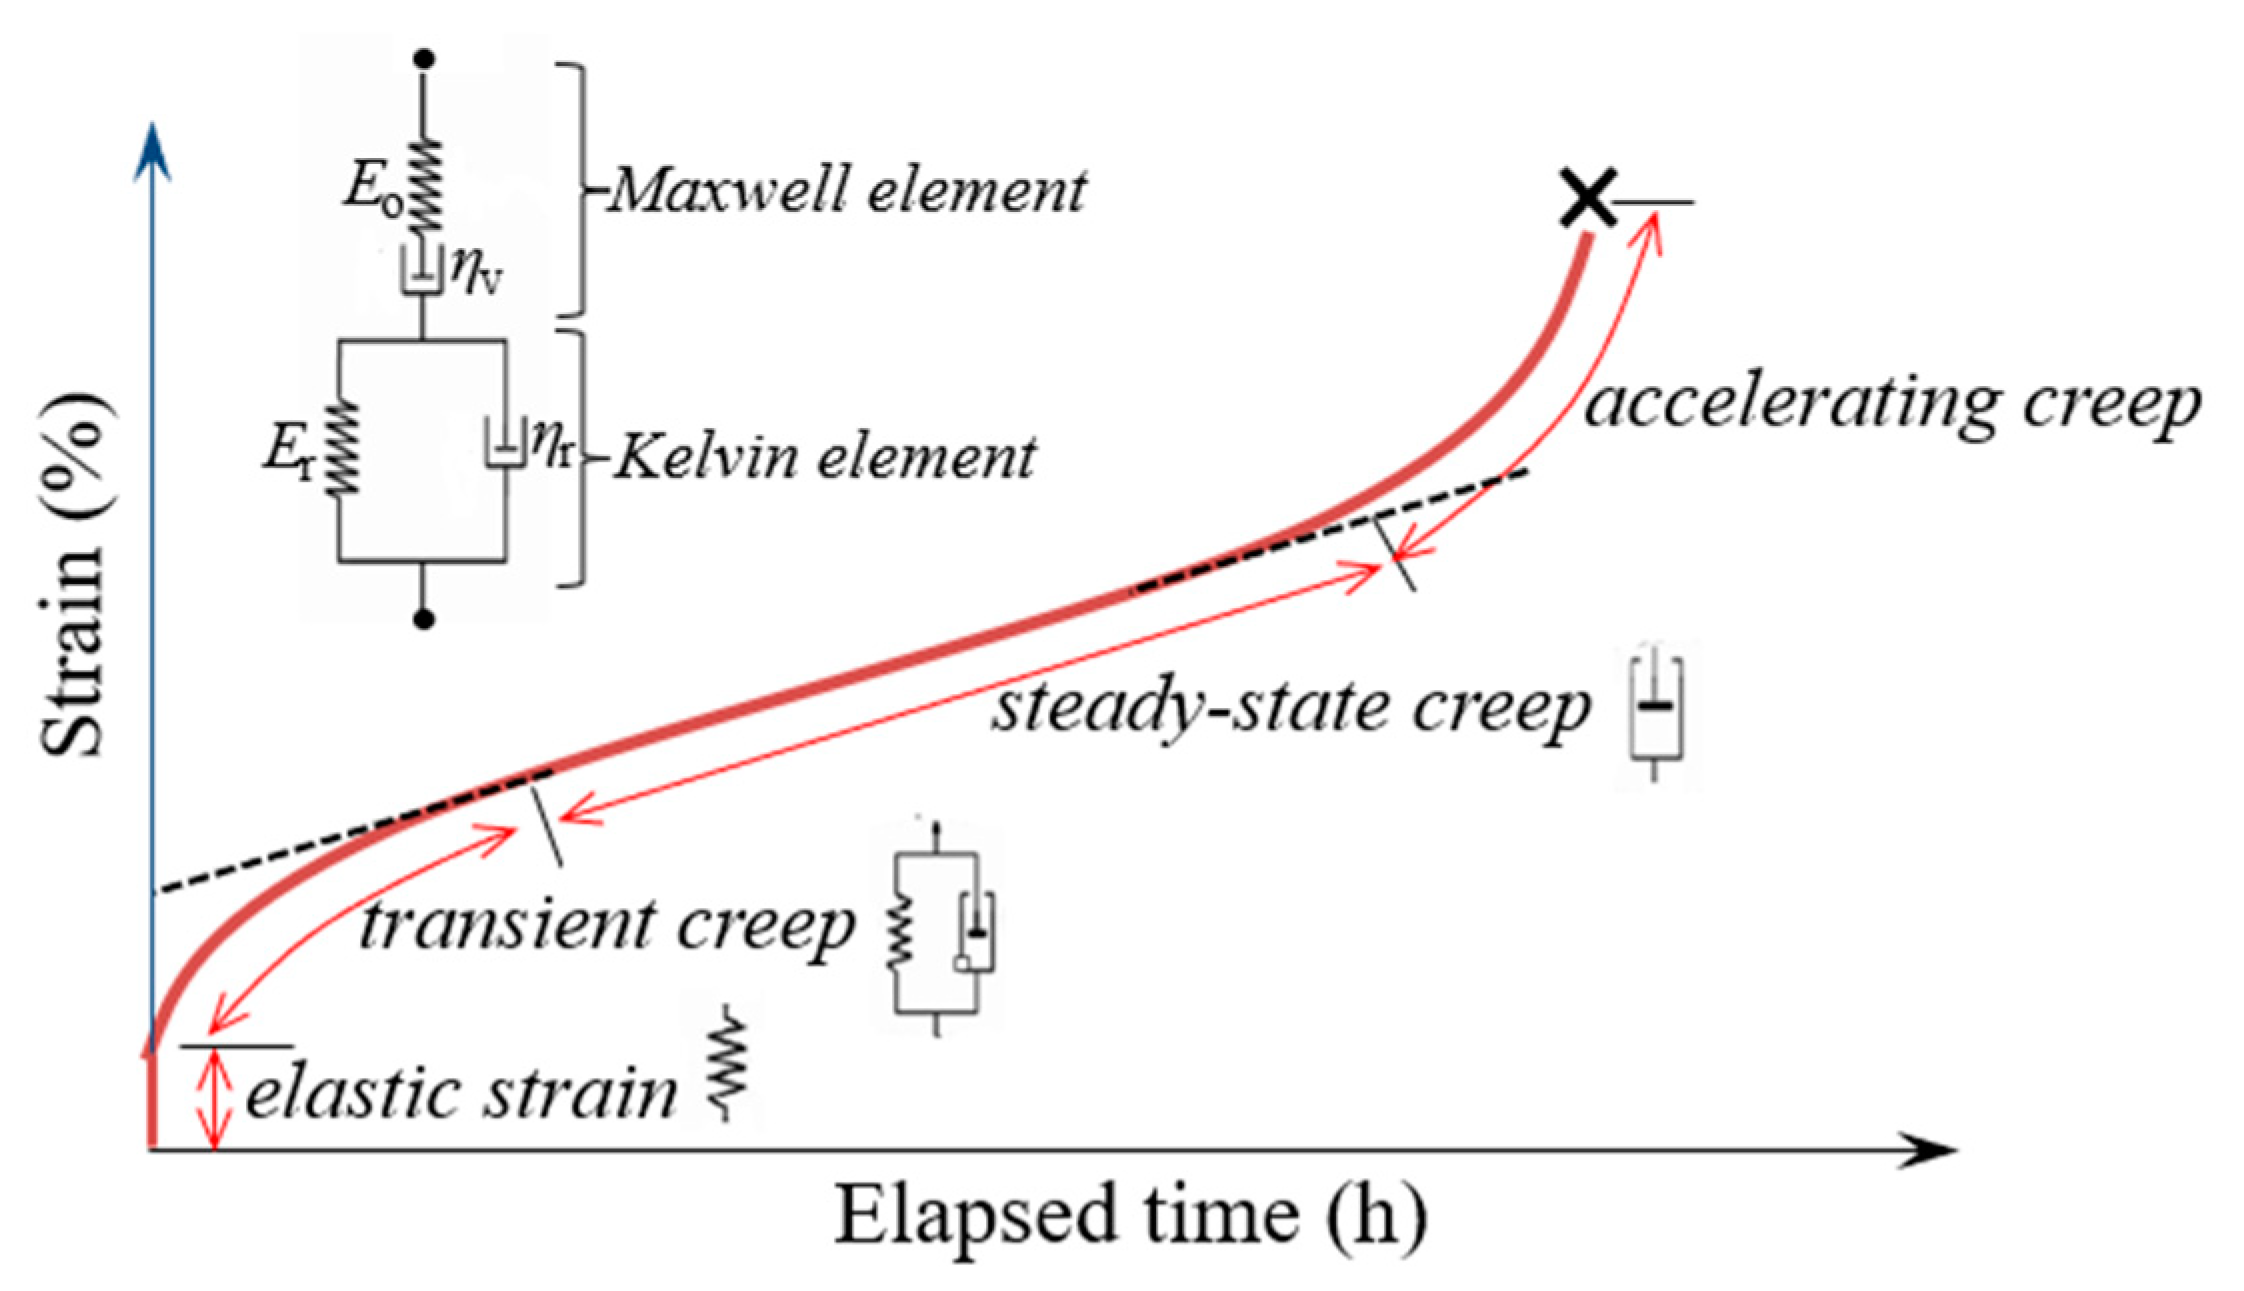
3.2. Nonlinear Creep Behavior Modeling of EPS

As shown in Figure 8, with increasing applied stress for each EPS density scenario, the instantaneous elastic strain in the 12-h-long creep test increased, and the creep amount and rate also increased in the subsequent transient and steady-state creep steps. In particular, the difference in these characteristics between the lower two levels (32.7–54.5% of σ10, under σEL) and the upper three levels (60.2–84.5% of σEL, over σEL) among the five levels of applied stress for each EPS density was large. The nonlinear creep behavior of EPS, varying with the applied stress level and time (Figure 8) was captured well by the mathematical model in Table 4.
When the measured creep data were modeled using the Burgers model (Equation (1)), the creep behavior for each applied stress was qualitatively analyzed by comparing the constant values in the model. As an example, the 12 h-long creep data measured after applying a stress of 0.0791 MPa to the EPS specimen with the density of 20 kg/m3 were expressed using the Burgers model and nonlinear regression analysis; the analysis process of the constant value and retardation time of the model are shown in Figure 9. Table 5 summarizes the modeling of the 12-h-long creep test results for each applied stress at the different EPS density levels, using the Burgers model. Coefficient ‘a’ represents the instantaneous elastic strain after loading the applied stress, while coefficient ‘b’ represents the extent of the transient creep, and coefficient ‘d’ represents the creep rate of the steady-state creep stage; all of these increased with increasing applied stress. In addition, the difference between these values for the lower two levels and the upper three levels among the five levels of applied stress for each density was large. Therefore, the EPS creep strain was large, depending on whether the applied stress level was below or above the proportional limit. However, in this study, it was difficult to analyze the creep behavior for each density level by comparing the constant values in the Burgers model, because the applied stress levels were different for different densities. Figure 2 show the SEM image of the EPS20 test specimen before and after the creep test as an example, respectively. Here, since the applied stress was 0.0791 MPa near the professional limit of 0.0717 MPa, no significant change in the shape of the cell wall and air space before and after the test was found with SEM images.
Meanwhile, for the EPS-creep-behavior characterization, the transition time from transient creep to steady-state creep can be used as an important design variable for EPS-based cushioning systems. It is very difficult to analyze directly, but indirect analysis is possible utilizing the retardation time concept, corresponding to the time required for generating approximately 63.2% of the transient creep strain, that is, the total retardation strain in the Burgers model. As shown in Table 5, which lists retardation times for different applied stress levels and different EPS densities, the retardation time was very short for applied stress levels below the proportional limit, and also progressed rapidly from transient creep to steady-state creep. At the same density, the retardation time increased and decreased with increasing applied stress, but the density dependence of the difference was difficult to analyze because the applied stress levels were different for different densities.
Because the creep behavior differences were very clear, depending on whether the applied stress level exceeded the proportional limit during the creep test, we posited that these EPS characteristics should be accounted for when designing EPS-based cushioning systems. For example, when EPS blocks are used as lightweight fillers in road construction, the maximal allowable load on the upper part of an EPS block should be limited to 30% of the 10% strain strength, for constraining the EPS long-term creep-related relative displacement to 2% [14].

3.3. Validation of the EPS Material Properties for 7-Day-Long Creep Behavior Tests

After recreating the same specimen and compression conditions as those in the EPS compressive creep test with the FE model, two-step FEA was performed. Figure 10 shows an example of the displacement and stress distribution at the end point of steps 1 and 2 as a result of the analysis. In Figure 11, which shows an example of the process of changing the displacement step by step of the FEA, step 1 is the FEA result for instantaneous elastic displacement (time-independent); Young’s modulus (Table 3) and Poisson’s ratio (Figure 7), which are the EPS elastic properties, were used in the FEA. On the other hand, step 2 shows the FEA result for plastic displacement (time-dependent); 7-day-long creep test data were used in the FEA. The validation of the FEA material properties of these creep behaviors is related to the CAE prediction technology development for 7-day multi-stage (unitized) loads in the warehouses of packaged appliances of relevance to EPS-based cushioning systems; thus, 7-day-long creep test data were used for validation.
Figure 12 shows the creep test results and FEA results calculated by the Prony series for one level of applied stress, for the different EPS density scenarios. Table 6 lists the analysis results, and it can be seen that the concordance between the experimental and FEA results is 89.5–95.2% for step 1 and 88.4–97.7% for step 2; the overall concordance is 90.3–100%. These results show that the elastic and viscoelastic properties measured in this study are captured well by FEA. Therefore, by applying the validation results for the creep behavior to the material properties in FEA, the reliability of the FEA prediction for the inclination amount of unitized loads caused by the displacement of EPS-based cushioning systems in multiple stages of the actual packaged product can be improved.

4. Conclusions

EPS is widely used in various industrial fields; in particular, when used as a packaging cushioning material, its greatest advantage is the ability to mass-produce uniform-quality cushioning materials. This study was conducted as a part of the CAE prediction technology development of inclinations for unitized loads of packaged appliances applied to EPS-based cushioning systems. More specifically, the EPS creep properties were validated for ensuring the reliability of the FEA results for creep behavior of EPS-based cushioning systems. The results of this study can be summarized as follows:
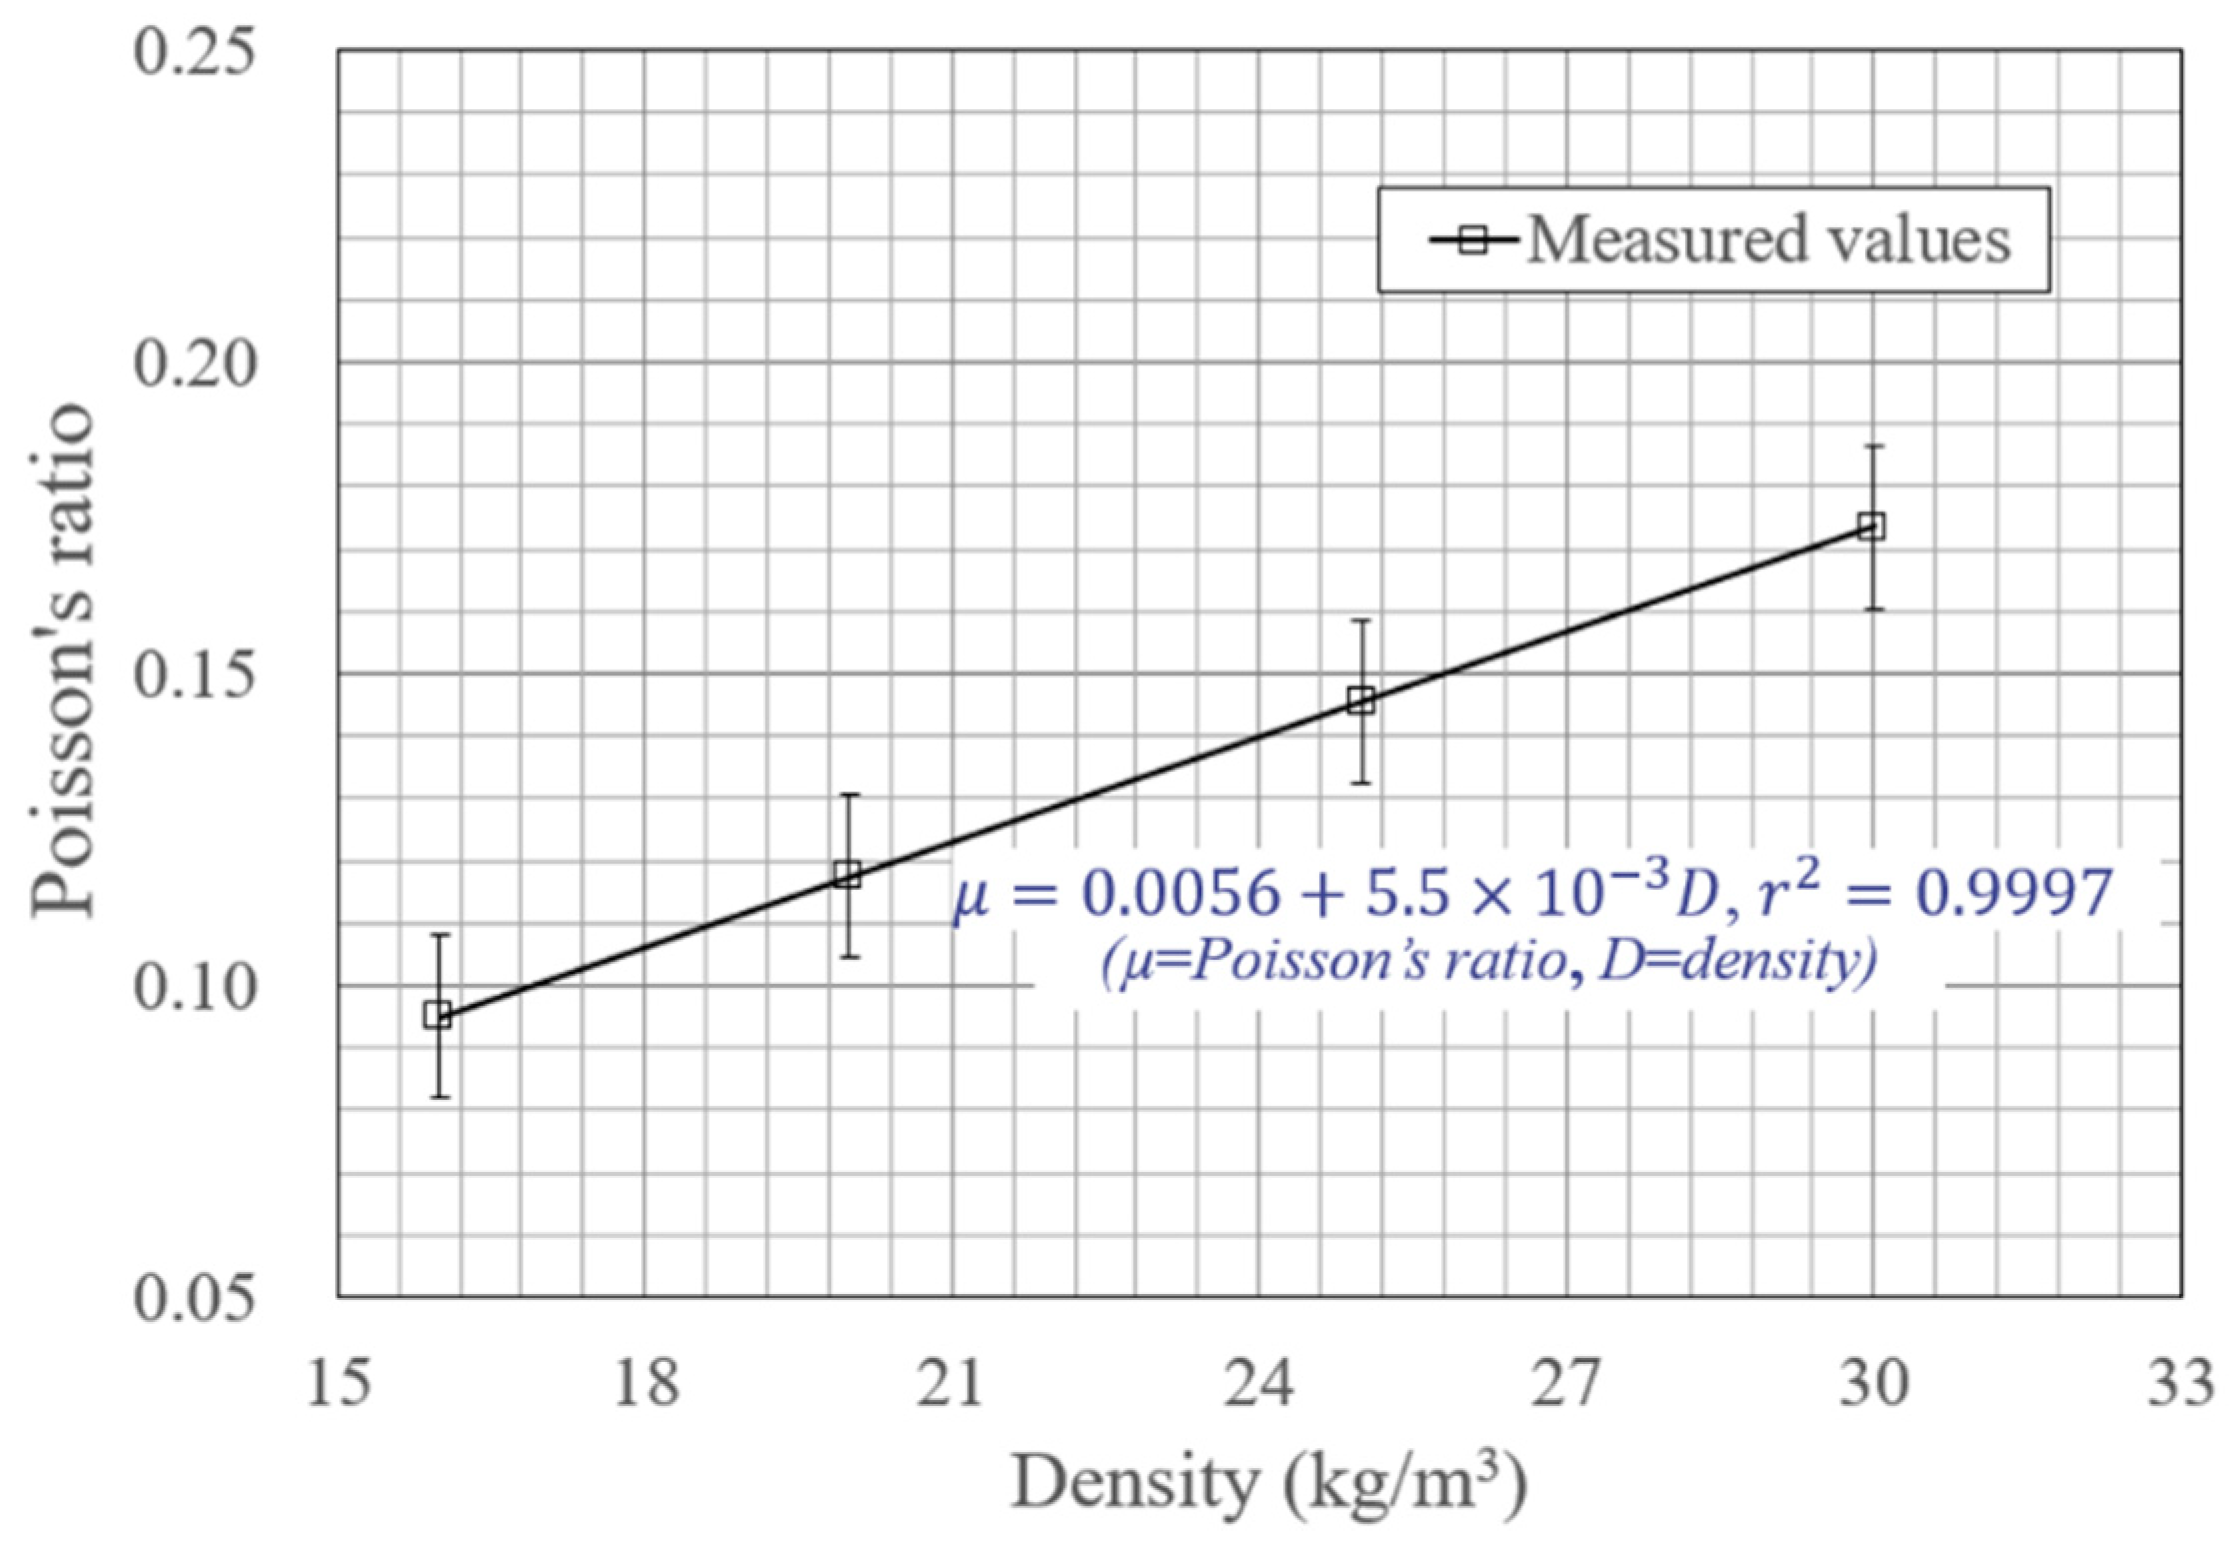
  • The EPS elastic modulus and Poisson’s ratio were analyzed as its elastic properties. Because the proportional limit and 10% strain strength of EPS did not exhibit temperature trends for temperatures in the 0–60 °C range, the elastic modulus and Poisson’s ratio were analyzed only for density dependence. Both mechanical properties were significantly affected by the EPS density and increased with increasing density. Compared with the initial tangent modulus (Young’s modulus) of the initial proportional portion, the secant modulus was approximately 35–38%, and the tangent modulus was approximately 5–9%. With increasing density, the EPS Poisson’s ratio increased almost linearly, and it was approximately 0.095–0.175 for densities in the 16–30 kg/m3 range.
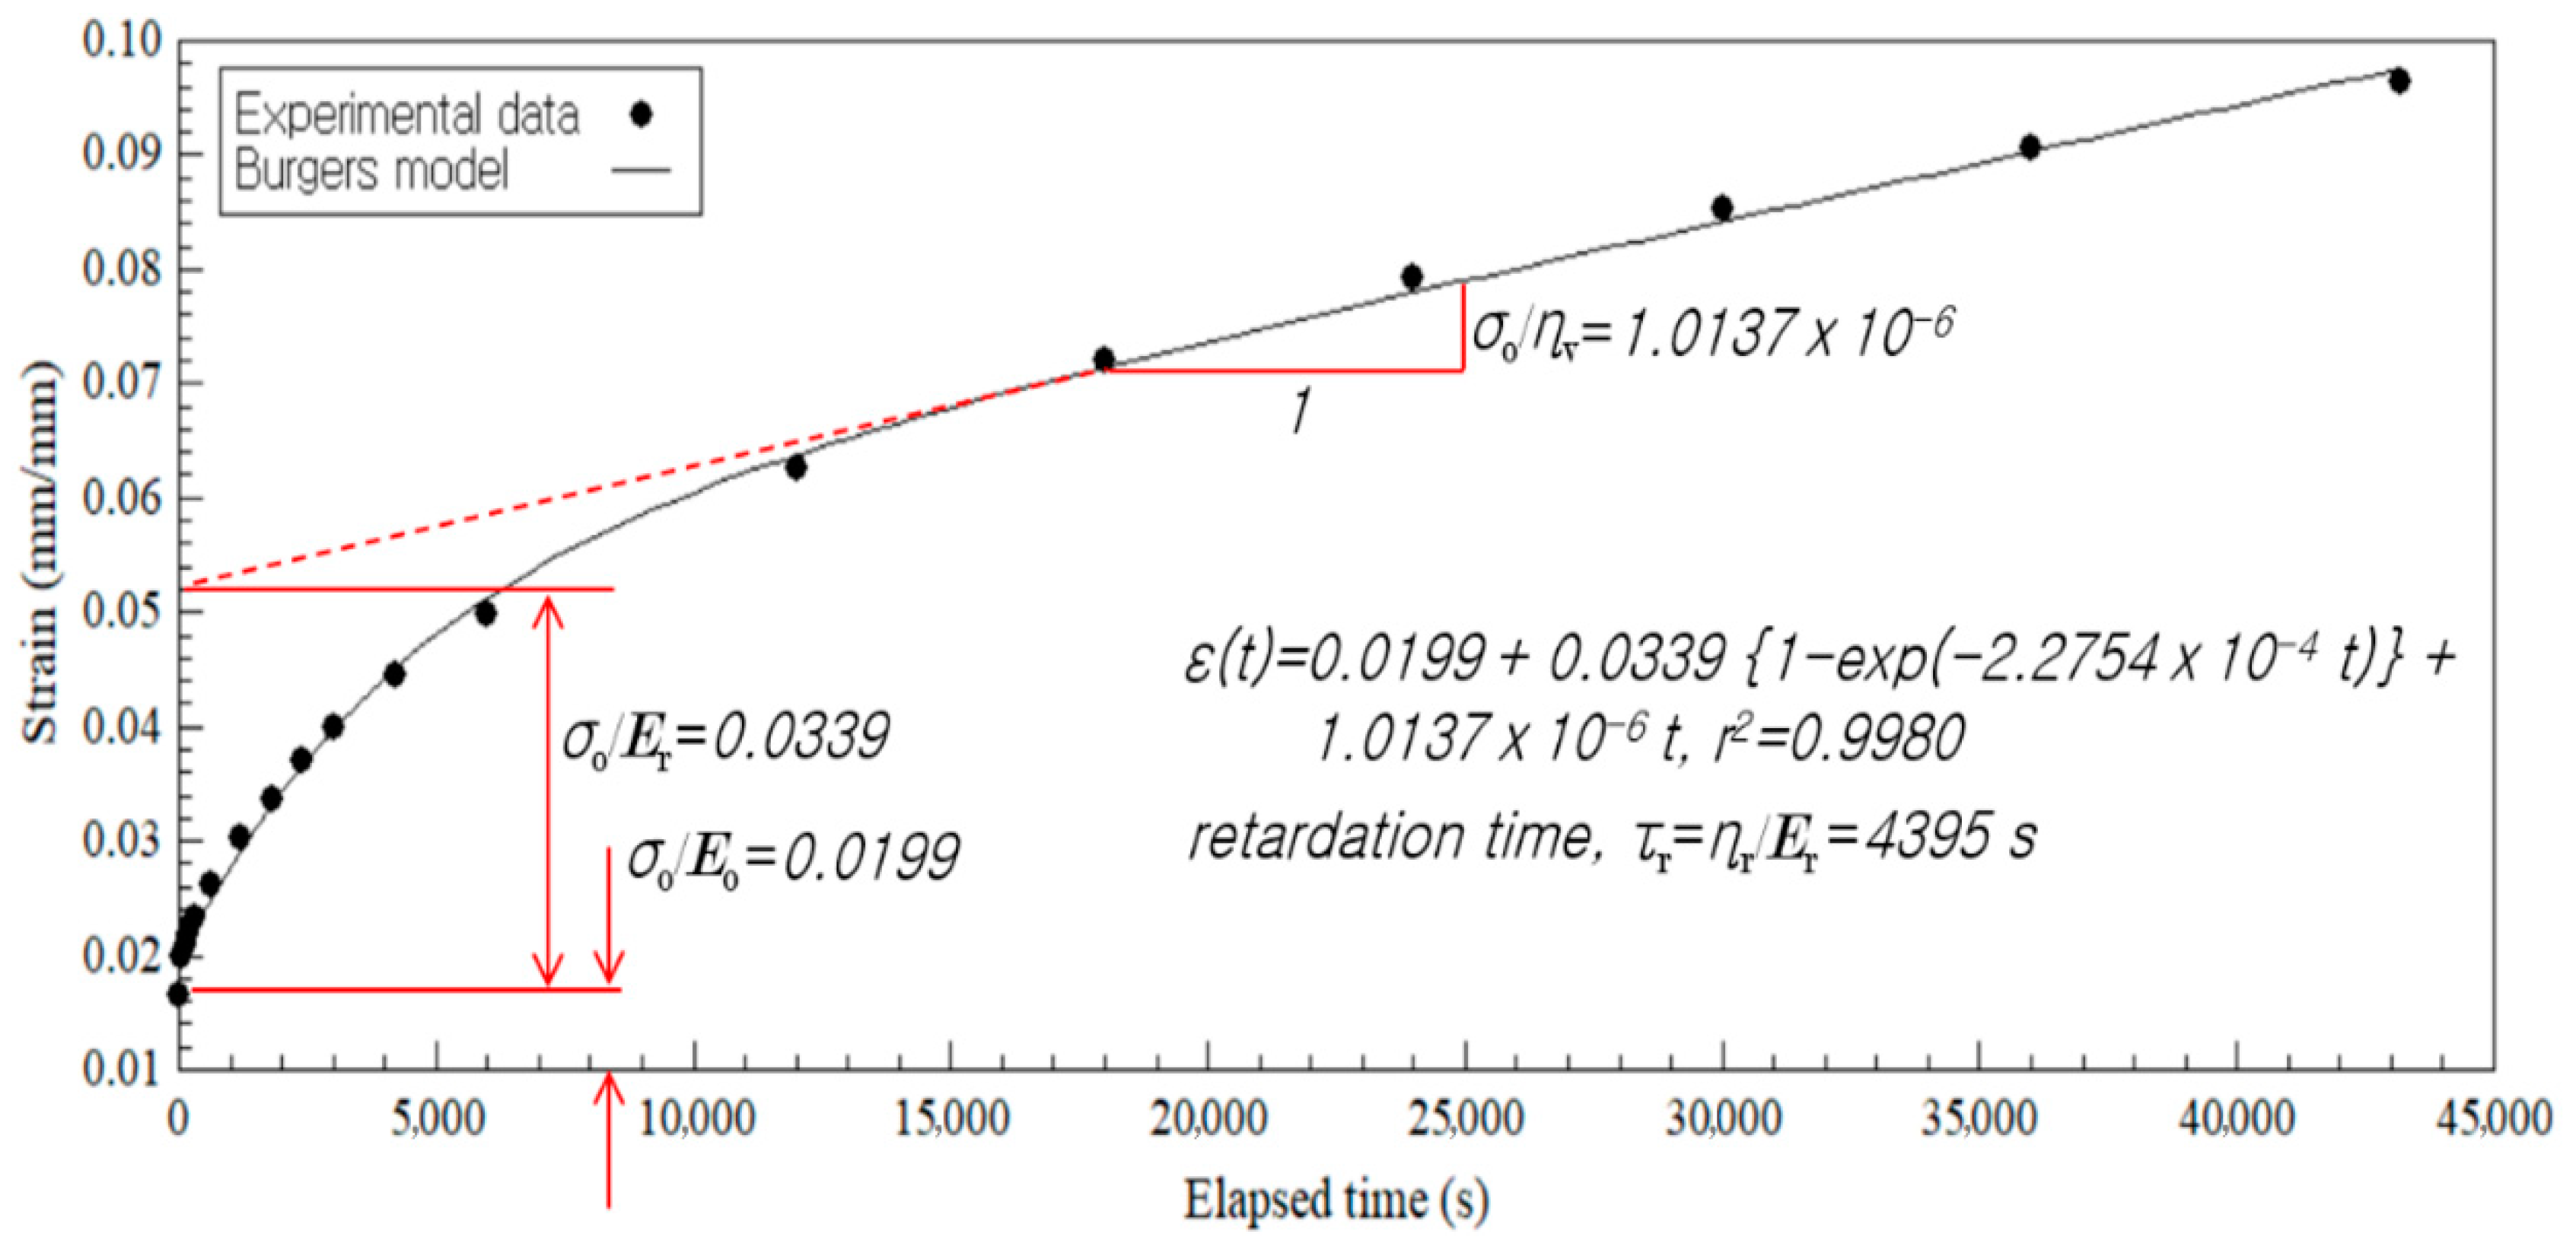
  • After describing the measured 12-h-long creep data using the Burgers model, the characteristics were qualitatively analyzed using the model’s constant values. The instantaneous elastic strain, creep amount, and rate of the transient and steady-state creep phases increased with increasing applied stress. In addition, along with these values, the retardation time significantly differed, depending on whether the applied stress was below or above the proportional limit. However, the effect of density on these properties could not be analyzed because the applied stress levels were different for different densities.
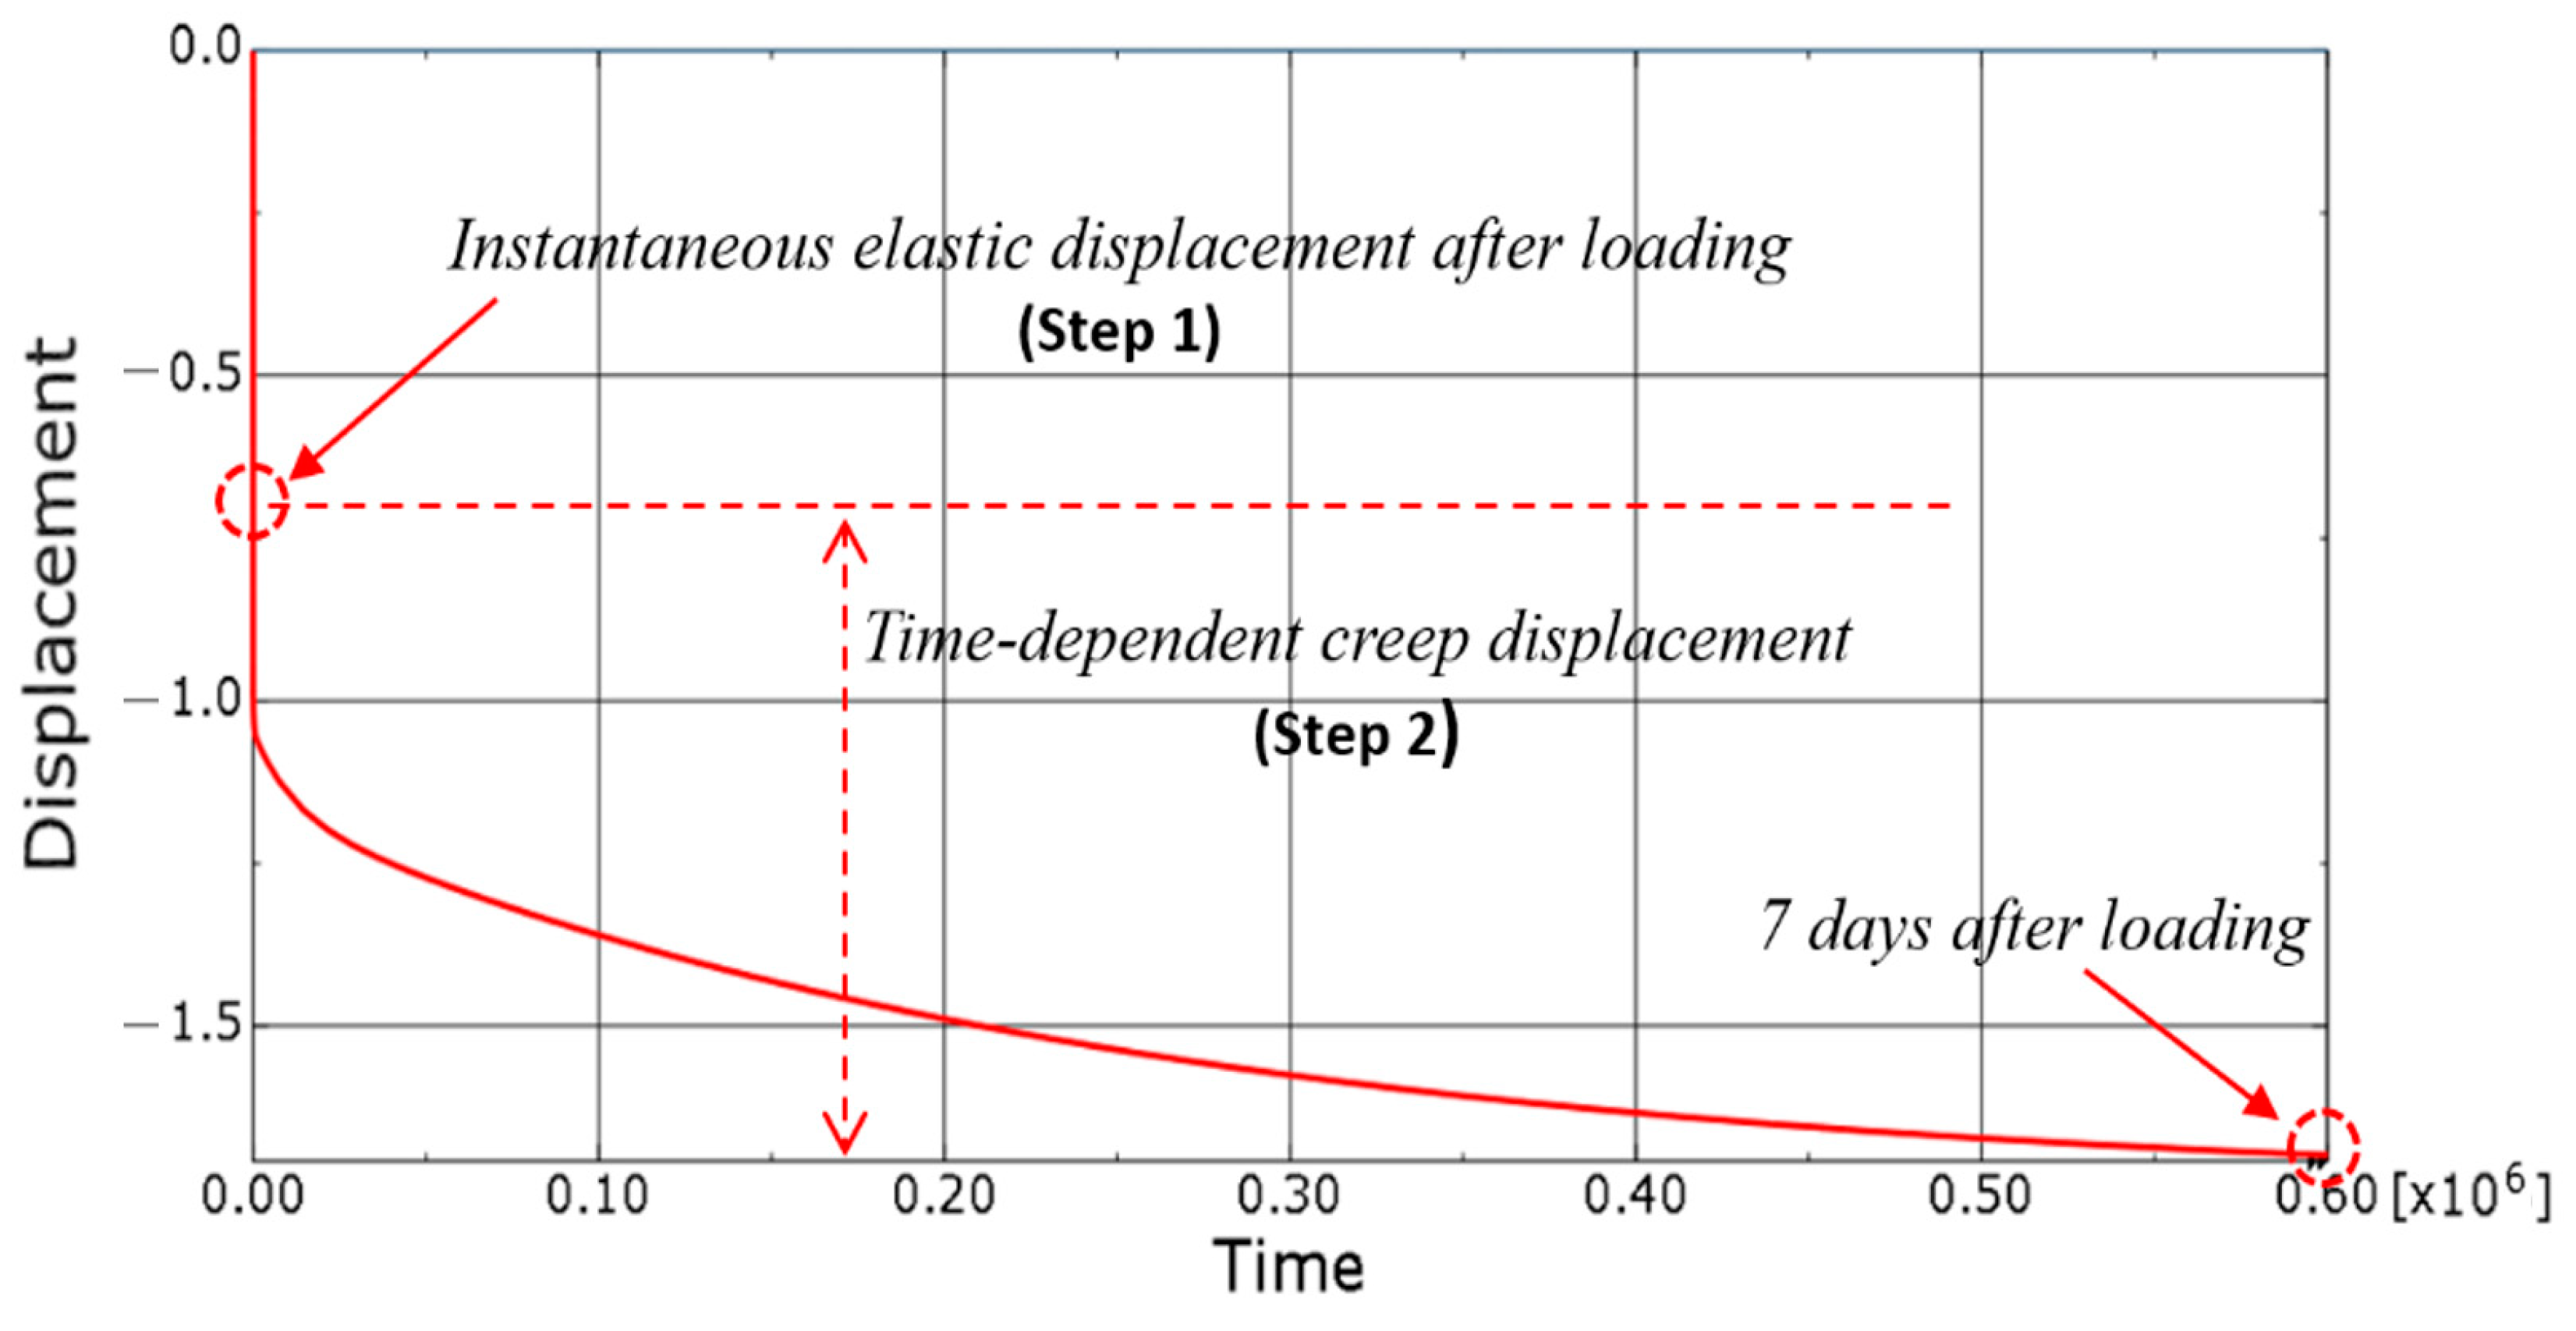
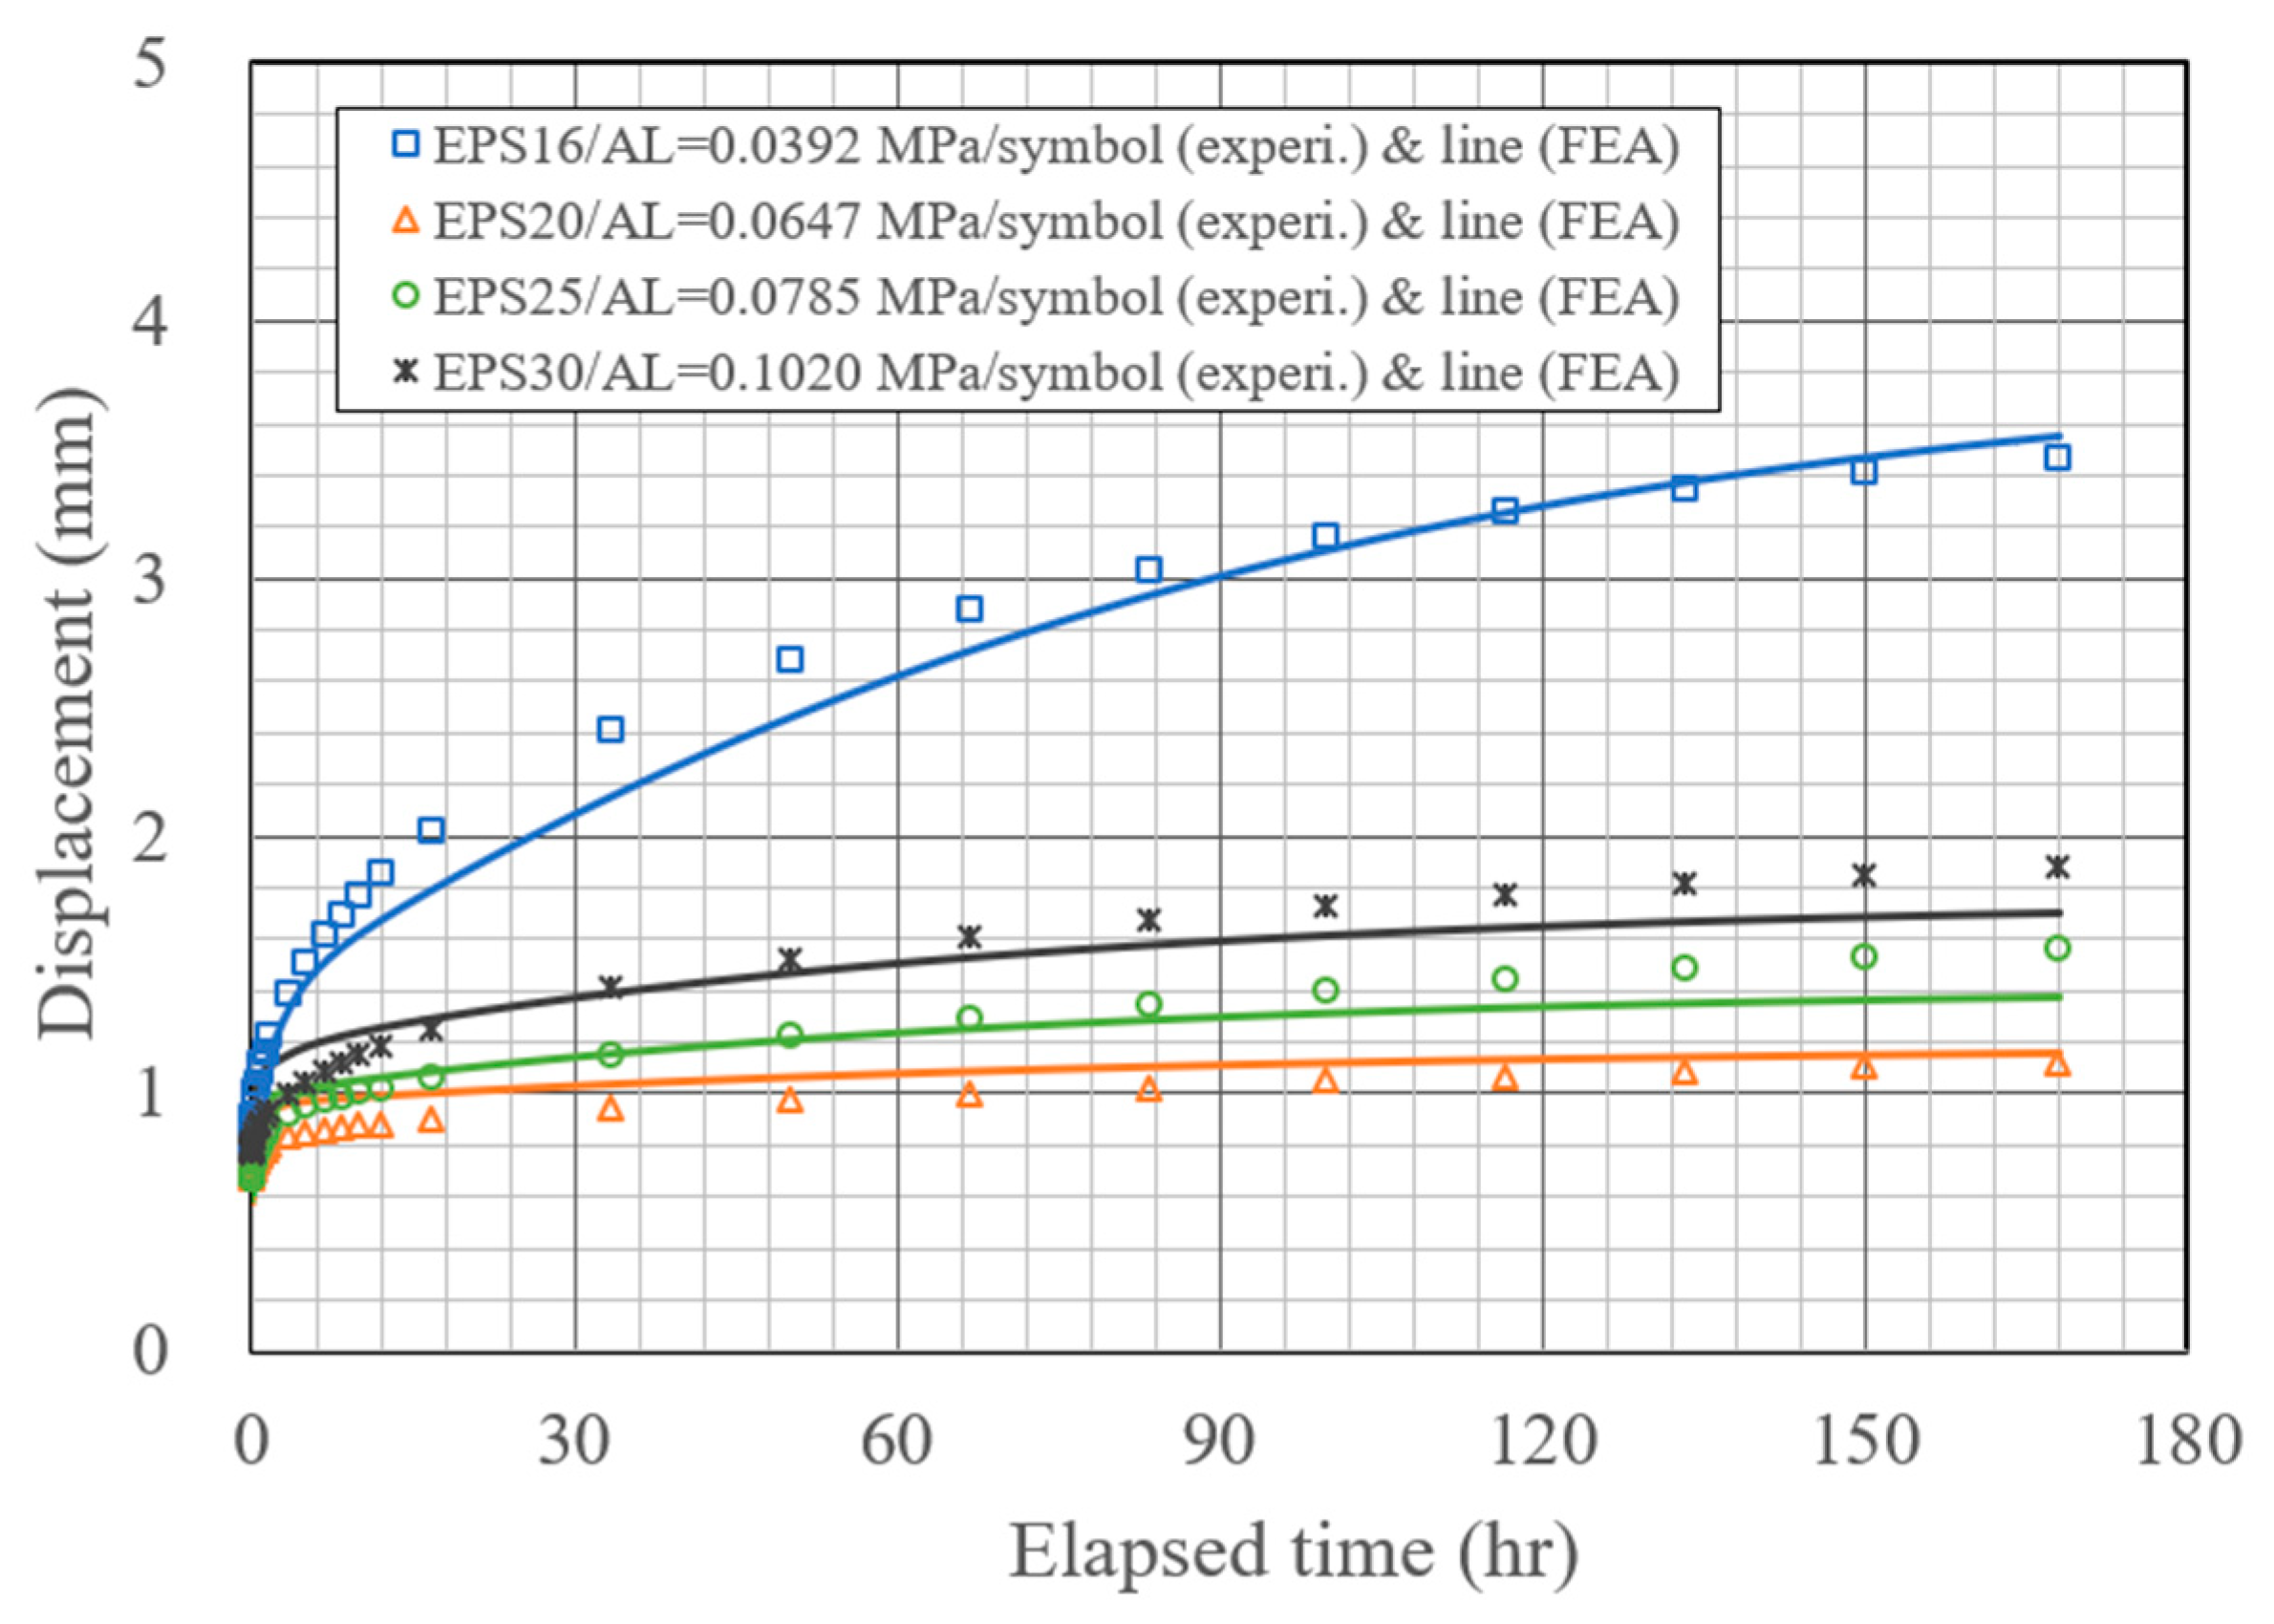
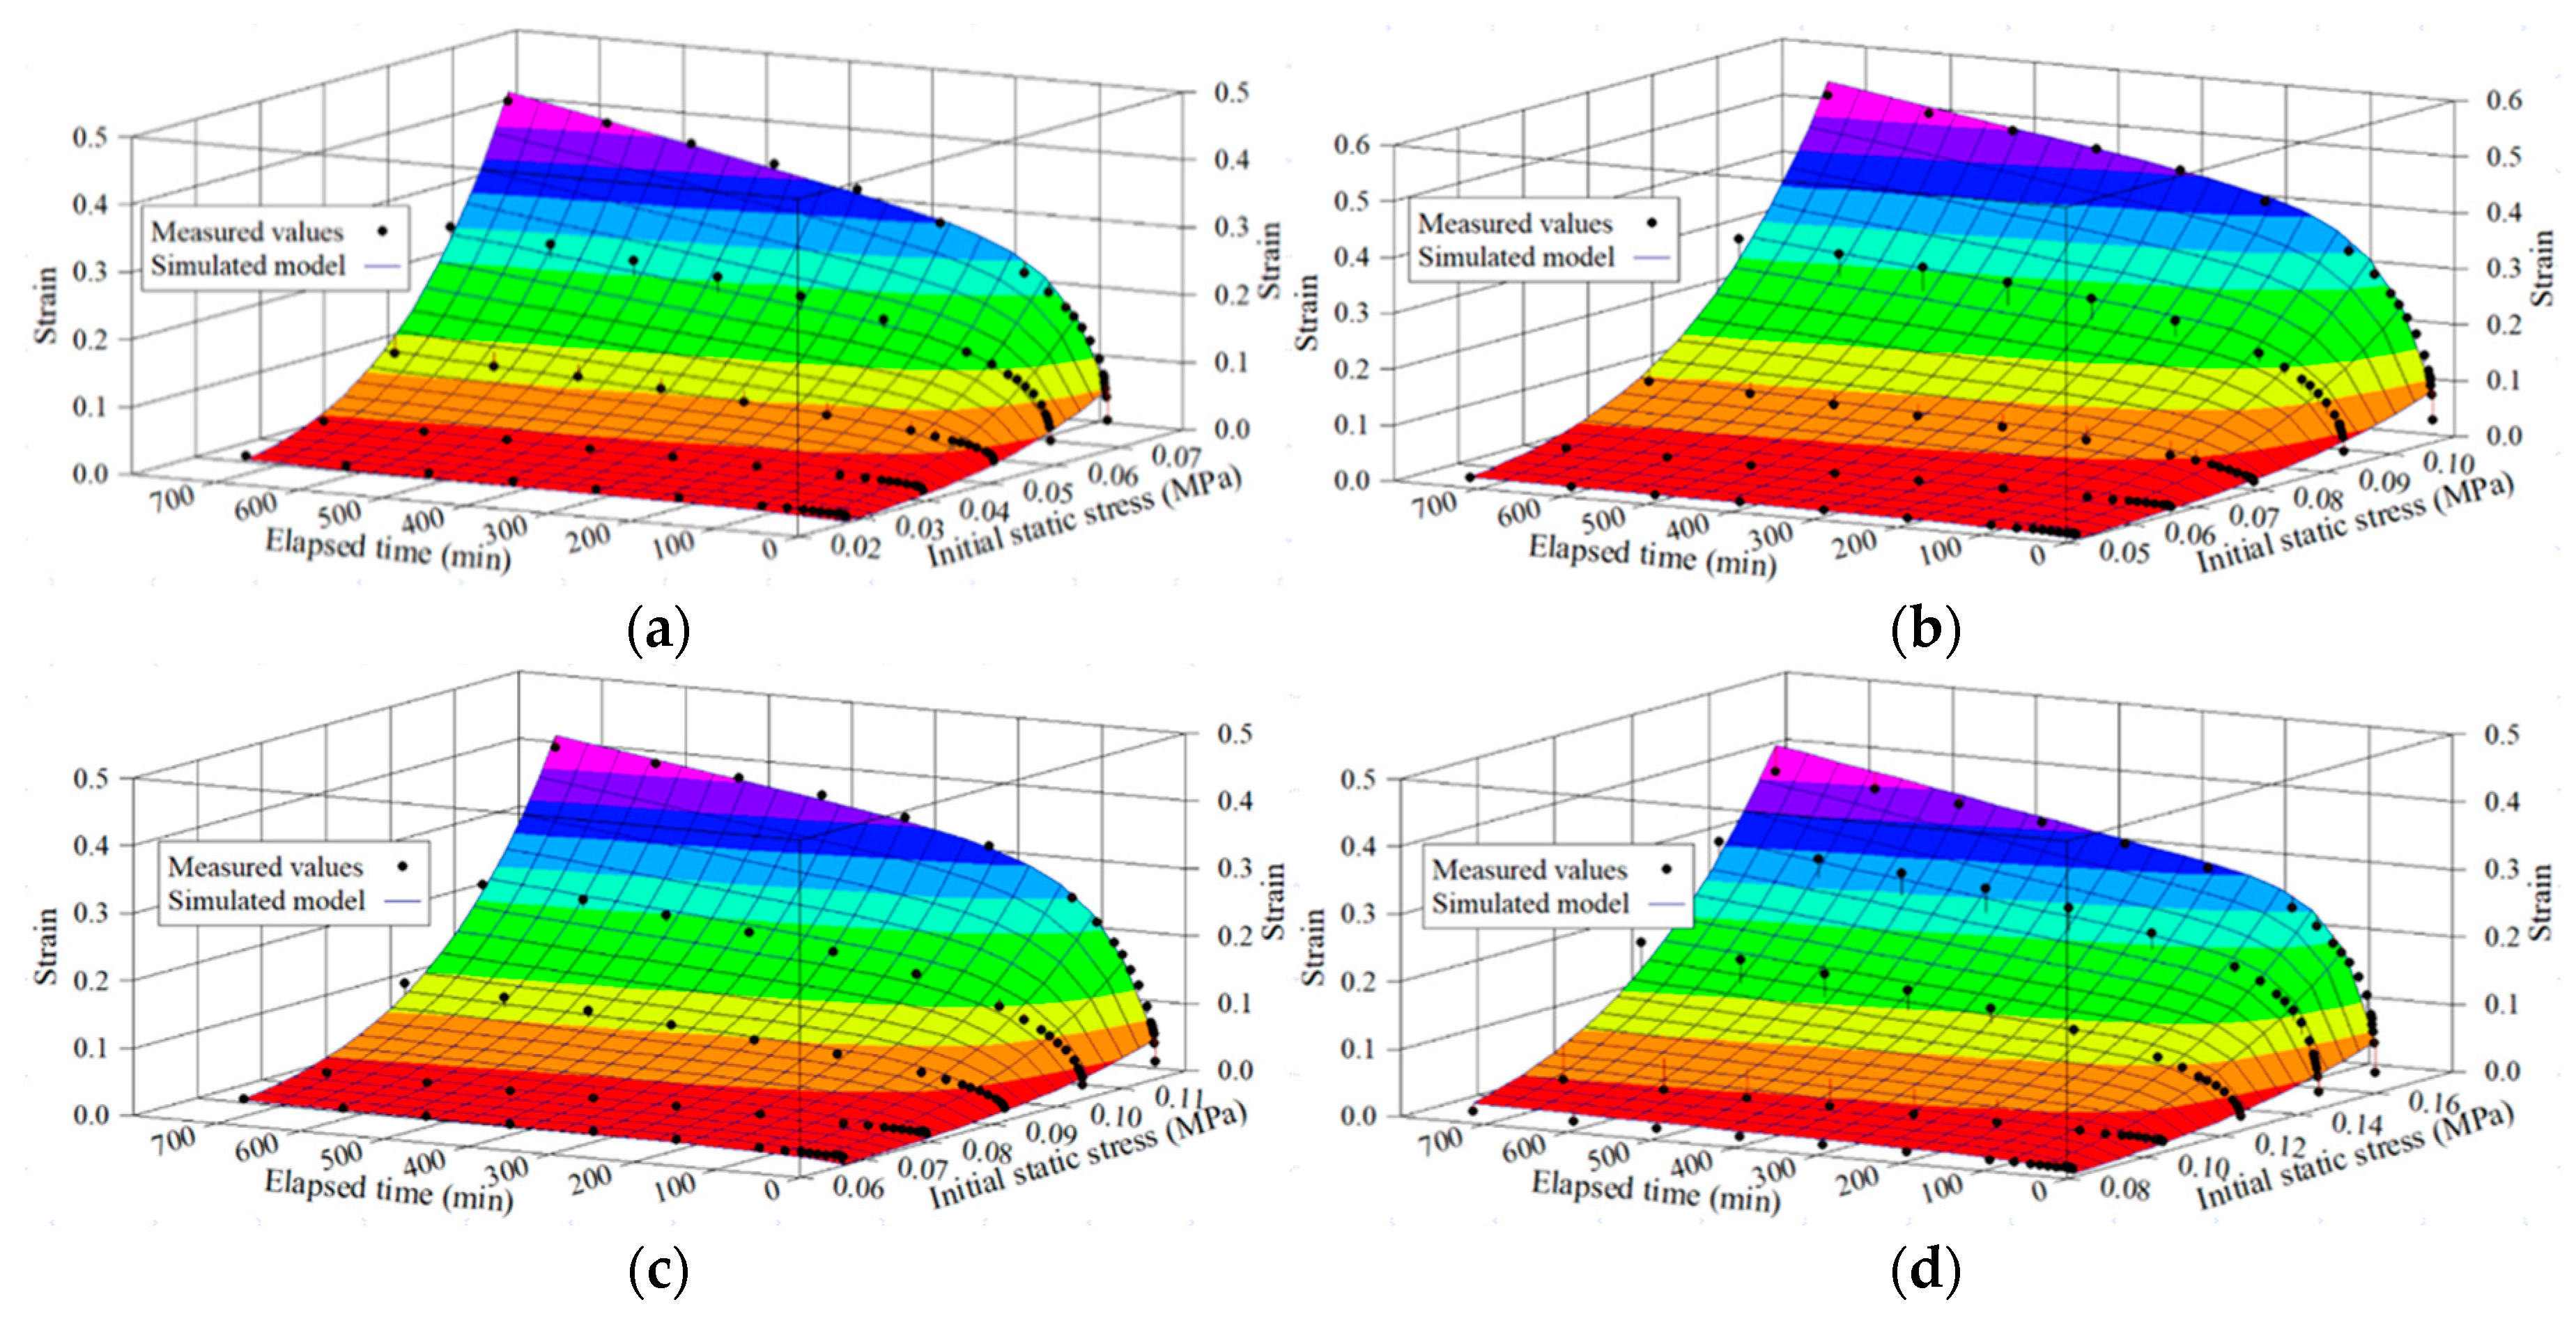
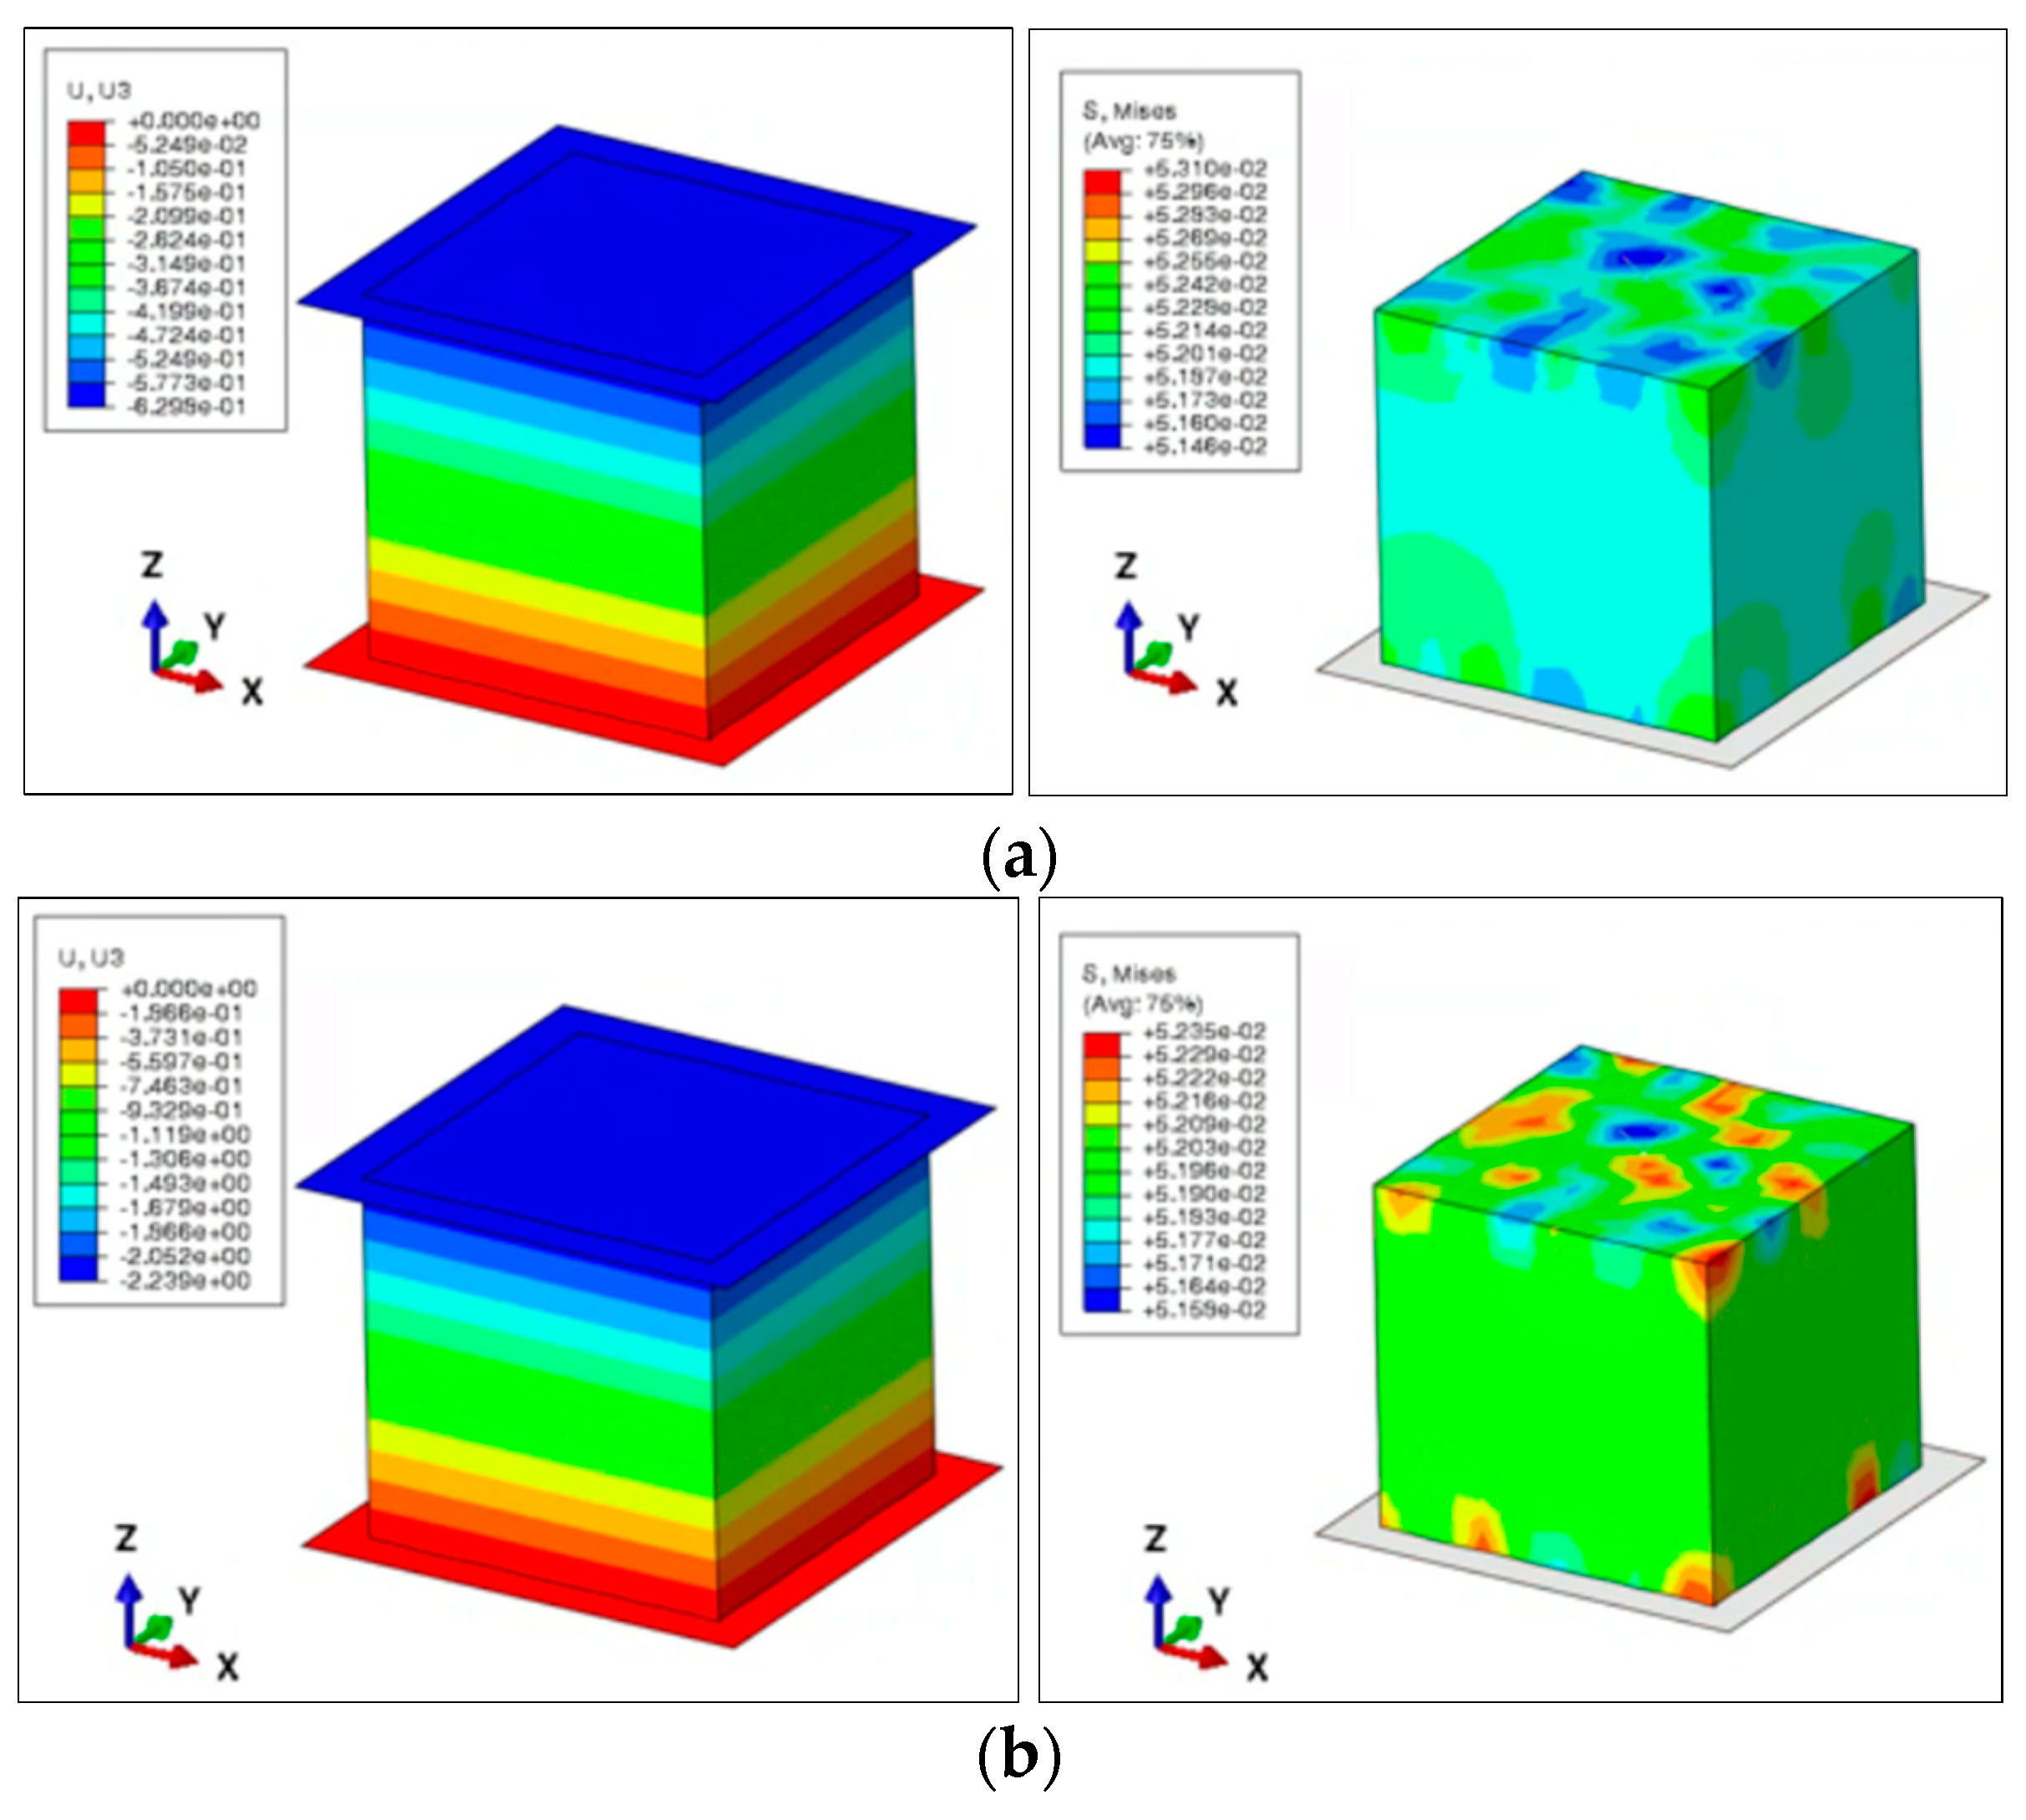
  • As a result of performing two-step FEA on the EPS creep behavior using the measured elastic modulus, Poisson’s ratio, and 7-day-long creep data, the concordance between the experimental and FEA results was 89.5–95.2% for step 1 and 88.4–97.7% for step 2; the overall concordance was very high, in the 90.3–100% range.
  • The values of the elastic and viscoelastic properties measured in this study were captured well by FEA. Therefore, by applying the validation results for creep behavior to the material properties in FEA, it is believed that the reliability of the FEA prediction for the inclination amount of unitized loads owing to the displacement of EPS-based cushioning systems in multiple stages of actual packaged appliances can be improved.

Author Contributions

Data curation, J.M.P. and H.M.J.; Formal analysis, J.M.P.; Funding acquisition, H.M.J.; Investigation, G.Y.L. and D.H.K.; Software, J.M.P. and H.M.J.; Validation, J.M.P.; Visualization, J.M.P.; Writing—original draft, J.M.P. and H.M.J.; Writing—review and editing, J.M.P. and H.M.J.; Supervision, H.M.J. All authors have read and agreed to the published version of the manuscript.

Funding

This research was carried out with the support of Cooperative Research Program for Agricultural Science and Technology Development (Project No.: PJ015618022022); Rural Development Administration.

Institutional Review Board Statement

Not applicable.

Informed Consent Statement

Not applicable.

Data Availability Statement

MDPI Research Data Policies.

Conflicts of Interest

The authors declare no conflict of interest.

References

  1. Park, J.M.; Han, J.G. Transport Packaging Design Engineering; Munundang: Seoul, Republic of Korea, 2011. [Google Scholar]
  2. Available online: https://polymerdatabase.com/polymer%20physics/Linear%20Viscoelasticity.html (accessed on 5 July 2022).
  3. Lim, S.D.; Rhee, J.M.; Nah, C.; Lee, S.H.; Lyu, M.Y. Predicting the long-term creep behavior of plastics using the short-term creep test. Intern. Polym. Process. 2004, 19, 313–318. [Google Scholar] [CrossRef]
  4. Penny, R.K. Design for Creep; McGraw-Hill: New York, NY, USA, 1971. [Google Scholar]
  5. Crawford, R.J. Plastics Engineering; Pergamon: New York, NY, USA, 1989. [Google Scholar]
  6. Carriere, C.J.; Bank, D.; Malanga, M. Evaluation and modeling of the high-temperature short-term creep performance of selected glass-filled semicrystalline and liquid crystalline polymers. J. Appl. Polym. Sci. 1998, 67, 1177–1183. [Google Scholar] [CrossRef]
  7. Deng, M.; Latour, R.A.; Ogale, A.A.; Shalaby, S.W. Study of creep behavior of ultra-high-molecular- weight polyethylene systems. J. Biomed. Mater. Res. 1998, 40, 214–223. [Google Scholar] [CrossRef]
  8. Akinay, A.E.; Brostow, W.; Maksimov, R. Prediction of long-term service performance of polymeric materials from short-term tests: Creep and prediction of the stress shift factor of a longitudinal polymer liquid crystal. Polym. Eng. Sci. 2001, 41, 977–981. [Google Scholar] [CrossRef]
  9. Gnip, I.Y.; Vaitkus, S.; Keršulis, V.; Vėjelis, S. Experiments for the long-term prediction of creep strain of expanded polystyrene under compressive stress. Polym. Test. 2010, 29, 693–700. [Google Scholar] [CrossRef]
  10. Gnip, I.Y.; Vaitkus, S.; Keršulis, V.; Vėjelis, S. Analytical description of the creep of expanded polystyrene (EPS) under long-term compressive loading. Polym. Test. 2010, 30, 493–500. [Google Scholar] [CrossRef]
  11. Sudduth, R.D. Development of a simplified relationship between uniaxial creep, stress relaxation, and constant strain-rate results for viscoelastic polymeric materials. J. Appl. Polym. Sci. 2001, 82, 527–540. [Google Scholar] [CrossRef]
  12. Dropic, M.J.; David, H.; Johnson, P.E.; David, E.; David, P.E. Developing an ANSYS creep model for polypropylene from experimental data. In Proceedings of the International ANSYS Conference, Canonsburg, PA, USA, 22–24 April 2002; Volume 161. [Google Scholar]
  13. ISO 844; Rigid Cellular Plastics—Determination of Compression Properties. ISO: Geneva, Switzerland, 2014.
  14. Awol, T. A Parametric Study of Creep on EPS Geofoam Embankments; Department of Civil and Transport Engineering, Norwegian University of Science and Technology: Trondheim, Norway, 2012. [Google Scholar]
  15. EPS Civil Engineering Method Development Organization. EPS Method; Science and Technology Book Co., Ltd.: Tokyo, Japan, 1993. [Google Scholar]
  16. Jung, C.H. Long-Term Behavior of the Soft Ground Improved by EPS. Ph.D. Thesis, Han-Yang University, Seoul, Republic of Korea, 2008. [Google Scholar]
  17. Marcondes, J.; Hatton, K.; Graham, J.; Schueneman, H. Effect of temperature on the cushioning properties of some foamed plastic materials. Packag. Technol. Sci. 2003, 16, 69–76. [Google Scholar] [CrossRef]
  18. Elragi, A.; Negussey, D.; Kyanka, G. Sample size effect on the behavior of EPS geofoam. In Proceedings of the Soft Ground Technology Conference, Noordwijkerhout, The Netherlands, 28 May–2 June 2001. [Google Scholar]
Figure 1. Typical creep behavior of a material, and the corresponding Burgers model.
Applsci 12 12663 g001
Figure 2. Typical SS curve and elastic modulus of EPS.
Applsci 12 12663 g002
Figure 3. Universal testing machine, with a lateral strain-measuring device for EPS specimens.
Applsci 12 12663 g003
Figure 4. Uniaxial compression creep test apparatus for EPS.
Applsci 12 12663 g004
Figure 5. FE modeling of EPS.
Applsci 12 12663 g005
Figure 6. SEM images for several conditions: EPS20. (a) Intact specimen. (b) Compression up to ε = 0.5. (c) an applied load (0.0791 MPa) for 12 h.
Applsci 12 12663 g006
Figure 7. Poisson’s ratio, for different EPS densities.
Applsci 12 12663 g007
Figure 8. Response surface analysis for 12-h-long creep monitoring of EPS. (a) ρ = 16 kg/m3; 0.0275 < σo < 0.0683 MPa. (b) ρ = 20 kg/m3; 0.0515 < σo < 0.1067 MPa. (c) ρ = 25 kg/m3; 0.0668 < σo < 0.1154 MPa. (d) ρ = 30 kg/m3; 0.0816 < σo < 0.1600 MPa.
Applsci 12 12663 g008
Figure 9. Example of the constant value determination for the Burgers model, using nonlinear regression analysis of measured data: ρ = 20 kg/m3, σo = 0.0791 MPa.
Applsci 12 12663 g009
Figure 10. Example of the stress and displacement distribution by step in the FEA: ρ = 18 kg/m3, σo = 0.0520 MPa. (a) the end point of step 1: (left) displacement, (right) stress. (b) the end point of step 2: (left) displacement, (right) stress.
Applsci 12 12663 g010
Figure 11. Example of a displacement change process by step in the FEA: ρ = 30 kg/m3, σo = 0.1020 MPa.
Applsci 12 12663 g011
Figure 12. Comparison of experimental and FEA results.
Applsci 12 12663 g012
Table 1. Proportional limit and 10% strain strength of EPS, for different density and temperature levels.
Density
(kg/m3)
Proportional Limit (kPa)10% Strain Strength (kPa)
0 °C20 °C40 °C60 °CAve.0 °C20 °C40 °C60 °CAve.
1645.17
(±2.25) aa
38.00
(±0.71) aa
45.17
(±2.25) aa
40.83
(±1.18) aa
42.29
(±3.50) a
94.45
(±2.64) aa
82.49
(±2.29) aa
79.64
(±1.94) ba
77.15
(±1.12) ba
83.97
(±6.99) a
2075.00
(±4.08) ab
74.00
(±3.26) ab
68.50
(±6.79) ab
69.17
(±3.12) ab
71.67
(±5.39) b
131.46
(±3.30) ab
125.80
(±5.81) ab
125.69
(±6.44) ab
121.98
(±2.08) ab
126.23
(±5.84) b
2577.50
(±6.12) ab
85.50
(±2.68) ab
79.00
(±4.32) bb
81.67
(±3.12) bb
80.92
(±5.24) c
155.92
(±5.45) ac
153.38
(±3.92) ac
143,12
(±4.92) bb
143.46
(±3.71) bc
149.50
(±7.29) c
30133.33
(±4.71) ac
121.67
(±9.20) ac
126.67
(±4.71) ac
118.33
(±2.36) ac
125.00
(±8.10) d
201.12
(±6.17) ad
190.82
(±6.27) ad
187.41
(±3.37) ab
191.39
(±2.72) ad
192.69
(±7.07) d
Note: Mean comparison by Duncan’s multiple range tests. a,b,c,d letters indicate the statistical difference in rows (0–60 °C) or columns (Ave.) (significant level at 5%).
Table 2. Density change of EPS with temperature conditions.
Density
(kg/m3)
Temperature Conditions
0 °C20 °C40 °C60 °C
1614.85 (±0.36)14.79 (±0.37)14.76 (±0.35)14.73 (±0.33)
2021.93 (±0.34)21.81 (±0.32)21.66 (±0.44)21.63 (±0.34)
2525.29 (±1.15)25.13 (±1.19)25.04 (±1.18)24.94 (±1.21)
3027.85 (±0.56)27.68 (±0.34)27.63 (±0.35)27.55 (±0.43)
Note: ( ) Standard deviation.
Table 3. Various elastic moduli of EPS, for different density levels.
Density (kg/m3)Initial Tangent Modulus (MPa)Secant Modulus (MPa)Tangent Modulus (MPa)
162.47 (±0.77) a0.86 (±0.06) a0.21 (± 0.04) a
203.71 (±0.68) b1.35 (±0.09) b0.24 (±0.03) b
254.43 (±0.67) c1.58 (±0.06) c0.26 (±0.02) b
305.48 (±0.76) d2.08 (±0.09) d0.29 (±0.03) c
Note: Mean comparison by Duncan’s multiple range tests. a,b,c,d letters indicate the statistical difference in columns (significance level at 5%).
Table 4. Nonlinear creep behavior modeling for 12-h-long creep experiment.
Density (kg/m3) ε ( σ o , t ) = a σ o b { c + d   t e x p ( e   t ) }
ε = Strain ,   σ o = Applied   Stress   ( MPa ) ,   t = Elapsed   Time   ( min )
r2
abcde
169302.77554.03841.49751.3301 × 10−30.01890.9856
2024,220.05355.07731.32758.4345 × 10−40.01740.9816
25143,392.34306.16851.25287.7452 × 10−40.01520.9912
30393.49064.14041.38211.0923 × 10−30.02540.9666
Table 5. Modeling results for the Burgers model, for 12-h-long creep test data and constant-value components.
ρ
(kg/m3)
σo
(MPa)
ε ( t ) = a + b { 1 e x p ( c   t ) } + d   t
ε = Creep   Strain ,   t = Elapsed   Time   ( min )
ε ( t ) = σ o / E o + σ o / E r { 1 e x p ( t / τ r ) } + ( σ o / η v ) t
ε = Creep   Strain ,   t = Elapsed   Time   ( min )
r2RMSE
abcdEo (MPa)Er (MPa)τr (=ηr/Er) (min)ηr (MPa·min)ηv (GPa·min)
160.02751.0722 × 10−22.6926 × 10−33.7601 × 10−37.7037 × 10−82.564810.213226627163570.96600.0003
0.03961.7717 × 10−27.3523 × 10−31.5326 × 10−32.6785 × 10−72.23515.386165235141480.97410.0009
0.05063.6583 × 10−23.8350 × 10−22.8778 × 10−41.0335 × 10−61.38321.319434754585490.99330.0020
0.05945.9483 × 10−21.0872 × 10−13.1283 × 10−42.5180 × 10−60.00010.546431971747230.99020.0073
0.06838.2382 × 10−21.8915 × 10−13.1658 × 10−44.0009 × 10−60.82910.361131591141170.98950.0126
200.05159.9962 × 10−31.2902 × 10−35.8918 × 10−32.5794 × 10−85.152039.9163170677519960.93300.0002
0.06631.3350 × 10−21.9925 × 10−34.8196 × 10−46.3724 × 10−84.966333.2748207569,04110400.97290.0003
0.07911.9877 × 10−23.3926 × 10−22.2754 × 10−41.0137 × 10−63.97952.3315439510,247780.99800.0012
0.09295.3796 × 10−21.5743 × 10−12.8596 × 10−42.3822 × 10−61.72690.590134972064390.99200.0081
0.10678.7636 × 10−22.8120 × 10−12.9380 × 10−43.7462 × 10−61.21750.379434041292280.99060.0151
250.06681.1938 × 10−21.6357 × 10−35.6336 × 10−34.7635 × 10−85.595640.8388178724914020.99120.0002
0.07981.3899 × 10−22.3701 × 10−37.1619 × 10−49.1388 × 10−85.741433.6695139647,0128730.97890.0003
0.09192.2338 × 10−23.5265 × 10−22.9475 × 10−41.5279 × 10−64.11412.606033938841600.99800.0015
0.10413.2834 × 10−21.1166 × 10−12.4005 × 10−42.2137 × 10−63.17050.932341663884470.99600.0045
0.11545.5720 × 10−22.5038 × 10−12.5597 × 10−42.5471 × 10−62.07110.460939071801450.99470.0095
300.08161.1648 × 10−21.1604 × 10−31.1285 × 10−32.6919 × 10−87.005570.320688662,31330310.95010.0002
0.10511.6079 × 10−22.4708 × 10−37.1882 × 10−41.2263 × 10−76.536542.5368139159,1768570.98790.0003
0.12522.8607 × 10−27.9818 × 10−22.2586 × 10−42.0784 × 10−64.37661.568644286945600.99720.0030
0.14535.0086 × 10−21.5399 × 10−14.3309 × 10−42.7316 × 10−62.90100.943623092179530.98980.0093
0.16007.4948 × 10−21.9061 × 10−14.6066 × 10−43.2471 × 10−62.13480.839421711822490.98280.0148
Table 6. Concordance of experimental and FEA results.
Divisionρ = 16 kg/m3ρ = 20 kg/m3ρ = 25 kg/m3ρ = 30 kg/m3
Step 1Step 2Step 1Step 2Step 1Step 2Step 1Step 2
Experiment (a)0.763.470.641.110.621.550.721.88
FEA (b)0.683.550.581.160.591.370.671.70
Conformity (1)89.5%97.7%90.6%95.7%95.2%88.4%93.1%90.4%
100%99.4%90.3%91.2%
Note: (1) (upper) (b)/(a) or (a)/(b), (lower) {(b) of step 1 + step 2}/{(a) of step 1 + step 2}.
Publisher’s Note: MDPI stays neutral with regard to jurisdictional claims in published maps and institutional affiliations.

