Article

Detection of Miss-Seeding of Sweet Corn in a Plug Tray Using a Residual Attention Network

1
School of Information and Control Engineering, Qingdao University of Technology, Qingdao 266525, China
2
Shandong Computer Science Center (National Supercomputer Center in Jinan), Qilu University of Technology, Jinan 250014, China
3
Communication College, Qingdao Agricultural University, Qingdao 266109, China
*
Author to whom correspondence should be addressed.
Appl. Sci. 2022, 12(24), 12604; https://doi.org/10.3390/app122412604
Submission received: 4 November 2022 / Revised: 4 December 2022 / Accepted: 5 December 2022 / Published: 8 December 2022

Abstract

:
With the promotion of artificial intelligence in agriculture and the popularization of plug tray seedling-raising technology, seedling raising and transplanting have become the most popular planting modes. Miss-seeding is one of the most serious problems affecting seedling raising and transplanting. It not only affects the germination rate of seeds but also reduces the utilization rate of the plug tray. The experimental analysis of traditional machine vision-based miss-seeding showed that because of uneven lighting, the plug tray was wrongly identified as a seed under bright light, but the seeds in the dark were not easy to identify. When using the seeding area to identify seeds and noise, sweet corn seeds in a small area can be easily screened out. This paper proposes a method using the ResNet network with an attention mechanism to solve the above-mentioned problems. In this paper, the captured image was segmented into the images of a single plug tray, and a residual attention network was built; the detection scheme of miss-seeding was also converted into a dichotomous picture recognition task. This paper demonstrates that the residual attention network can effectively recognize and detect the seed images of sweet corn with very high accuracy. The results of the experiment showed that the average accuracy of this recognition model was 98%. The feature visualization method was used to analyze the features, further proving the effectiveness of the classification method of plug tray seedlings.

1. Introduction

Sweet corn has great market potential and huge development prospects in China due to its high nutritional value and good taste; thus, its planting area is expanding yearly. The seedling transplanting method is widely adopted in the planting industry because it has many advantages, such as saving seeds, increasing the survival rate of seedlings, and improving the efficiency of transplantation. Bai [1] stated that miss-seeding occurs in the presence of cavities at rates ranging from 5% to 20% after the seeding operation because sweet corn seeds are dry and different in shape and size. It seriously affects the planting efficiency of sweet corn and the utilization rate of a plug tray. Manual reseeding has high costs and low efficiency, and therefore, it is vital to consider mechanized reseeding. The first step of mechanized reseeding is to realize the automatic detection of missed seeding. However, machine vision is the key technology to realize automatic miss-seeding detection.
With the rapid development of artificial intelligence, machine vision occupies an important position in image recognition [2]. Campanile [3] used machine vision to extract features such as seed morphology and color from seed images to identify and classify plant species. Wang [4] and Lv [5] used machine vision to extract the seed contour feature to realize the recognition and classification of corn seeds. Li [6] realized the classification of different corn [7] varieties (white, yellow, and purple) using hyperspectral imaging (HSI) and the PLS-DA classification model. Xia [8] used hyperspectral imaging combined with multi-linear discriminant analysis (MLDA) to realize the recognition and classification of corn seeds. Wakholi [9] used the HSI classification and the support vector machine (SVM) model to classify viable corn seeds. Liao [10] realized the classification of haploid and diploid corn seeds by combining hyperspectral imaging technology with the VGG-19 network. Most of these studies on corn seeds were carried out in a single concept and an undisturbed environment and focused on corn seeds with a regular shape. Sweet corn seeds have different shapes and sizes. The method combining machine vision and seed contour extraction is not suitable for the recognition of sweet corn seeds. The high cost of hyperspectral imaging increases the cost of planting sweet corn, and therefore, the methods combined with hyperspectral imaging are not applicable for corn seed identification.
The convolutional neural network (CNN) can automatically learn the features of the input image. The network can solve the overfitting problem by weight sharing and local connection, and thus, it has achieved excellent results in various image recognition tasks [11]. Girshick [12] used deep neural networks (DNN) to achieve the target classification and high accuracy of target detection in experiments. Javanmardi [13] completed the classification of corn seed varieties by combining the convolutional neural network (CNN) and artificial neural network (ANN). Chen [14] used the VGG network to complete the recognition task of corn and rice. With the deepening of network layers, the network is prone to problems such as gradient dispersion and network degradation. Compared with other network models, the ResNet model with the recognition task can deal with overfitting and has a greater ability for the recognition and classification of seed varieties [15]. Therefore, this paper proposes a detection method for miss-seeding based on the ResNet network. The sample of the original color image was segmented into a captured image of the single plug tray. It could not only avoid the problem of misidentifying the seeds in the seedling plug tray due to bright light but also improve the recognition accuracy by narrowing the recognition range. To fully use the color difference between the sweet corn seeds and the plug tray, we introduced the CBAM module to the residual module, which improved the recognition accuracy of the network.

2. Materials and Methods

2.1. Experimental Materials

In this study, the sweet corn seed variety used was Lu tian 105, with a yellow and white color. The seedling plug tray had 128 cells (8 rows and 16 columns), and both the soil substrates and the plug tray were black.

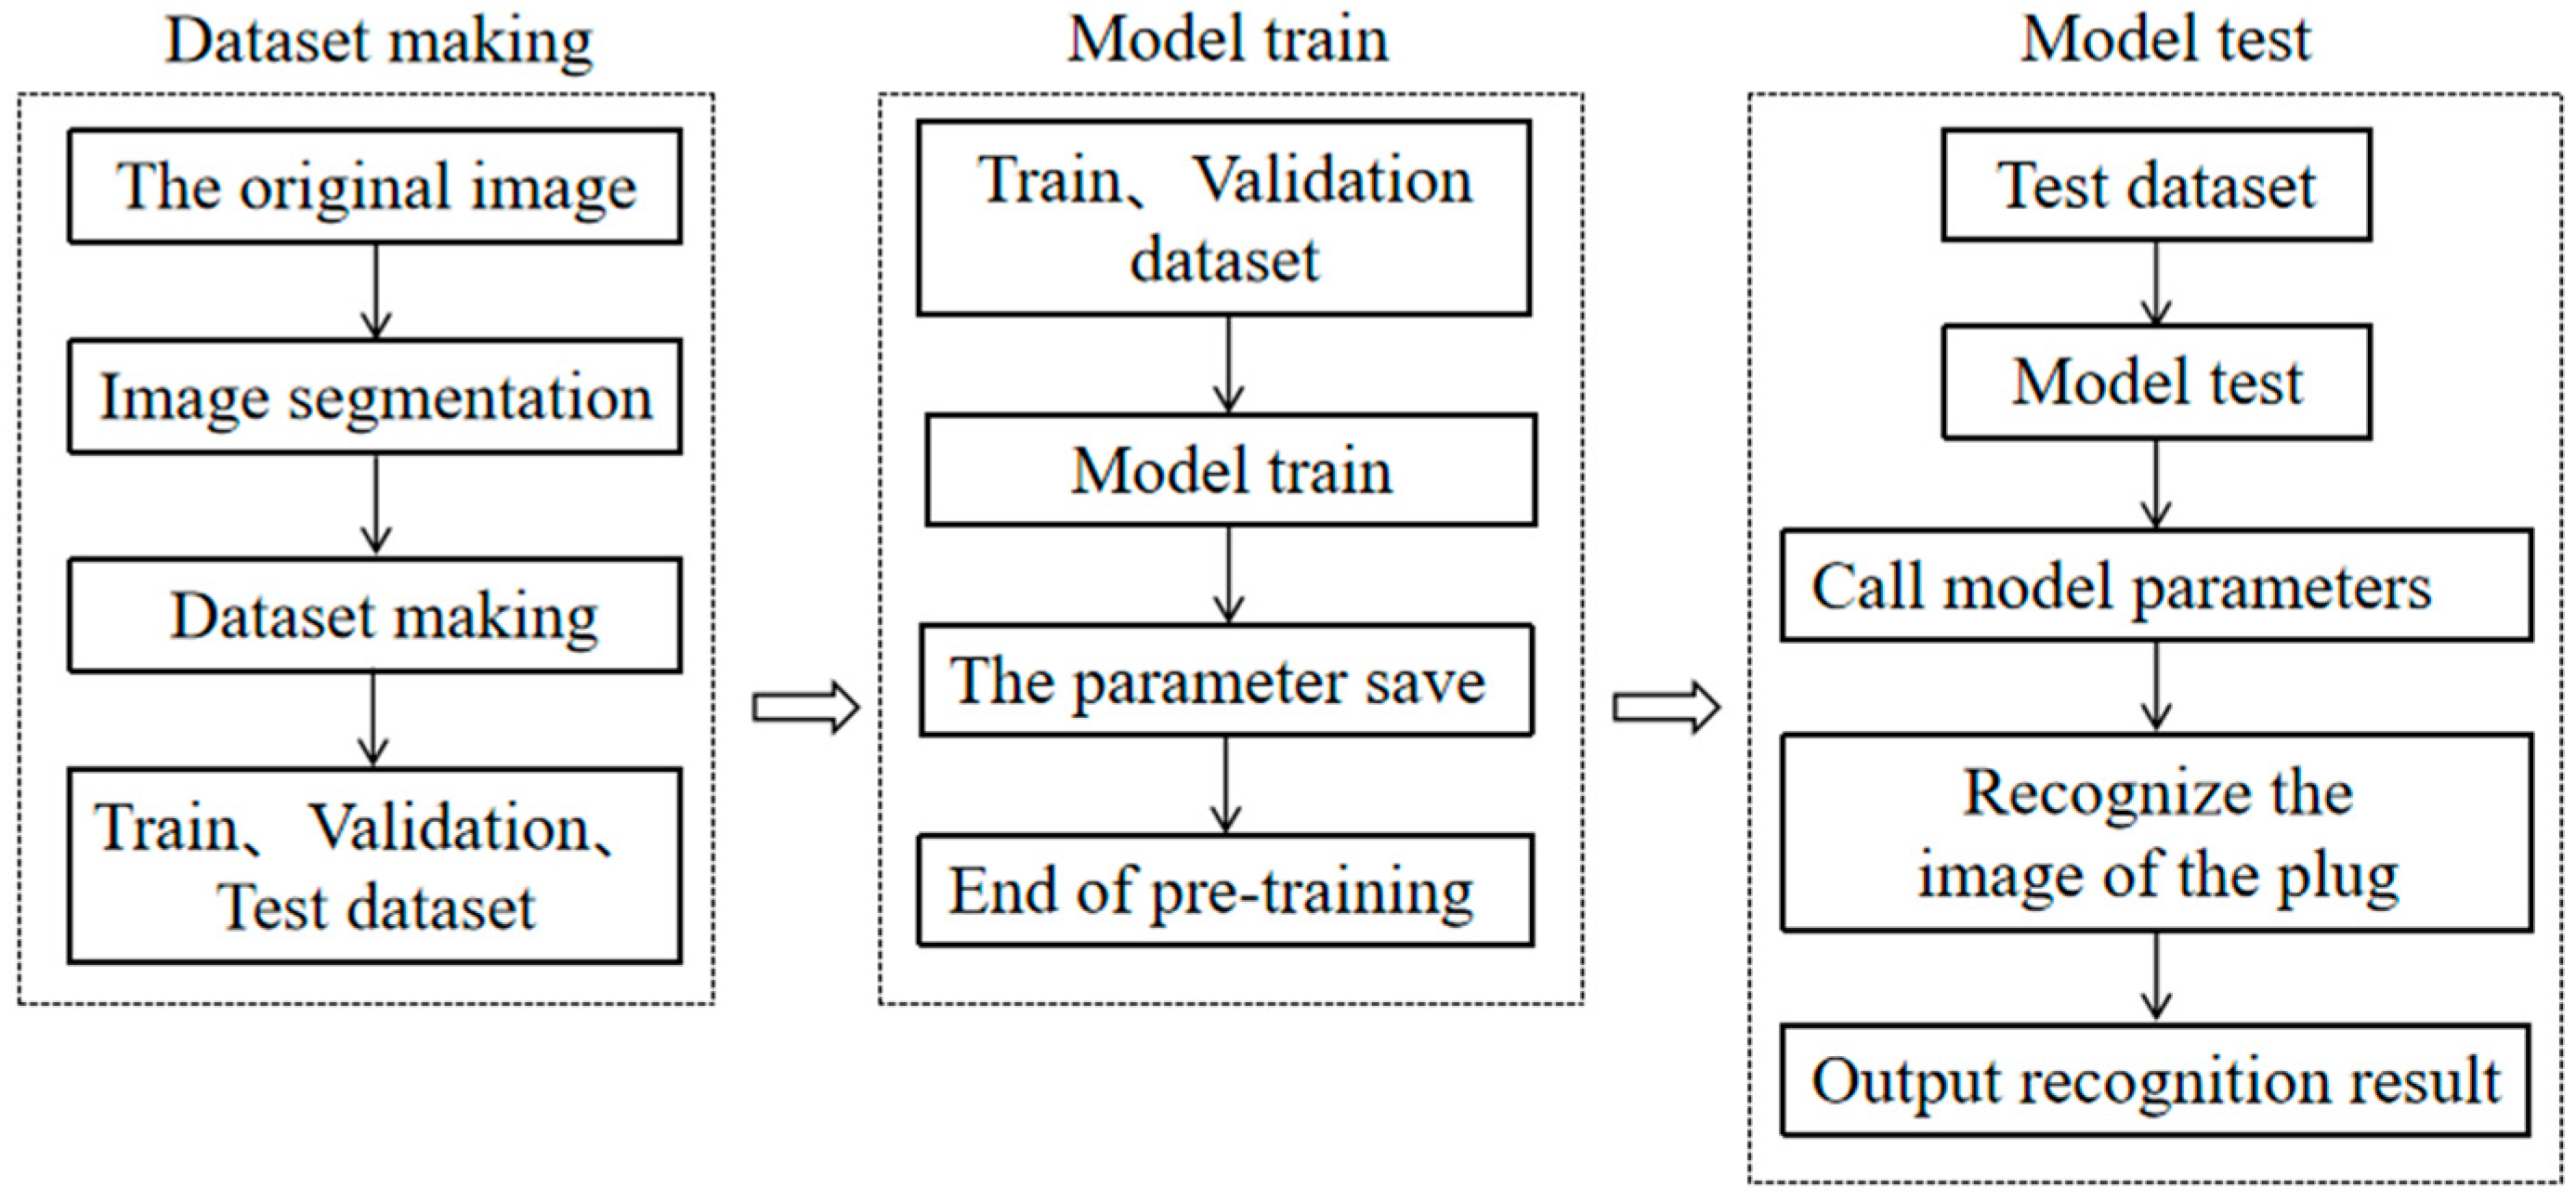
2.2. Experimental Method

The detection experiment of miss-seeding was mainly divided into three parts: dataset creation, model training, and model testing, and its design is shown in the flow chart of Figure 1.

2.3. Description of Datasets

In this study, a camera was used to take pictures of the plug tray containing the corn kernels to obtain original images. The distribution of the seeds in the plug tray was designed according to the 6% rate of empty cells, e.g., each plug tray had eight empty cells (without corn kernels). Moreover, the plug tray position was set according to the following rules: the white area represents the location of the empty cells, whereas the yellow area represents the regional location of the empty cells, and the green regions represent the plug tray cells containing corn seeds, as shown in Figure 2.
The image classification based on computer vision involves three blocks: namely, image preparation, segmentation, and enhancement. The segmented images were classified and labeled. The empty cells were marked as 1 and 0. In this paper, the plug tray specification was classified as a dichotomous recognition task, and thus, a simple image segmentation method could meet the needs. The photos taken before image segmentation are shown in Figure 3, while the photos taken after image segmentation are shown in Figure 4.
The datasets were expanded to the size of 15,000 images by rotating, mirroring, enhancing brightness, contrast, etc. The datasets were divided randomly into two parts, namely, training and verification datasets. The rates of the training and verification datasets were maintained at 70% and 30%, respectively.

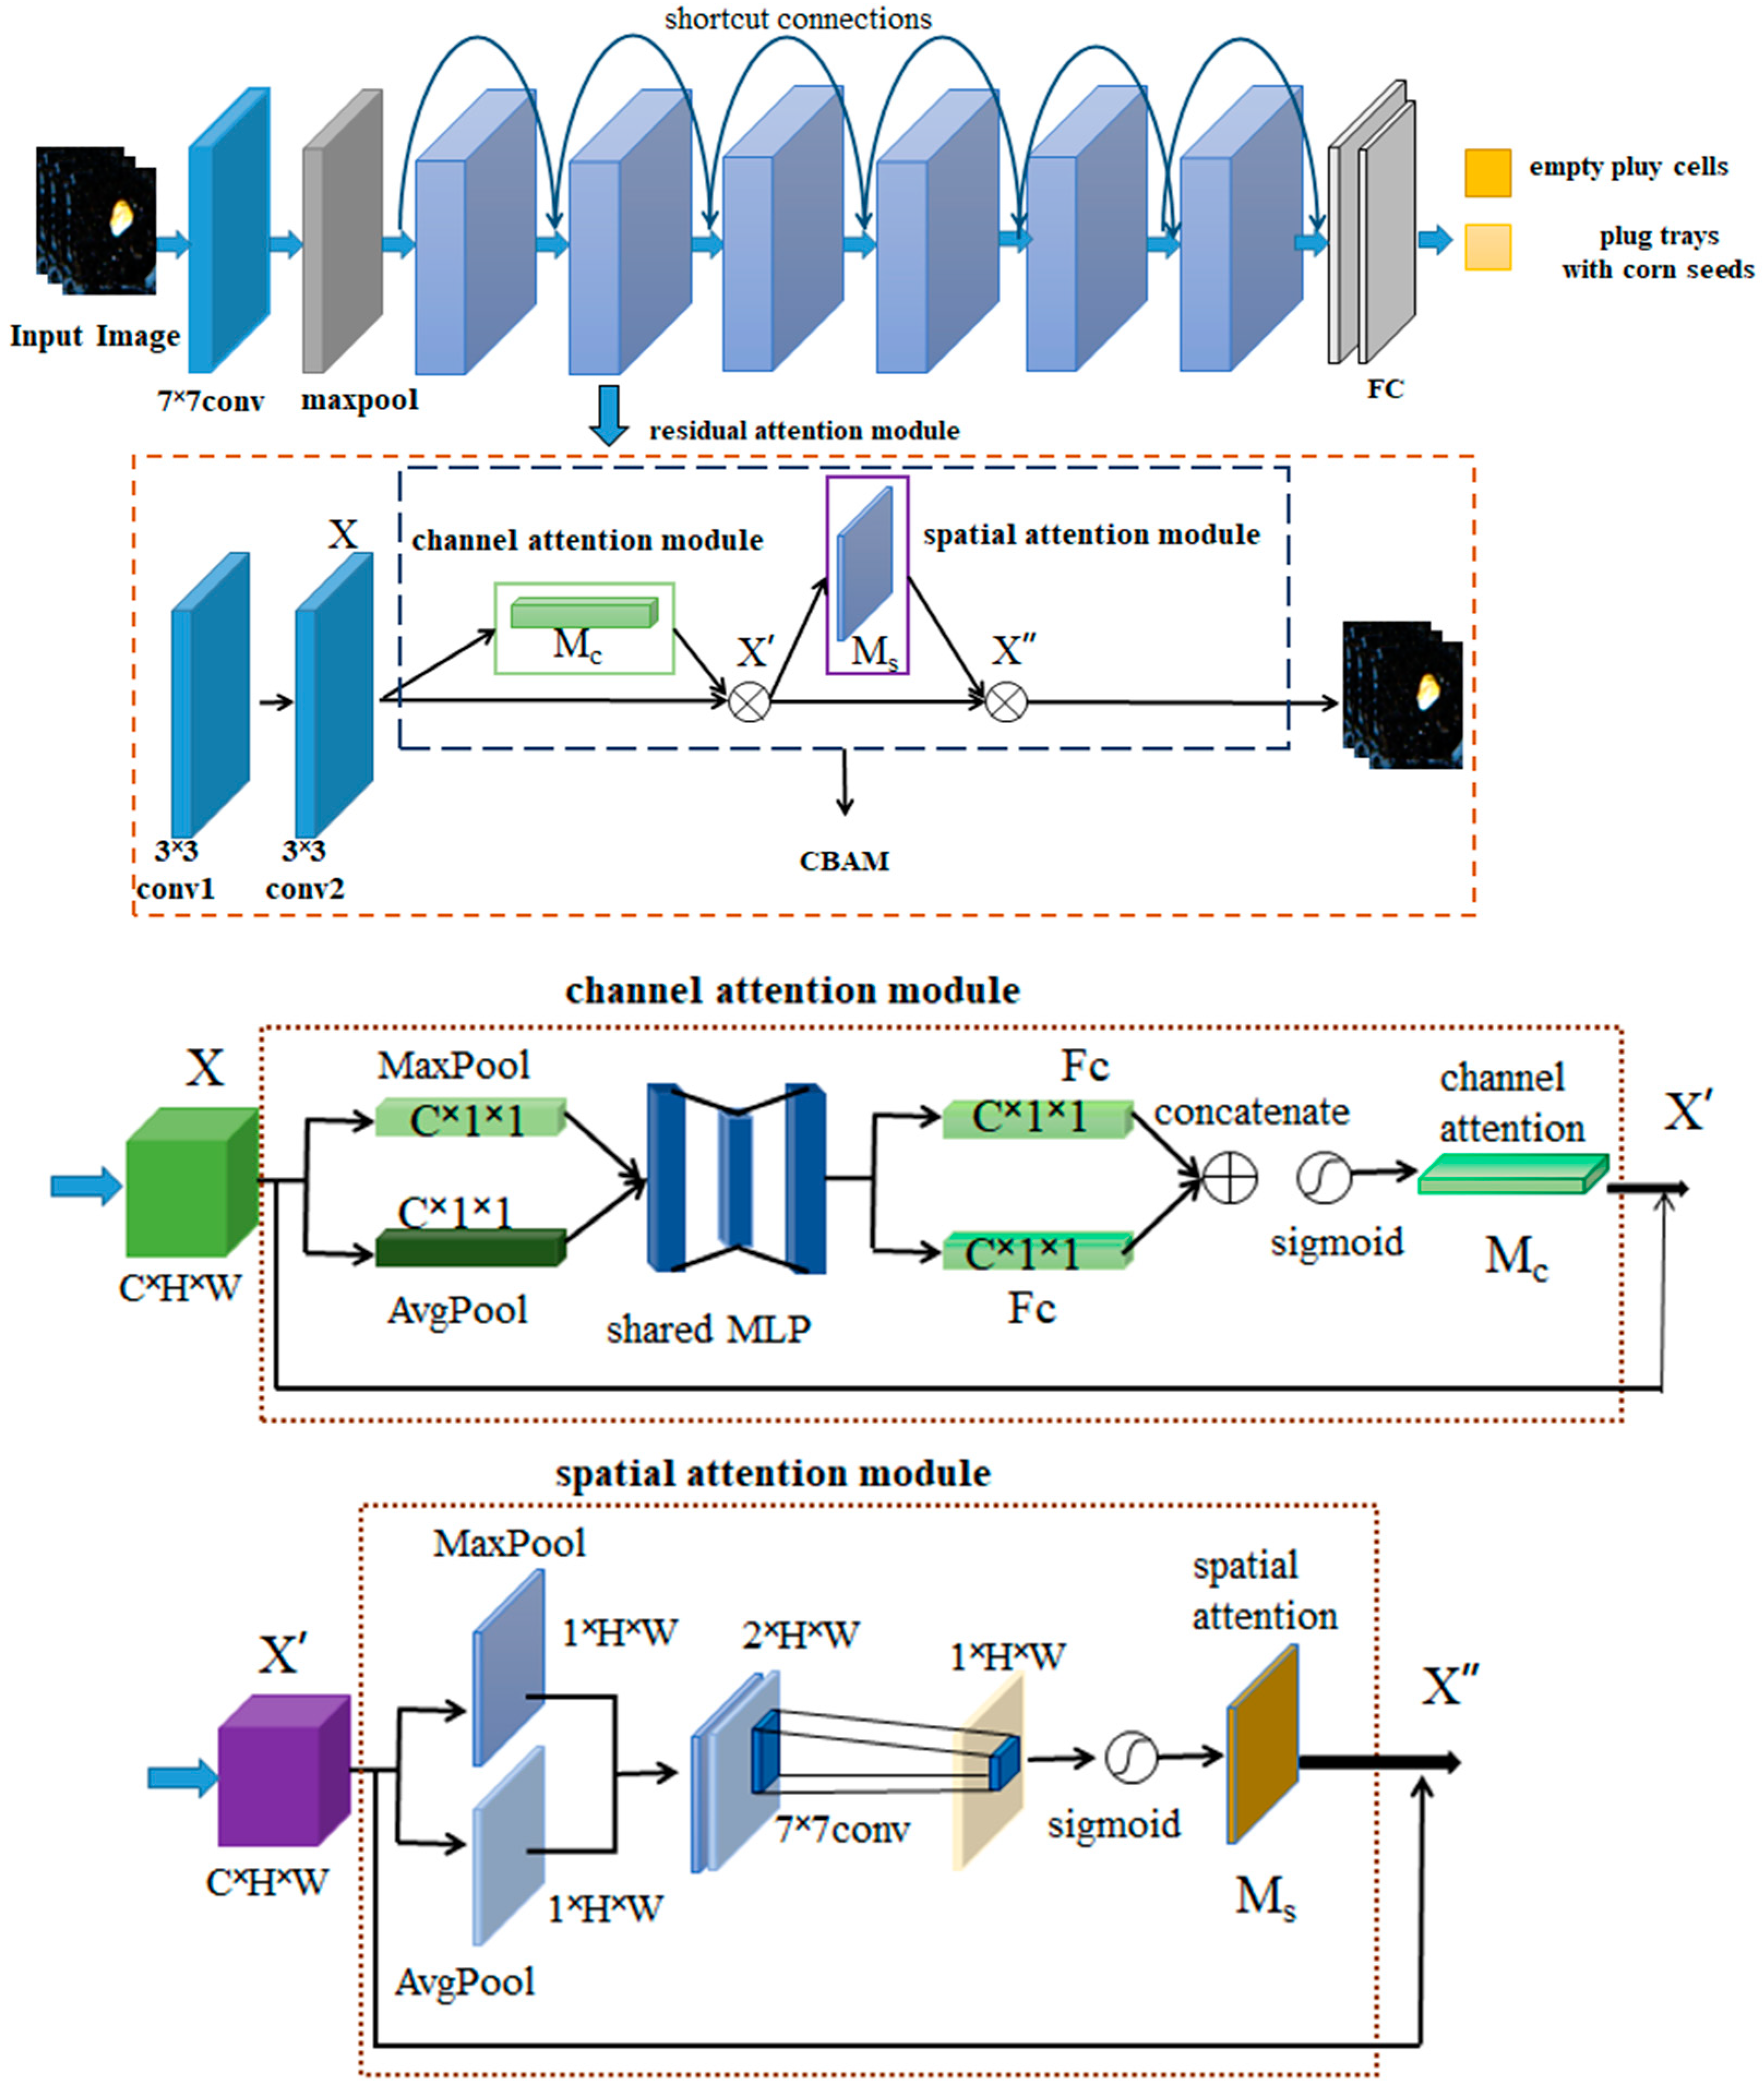
2.4. The Residual Attention Network Model

Based on ResNet18, this paper proposed the CBAM-ResNet45 model, which introduced the convolutional block attention module (CBAM) to the residual module and established a new fully-connected bidirectional layer. The addition of the attention mechanism could guide the network model to realize more characteristics of the corn seeds. The attention mechanism shifts the focus of feature extraction to the corn seeds, reasonably allocates the extracted features from the images, and suppresses the extraction of some features [16,17], thus, improving the recognition accuracy of the model. The proposed frameworks of both the ResNet18 model and the CBAM-ResNet45 model are shown in Figure 5.

2.4.1. The CBAM-ResNet45 Model

The color difference between the plug tray and the corn seeds was noticeable, and thus, the SE [18] module (channel attention module) was introduced to the residual module. When extracting different channel features of the input image, the SE module assigned different weight values to the extracted features and inhibited the channel to different degrees according to the size of the weight value. However, it neglected the feature information extraction in the feature map space. Then, the spatial attention module was introduced to supplement it. The spatial attention module could independently find the position of the object in the picture, which improved the efficiency in extracting the features of the seeds. The two modules were sequentially connected in series to create CBAM [19], which was then introduced to the residual module, as shown in Figure 6.
The convolutional block attention module [20,21] includes the channel attention module and the spatial attention module. Firstly, the feature map X with dimensions (C, H, W) was obtained by two convolutions in the channel attention module. Then, the MaxPooling and the AvgPooling were applied to X before being fed to the shared MLP, and two vectors with dimensions (C, 1, 1) were obtained. Then, the two vectors were calculated by two FC layers, respectively, and the resulting features were concatenated and then calculated by the Sigmoid. Thus, the channel attention weight matrix Mc was obtained and was multiplied by the feature map X to obtain the channel attention feature map X′, which is the output of the channel attention module [22,23]. The spatial attention module applied the MaxPooling and the AvgPooling to the channel attention feature map X′, respectively. Then, the resulting two vectors with dimensions (1, H, W) were stacked by the first channel. After a convolutional layer and the Sigmoid activation function, the spatial attention weight matrix Ms was obtained and then multiplied by the feature map X′. Finally, the attention feature X″ was obtained.
A new fully connected bidirectional and full connection layer was created. The classification of plug trays is a dichotomous recognition task. The fully connected layer of the ResNet18 network contains multiple neurons, which makes it unsuitable for the dichotomous recognition task. Therefore, a fully connected layer with only two neurons was constructed. Finally, the classification results and the output were obtained through the prediction layer.
To explore its influence on the performance of the model, the number of filters in the model was set as 128/256/512 for testing. The datasets were imported into the classification models with different numbers of filters for training, and the accuracy of the different models was tested. The network was also tested with both the SE module and the CBAM module.
The location of the batch normalization layer (BN) in the network was determined. Adding a BN layer to the network would improve the network’s performance, but the position, e.g., where the BN layer should be added, is not clear. Lv [5] reported that adding a BN layer before the Relu layer could improve the training efficiency of the model. Kohlhepp, B. [24] stated that adding a BN layer before the Relu layer was detrimental to the data processing of the model. In contrast, placing a BN layer after Relu had positive effects. There are generally two ways to add the BN layer: before the Relu layer or after the Relu layer. The influence of these two methods on the accuracy of the model is discussed through the experiments. The BN layer was placed between the conv (convolutional layer) and Relu layers of the model, which was then called the model conv-BN-Relu. The BN layer, however, was placed after the Relu layer of the model, and the combination was called the model conv-Relu-BN.

2.4.2. Experimental Parameter Setting

The main experimental parameters are as follows:
The input image was the RGB three-channel image with a resolution of 114 × 115. In this experiment, to maintain the image’s clarity, the pre-processing image size was adjusted to 128 × 128.
The step size for the model was 1, and the learning rate was 0.001; the value of momentum was 0.94, and the loss function was cross-entropy; moreover, the optimizer used was SGD.
The batch size was set to 400, and the epoch size was set to 84 for the network training. The model training process is shown in Figure 7.
The model testing process is shown in Figure 8.

2.4.3. Model Evaluation

In this study, recall (R) is considered the most important dictator for evaluating the performance of the classification models. However, in addition to the accuracy (A), the precision (P) and F score (F) were also introduced. They are computed as follows:
  P = TP / TP + FP
R = TP / TP + FN
A = TP + FN / TP + FP + TN + FN
F = 2 P R / P + R
where TP means the number of the correctly recognized empty cells, TN means the number of the correctly recognized sweet corn seeds, FP means the number of the incorrectly recognized empty cells, and FN means the number of the incorrectly recognized sweet corn seeds. We count them manually according to the recognition results.
The confusion matrix summarizes the predictions of the classification model. The rows of the confusion matrix are the true labels, and the columns correspond to the predicted label. The cells in the main diagonal of the figures include the number of correctly classified samples, while other cells include the misclassification data.

3. Results

The experiment was run on an NVIDIA Jetson Xavier NX, providing 21TOPS computing power, with the Ubuntu18 operating system. In this experiment, all models were validated on the re-collected data set of the unlabeled images of the plug trays.

3.1. The Impact of the Number of Filters on Model Performance

In order to verify the influence of the number of filters on the model, different filters are given to the models for testing. The ResNet18 network with only the SE module was called SE-ResNet. The network with 128 filters was called SE-ResNet-128, whereas the network with 256 filters was called SE-ResNet-256, and the one with 512 filters was then called SE-ResNet-512. The test results are shown in Table 1. The ResNet18 network with the CBAM module was called CBAM-ResNet. The network with 128 filters was called CBAM-ResNet-128, while the network with 256 filters was called CBAM-ResNet-256, and CBAM-ResNet-512 was the network with 512 filters. The test results are shown in Table 2.
As is shown in Table 1 and Table 2, when the number of filters was 256 (the optimal number), the recognition accuracy of the two models was the highest, and among all, the CBAM-ResNet-256 model had the highest recognition accuracy (0.98). Compared with the SE-ResNet-256, the CBAM-ResNet-256 improved the accuracy by 0.05. Therefore, CBAM-ResNet-256 was found to be the best model for this experiment. When the numbers of the filters in the model were 128/512, however, the recognition rate of the plug trays was low, and the plug trays with seeds were misidentified as the plug tray, thus, increasing the false recognition rate of the plug tray. The experimental results demonstrate that the accuracy of the model did not always improve with the increase in the number of filters. The proper number of filters improves the classification performance of the model.

3.2. The Impact of the BN Module Location on Model Performance

Thereafter, we designed and conducted an experiment to verify the impact of the location of the BN module on the network. The experimental results are shown in Table 3.
As shown in Table 3, the experimental parameters of the conv-BN-relu model were found to be more optimized than those of conv-relu-BN, and the accuracy of the conv-BN-relu was 0.105 higher than that of conv-relu-BN. The experimental results demonstrated that the BN layer was more effectively used between the conv layer and the Relu layer, which could effectively improve the identification accuracy of the model.
The BN layer could optimize the variance and mean of the upper bound of the layer inputs and maintain the distribution of the mean output closer to the distribution of the actual data, ensuring the nonlinear expression of the model. The Relu activation function could improve the network sparsity, which could prevent overfitting to a certain extent. The combination of the BN layer and the Relu activation function was an effective method for encountering the vanishing gradient problem. After the BN layer was conducted to a normalization process in the upper bound, the data distributed in the region with the maximum value or in the gradient of the Relu activation function improved the efficiency of the model training.

3.3. The Performance Comparison of Different Convolutional Neural Network Model

The performance of the model was evaluated by four indicators: precision, recall, accuracy, and F-score. The experimental results of the models, namely, AlexNet, VGG19, ResNet18, ResNet50, and CBAM ResNet45, are shown in Table 4.
Table 4 shows that the ResNet18 model has the best classification precision because its residual module can reutilize the extracted features, which can improve the classification precision. However, our CBAM-ResNet45 has the best recall, accuracy, and F score. In practice, the recall metric caused more concern. This is because if a cell with a seed in the plug tray was misclassified as an empty cell, reseeding would result in a cell with two seeds, which could affect the subsequent seed growth.
Figure 9 is the training curves of the models. Figure 9a shows the training loss rate curve of the models, and Figure 9b shows the training accuracy curve of the models.
As shown in Figure 9a, the loss function kept getting smaller and gradually approached 0. Compared with the other models, the convergence rate of the CBAM-ResNet45 model was much faster. According to the training accuracy curves observed in Figure 9b, the accuracy of the CBAM-ResNet45 model reached 90% ahead. In summary, the CBAM-ResNet45 model shows a quicker convergence speed and better classification ability.
Because the AlexNet, ResNet18, and VGG19 models have fewer convolutional layers than the ResNet50 and our models, the extracted features were the shallow features of the seeds, which were not beneficial for the identification of the seeds. With the increase in the convolutional layers, more semantic features that could improve the classification performance were extracted. However, more convolutional layers are not always better. For example, the performance of the ResNet50 model was not prior to our model. This is because the deeper features extracted by more convolutional layers were not suitable for the relatively simple classification task. Therefore, the CBAM module in our CBAM-ResNet45 model could help to extract the features that could improve the classification performance even if our model had fewer convolutional layers than the ResNet50.

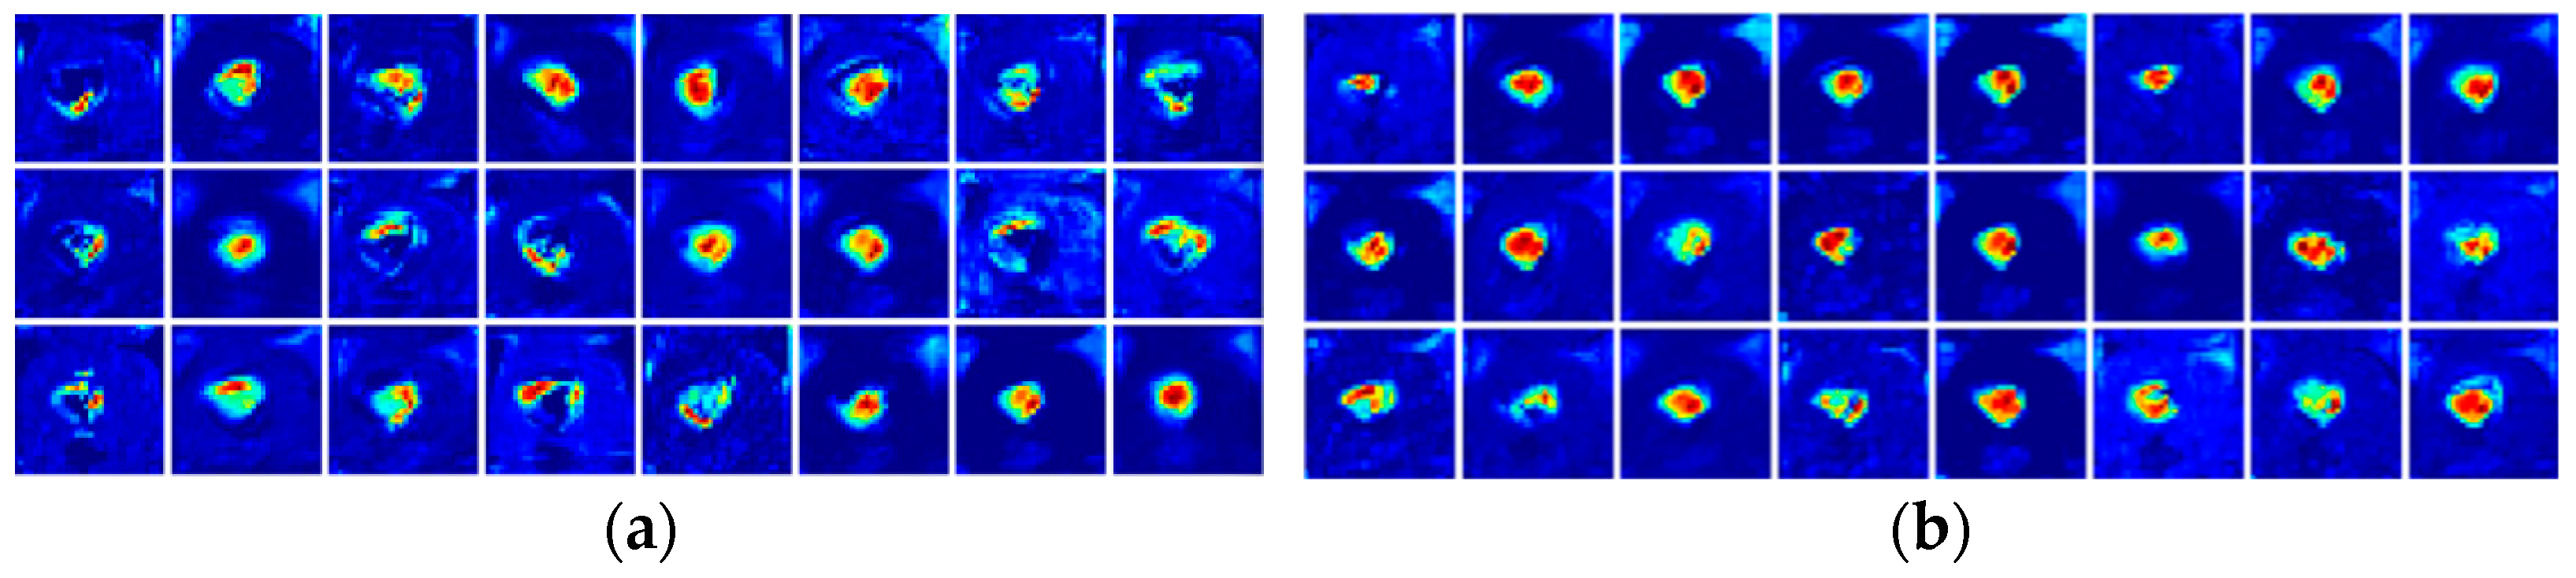
3.4. Areas of Concern in the Network Analysis Category

Grad-CAM [25] is a method for the visualization of features. It analyzes the important features of coarse-grained mapping by computing the gradients of the feature maps in the final convolutional layer associated with specific classes. The most critical location of the feature maps will be shown as a vital activation region in the feature map. The color depth in the feature map is different, indicating that the intensity of the activated area is different. The darker the color is, the stronger the intensity of the area would be, and vice versa. The input images of the plug tray with corn grains were inserted into ResNet18 and CBAM-ResNet45 networks, and Grad CAM was used to visualize the features and intercept part of the output results, as shown in Figure 10.
The red area in Figure 10 represents the area with strong activation in the network model, while the blue area represents the area with weak activation in the network model. Moreover, the steeper the gradient, the redder the region, indicating that the region had a higher impact on the classification results. As shown in Figure 10a,b, both models could focus their attention on the seed region, and the soil substrates and the plug trays are represented with a blue color, indicating that these regions were weakly activated. The active region of the ResNet18-layer1 was irregular in shape, and the regions of interest (ROI) covered with the corn seeds were scattered. The strong activation area of CBAM-ResNet45-layer1 was shaped and concentrated, and the attention area was more concentrated on sweet corn seeds. The proportion of pixels in the picture was replaced with the areas with a different color. The ratio of the area with red color in resnet18-layer1 was 7.64%, while the proportion of the area with blue color was 90.26%. The ratio of the area in CBAM-Resnet45-Layer1 with a red color was 9.45%, whereas that with a blue color was 89.5%. The proportion of the area with red color in the CAM-Resnet45 model was 1.84% higher than that in the ResNet18 model, and the proportion of the blue area was 0.76% lower than that in the ResNet18 model. Thus, due to the existence of the attention mechanism in the CBAM-ResNet45 model, the network could help extract more features of corn seeds, which was more conducive to the identification of the plug tray.

3.5. Confusion Matrix of the Model

The confusion matrix of the CBAM-ResNet45 model applied to the test set of the plug trays, as shown in Figure 11.
The classification accuracy of the CBAM-ResNet45 model for plug trays was 98%, the precision was 99.68%, the recall was 96.75%, and the F score was 98.19%, as determined by the confusion matrix.
In summary, the CBAM-ResNet45 model had a significant advantage in terms of accuracy and was better able to meet the classification requirements for the mis-seeding detection in the plug tray seeding and mis-seeding of sweet corn.

3.6. Analysis of Classification Error

The feature visualization of the convolutional neural network can also help analyze the causes of image misclassification to determine whether the region of interest or the extracted fine-grained features were defective. Another experiment was designed to visualize the features of the misclassified images. Figure 12 shows the feature map extracted from five convolutional layers of the CBAM-ResNet45 model and for the false recognition of images, with eight features taken for each layer for display purposes.
In the CBAM-ResNet45 model, the feature output of layer3 was the last feature extracted by the model and also the feature on which the subsequent classification was based. As observed in Figure 12, the output features of layer3 were high-level and abstract, beyond human understanding. In layer2, the region with strong activation was mainly concentrated on the plug tray, and the soil substrates were in the weak activation region; thus, layer2 mainly extracted the characteristics of the plug tray. In layer1 and the max pool layer, however, both the plug tray and the seeds were in the strongly activated regions, and the soil substrates were in the weakly activated region, indicating that the features captured by the model were mainly those of the corn seeds and the plug tray. In conv1, the soil substrates, corn seeds, and plug tray, all displayed in red, were strongly activated regions, indicating that the features captured by the CBAM-ResNet45 model were those of the corn seeds, plug tray, and soil substrates. It is known that the CBAM-ResNet45 model had the right region of interest when extracting features. After analyzing multiple misidentified photos, it became known that the exposed area of the seeds was small. Moreover, as the number of layers in the network model increased, the ability of the model to capture the features of the corn seeds gradually decreased, and as a result, the extracted features of the plug tray gradually became the prominent main features extracted by the model, which ultimately caused the problem of image misrecognition.

4. Conclusions

To support the automatic detection of the missed sowing of corn seeds in a plug tray, we proposed a CBAM ResNet45 model. The CBAM ResNet45 obtains the channel features and spatial information from images. The model was trained using the images captured from the plug trays. In the process of creating the dataset, augmentation techniques were used to expand the dataset. To improve the recognition and classification performance of the model, we optimized the number of filters in the last convolutional layer of the model and also the position of the BN layer. The CBAM ResNet45 model has been experimentally tested and compared with other models, and the recognition accuracy of the method proposed in this paper reached 98%, which is better than that of the other tested neural networks. These results show that this method could be successfully applied to classify the seeds. The conclusions are as follows:
  • Cost-saving and robust anti-interference: The method proposed in this paper did not need special instruments to collect the images, and it could directly classify the original images after simple pre-processing. Compared with the traditional machine vision-based classification, the model proposed in this paper eliminated the influence of subjective factors on threshold segmentation using pixel values and had a strong anti-interference ability.
  • Under the unchanged conditions for the training time and testing time, the CBAM-ResNet45 model enabled the neural network to adjust the weights of the channel flow and the spatial flow, extract more information about objects from the channel and space, and improve the accuracy of the recognition and classification of the network.
  • The results of the visualization experiments further verified that CBAM ResNet45 focused more on the concentrated feature areas. Moreover, the model also has disadvantages, e.g., the area of the corn seed was small. Moreover, when the plug tray moves with the conveyor belt, the vibration of the conveyor belt causes the falling of the proportion of the soil from the tray and its loss, which results in covering a part of the seed area or directly burying the seed so that the bare seed area becomes small. This leads to the problem of image misrecognition. Since it is difficult to avoid losing the soil and covering seeds caused by the vibration of the conveyor belt, the CBAM-ResNet45 model needs to be improved to correctly classify the pictures with small corn seed areas.
This method provides a basis for automatic missing seeding detection in a plug tray. We will continue to conduct research on the classification and identification of seeds in small areas. The generalization ability of the CBAM-ResNet45 model needs to be improved to ensure its success.

Author Contributions

Conceptualization, L.G., F.H. and J.B.; methodology, L.G.; software, L.G. and J.B; validation, L.G.; formal analysis, L.G., F.H. and J.B.; investigation, F.H. and D.M.; resources, F.H.; data curation, J.X. and B.D.; writing—original draft preparation, L.G.; writing—review and editing, F.H., J.Z. and J.B. All authors have read and agreed to the published version of the manuscript.

Funding

This research was funded by The Major Science and Technology Innovation Project of Shandong Province (2019JZZY020603), Shandong Provincial Natural Science Foundation (ZR2022MC152) and Qingdao Science and Technology to Benefit the people Demonstration guide Special project (22-3-7-xdny-18-nsh).

Institutional Review Board Statement

Not applicable.

Informed Consent Statement

Not applicable.

Data Availability Statement

The data that support the findings of the study are available from the corresponding author, F.H., upon reasonable request. We have uploaded the dataset to Baidu cloud drive. The link is: https://pan.baidu.com/s/1SeHJUzejz3PcK3OOEaVGOA.

Conflicts of Interest

The authors declare no conflict of interest.

References

  1. Bai, J.; Hao, F.; Cheng, G.; Li, C. Machine vision-based supplemental seeding device for plug seedling of sweet corn. Comput. Electron. Agric. 2021, 188, 106345. [Google Scholar] [CrossRef]
  2. Abade, A.; Ferreira, P.; Vidal, F. Plant diseases recognition on images using convolutional neural networks: A systematic review. Comput. Electron. Agric. 2021, 185, 106125. [Google Scholar] [CrossRef]
  3. Campanile, G.; Ruberto, C.; Loddo, A. An open source plugin for image analysis in biology. In Proceedings of the 28th IEEE International Conference on Enabling Technologies: Infrastructure for Collaborative Enterprises, WETICE 2019, Naples, Italy, 12–14 June 2019; Reddy, S., Ed.; IEEE: Piscataway, NJ, USA, 2019; pp. 162–167. [Google Scholar]
  4. Wang, Y.; Jia, H.; Li, M.; Liu, J.; Xu, F. Study on corn seed quality detection and grading method based on OpenCV algorithm. For. Mach. Woodwork. Equip. 2017, 45, 35–39. [Google Scholar]
  5. Lv, M.; Zhang, R.; Jia, H.; Ma, L. Study on maize seed classification method based on improved ResNet. Chin. J. Agric. Mech. 2021, 42, 92–98. [Google Scholar]
  6. Li, J.; Zhao, B.; Wu, J.; Zhang, S.; Lv, C.; Li, L. Stress-Crack detection in maize kernels based on machine vision. Comput. Electron. Agric. 2022, 194, 106795. [Google Scholar] [CrossRef]
  7. Xia, C.; Yang, S.; Huang, M.; Zhu, Q.; Guo, Y.; Qin, J. Maize seed classification using hyperspectral image coupled with multi-linear discriminant analysis. Infrared Phys. Technol. 2019, 103, 103077. [Google Scholar] [CrossRef]
  8. Wakholi, C.; Kandpal, L.M.; Lee, H.; Bae, H.; Park, E.; Kim, M.S.; Mo, C.; Lee, W.H.; Cho, B.K. Rapid assessment of corn seed viability using short wave infrared line-scan hyperspectral imaging and chemometrics. Sens. Actuator B-Chem. 2018, 255, 498–507. [Google Scholar] [CrossRef]
  9. Liao, W.; Wang, X.; An, D.; Wei, Y. Hyperspectral imaging technology and transfer learning utilized in haploid maize seeds identifification. In Proceedings of the International Conference on High Performance Big Data and Intelligent Systems (HPBD&IS), Shenzhen, China, 9–11 May 2019; pp. 157–162. [Google Scholar]
  10. Maeda-Gutierrez, V.; Galvan-Tejada, C.; Zanella-Calzada, L.; Celaya-Padilla, J.; Galvan-Tejada, J.; Gamaboa-Rosales, H.; Luna-Garica, H.; MagallanesQuintanar, R.; Mendez, C.; Olvera-Olvera, C. Comparison of Convolutional Neural Network Architectures for Classification of Tomato Plant Diseases. Appl. Sci. 2020, 10, 1245. [Google Scholar] [CrossRef] [Green Version]
  11. Haf, R.; Pearson, T.C.; Toyofuku, N. Sorting of in-shell pistachio nuts from kernels using color imaging. Appl. Eng. Agric. 2010, 26, 633–638. [Google Scholar] [CrossRef]
  12. Shima, J.; Seyed-Hassan Miraei Ashtiani, F.; Verbeek, A. Computer-vision classification of corn seed varieties using deep convolutional neural network. J. Stored Prod. Res. 2021, 92, 101800. [Google Scholar] [CrossRef]
  13. Zhao, Y.; Sun, C.; Xu, X.; Chen, J. RIC-Net: A plant disease classification model based on the fusion of Inception and residual structure and embedded attention mechanism. Comput. Electron. Agric. 2022, 193, 106644. [Google Scholar] [CrossRef]
  14. Trang, K.; TonThat, L.; Gia Minh Thao, N.; Tran Ta Thi, N. Mango Diseases Identification by a Deep Residual Network with Contrast Enhancement and Transfer Learning. In Proceedings of the 2019 IEEE Conference on Sustainable Utilization and Development in Engineering and Technologies (CSUDET), Penang, Malaysia, 7–9 November 2019; pp. 138–142. [Google Scholar] [CrossRef]
  15. Zhao, X.; Li, K.; Li, Y.; Ma, J.; Zhang, L. Identification method of vegetable diseases based on transfer learning and attention mechanism. Comput. Electron. Agric. 2022, 193, 106703. [Google Scholar] [CrossRef]
  16. Hu, J.; Shen, L.; Albanie, S.; Sun, G.; Wu, E. Squeeze-and-Excitation Networks. arXiv 2017, arXiv:1709.0150. [Google Scholar]
  17. Li, X.; Rai, L. Apple Leaf Disease Identification and Classification using ResNet Models. In Proceedings of the IEEE 3rd International Conference on Electronic Information and Communication Technology (ICEICT), Shenzhen, China, 27 November 2020; pp. 738–742. [Google Scholar]
  18. Qin, R.; Fu, X.; Lang, P. PolSAR Image Classification Based on Low-Frequency and Contour Subbands-Driven Polarimetric SENet. IEEE J. Sel. Top. Appl. Earth Obs. Remote Sens. 2020, 13, 4760–4773. [Google Scholar] [CrossRef]
  19. Woo, S.; Park, J.; Lee, J.; Kweon, I. Cbam: Convolutional block attention module. In Proceedings of the European Conference on Computer Vision (ECCV), Munich, Germany, 8–14 September 2018. [Google Scholar] [CrossRef] [Green Version]
  20. He, C. Image Compressive Sensing via Multi-scale Feature Extraction and Attention Mechanism. In Proceedings of the 2020 International Conference on Intelligent Computing, Automation and Systems (ICICAS), Chongqing, China, 11–13 December 2020; pp. 266–270. [Google Scholar] [CrossRef]
  21. Wang, Y.; Wang, H.F.; Peng, Z. Rice diseases detection and classification using attention based neural network and bayesian optimization. Expert Syst. Appl. 2021, 178, 114770. [Google Scholar] [CrossRef]
  22. Tang, Z.; Yang, J.; Li, Z.; Qi, F. Grape disease image classification based on lightweight convolution neural networks and channelwise attention. Comput. Electron. Agric. 2020, 178, 105735. [Google Scholar] [CrossRef]
  23. Chen, Q.; Liu, L.; Han, R.; Qian, J.; Qi, D. Image identification method on high speed railway contact network based on YOLO v3 and SENet. In Proceedings of the 2019 Chinese Control Conference (CCC), Guangzhou, China, 27–30 July 2019; pp. 8772–8777. [Google Scholar]
  24. Wang, F.; Jiang, M.; Qian, C.; Yang, S.; Li, C.; Zhang, H.; Wang, X.; Tang, X. Residual Attention Network for Image Classification. In Proceedings of the 30th IEEE Conference on Computer Vision and Pattern identification, Honolulu, HI, USA, 21–26 July 2016; pp. 6450–6458. [Google Scholar] [CrossRef] [Green Version]
  25. Selvaraju, R.R.; Cogswell, M.; Das, A.; Vedantam, R.; Parikh, D.; Batra, D. Grad-CAM: Visual Explanations from Deep Networks via Gradient-Based Localization. Int. J. Comput. Vis. 2020, 128, 336–359. [Google Scholar] [CrossRef]
Figure 1. The procedure for missing broadcast detection.
Applsci 12 12604 g001
Figure 2. The diagram of partition with empty cells.
Applsci 12 12604 g002
Figure 3. Photos captured before segmentation.
Applsci 12 12604 g003
Figure 4. Photos captured after segmentation.
Applsci 12 12604 g004
Figure 5. The framework of the ResNet18 model and the CBAM-ResNet45 model.
Applsci 12 12604 g005
Figure 6. The network structure of CBAM-ResNet45 model.
Applsci 12 12604 g006
Figure 7. The model training process.
Applsci 12 12604 g007
Figure 8. The model testing process.
Applsci 12 12604 g008
Figure 9. Training results of models. (a) Training loss rate curve of the models. (b) The training accuracy curve of the models.
Applsci 12 12604 g009
Figure 10. The visualization of the ResNet18 model and the CBAM-ResNet45 model. (a) The visual diagram of ResNet18. (b) The visual diagram of CBAMResNet45.
Applsci 12 12604 g010
Figure 11. Confusion matrix of the model.
Applsci 12 12604 g011
Figure 12. Characteristics captured by the CBAM-ResNet45 model.
Applsci 12 12604 g012
Table 1. The results of the three networks of the SE-ResNet model.
ModelSE-ResNet-128SE-ResNet-256SE-ResNet-512
Accuracy 0.9000.9300.890
Table 2. The results of the three networks of the CBAM-ResNet model.
ModelCBAM-ResNet-128CBAM-ResNet-256CBAM-ResNet-512
Accuracy 0.8600.9800.780
Table 3. Experimental results of two models.
Modelconv-BN-reluconv-relu-BN
Accuracy 0.9800.870
Table 4. The indicators for the evaluation of the performance of models.
ModelPrecision (P)Recall (R)Accuracy (A)F Score (F)
AlexNet0.87500.86400.79000.8690
VGG190.90600.81700.87300.8592
ResNet1810.84400.88000.9150
ResNet500.95400.94600.94200.9500
CBAM-ResNet450.99680.96750.98000.9819
Publisher’s Note: MDPI stays neutral with regard to jurisdictional claims in published maps and institutional affiliations.

