Article

Evaluation of Braking Timing Sequence of Semi-Trailer Train Based on Fuzzy Analytic Hierarchy Process

1
College of Transportation, Jilin University, Changchun 130022, China
2
School of Mechanical and Aerospace Engineering, Jilin University, Changchun 130022, China
*
Author to whom correspondence should be addressed.
Appl. Sci. 2022, 12(24), 12605; https://doi.org/10.3390/app122412605
Submission received: 9 November 2022 / Revised: 1 December 2022 / Accepted: 5 December 2022 / Published: 8 December 2022
(This article belongs to the Topic Vehicle Dynamics and Control)

Abstract

:
A reasonable braking timing sequence plays an important role in the braking stability of a semi-trailer train, but there is still a lack of objective and comprehensive scientific evaluations of braking stability as shown by the braking timing sequence. Aiming at this problem, through the analysis of relevant regulations and standards at home and abroad, an evaluation index hierarchy model of the semi-trailer train braking timing sequence is constructed. The fuzzy analytic hierarchy process is used to determine the weight of the evaluation index of each level of the braking timing sequence, and a comprehensive evaluation is obtained. In order to determine the optimal braking timing sequence of the train during braking, a simulation model was established and simulated. Through the combination of index weight and simulation data, the model can provide a theoretical basis for the subsequent study of the optimal braking timing sequence of semi-trailer trains running under different working conditions.

1. Introduction

Due to the complex structure of the number of axles of the semi-trailer train, different braking timing sequences will be generated between the axles during braking. An improper braking timing sequence will cause dangerous conditions such as train folding, tail flick, oscillation and rollover. With the development of the highway transportation industry, the semi-trailer train has become the main model of highway freight transportation. Experts and scholars are also constantly studying the braking stability of semi-trailer trains. As an important index to evaluate the braking stability of vehicles, the braking timing sequence has always lacked an objective and comprehensive system for scientific evaluation. Therefore, it is necessary to establish an evaluation system for the braking timing sequence to meet the need for vehicle braking stability detection.
Reference [1] proposed that the evaluation indexes of braking performance should include vehicle braking force distribution, braking force strength, braking distance, braking deceleration and braking direction stability. In reference [2], the braking performance of a hydraulic retarder loaded on heavy vehicles was evaluated, and twelve evaluation indexes including maximum braking torque and braking pressure were put forward. Reference [3] pointed out that the braking distance should not be used as the only evaluation index of braking performance, and put forward the braking efficiency, braking coordination time, braking force controllability and heat absorption capacity of the brake as the evaluation indexes. At present, the evaluation of braking systems is mostly based on the performance of the ABS retarder and solenoid valve, and there are few evaluation systems and indicators for the braking timing sequence.
Because there are various braking timing sequences, a semi-trailer train can have various motion characteristics during braking, and the evaluation involves many factors. The Fuzzy Analytical Hierarchy Process (FAHP) applies the logic and language of fuzzy mathematics, which can provide a theoretical basis for evaluation for a system of multiple evaluation criteria and highlight the fuzziness of people in considering and judging things. It also has strong objectivity [4]. Therefore, this study uses FAHP to evaluate the braking timing sequence.
The structure of this paper is as follows: The Section 1 is the introduction. The Section 2 analyzes the braking characteristics of the semi-trailer train under different braking sequences, and combines the motion characteristics of the train under different braking timing sequences to formulate a braking timing sequence evaluation system and determine the evaluation index. It establishes the weight judgment matrix of the evaluation index and calculates the weight of each index. In the Section 3, in order to obtain the comprehensive evaluation value of the braking timing sequence, a dynamic model of the semi-trailer train is established. It simulates the motion characteristics of the semi-trailer train under different braking timing sequences. The Section 4 carries out a real vehicle test to verify the accuracy of the model. In the Section 5, the simulation analysis is carried out, and the comprehensive evaluation value of each braking timing sequence is calculated using the linear weighted sum method. Finally, the conclusion is given.

2. Establishment of Evaluation System

2.1. Determination of Evaluation Index

At present, the regulations on the braking performance of vehicles in various countries require the braking system of vehicles to have good braking efficiency, excellent lateral stability and an excellent braking swing angle. In order to put forward a scientific and reasonable evaluation index of the braking timing sequence, after sorting out the regulations on vehicle braking performance in the United States, Europe and China, we read relevant references [5,6,7,8,9,10] and discussed the issue with relevant experts in the industry. Those investigations suggest that the evaluation index of the braking timing sequence of a semi-trailer train can follow the principles of scientificity, safety, feasibility and measurability. At the same time, combined with the analysis of the braking stability of the semi-trailer train in reference [11], the following items are proposed as the evaluation indexes for evaluating the braking timing sequence of the semi-trailer train.
(1)
Braking distance: When the vehicle is at a certain speed, the driver starts to take braking measures until the vehicle stops completely. The smaller the braking distance, the better the braking performance of the car. At present, most semi-trailer trains are equipped with ABS. References [12,13] show that ABS can reduce the braking distance of the vehicle by controlling the slip rate of the vehicle during braking. Because the braking distance is more intuitive, it is widely used to evaluate the braking efficiency.
(2)
Yaw angle: The yaw angle around the z-axis is generated at the center of mass of the vehicle. If the braking force is unevenly distributed or the braking timing sequence is improper, the vehicle will swing laterally. Therefore, in order to ensure the lateral stability of the semi-trailer truck, the yaw angle should be used as an evaluation index.
(3)
Jackknife angle: The angle formed by the longitudinal axis of the tractor and the longitudinal axis of the semi-trailer. The incorrect braking timing sequence will produce a large jackknife angle, which will cause the semi-trailer train to fold and cause serious traffic accidents.
(4)
Lateral acceleration: The acceleration along the lateral axial direction of the vehicle during braking. Greater lateral acceleration will cause lateral instability of the vehicle during braking, and, in severe cases, the vehicle will roll over.
(5)
Brake deviation: The phenomenon of the vehicle running to one side due to an uncoordinated braking force or improper braking timing sequence. When the braking deviation is serious, the vehicle will slip sideways, causing the driver to lose control of the vehicle and causing serious traffic accidents.

2.2. Fuzzy Analytic Hierarchy Evaluation Algorithm

The evaluation indexes are compared in pairs, and a fuzzy judgment matrix is constructed. When the fuzzy analytic hierarchy process is used to construct the matrix, the matrix is often expressed in the form of interval number or fuzzy number. The triangular fuzzy number (l, m, u) is used to represent the elements in the matrix because it contains the interval number and the way of comparing the indicators through the median value, where l and u are the upper and lower bounds, respectively, and m is the median value. The expression of the fuzzy set membership function is shown in Equation (1):
μ m x x l / m l , l x m x u / m u , m x u 0 , o t h e r s
The value of the fuzzy comprehensive degree of the ith object is defined as shown in Equation (2):
s i = t i t 1 t 2 t n 1 = j = 1 n l i j i = 1 n j = 1 n u i j , j = 1 n m i j i = 1 n j = 1 n m i j , j = 1 n u i j i = 1 n j = 1 n l i j = l i , m i , u i
The possibility of M1 (l1, m1, u1) ≥ M2 (l2, m2, u2) is shown as Equation (3):
μ M 2 d 1 m 1 m 2 0 o t h e r s l 2 u 1 m 1 u 1 m 2 l 2 , m 1 m 2 ,   u 1 l 2
The possibility degree of triangular fuzzy number M greater than k triangular fuzzy numbers Mi (i = 1, 2, …, k) is defined by Equation (4):
V M M 1 , M 2 , , M k = min V M M i
The pure good measure that Ai is superior to other schemes is shown in Equation (5):
d A i = min V S i S k
The standardized weight of the calculated index is Equation (6):
W = d A 1 , d A 2 , , d A n T
After linearization, the weight value of each index is shown in Equation (7):
W i = W W
In order to reasonably establish the evaluation system for semi-trailer train braking timing, three experts were invited to score the evaluation indexes proposed in this paper. Information about each expert is shown in Table 1. Each expert applies Saaty’s 1~9 scale table [14] to construct a judgment matrix that compares two indicators. The judgment matrices given by the three experts are represented by D1, D2 and D3, respectively. The judgment matrix is shown in Equation (8). The judgment matrix scale, linguistic variables and their corresponding triangular fuzzy numbers are shown in Table 2.
D 1 = 1 1 1 / 3 1 1 1 1 1 / 3 1 / 3 1 3 3 1 3 3 1 3 1 / 3 1 1 / 3 1 1 1 / 3 3 1 D 2 = 1 1 / 3 1 / 5 1 1 3 1 1 / 3 1 / 3 3 5 3 1 5 3 1 1 1 / 5 1 1 / 3 1 1 / 3 1 / 3 3 1 D 3 = 1 1 / 3 1 / 5 1 1 3 1 1 1 3 5 1 1 3 1 1 1 1 / 3 1 1 1 1 / 3 1 1 1
After the matrix in Equation (8) passes the consistency test, the expert scoring matrix is converted into a triangular fuzzy number judgment matrix according to the triangular fuzzy number given in Table 2. The converted results are shown in Table 3, Table 4 and Table 5. The matrix utilization Equation (9) of Table 3, Table 4 and Table 5 is transformed into a fuzzy comprehensive evaluation matrix. In Equation (9), a ˜ i j is the fuzzy comparison value of evaluation index i and evaluation index j, and d ˜ s t is the geometric mean of the fuzzy comparison value of index i to all indexes j. The calculated fuzzy comprehensive judgment matrix is shown in Table 6.
d ˜ s t = a ˜ i 1 a ˜ i 2 a ˜ i j j
After obtaining the fuzzy comprehensive evaluation matrix, the fuzzy comparison value of each dimension of the fuzzy comprehensive evaluation matrix is calculated by using Equation (10).
r ˜ d s = d ˜ s 1 d ˜ s 2 d ˜ s t t
In Equation (10) r ˜ d s represents the fuzzy comparison value of dimension s and dimension t. The calculated results are substituted into Equation (2) to obtain the fuzzy weights of each evaluation index, which are: w ˜ 1 = (0.071, 0.117, 0.235), w ˜ 2 = (0.083, 0.181, 0.425), w ˜ 3 = (0.159, 0.416, 0.850), w ˜ 4 = (0.073, 0.130, 0.281), w ˜ 5 = (0.083, 0.156, 0.337). The fuzzy weights of each evaluation index are calculated according to the steps of Equations (3)–(7) to obtain the weights of each evaluation index after defuzzification. The calculated weights of each evaluation index are shown in Table 7.
It can be seen from Table 7 that experts believe that the folding of tractor and trailer experienced by semi-trailer trains under different braking timing sequences is the most important factor affecting the braking stability of trains, followed by the yaw angle of the vehicles. At the same time, experts also believe that different braking timing sequences will not have a great impact on the braking distance of the train, so the weight of the braking distance is the lowest among all of the evaluation indicators.

3. Semi-Trailer Train Simulation Model Establishment

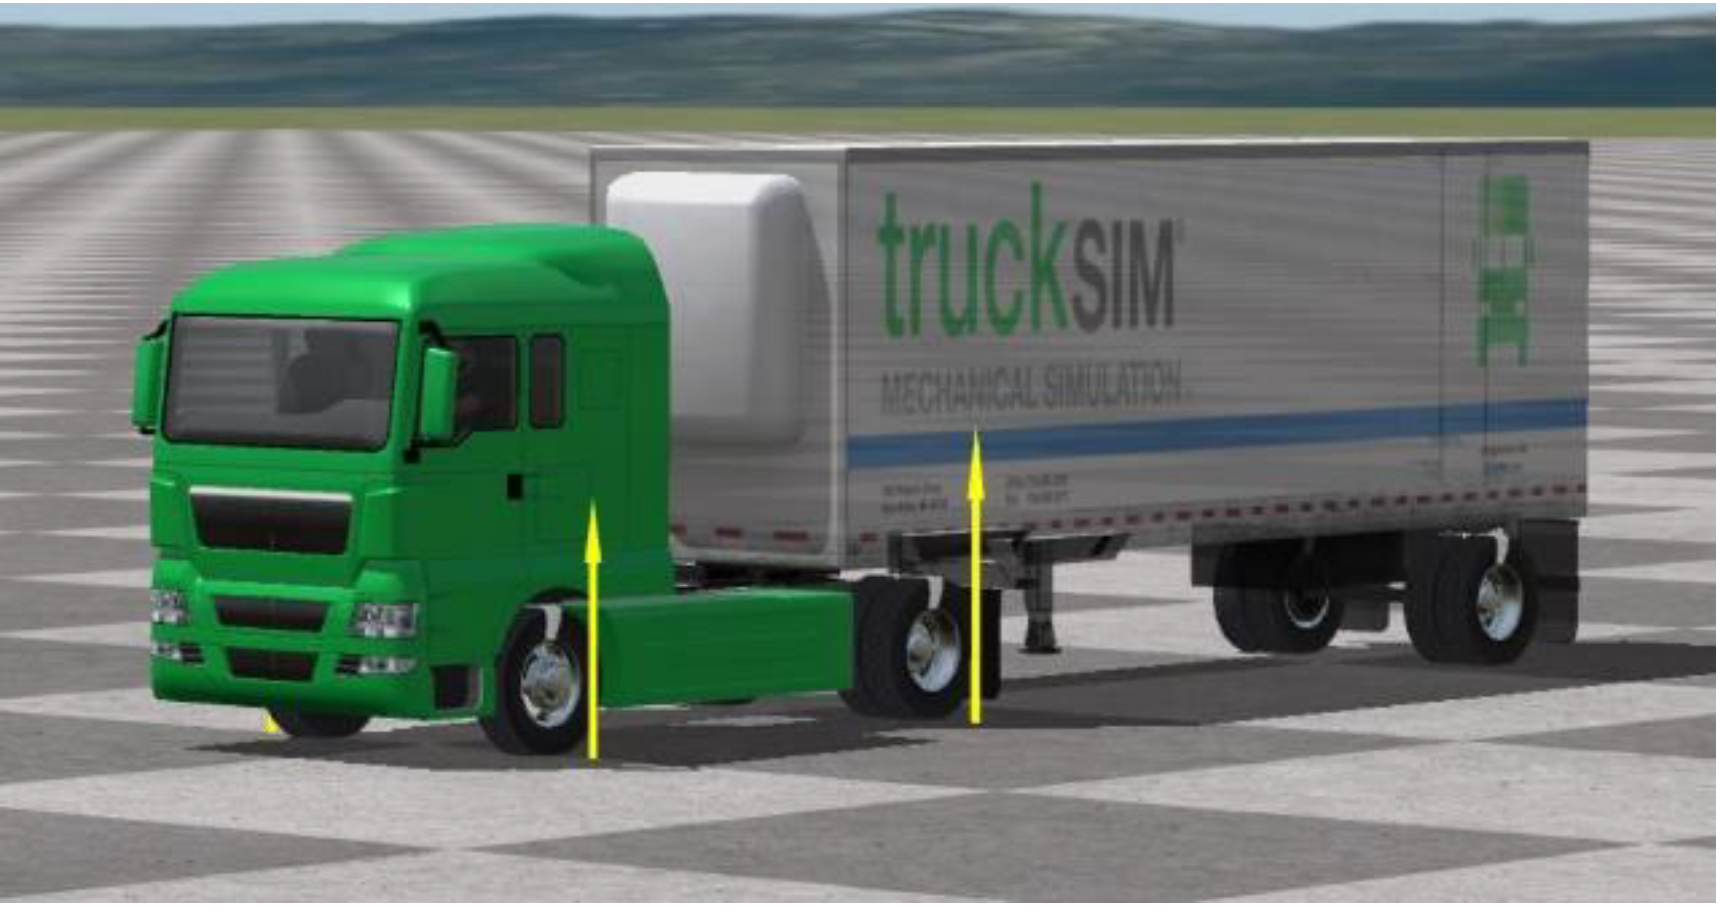
3.1. Establishment of TruckSim Model

In order to further evaluate the braking timing sequence of the semi-trailer train, this paper uses TruckSim software to establish a dynamic model of the semi-trailer train, and determines the comprehensive evaluation value of each braking timing sequence through the simulation results and the weight of the evaluation index. The selected models are a Jiefang brand CA4250P66K24T1A1E5 tractor and a Wanrong brand CWR9400CCYE trailer.

3.1.1. Vehicle Body Model

The appearance of the semi-trailer train model is shown in Figure 1. The car body inertia is composed of the yaw, roll and pitch inertia of the car body. The formula for calculating the car body inertia is shown in Equation (11), where Iii represents the inertia parameter of a car body, M is the sprung mass and Ri is the radius of rotation of the car body inertia to be calculated. It can be seen from reference [15] that, when calculating the inertia of the vehicle body, Rx takes one-third of the body width, and Ry and Rz take half of the vehicle wheelbase. The remaining car body parameters are shown in Table 8.
I i i = M × R i 2

3.1.2. Tire Model

Both sides of the steering axle of the tractor are single tires, and both sides of the driving axle of the tractor and the axle of the trailer are twins. For the model, 12R22.5 18PR radial tires are used. According to reference [16], the single and twin load capacities of the tire are 3550 kg and 3250 kg, respectively. The free diameter of the tire is 1085 mm, and the section width is 300 mm. From reference [17], the formula for calculating the effective radius of the tires is shown in Equation (12).
r = F × d 2 π
In the Equation (12), r is the tire rolling radius; F is the calculation coefficient, usually 3.05; and d is the tire free diameter. Substituting F and d into Equation (12), a rolling radius for the tire of 526.68 mm can be obtained.

3.1.3. Powertrain Model

The CA6DL3-37E5 diesel engine produced by China FAW Group Corporation is selected for modeling. The 12JSD180TA type 12-gear transmission produced by Shaanxi Fast Auto Drive Refco Group Ltd. is selected. The engine parameters and transmission gear ratios are shown in Table 9 and Table 10, respectively.

3.1.4. Suspension Model

Some parameters of the tractor and trailer axles are shown in Table 11. Both the tractor and trailer are equipped a with non-independent suspension. The vehicle axles used are integral. The front axle of the tractor is the steering axle. The wheel spacing of tractor steering axle, drive axle and trailer axle are 2030 mm, 1863 mm and 1863 mm, respectively.

3.1.5. Steering and Braking Model

The steering system is simplified, and all steering parameters and characteristics are set to default values in the TruckSim simulation software. The braking system model adopts pneumatic braking, and all wheels can produce braking force during braking. The model is equipped with an anti-lock braking system. We set the same axle on both sides of the wheel, braking at the same time to produce braking force. The braking force of the tractor steering bridge on the maximum braking torque is 7.5 kN/m, and that of the rest of the axle on the maximum braking torque is 10 kN/m. Each axle can set a different braking lag time.

4. Vehicle Test

In order to test the accuracy of the established simulation model, a real vehicle road test is designed, and the accuracy of the model is verified by comparing the test data with the output results of the simulation model.

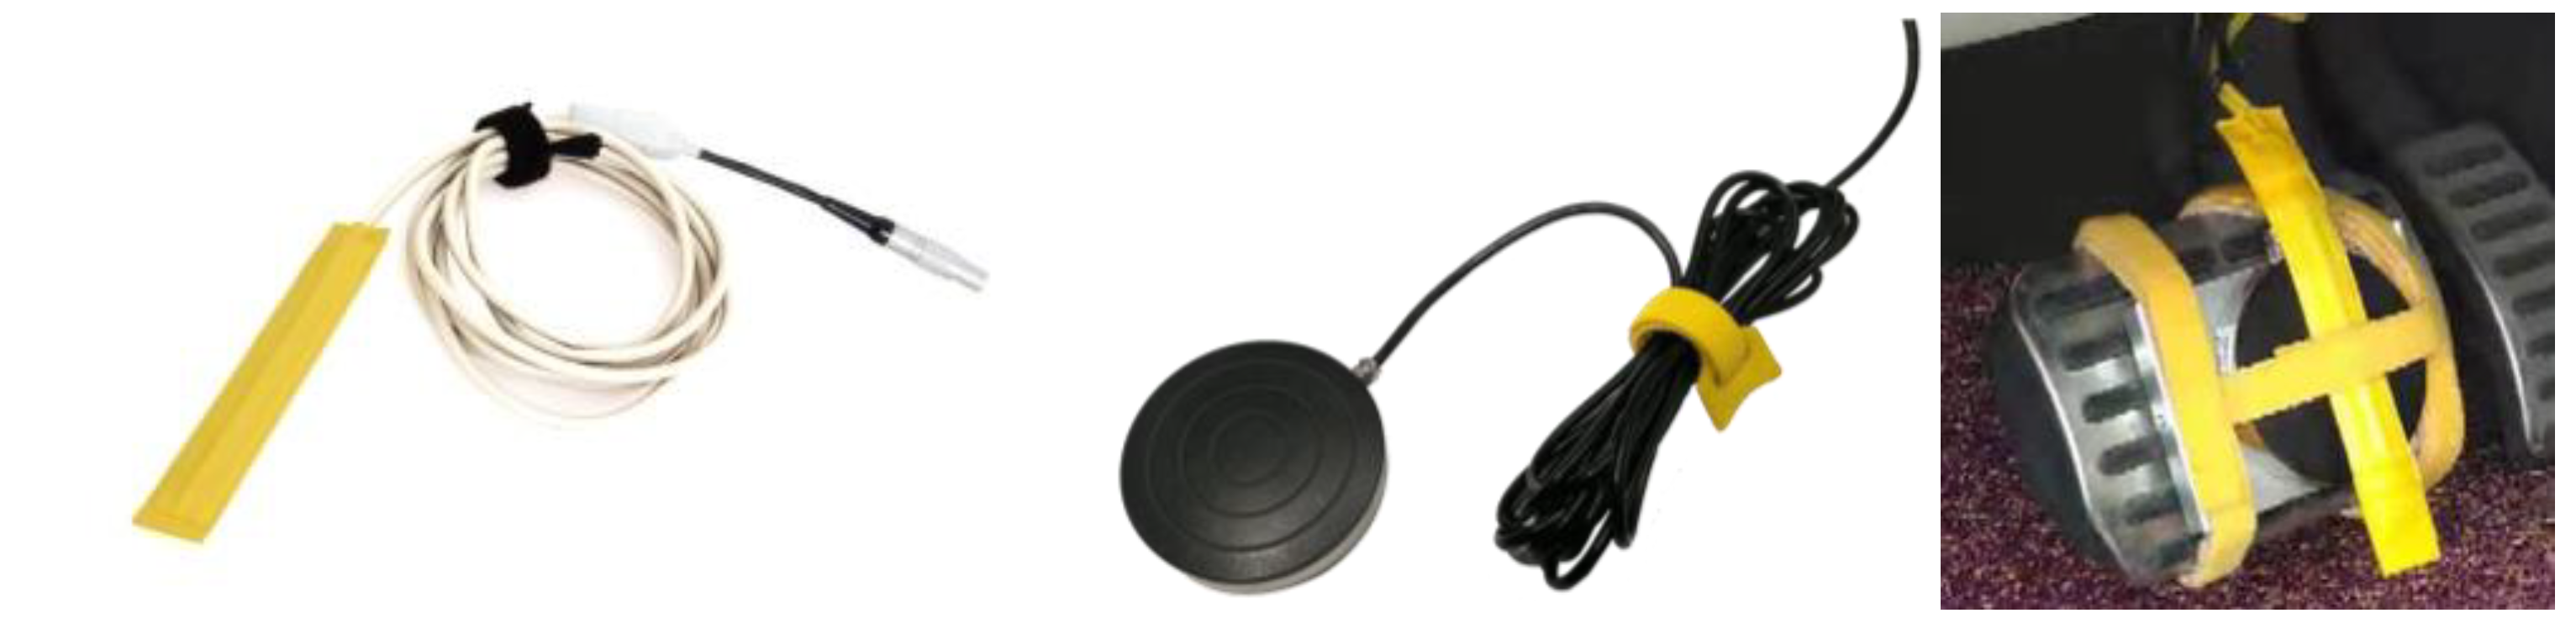
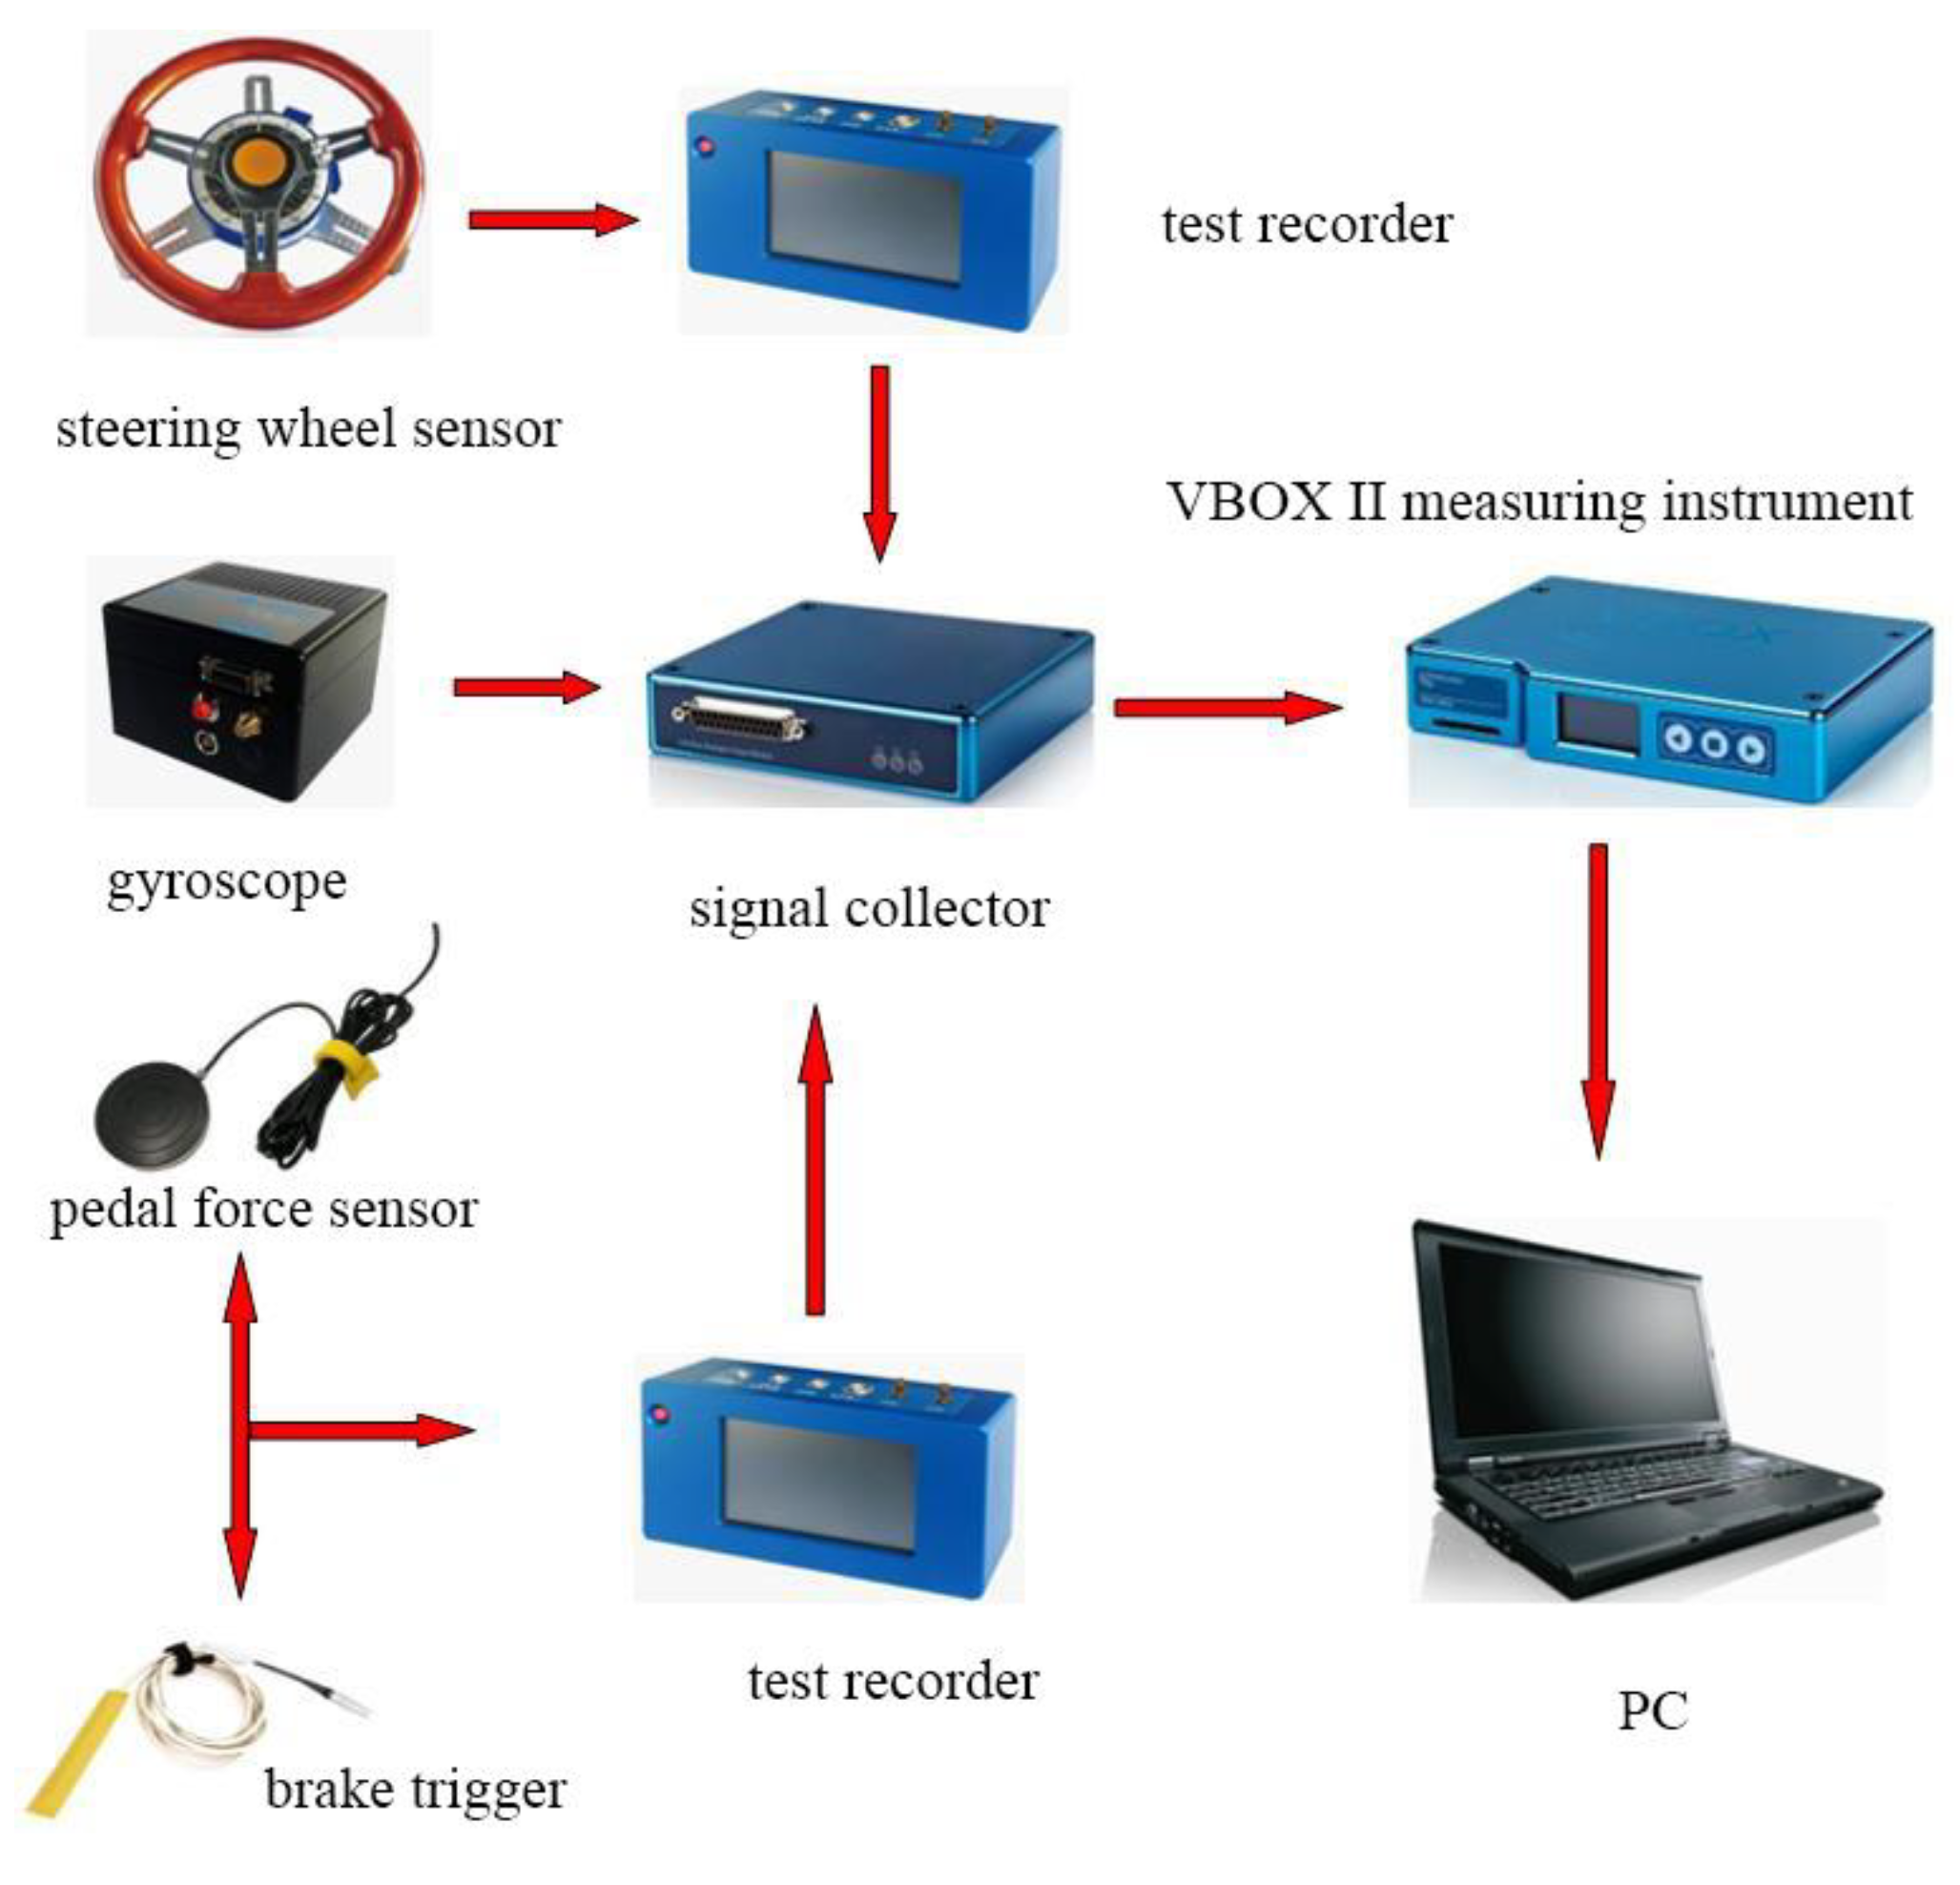
4.1. Construction of Detection System

The real vehicle road test mainly obtains test data through the sensors installed on the vehicle. This test uses a VBOX measuring instrument, gyroscope, steering wheel sensor, test recorder, signal collector, pedal force sensor, brake trigger, power supply equipment and PC. The selected equipment is shown in Figure 2. The selected detection equipment can simultaneously detect the driving state and driving parameters of the tractor and the semi-trailer, including the displacement of the vehicle; the horizontal, vertical and pitch acceleration; the angular velocity; the yaw angle; the sideslip angle; the pitch angle; etc. Through these parameters, the stability of the semi-trailer train in the braking process can be judged in real time. The arrows in Figure 2 indicate the connections between the devices.
The steering wheel angle sensor and measurement recorder can be used to test and record the steering wheel angle and rotational torque. One need only to fix the buckle on the vehicle steering wheel when using it. Its working principle is to use a high-precision photoelectric encoder to measure the angle of the steering wheel relative to the baseline. Since the steering wheel angle sensor itself is not equipped with a data storage reading module, the data need to be read and stored by an external test recorder. The steering wheel angle sensor is marked with a corner scale, and the angle of the steering wheel can also be read through the position indicated by the baseline pointer.
The gyroscope integrates a three-coordinate inertial measurement unit, which is installed near the center of mass of the vehicle when used to measure the vehicle’s position, speed, heading, vertical speed, lateral and longitudinal acceleration, roll angle, pitch angle, acceleration in the XYZ axis direction and other data.
The braking strength can be tested by the brake pedal force sensor. Before the test, the brake trigger is posted on the pedal force sensor and the pedal force sensor is fixed on the driving brake pedal. At the same time, the brake trigger and the pedal force sensor are connected to the test recorder, which can detect the time at which the driver steps on the brake pedal and the size of the braking force in real time. The installation style is shown in Figure 3.
In this paper, a VBOX II measuring instrument is used to track the GPS measurements of the semi-trailer train. Because of its small size and weight and its simple installation and operation, it is very suitable for vehicle dynamic detection. It is also mounted close to the center of mass of the vehicle when used. The VBOX II is equipped with a low-power multi-frequency global navigation satellite system receiver, which can track GPS, GLONASS, BeiDou and Galileo satellite signals at the same time, and transmit the real-time position and driving parameters of the vehicle to the test equipment. Its dual-antenna engine can record data at a frequency of 20 Hz and can be used to measure vehicle speed, driving distance, acceleration, vehicle sideslip angle, yaw angle, pitch angle and other parameters. Thanks to the device’s built-in display, CAN interface and two sets of analog and digital output interfaces, the recorded data can be read directly on the computer via a USB interface, and an SD card can be inserted into the computer for storage of the data after reading it.

4.2. Vehicle Test

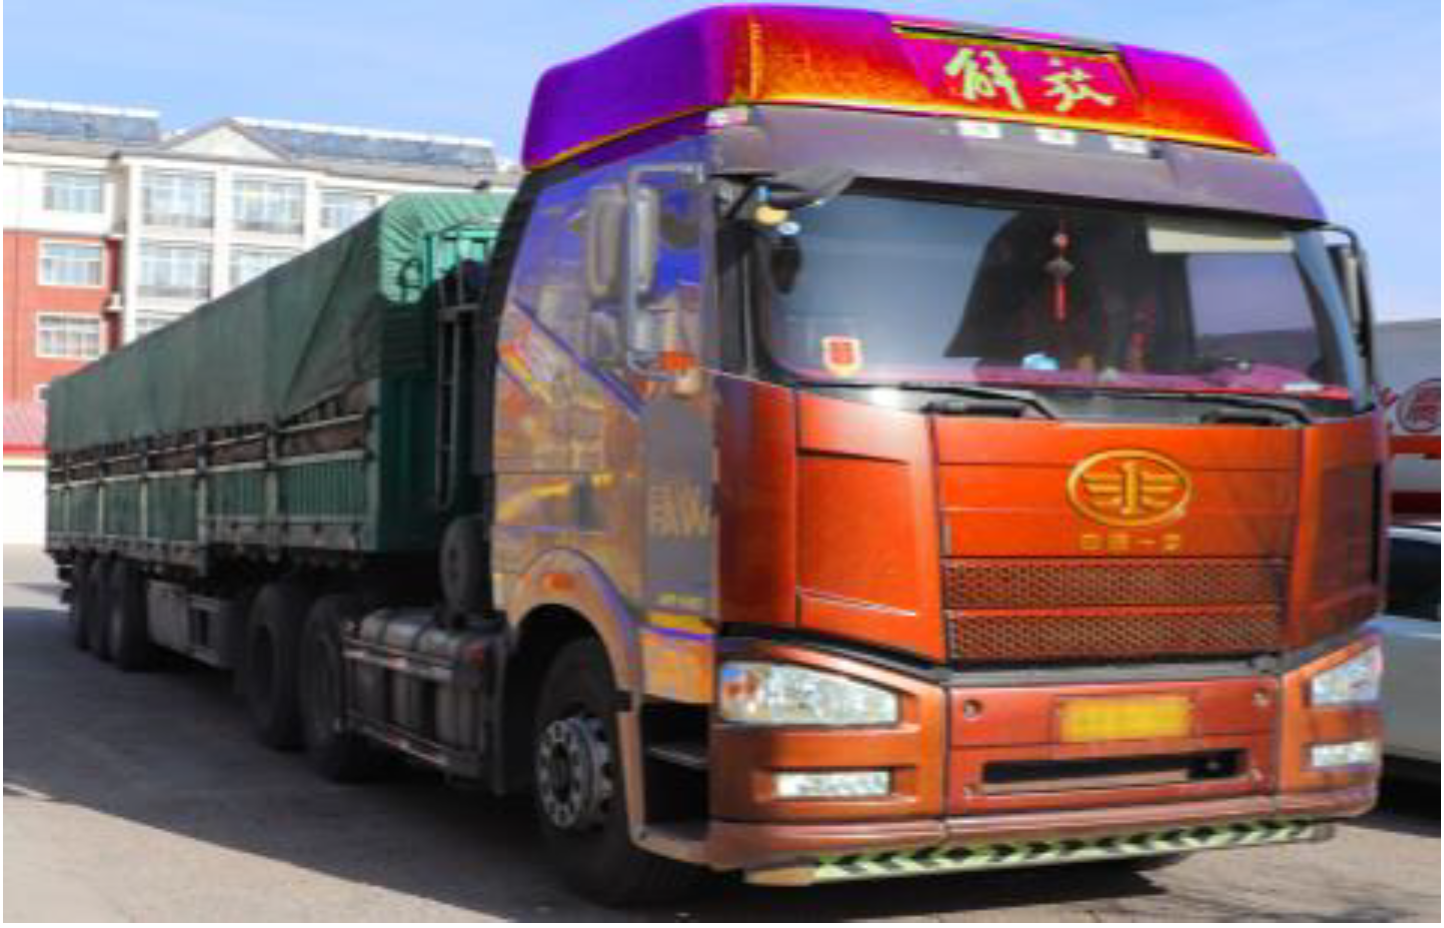
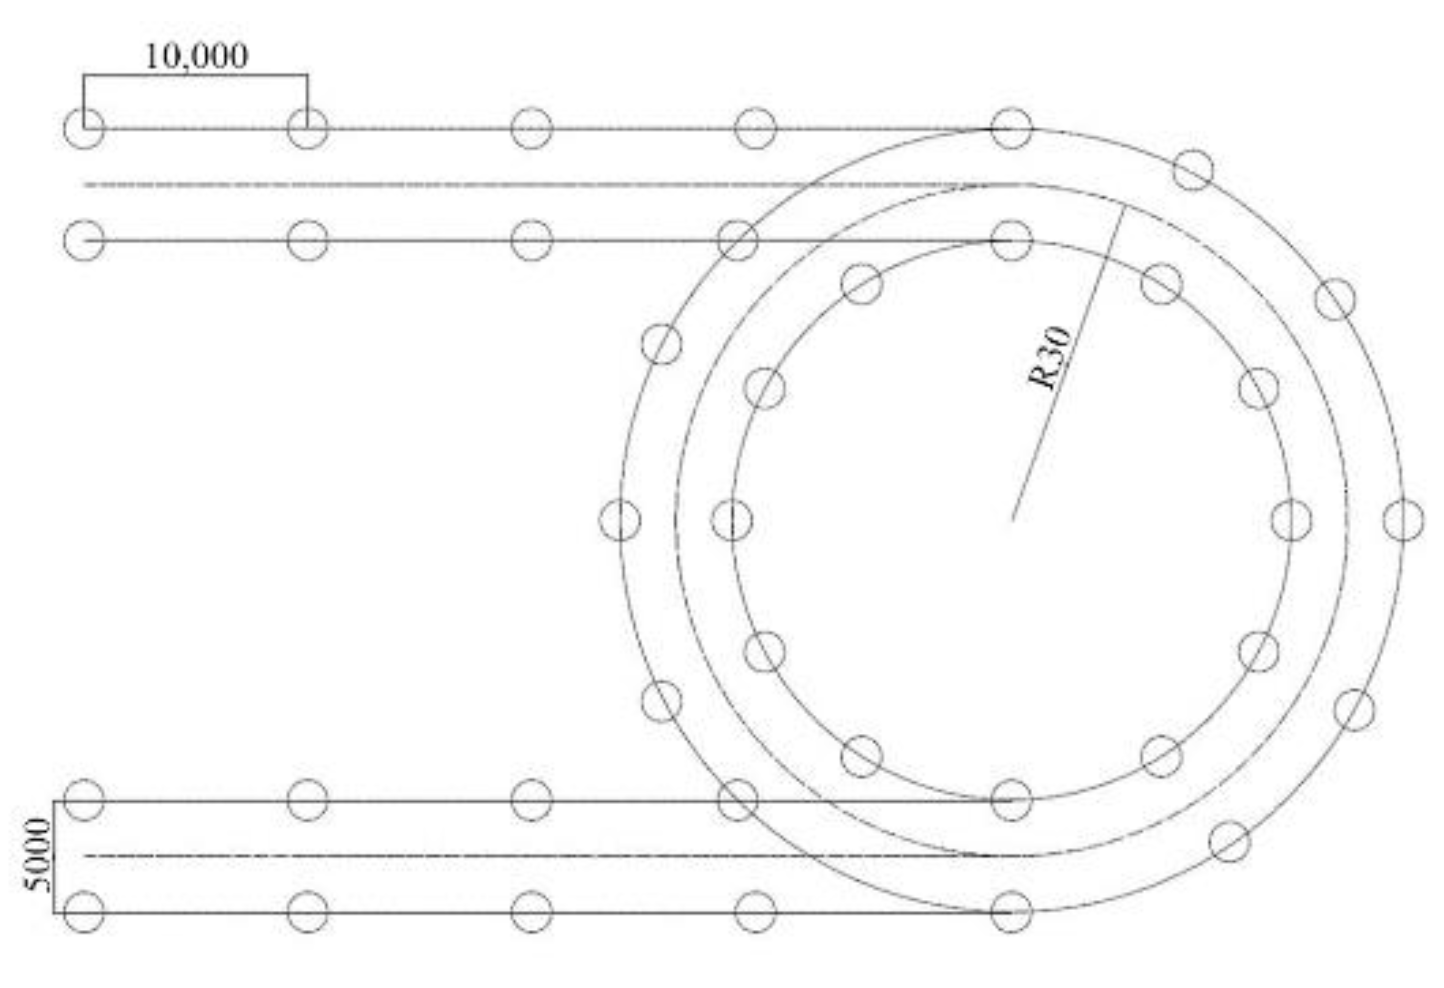
4.2.1. Vehicle and Site Selection

The selected test vehicle is shown in Figure 4. Test site conditions: flat, dry, clean concrete pavement with an adhesion coefficient of 0.7; a road with a transverse and longitudinal slope of less than 1%; a test day temperature of 27 °C and a maximum wind speed of 3 m/s. The test site layout is shown in Figure 5. The lane width is 5 m, and the straight part of the length measures 40 m. The circular runway has a turning radius of 30 m, and a stake is set every 10 m along the runway to allow the driver to clear the route. Test vehicles emerge from the straight runway at a certain initial speed before entering the circular runway, to ensure a vehicle speed of 50 km/h. The driver observes the test recorder installed on the vehicle to keep the vehicle moving at a constant speed. Before the end of the experiment, the test vehicle drives the annular runway to ensure that the test data recording time exceeds 15 s. The sensors installed on the train record the input and response of the vehicle and ensure that the final data show that the semi-trailer train can maintain a steady circular motion on the circular runway.

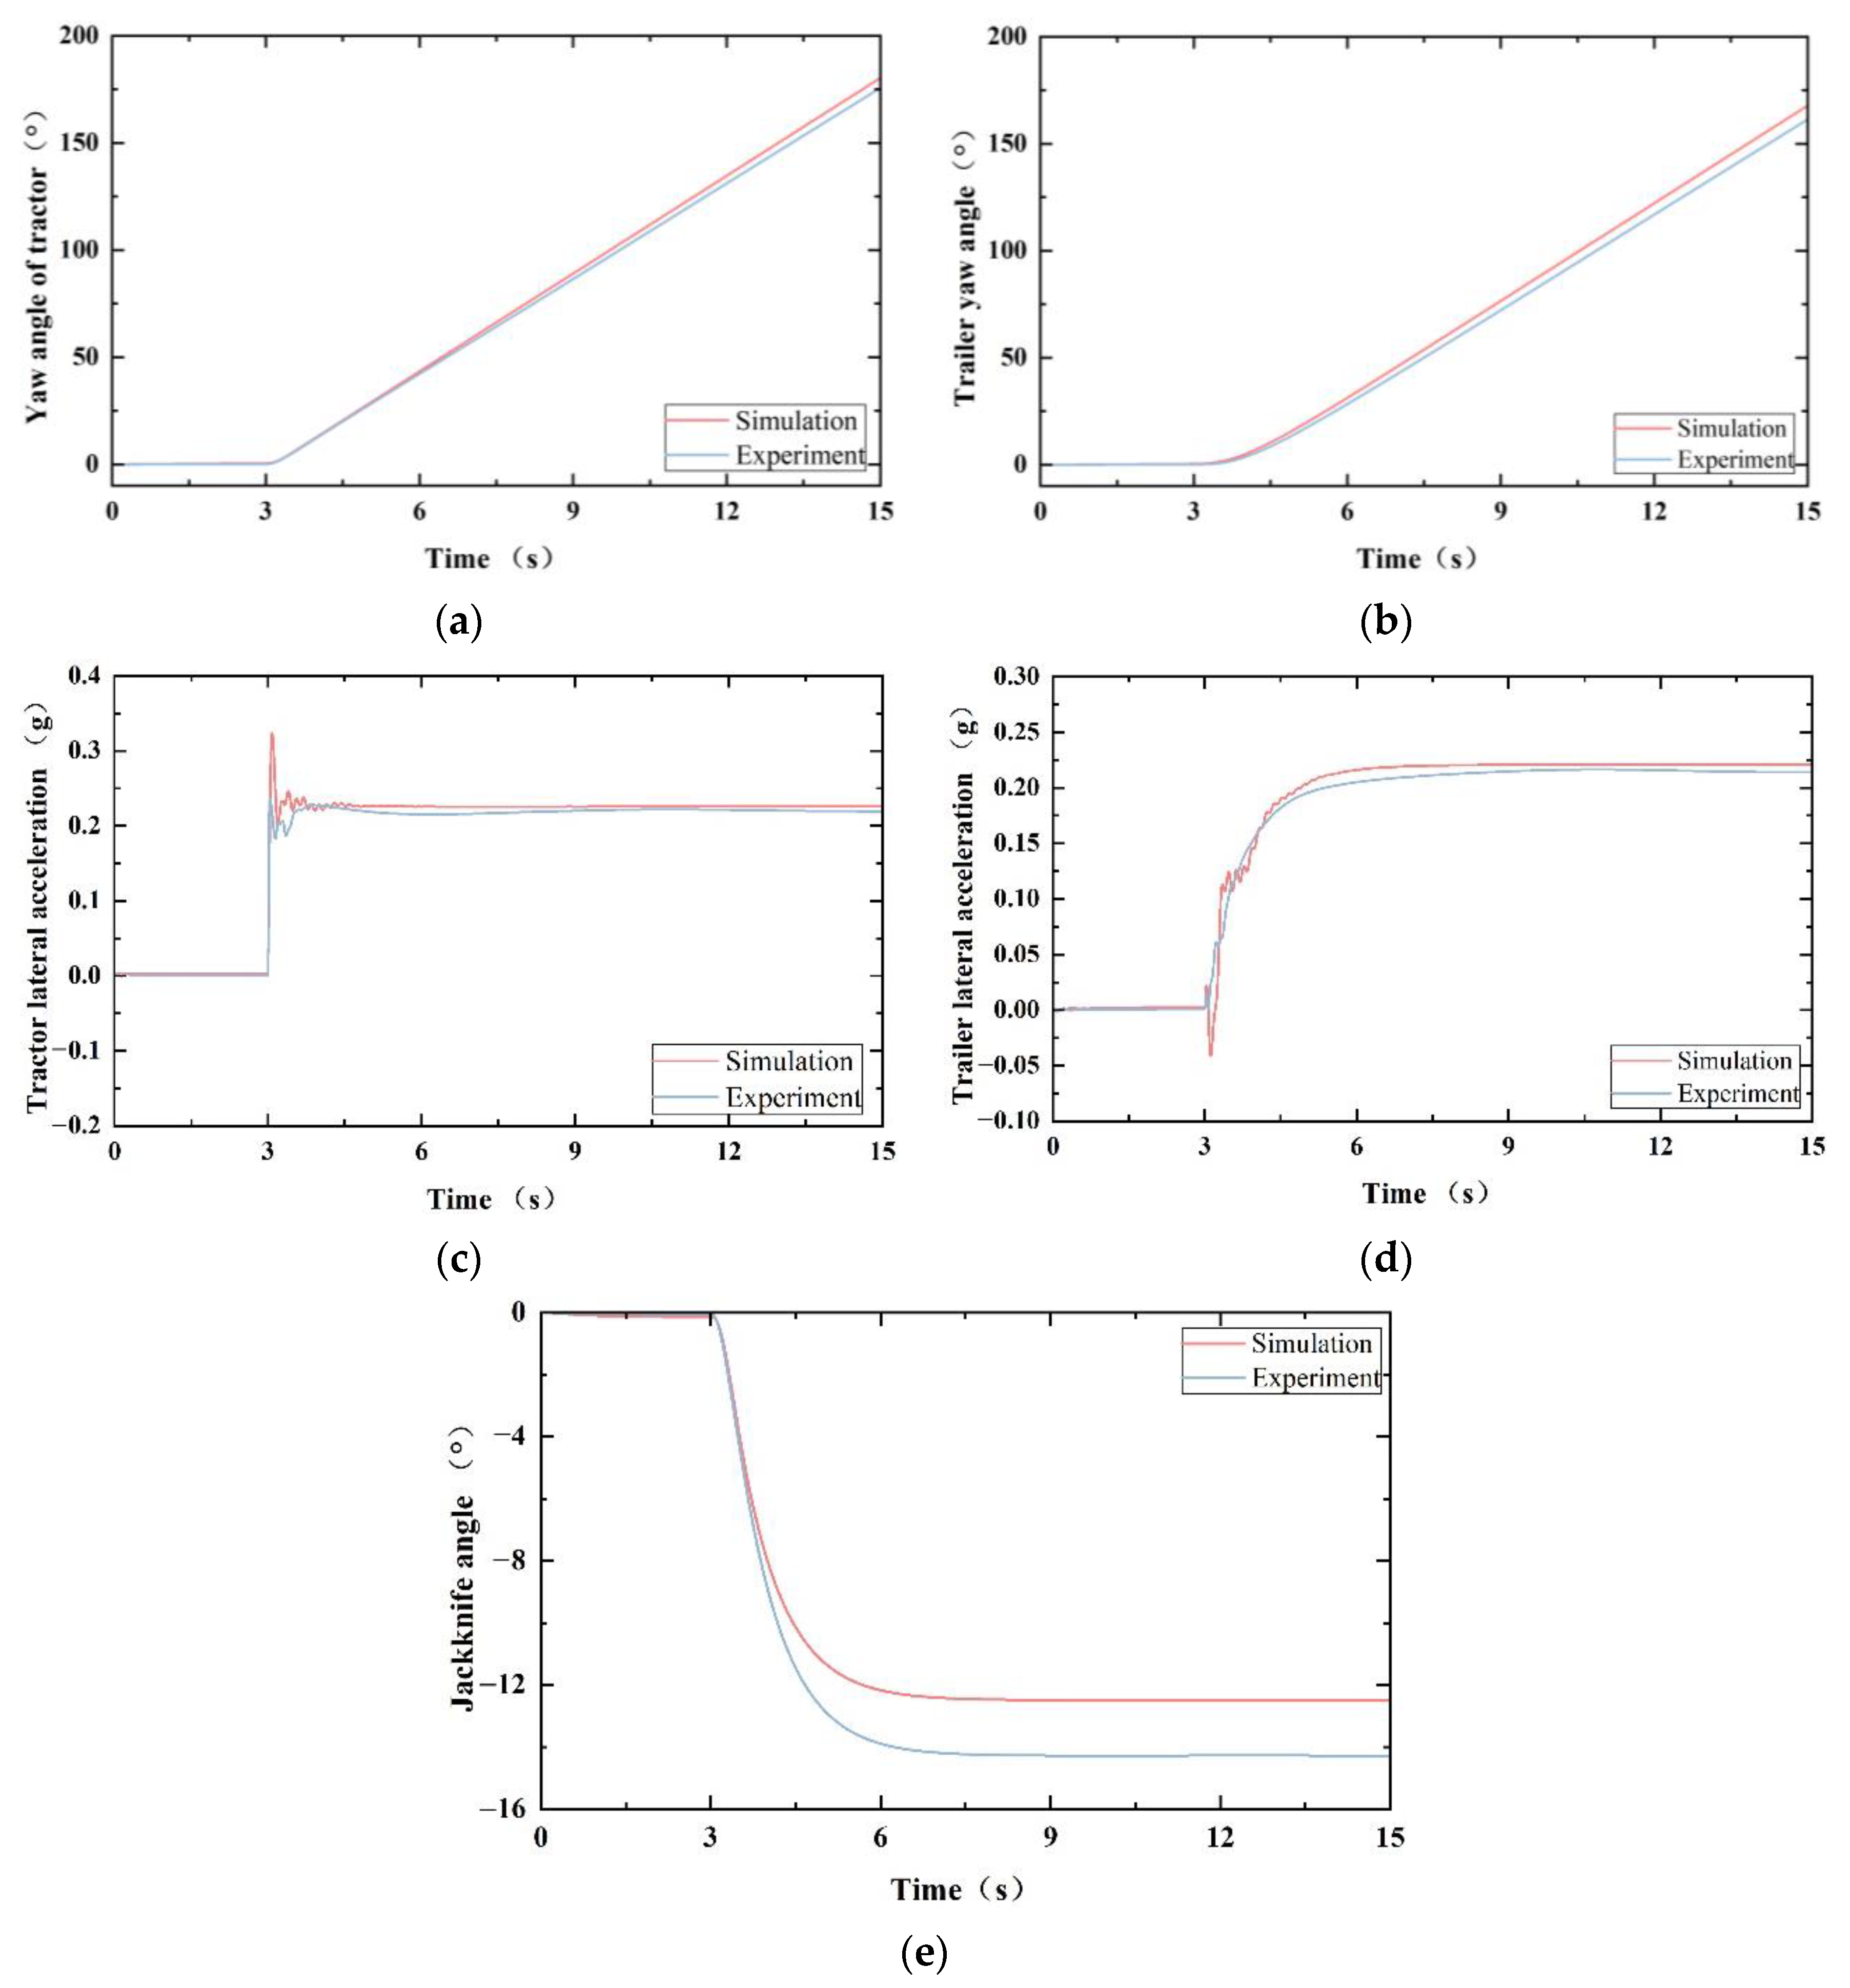
4.2.2. Simulation Test Analysis

In order to verify the accuracy of the simulation model, the simulation model uses the same conditions as the real vehicle test. The accuracy of the simulation model is verified by comparing the data of the simulation and the real vehicle test. The yaw angle, sideslip angle and hinge angle of the train are selected for comparison. The comparison between the real vehicle test and the simulation model data is shown in Figure 6.
Figure 6 shows the comparison between the actual test data and the simulation data for the semi-trailer train. At 0–3 s, when the train is running in a straight line state, the simulation and test data only show small changes over time. At 3 s, the driver turns the steering wheel and the train turns. The data of the simulation and the test begin to change significantly. The yaw angle of tractor and semi-trailer increases approximately linearly with time. The lateral acceleration of the tractor has a step change. Due to the interaction between the tractor and the trailer, the lateral acceleration of the tractor reaches the maximum and then fluctuates irregularly. After the fluctuation, the lateral acceleration of the tractor tends to be stable. Due to the influence of inertia, the lateral acceleration of the trailer changes more smoothly than that of the tractor. The jackknife angle of the two vehicle increases rapidly after the train turns. When the train is in the steady state of the curve, the jackknife angle of the two vehicles tends to be stable. From the above simulation and real vehicle test data, it can be seen that, when the same input is given to the simulation model and the real vehicle test, although the output of the two has some differences in response and data, the overall trend and range of change are in good agreement. The minimum deviation of the yaw angle of the tractor is 2.66%, and the maximum deviation of the jackknife angle is 12.48%. This shows that the established simulation model can reflect the motion characteristics of the real vehicle and can provide reliable support and a theoretical basis for the following research.

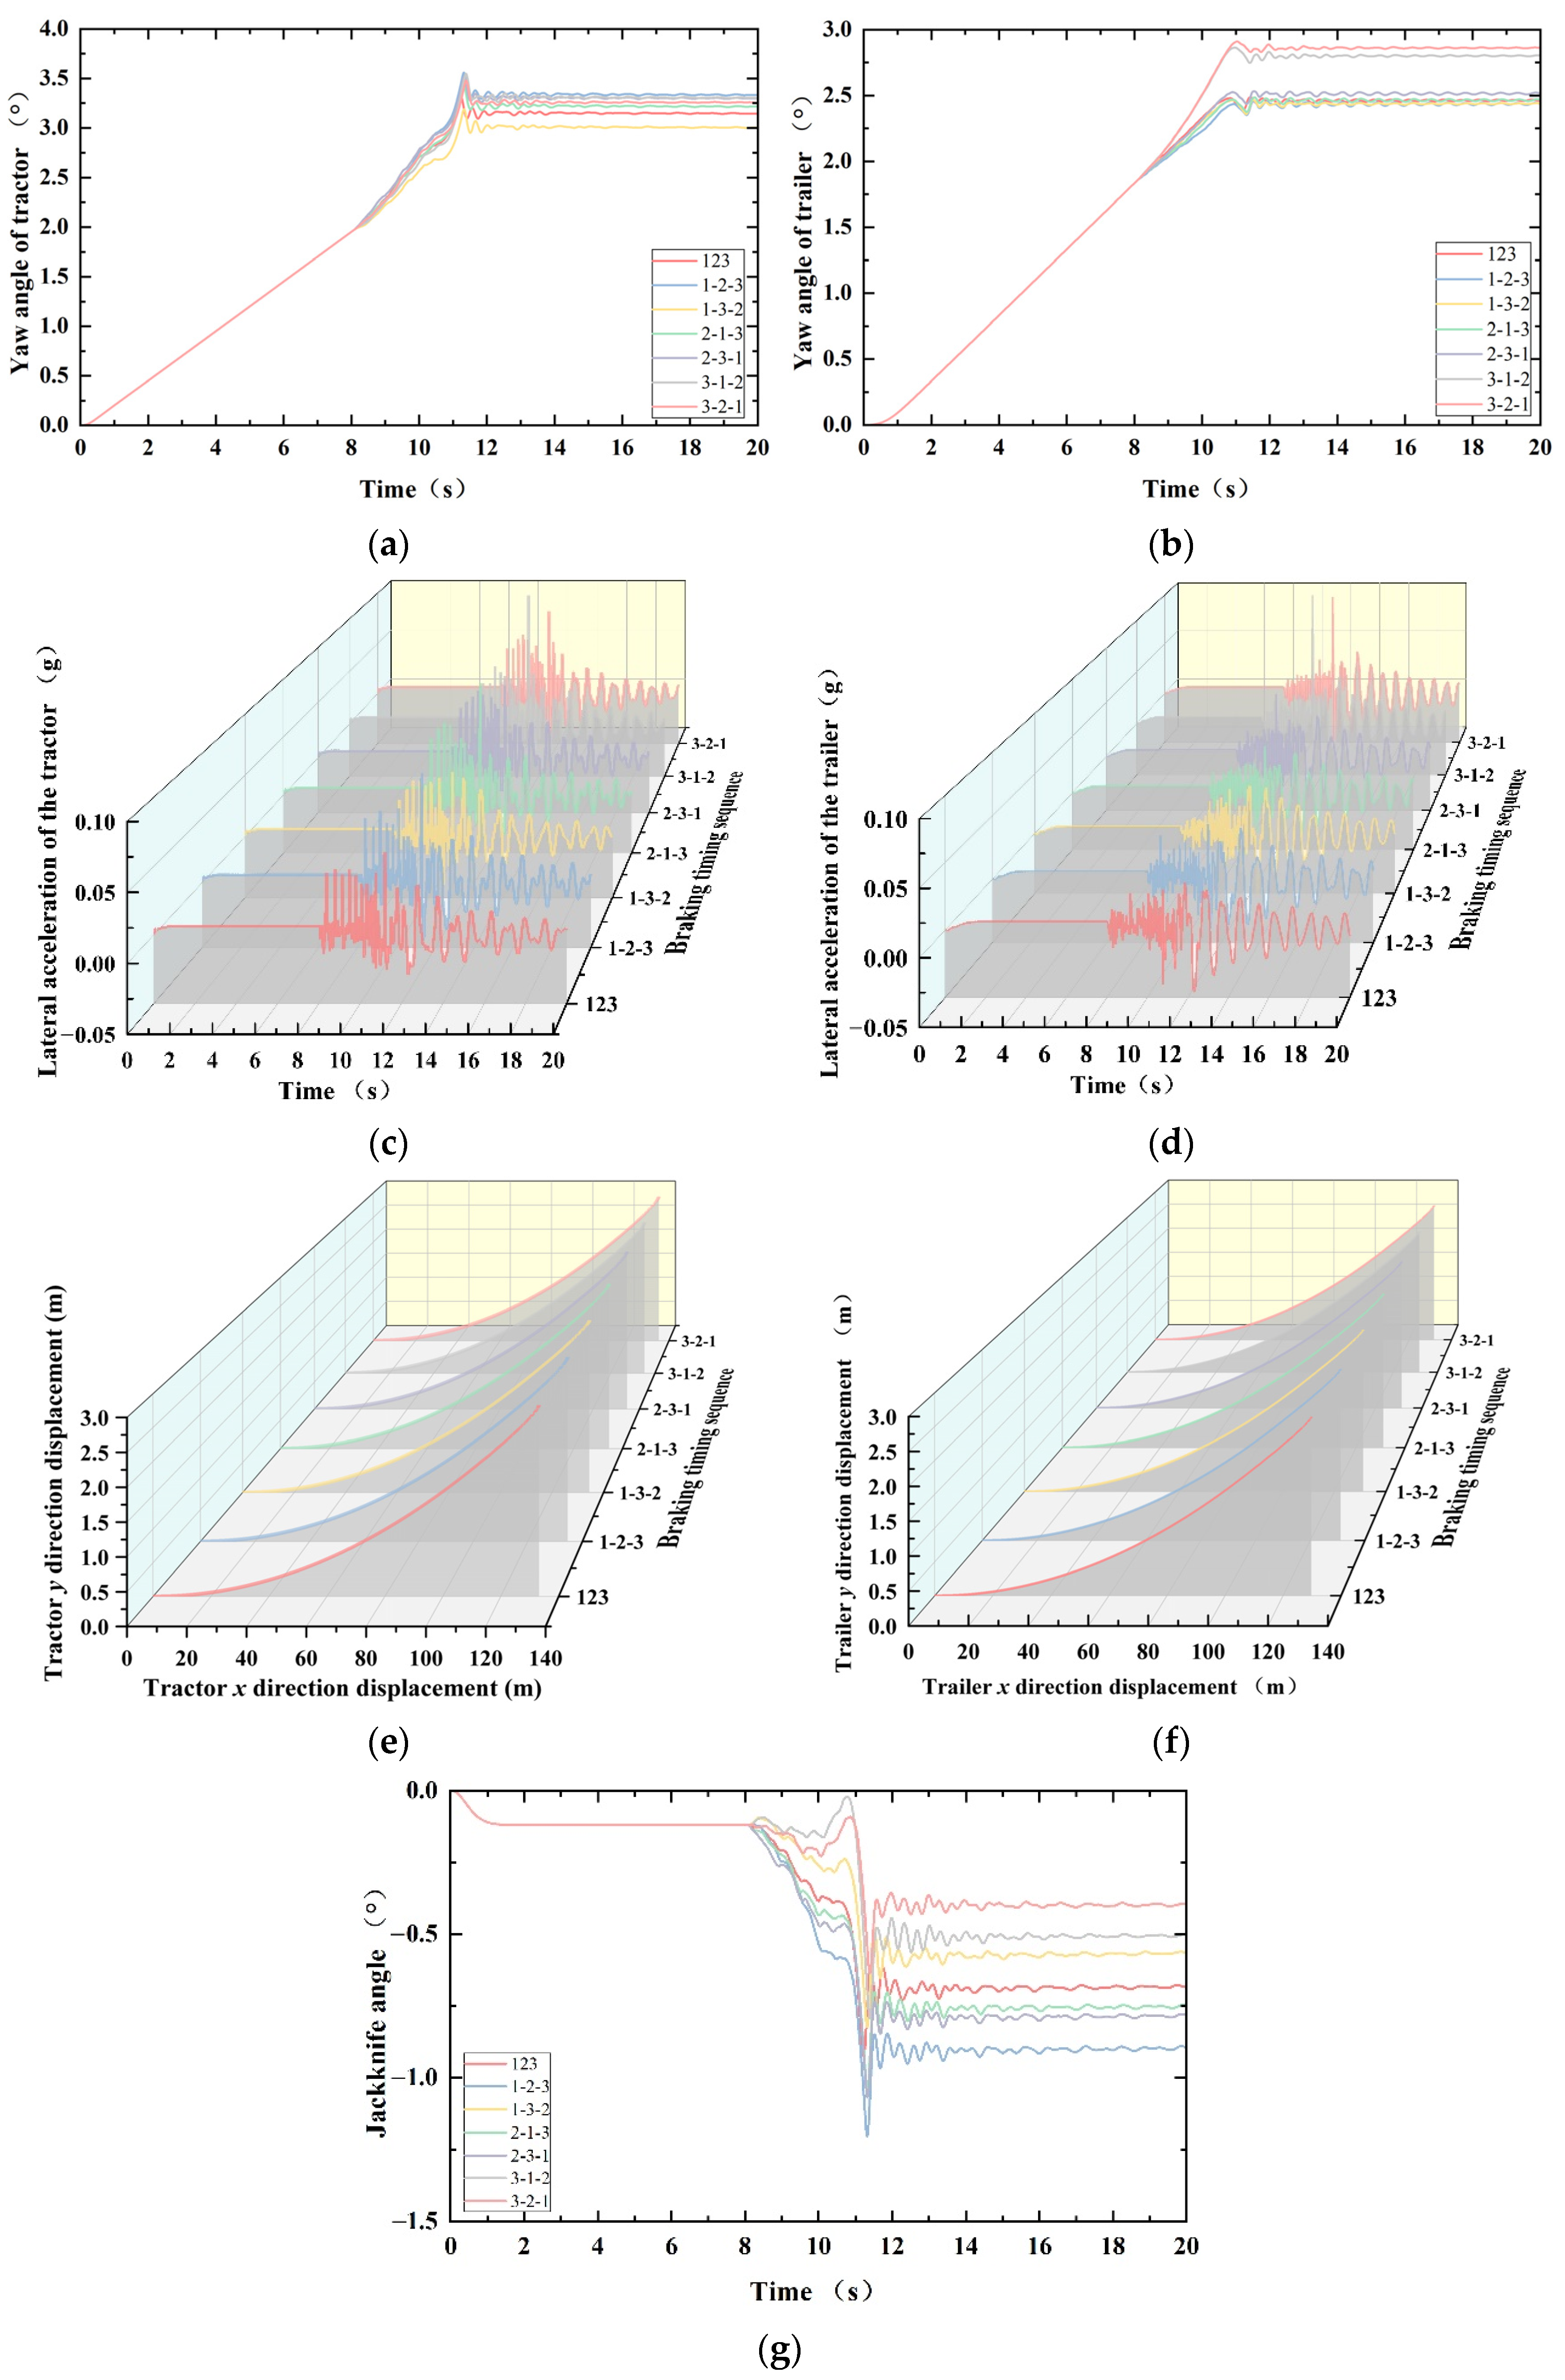
5. Simulation Analysis of Braking Timing Sequence Stability of Semi-Trailer Train

According to the calculation method of permutation and combination, there are a total of seven different combinations of braking timing arrangements for three-axle semi-trailer trains. They are all axles braking at the same time, 1-2-3, 1-3-2, 2-1-3, 2-3-1, 3-1-2 and 3-2-1, respectively. Among them, one represents the steering axle of the tractor, two represents the driving axle of the tractor and three represents the semi-trailer axle. The front axle first produces braking. The semi-trailer train model is simulated and analyzed according to these seven braking timing sequences. The speed is set to 50 km/h and braking force is applied slowly until the vehicle stops. The yaw angle, lateral acceleration, driving trajectory and jackknife angle of the train are simulated and output. The data are shown in Figure 7. Vehicle braking stability evaluation is usually concerned with the maximum value of the test items, so the maximum value of the simulation output is selected as the evaluation value. The yaw angle and lateral acceleration select the sum of the tractor and semi-trailer outputs, and braking distance and braking deviation are evaluated based on the tractor. The maximum output value of each evaluation index after simulation is shown in Table 12.
P i = i = 1 5 w i r i , i = 1 5 W i = 1   a n d   W i 0
The linear weighted sum method is used to optimize the multi-objective optimization of the braking time sequence of the semi-trailer train, as shown in Equation (13), where Pi is the comprehensive evaluation value corresponding to the i-type braking time sequence, wi is the weight corresponding to each evaluation index, and ri is the evaluation index value corresponding to different braking time sequences. The linear weighted sum method can take into account the impact of all evaluation indicators on the whole, and can better extract the integrity of the system. P1 = 3.981, P2 = 4.237, P3 = 3.974, P4 = 4.152, P5 = 4.195, P6 = 4.231 and P7 = 4.146 is calculated by substituting the data in Table 3 and Table 8 into Equation (13). Because, when evaluating the braking stability of the semi-trailer train for different braking timing sequences, the smaller the output value of each evaluation, the better, it follows that, the smaller the Pi value is, the better the braking stability of the train using that particular braking timing sequence. By comparison, it can be seen that when the braking timing sequence is tractor steering axle–trailer axle–tractor drive axle, the comprehensive evaluation value is the smallest, and it can be considered that the braking stability of the train is the best at this time. When the braking sequence is tractor steering axle–tractor drive axle and trailer axle, the comprehensive evaluation value is the largest, and the braking stability is the worst under this braking timing sequence.

6. Conclusions

Referring to the regulations and standards of Europe, America and China for the braking performance of semi-trailer trains, a comprehensive evaluation system for the braking timing sequence of semi-trailer trains is established, and five evaluation indexes of vehicle yaw angle, jackknife angle, braking distance, braking deviation and lateral acceleration are proposed. Using the FAHP, the weight of each evaluation index is determined by the expert’s score of each evaluation index. Through calculation and analysis, it is known that the jackknife angle of the train is the most important factor to measure the braking timing sequence. A three-axle semi-trailer train model is established using TruckSim simulation software, and the accuracy of the model is verified by experiments. By selecting braking timing sequences with different permutations and combinations of forms to simulate the braking motion characteristics of the semi-trailer train, and combining those results with the weight analysis of the evaluation index, it is concluded that the braking stability of the vehicle is the best when the braking timing sequence is the steering axle of the tractor–trailer axle–trailer drive axle, and the braking stability of the train is the worst in the ownership dynamic sequence when the braking timing sequence of the steering axle of the tractor–trailer drive axle–trailer axle is adopted.

Author Contributions

Software, M.Z.; Validation, L.Z.; Writing—review & editing, S.F.; Supervision, H.S. All authors have read and agreed to the published version of the manuscript.

Funding

This research received no external funding.

Institutional Review Board Statement

Not applicable.

Informed Consent Statement

Not applicable.

Data Availability Statement

Not applicable.

Conflicts of Interest

The authors declare no conflict of interest.

References

  1. Zhao, C. Analysis and Research of Automotive Brake Performance Based on MATLAB. In Proceedings of the 2014 International Conference on Mechatronics Engineering and Computing Technology, Shanghai, China, 9 April 2014. [Google Scholar]
  2. Wang, Z.; Wei, W.; Si, L.R.; Wang, Y.Z.; Yan, Q.D. Application of Fuzzy Analytic Hierarchy Process in Comprehensive Evaluation of Braking Performance of Hydrodynamic Retarder. Chin. Hydrau. Pneum. 2021, 45, 13–20. [Google Scholar]
  3. Lv, N. Study in the Appraising indexes of Automotive Braking Properties. J. Guangxi Agric. Univ. 1993, 12, 81–84. [Google Scholar]
  4. Saaty, T.L.; Ozdemir, M.S. The Encyclicon: A Dictionary of Decisions with Dependence and Feedback Based on the Analytic Network Process; RWS Publications: Philadelphia, PA, USA, 2021; pp. 51–89. [Google Scholar]
  5. GB 7258-2017; Traffic Management Research Institute of the Ministry of Public Security. Technical Specifications for Safety of Power-Driven Vehicles Operating on Roads; Standards Press of China: Beijing, China, 2017; pp. 20–27.
  6. GB 21670-2008; Traffic Management Research Institute of the Ministry of Public Security. Technical Requirements and Testing Methods for Passenger Car Braking System; Standards Press of China: Beijing, China, 2008; pp. 5–19.
  7. GB 38900-2020; Traffic Management Research Institute of the Ministry of Public Security. Items and Methods for Safety Technology Inspection of Motor Vehicles; Standards Press of China: Beijing, China, 2020; pp. 34–38.
  8. National Highway Traffic Safety Administration. FMVSS121-2017 Air Brake System; NHTSA: Washington, DC, USA, 2017; pp. 575–597.
  9. The United Nations Economic Commission for Europe. ECER13-2014 Uniform Provisions Concerning the Approval of Categories M, N and O with Regard to Braking; The United Nations Economic Commission for Europe: Genève, Swiss, 2014; pp. 42–262. [Google Scholar]
  10. Zhang, L.B.; Feng, S.Y.; Shan, H.Y.; Wang, G.R. Tractor-trailer-train braking time sequence detection based on monocular vision. Adv. Mech. Eng. 2021, 13, 1–13. [Google Scholar] [CrossRef]
  11. Guo, Z.K. Design and Application of Modern Automobile Train; Beijing Institute of Technology Press: Beijing, China, 2006; pp. 131–154. [Google Scholar]
  12. Gowda, V.D.; Ramachandra, A.C.; Thippeswamy, M.N.; Pandurangappa, C.; Naidu, R.P. Modelling and performance evaluation of anti-lock braking system. J. Eng. Sci. Technol. 2019, 14, 3028–3045. [Google Scholar]
  13. Wu, M.; Shih, M. Simulated and experimental study of hydraulic anti-lock braking system using sliding-mode PWM control. Mechatronics 2003, 13, 331–351. [Google Scholar] [CrossRef]
  14. Saaty, T.L.; Vargas, L.G. Models, Methods, Concepts & Applications of the Analytic Hierarchy Process; Kluwer Academic Publishers: London, UK, 2012; pp. 47–135. [Google Scholar]
  15. Li, Y. Research on the handling stability of a new generation of combinations of vehicles-the double road train. Master’s Thesis, Research Institute of Highway Ministry of Transport, Beijing, China, 2020. [Google Scholar]
  16. GB/T 2977-2016; National Tire Rim Standardization Technical Committee. Size Designation, Dimensions, Inflation Pressure and Load Capacity for Truck Tyres; Standards Press of China: Beijing, China, 2016; pp. 33–61.
  17. Secretariat of National Tire Rim Standardization Technical Committee. Standard Manual of European Tire Rim Technology Organization (ETRTO); China Petroleum and Chemical Industry Federation: Beijing, China, 2004; p. 20. [Google Scholar]
Figure 1. Simulation model of semi-trailer train.
Applsci 12 12605 g001
Figure 2. Selection and connection of detection equipment.
Applsci 12 12605 g002
Figure 3. Brake trigger, pedal force sensor and installation style.
Applsci 12 12605 g003
Figure 4. Test vehicle.
Applsci 12 12605 g004
Figure 5. Curve line planning with test site layout.
Applsci 12 12605 g005
Figure 6. Comparison of real vehicle test and simulation data of semi-trailer train running on curve. (a) Tractor yaw angle comparison. (b) Trailer yaw angle comparison. (c) Tractor lateral acceleration comparison (d) Trailer lateral acceleration comparison. (e) Jackknife angle comparison.
Applsci 12 12605 g006
Figure 7. Simulation output value of each evaluation index. (a) Yaw angle of the tractor. (b) Yaw angle of the trailer. (c) Lateral acceleration of the tractor. (d) Lateral acceleration of the trailer. (e) Tractor trajectory. (f) Trailer trajectory. (g) Jackknife angle.
Applsci 12 12605 g007
Table 1. Expert Information Sheet.
ItemExpert 1Expert 2Expert 3
Professional titleProfessorSenior engineerAssociate professor
Academic degreeDoctorMasterMaster
Seniority (years)252827
Table 2. Index values, linguistic variables and triangular fuzzy numbers.
Scale ValueLinguistic VariableTriangular Fuzzy Number
1Same importance(1, 1, 1)
3A little important(1, 3, 5)
5Basically important(3, 5, 7)
7Relative importance(5, 7, 9)
9Absolutely important(7, 8, 9)
The reciprocal of 3, 5, 7, 9Exchange of importance of two indicators
Table 3. Triangular fuzzy number judgment matrix given by expert one.
A1A2A3A4A5
A1(1.000, 1.000, 1.000)(1.000, 1.000, 1.000)(0.200, 0.333, 1.000)(1.000, 1.000, 1.000)(1.000, 1.000, 1.000)
A2(1.000, 1.000, 1.000)(1.000, 1.000, 1.000)(0.200, 0.333, 1.000)(0.200, 0.333, 1.000)(1.000, 1.000, 1.000)
A3(1.000, 3.000, 5.000)(1.000, 3.000, 5.000)(1.000, 1.000, 1.000)(1.000, 3.000, 5.000)(1.000, 3.000, 5.000)
A4(1.000, 1.000, 1.000)(1.000, 3.000, 5.000)(0.200, 0.333, 1.000)(1.000, 1.000, 1.000)(0.200, 0.333, 1.000)
A5(1.000, 1.000, 1.000)(1.000, 1.000, 1.000)(0.200, 0.333, 1.000)(1.000, 3.000, 5.000)(1.000, 1.000, 1.000)
Table 4. Triangular fuzzy number judgment matrix given by expert two.
A1A2A3A4A5
A1(1.000, 1.000, 1.000)(0.200, 0.333, 1.000)(0.143, 0.200, 0.333)(1.000, 1.000, 1.000)(1.000, 1.000, 1.000)
A2(1.000, 3.000, 5.000)(1.000, 1.000, 1.000)(0.200, 0.333, 1.000)(0.200, 0.333, 1.000)(1.000, 3.000, 5.000)
A3(3.000, 5.000, 7.000)(1.000, 3.000, 5.000)(1.000, 1.000, 1.000)(3.000, 5.000, 7.000)(1.000, 3.000, 5.000)
A4(1.000, 1.000, 1.000)(1.000, 1.000, 1.000)(0.143, 0.200, 0.333)(1.000, 1.000, 1.000)(0.200, 0.333, 1.000)
A5(1.000, 1.000, 1.000)(0.200, 0.333, 1.000)(0.200, 0.333, 1.000)(1.000, 3.000, 5.000)(1.000, 1.000, 1.000)
Table 5. Triangular fuzzy number judgment matrix given by expert three.
A1A2A3A4A5
A1(1.000, 1.000, 1.000)(0.200, 0.333, 1.000)(0.143, 0.200, 0.333)(1.000, 1.000, 1.000)(1.000, 1.000, 1.000)
A2(1.000, 3.000, 5.000)(1.000, 1.000, 1.000)(1.000, 1.000, 1.000)(1.000, 2.000, 3.000)(1.000, 3.000, 5.000)
A3(3.000, 5.000, 7.000)(1.000, 1.000, 1.000)(1.000, 1.000, 1.000)(1.000, 3.000, 5.000)(1.000, 1.000, 1.000)
A4(1.000, 1.000, 1.000)(1.000, 1.000, 1.000)(0.200, 0.333, 1.000)(1.000, 1.000, 1.000)(1.000, 1.000, 1.000)
A5(1.000, 1.000, 1.000)(0.200, 0.333, 1.000)(1.000, 1.000, 1.000)(1.000, 1.000, 1.000)(1.000, 1.000, 1.000)
Table 6. Triangular fuzzy number comprehensive judgment matrix.
A1A2A3A4A5
A1(1.000, 1.000, 1.000)(0.342, 0.481, 1.000)(0.160, 0.237, 0.481)(1.000, 1.000, 1.000)(1.000, 1.000, 1.000)
A2(1.000, 2.080, 2.924)(1.000, 1.000, 1.000)(0.342, 0.481, 1.000)(0.342, 0.481, 1.000)(1.000, 2.080, 2.924)
A3(2.080, 4.217, 6.257)(1.000, 2.080, 2.924)(1.000, 1.000, 1.000)(1.442, 3.557, 5.593)(1.000, 2.080, 2.924)
A4(1.000, 1.000, 1.000)(1.000, 1.442, 1.710)(0.179, 0.281, 0.693)(1.000, 1.000, 1.000)(0.342, 0.481, 1.000)
A5(1.000, 1.000, 1.000)(0.342, 0.481, 1.000)(0.342, 0.481, 1.000)(1.000, 2.080, 2.924)(1.000, 1.000, 1.000)
Table 7. Evaluation hierarchy and index weight of semi-trailer train braking timing sequence.
Goal LayerIndicator LayerWeight
Braking timing sequenceBraking distance0.083
Yaw angle0.216
Jackknife angle0.412
Lateral acceleration0.122
Brake deviation0.167
Table 8. Body structure parameters of semi-trailer train model.
ParameterTractorTrailer
Body height3200 mm2950 mm
Body width2540 mm2560 mm
Distance between centroid and front axis1200 mm5100 mm
The height of centroid from ground1250 mm1900 mm
Spring load quality8400 kg8500 kg
Yaw inertia48,384.0 kg·m2113,241.2 kg·m2
Roll inertia6026.2 kg·m26184.7 kg·m2
Pitch inertia48,384.0113,241.2 kg·m2
Table 9. Engine model parameter table.
ParameterNumbers and Units
Maximum power output279 kW
Maximum torque1650 N·m
Maximum torque speed1200~1600 rpm
Rated speed2100 rpm
Table 10. Transmission speed ratio of each gear.
Gear PositionR1R212345678910
Gear ratio11.562.5912.19.417.315.714.463.482.712.111.641.28
Table 11. Axles parameter table.
ParameterSteering AxleDriving AxleTractor Axle
Unsprung mass570 kg735 kg665 kg
Wheel track2030 mm1863 mm1863 mm
Wheel center height510 mm530 mm530 mm
Table 12. Maximum output value for each parameter.
ItemSimultaneous1-2-31-3-22-1-32-3-13-1-23-2-1
Tractor yaw angle3.319°3.559°3.190°3.422°3.512°3.548°3.479°
Trailer yaw angle2.487°2.458°2.467°2.486°2.533°2.863°2.910°
Tractor lateral acceleration0.060 g0.084 g0.053 g0.097 g0.066 g0.122 g0.082 g
Trailer lateral acceleration0.035 g0.043 g0.040 g0.041 g0.057 g0.124 g0.098 g
Jackknife angle0.924°1.201°0.823°1.043°1.068°0.792°0.636°
Braking distance22.354 m23.736 m23.449 m23.760 m23.800 m24.421 m24.313 m
Braking deviation2.829 m2.693 m2.686 m2.696 m2.703 m2.721 m2.723 m
Publisher’s Note: MDPI stays neutral with regard to jurisdictional claims in published maps and institutional affiliations.

