Abstract
Due to the declining land resources over the past few decades, the intensification of land uses has played a significant role in balancing the ever-increasing demand for food in developing nations such as India. To optimize agricultural land uses, one of the crucial indicators is cropping intensity, which measures the number of times a single parcel of land is farmed. Therefore, it is imperative to create a timely and accurate cropping intensity map so that landowners and agricultural planners can use it to determine the best course of action for the present and for the future. In the present study, we have developed an algorithm on Google Earth Engine (GEE) to depict cropping patterns and further fused it with a GIS environment to depict cropping intensity in the arid western plain zone of Rajasthan, India. A high-resolution multi-temporal harmonized product of the Sentinel-2 dataset was incorporated for depicting the growth cycle of crops for the year 2020–2021 using the greenest pixel composites. Kharif and Rabi accounted for 73.44% and 26.56% of the total cultivated area, respectively. Only 7.42% was under the double-cropped area to the total cultivated area. The overall accuracy of the classified image was 90%. For the Kharif crop, the accuracy was 95%, while for Rabi and the double-cropped region, the accuracy was 88%, with a kappa coefficient of 0.784. The present study was able to depict the seasonal plantation system in arid arable land with higher accuracy. The proposed work can be used to monitor cropping patterns and cost-effectively show cropping intensities.
1. Introduction
Agricultural activity is closely related to a number of physical and anthropogenic factors [1,2,3,4,5]. To maintain the balance between available land for cultivation and increasing demand for food in the recent era, both physical and anthropogenic factors are symbiotic and crucial [6,7,8]. In developing countries like India, agricultural lands are either fragmented into smaller parcels or limited for agricultural land expansion [9,10]. Hence, increasing cropping cycles in similar land parcels is the most effective way to increase crop production and ensure food security. Cropping intensity is one of the important aspects that define the level of intensification in agriculture [11,12,13]. Thus timely and accurate depiction of cropping patterns and cropping intensity can play a significant role in handling management practices not only for the present but also for the future. Multi-temporal satellite data is the feasible source of timely, cost-effective, and relatively accurate information in spatial extent regarding the present cropping systems. Using multi-temporal and multi-sensor remote sensing data, many researchers have demonstrated that it is possible to map cropping patterns, crop rotation, and other agricultural practices [14,15,16,17]. A remote sensing and geographic information system approach was adopted to depict cropping pattern mapping in Tumkur Taluk using the NDVI Technique [18]. The study showed how to employ remote sensing and GIS to map crop patterns and suitability. Cropping information is derived from Landsat 8 data using NDVI and supervised classification. The analysis considered the drainage, slope, and current crop activity maps as important aspects. The study concluded that ragi, coconut plantation, and paddy fields had a definite relation with water resource potential and crop suitability maps that helps farmers in achieving a high spatial yield. Few studies focused on integrating remote sensing and GIS to analyze the impact of cropping patterns on the environment [19]. The information used in this study was from both field observations and observations made via remote sensing. According to the findings, during the summer months, the region exhibited a uniform cropping pattern; most of the district was left fallow; the three most important crops were fodder, dhaicha, and sunflowers. During the winter months, the areas that exhibited a dissimilar crop pattern underwent a dramatic shift. A phenology-based technique was developed in studies to identify double-cropping fields by analyzing time-series Moderate Resolution Imaging Spectroradiometer (MODIS) images from 2000 to 2020 with the Google Earth Engine [20]. The findings revealed that throughout the course of the past 20 years, the northern limit of double crop (NLDC) has usually trended both eastward and southward. The study provided a scientific foundation for the continued expansion and strategic planning for agricultural production in China. Scholars also used Sentinel-1 data with Google Earth Engine to classify croplands [21]. Using the random forest technique, 76.88% accuracy was obtained with a kappa score of 0.728. The study concluded that the Sentinel-1 images are accurate enough for cropland classification and identifying paddy field cropping patterns. Rice area, cropping patterns, and growth stages in Southeast Asia were attempted using Sentinel-1 Time Series on a Google Earth Engine platform [22]. Overall, the rice extent was measured, and a kappa coefficient of 0.92 was achieved. The study concluded that Support Vector Machine (SVM) and Artificial Neural Networks (ANN) outperform the random forest. The authors also suggested that simple and robust technology might be used to replace time-consuming, expensive field surveys across Southeast Asia. A method was developed to use Google Earth Engine and the random forest classifier to create a map of irrigated land [23]. During 2018/19 and 2019/20 winter growing seasons, the Normalized Difference Vegetation Index (NDVI) was subsequently employed to distinguish between irrigated and rain-fed lands. The study incorporated ground-based training samples and Very High-Resolution Images (VHRI). The overall accuracy of classification was 88%. Using deep learning and the Google Earth Engine, a few studies focused on the Sentinel SAR-optical fusion for crop-type mapping [24]. The results demonstrated that integrating multi-temporal SAR and optical data gives overall greater training accuracy for crop-type mapping than either multi-temporal SAR or optical data alone. Application of the Google Earth Engine using Sentinel imagery and neural networks was attempted for crop mapping in Canada [25]. In this study, the Google Earth Engine cloud computing platform was employed for the first time in conjunction with an Artificial Neural Networks (ANN) algorithm using Sentinel-1 and Sentinel-2 images to generate an object-based annual space-based crop inventory map for 2018. The study revealed that further research should be conducted on the proposed cloud computing technology since it is more efficient in terms of cost, time, calculation, and automation. Google Earth Engine cloud computing was also adopted to automate the mapping of Africa’s croplands using satellite imagery [26]. The researchers used a 16-day time series of MODIS NDVI data at a resolution of 250 meters over the whole African continent. The study concluded that MODIS 250-m time-series data could rapidly map cropped areas; however, there are currently inadequate reference data to report trends from these results in a systematic manner. For understanding the temporal dynamics of spatial heterogeneity over agriculture using time-series NDVI, near-infrared and red reflectance of Landsat 8 OLI images were used [27]. The results showed that before planting, the NIR and red variables detect a similar degree of spatial heterogeneity in the cropland, with comparable values of the variability in mean length. The study concluded that the NDVI and NIR values capture a similar spatial heterogeneity, which is modest in comparison to the red band due to the homogeneity of soil and the mean length variability of NDVI, NIR, and red variables tend to be the same as the image pixel size increases. An artificial neural network was developed for the purpose of crop classification by utilizing datasets from the C-band RISAT-1 satellite [28]. The classification results were validated on the ground. The overall accuracy for satellite data acquired in the month of August and September was 74.21 and 77.36 percent, respectively. A scalable parcel-based crop identification technique employing Sentinel-2 data time-series for monitoring the common agricultural policy was developed in segments of Spain [29]. The application of the technique to a Lansat-8 OLI-based equivalent variable space yielded a Cohen’s kappa coefficient of 0.70 for the SVM classification, demonstrating the improved performance of Sentinel-2 for this type of application. The application of Google Earth Engine is not restricted to crop phenology but is used in other dimensions of our environment. Measuring the effect of climate change on rangelands and broad-leaved forests in the Aosta Valley of northwest Italy was attempted for the first time using phonological metrics. The study incorporated the time series MODIS dataset with the CHIRPS collection in the Google Earth Engine platform. The study depicted that between 2000 and 2019, there was an indication of advancement at the start of seasons and a delay at the end of season in terms of vegetation growth. The study also concluded that phonological metrics, evapotranspiration from the vegetation, anomaly in the air temperature, and melting of snow cover experienced considerable changes over time [30]. The application of satellite-based remote sensing for the detection of Urban Heat Islands (UHI) was adopted in the metropolitan city of Turing in a segment of Italy. Landsat 8 data set was used for the time span of 2013 to 2018. In the study, Land Surface Temperature (LST) was measured using Radiative Transfer Equation (RTE), and Land Surface Emissivity was estimated through the NDVI threshold technique. The study concluded that over time, UHIs were more prominent in areas where vegetation cover and availability of water were lower and were higher wherever asphalts and concrete buildings were more prominent [31]. Application of NDVI entropy for modeling of Canine Distemper Virus (CDV) in Wildlife in Northwestern Italy was among few studies where Google Earth Engine was used. In the study, it was found that remote sensing data and its application in Google Earth Engine is valuable in monitoring CDV. The significant relationship between altitude and CDV, along with changes in the NDVI entropy over the time period, was also reported in the study [32]. An innovative approach was adopted for the appraisal of land management practices in a segment of Africa. A geospatial-driven model was proposed to depict a subsistence-based agricultural system as well as business-oriented agricultural system. Sentinel-2 satellite images were used for the classification of land cover. Further, for the depiction of a production system, entropy threshold value-based binary classification was attempted. The study showed that the proposed model was effective and robust in portraying the prevailing land distribution under a varied production system [33].
In the present work, an attempt has been made to depict cropping patterns and cropping intensity in the segment of an arid western plain zone of Rajasthan, India. Google Earth Engine (GEE) was taken as a cloud computing platform for crucial data analysis. Further, it was fused with the GIS platform and supported by ground verification and accuracy assessment.
2. Materials and Methods
2.1. Study Area
The present study area encompasses the entire Churu district in the Indian state of Rajasthan. It covers a total area of 13,835 km2 and stretches from 27°24′ North to 29°00′ North in latitude and from 73°40′ East to 75°41′ East in longitude [34]. Except for the northeast, the study area is surrounded by different districts of Rajasthan. In the west and north, it shares a district boundary with Bikaner and Hanumangarh, while in the southeast, south, and southwest, it is bordered by the Jhunjhunu, Sikar, and Nagaur districts, respectively (Figure 1). In the northeast, it shares the state boundary with Haryana [34]. In terms of its topography, this region may be divided into three distinct sections: the Taal area in the south, the Plains of Matiyars in the north, and the Desert area in the central portion [34]. Agro-climatically the region is categorized as an arid western plain zone of Rajasthan, India [35]. The climate of the arid western plain is characterized by a large seasonal temperature swing, with temperatures reaching as high as 49 degrees Celsius in the summer and as low as −1 degrees Celsius in the winter and typical annual rainfall reaching as low as 350 millimeters [34].
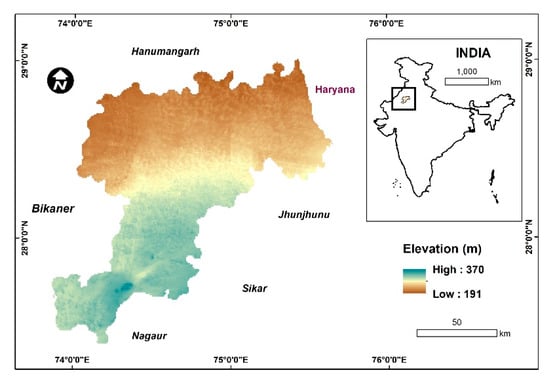
Figure 1.
Location of the study area (Datum: WGS84).
The overall methodology of the present study is illustrated in Figure 2.
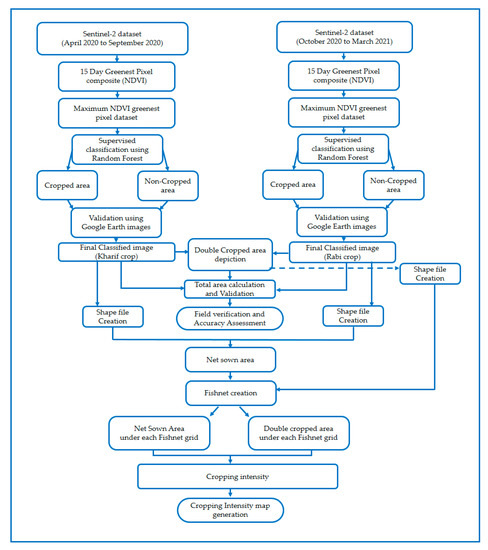
Figure 2.
Workflow.
2.2. Algorithm Execution
The generalized algorithm (Supplementary File S1) of coding performed on Google Earth Engine was executed in the following manner (Figure 3).
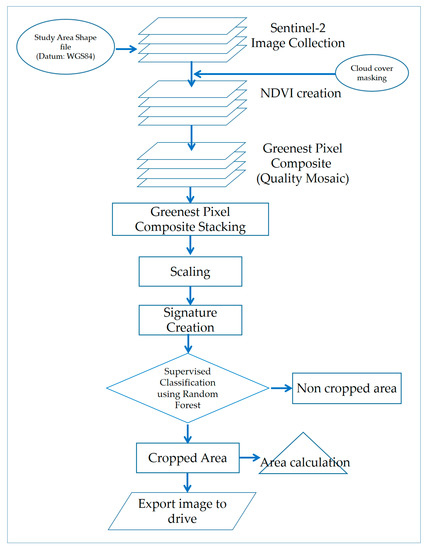
Figure 3.
Algorithm execution.
2.3. Dataset and Pre-Processing
Initially, the shape file of the study area was prepared in the Arc GIS environment from the state map of Rajasthan, Survey of India [36], with the WGS 84 UTM 43N zone projection system and imported into the Google Earth Engine code editor. For the present study, Harmonized Sentinel-2 MSI: Multispectral Instrument, Level-2A collection was used. Sentinel-2 is an imaging mission that supports the Copernicus Land Monitoring studies. These studies include monitoring vegetation, soil, and water cover, as well as the observation of inland waterways and coastal areas. Sentinel-2 has a wide field of view, high resolution, and multiple spectral bands [37]. For the Kharif season, satellite images from April 2020 to September 2020 were considered, while images from October 2020 to March 2021 were selected for the Rabi season. For every 15 days, images were filtered considering less than 10% of cloud cover. The QA band was used to remove cloud cover from the incorporated data [37].
2.4. Vegetation Index Computation
Normalized Difference Vegetation Index or NDVI is one of the important indices, commonly used for the green vegetation. It is a relation between the near-infrared (NIR) band and the red (RED) band. It can be expressed through the following expression (1):
where NDVI represents the Normalized Difference Vegetation Index, represents NIR band and represents the RED band.
The presence of chlorophyll on the leaf and its relation to NDVI is directly related to each other. Hence different phases of the crop’s growth cycle, such as the sowing period, growing period, and harvesting period, can be traced from the close observation of the NDVI reflectance signatures [38,39]. Band information of Sentinel-2 images is given in Table 1. In the present study, Band 8 (Visible and Near Infrared (VNIR)) and Band 4 (RED) were taken into consideration for the generation of NDVI.

Table 1.
Band information of the Sentinel-2 satellite images [37].
2.5. Data Processing
From each of the 15-day filtered data sets, the greenest pixel composite was prepared and incorporated into the individual data sets. All the greenest pixel layers were stacked together and scaled so that the image size and processing time might be reduced. For each of the greenest pixel composites, overall local maxima in the NDVI were identified. In each greenest pixel composite layer, if NDVI is higher than before or after that time, it is considered the peak value. In the present study, during the Kharif time series data set, the peak NDVI was higher than 0.52, while the minimum value was between 0.18 and 0.34. Hence, if the peak NDVI was identified as more than 0.52, it was reaching its maximum growth in the Kharif season. In the similar way, for the Rabi season, the peak NDVI was identified as more than 0.68, and the minimum value was between 0.26 and 0.41. Hence in the Rabi season, the peak NDVI heading toward 0.68 indicated the highest growth stage of crops.
The presence of clouds and atmosphere are major noise sources in the NDVI data sets. For the smoothening of the temporal greenest pixel NDVI curve, the Savitzky–Golay filter (S-G filter) was applied. The filter adopts the local polynomial least square fitting method to smoothen the temporal curve [40]. The S-G filter for the smoothening of multi-temporal NDVI was performed in the Origin software (Figure 4, Figure 5 and Figure 6).
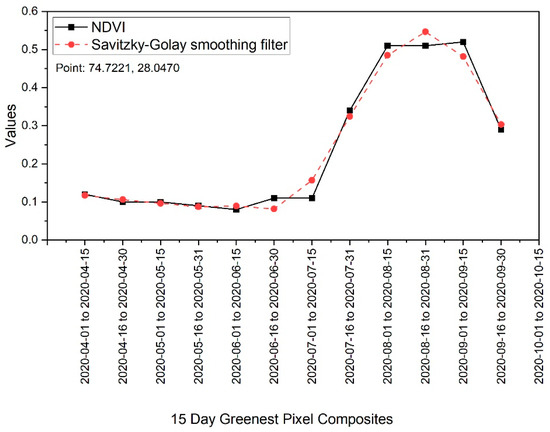
Figure 4.
Kharif season time series NDVI signature.
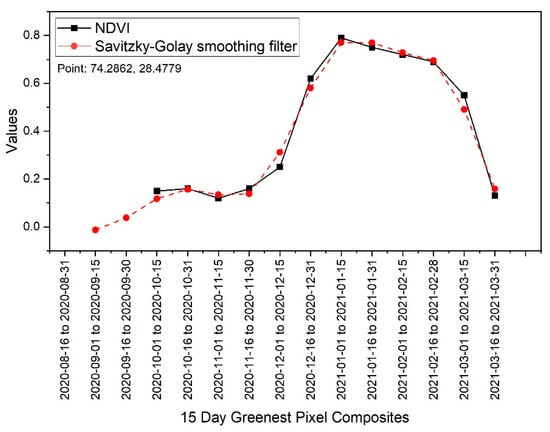
Figure 5.
Rabi season time series NDVI signature.
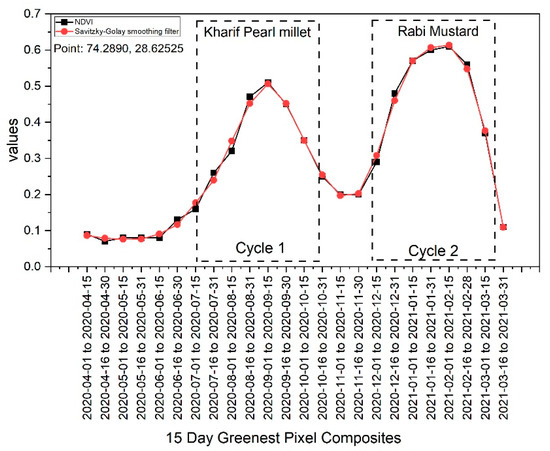
Figure 6.
Double crop time series NDVI signature.
The Savitzky–Golay process can be represented as follows:
where is the reconstructed dataset, is the coefficient of the filter, is the original value, n is the window width, W is the number of data in the moving window (2n + 1). Once the maximum NDVI greenest pixel dataset was identified, cropped areas were depicted, and signatures were generated for the cropped and non-cropped areas, followed by image classification using the random forest technique. After the first iteration of classification, the entire area was thoroughly assessed for misclassification through visual interpretation and validated using Google Earth images. The misclassified pixels were further classified correctly, and the final iteration was processed. The generated classified map also calculated the total cropped area for Kharif and Rabi seasons. The generated classified image was downloaded from the Google Earth Engine code editor. For Kharif and Rabi seasons, a similar process was adopted.
2.6. Cropping Intensity Computation
All the GIS-related operations were done in ArcGIS 10 software. For the Kharif season, a unique field was included in the attribute table with a value of 2 for all the cropped area (polygons) and 0 for the non-cropped area (polygons). In the similar way, for the Rabi season, a unique field was included in the attribute table, and all the cropped areas were assigned a value of 3 and the non-cropped areas as 0. The generated vector layers were in union with each other so that a single vector file could be generated. In the generated vector layer, another column was added, and all the unique values of the Kharif and Rabi seasons were summed together. In this column, all the polygons with value 0 signifed the non-cropped area, 2 depicts the Kharif season crops, 3 shows the Rabi season crop, and 5 depicts double season crops. A separate double-cropped area vector layer was prepared for future use. A 10 km × 10 km fishnet was generated over the final vector layer, and (considered as net sown area) tabulate intersection analysis was processed on the data set to compute the cropped area under each of the fishnet blocks. A similar process was applied to the double-cropped area vector layer. For the computation of the gross cropped area of each of the fishnet blocks, the net sown area of the respective block was added with the area under the double crop of the same fishnet block.
For the calculation of cropping intensity, the following formula was used
For the spatial representation of the cropping intensity, centroids and their corresponding x and y coordinates were generated in each of the fishnet blocks along with respective cropping intensity values. Using Inverse Distance Weighted (IDW) method, a cropping intensity map was generated using five equal class intervals. For the validation of the results and accuracy of the classification, the net sown area was collected from all of the tehsil land record branches of the study area for the year 2020–2021.
3. Results
3.1. Spatial Distribution of Cropping Pattern
In the present study, an algorithm was prepared on Google Earth Engine for the identification of cropping patterns at the spatial resolution of 10 m for the year 2020–2021. From the analysis of satellite images, the calculated area of Kharif, Rabi, and double crops were 8777.6 km2, 3174.2 km2, and 886.6 km2, respectively.
The area calculated accounted for 73.44% and 26.56% of the Kharif and Rabi crops, respectively. Only 7.42% of the total cropped was depicted under the double-cropped area. Geographically, the Kharif crop was most commonly seen in the northeastern, eastern, and entire southern periphery of the study area. On the other hand, the availability of the Kharif crop was relatively lower in the northwestern and southwestern segments (Figure 7). In the case of the Rabi crop, the concentration was significantly lower than it was for the Kharif crop. It was primarily observed in the northwestern and central portions of the region, with a small patch in the northeastern and a few segments in the southwestern part of the region (Figure 8). The double cropping region of the study area was most concentrated in a few pockets in the northeastern segments, a continuous patch in the northeastern portion, and the southwestern periphery of the study area (Figure 9).
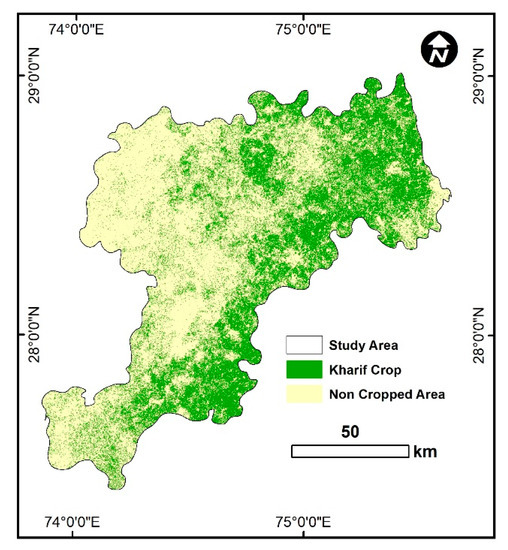
Figure 7.
Kharif crop distribution (Datum: WGS84).
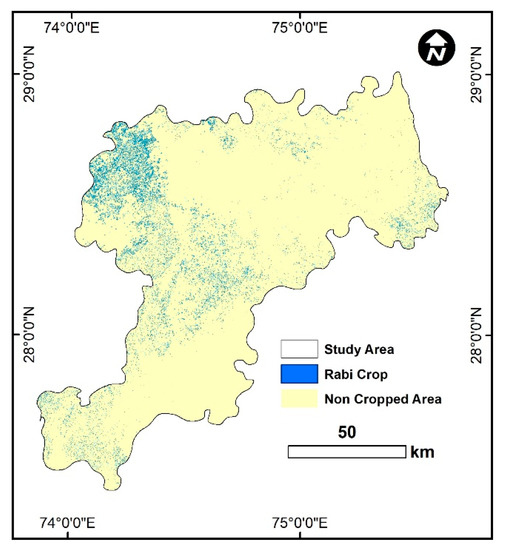
Figure 8.
Rabi crop distribution (Datum: WGS84).
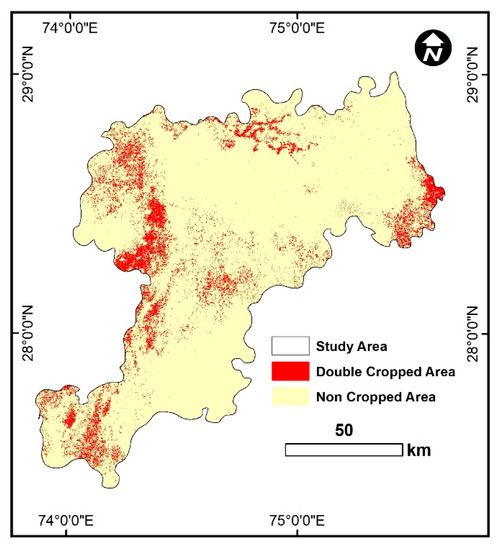
Figure 9.
Double crop distribution (Datum: WGS84).
Two different kinds of ground-based references were collected to validate the cropland extent and the cropping intensity. Information concerning the cropping pattern at the village level and the total area planted with crops was gathered from every tehsil land record office in the study region. The area under Kharif, Rabi, and double crop were compared with the computed values and represented in Figure 10.
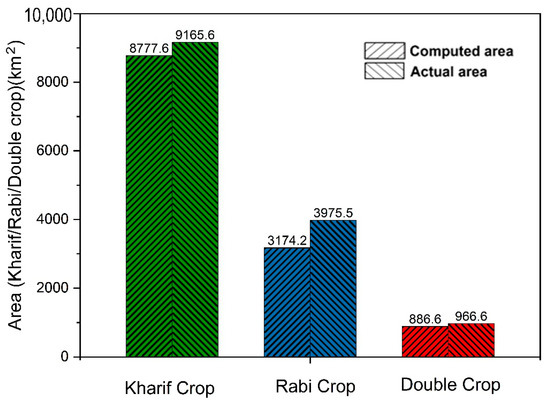
Figure 10.
The area under Kharif, Rabi, and double crop (computed and actual area).
3.2. Spatial Distribution of Cropping Intensity
The spatial distribution of cropping intensity depicted a number of important facts. As shown in Figure 11, the cropping intensity ranged from more than 160% down to less than 115% at its lowest point. The majority of the northwestern, northeastern, and a sizeable portion of the southwestern segments of the study area had a higher percentage of cropping intensity. On the other hand, the majority of the southeastern and north-central portions of the study area were classified as having a low cropping intensity. In order to gain an understanding of the reason behind the depicted cropping intensity and its relation to the cropping pattern, a field visit that was accompanied by a structured questionnaire was carried out. Major crops such as pearl millet, chawala, guar seed, moth, mung bean, sesamum, and groundnut were cultivated during the Kharif season, whereas gram, methi (fenugreek), mustard, and wheat were cultivated during the Rabi season. In the region known for its double cultivation, the majority of the time, either pearl millet (Kharif) was followed by gram (Rabi) or guar seed (Kharif) was followed by mustard. It was found that the cropping pattern and cropping intensity achieved were the outcomes of a collaborative effort on the part of natural and anthropogenic factors. Natural factors such as improved irrigation facilities and favorable soil conditions were considered two of the most important factors. Anthropogenic factors such as market price and demand played a significant role in the decision-making process.
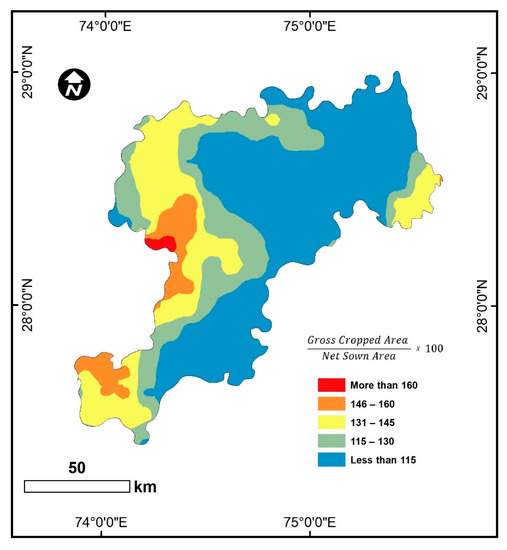
Figure 11.
Cropping intensity map (Datum: WGS84).
4. Discussion
4.1. Accuracy Assessment
In order to evaluate the accuracy of the findings from satellite imagery, a total of 78 samples were selected from the entire study area based on the stratified random sampling technique: 25 for the double crop, 35 for the Kharif crop, and 18 for the Rabi crop (Figure 12). A confusion matrix was built in the Python programming language for the purpose of performing an accuracy evaluation. The confusion matrix (Table 2) demonstrated that the suggested model accurately recognized 19 points for the double crop. However, 1 sample point was incorrectly categorized as Kharif crop, and 5 samples were incorrectly categorized as Rabi crop. In the same manner, out of a total of 35 Kharif sample points, 32 were correctly classified, while one sample was incorrectly labeled as a double crop, and two samples were incorrectly classed as a Rabi crop. In the case of the Rabi crop, only two of the samples were incorrectly identified as the double crop, while the remaining 16 samples were correctly classified. Once the operation was done, physical verification of the locations was conducted along with GPS location marking and field photographs (Figure 13, Figure 14 and Figure 15).
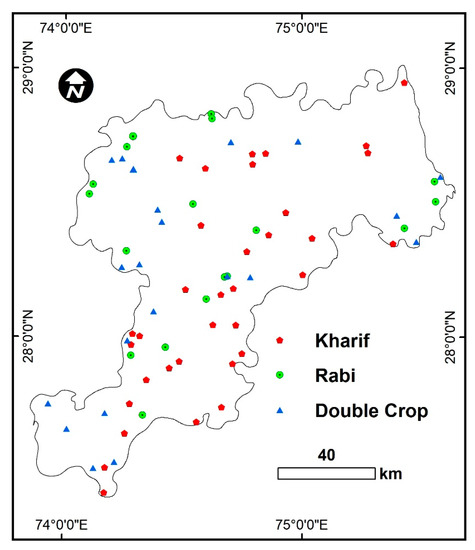
Figure 12.
Ground validation points (Datum: WGS84).

Table 2.
Confusion matrix.
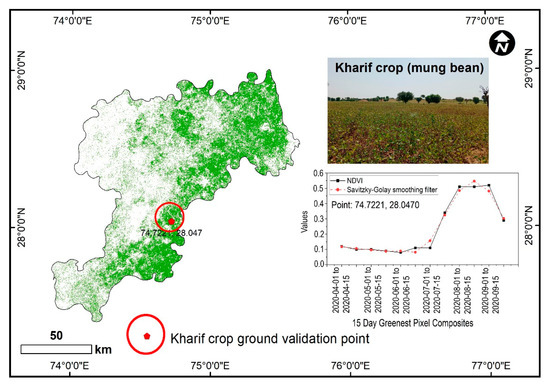
Figure 13.
Kharif crop ground validation point example with photograph (Datum: WGS84).
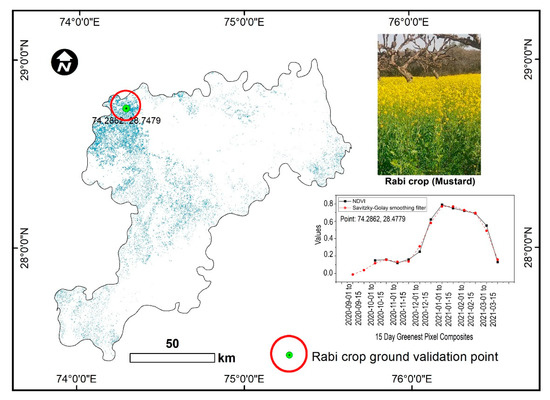
Figure 14.
Rabi crop ground validation point example with photograph (Datum: WGS84).
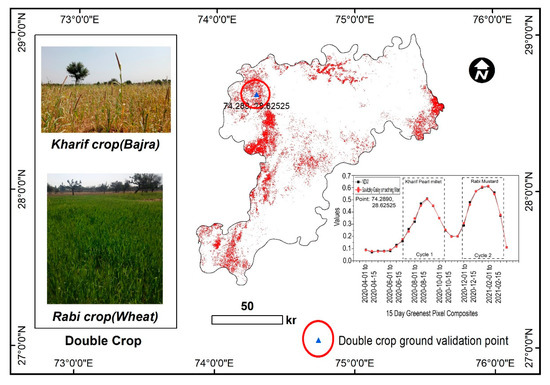
Figure 15.
Double crop ground validation point example with photograph (Datum: WGS84).
The following indices were taken into consideration for the validation.
where TP—True Positive, TN—True Negative, FP—False Positive, FN—False Negative, n is the total number of columns of the confusion matrix; qii is the number of correct classifications of the upper crop-type sample in the i row and i column of the confusion matrix, qi+ and q+i are the total number of crop-type samples in row i and column i, and V is the total number of samples used for verification.
The overall accuracy of all the different crops was 0.90, equivalent to 90%. The Kharif crop showed the highest observed level of precision. In order to illustrate the positive predicted value, precision was determined, and the result was that the overall precision was 0.84, which is equivalent to 84% (Table 3). The precision was found to be highest in the Kharif crop, while it was found to be lowest in the Rabi crop. When attempting to portray sensitivity or the rate of true positives, the recall measure of the confusion matrix is beneficial.

Table 3.
Quality validation.
The overall recall value was 0.85, equivalent to 85%, with the Kharif crop having the highest recall and the double crop having the lowest. The F1 score was taken into consideration to consider both the precision and recall metrics together. The overall recall value was 0.84, equivalent to 84%, and the Kharif crop had the greatest F1 score. The kappa coefficient (κc) of the confusion matrix was 0.784, which can be considered significant.
4.2. Potential Applications of Crop Intensity Map
The entire agricultural system has been subjected to a sizeable amount of change over the past few decades due to changes in socioeconomic conditions, human interference, and climate change. Because of the ever-increasing population, it is becoming extremely difficult for policymakers to meet the growing demand while simultaneously conserving the available land resources. Therefore, optimizing the use of land to its fullest potential is an extremely important component for nations like India in general and the current research area in particular. The availability of a map showing the previous cropping intensity is a fundamental requirement for the planning of an appropriate cropping system. This map can play a key role in maximizing agricultural land utilization in both the present and the future. The traditional census approach of measuring cropping intensity is associated with a restricted spatial extent and a higher cost [41]. Aside from that, the timely availability of the cropping intensity in relation to the spatial extent is a matter of great concern. In the current investigation, we combined geospatial technology and more conventional field surveys to generate the cropping intensity map in a shorter time while maintaining its reliability at a reduced cost.
4.3. Uncertainty
In the current investigation, there are few areas where there is room for uncertainty. As the study area has a considerable spatial extent and is associated with a larger dataset, there is a greater likelihood of overgeneralization. The incorrect classification of pixel values is an important aspect of this problem. If the NDVI value does not reflect a higher value during the peak greenish period of the crop cycle because of spectral or radiometric errors, then there is a greater chance that those pixels will be omitted. The mixed-pixel classification represents another significant component of the geospatial characterization of cropping patterns and intensity. The current study was associated with a very small amount of the natural vegetation, and this vegetation was excluded from the entire process to obtain the final result. However, regions that are associated with a greater proportion of natural vegetation may be subject to challenges regarding the identification and removal of natural vegetation. The resolution of the image that is being used is an important factor to take into consideration. Numerous studies concluded that a resolution of fewer than 30 m on satellite images is insufficient for crop area mapping [15,42,43,44]; consequently, high-resolution images of 10 meters were incorporated into the present investigation. During the field verification, it was found that the field area is also an important component of the overall process, and that it should be selected with great care to achieve the best results. Because the spatial resolution of the satellite images was 10 m, agricultural fields with an area greater than 100 m2 were considered in the present work only.
5. Conclusions
The present-day application of remote sensing in the field of crop phenology demands high-resolution spatio-temporal data. Most of the time, processing such massive amounts of data with a high resolution using conventional geospatial platforms or software is both expensive and time-consuming, as it requires a larger storage capacity and more processing power. The Google Earth Engine (GEE) offers a free cloud computing platform capable of managing and processing significant amounts of satellite image data sets in a relatively shorter time with higher precision. The present study incorporated high-resolution spatio-temporal Sentinel-2 data sets in the Google Earth Engine platform to develop cropping patterns and cropping intensity in association with GIS for 2020–2021 in the segment of Rajasthan. The use of multi-temporal datasets over single satellite images enables advantages like lesser coding, the opportunity of adding more data in the operation, and less time for execution of the entire operation. The method is relatively easy to implement, dependable, and efficient in terms of cost. According to our understanding, applying geospatial techniques in the study area to extract cropping patterns and cropping intensity using the Google Earth Engine is being done for the first time. An overall precision of 84% was achieved by the model that was proposed, with a kappa coefficient of 0.784. Both landowners and agricultural planners will find the current model useful for both the planning of agricultural land use in the present as well as for the future.
Supplementary Materials
The following supporting information can be downloaded at: https://www.mdpi.com/article/10.3390/app122412583/s1.
Author Contributions
Conceptualization, S., T.G., M.M.S.C.-P. and A.G.; Data Curation, S.; Formal analysis, S. and T.G.; Investigation, T.G., M.M.S.C.-P. and K.K.Y.; Methodology, S., T.G., A.G. and K.K.Y.; Project Administration, T.G., A.G., M.A., M.M.S.C.-P. and T.A.; Resources, T.G., T.A., M.A. and M.M.A.; Software, T.G., A.G., M.M.A. and M.M.S.C.-P.; Supervision, T.G. and M.M.S.C.-P.; Validation, S., T.G. and K.K.Y.; Visualization, T.G., K.K.Y. and S.; Funding Acquisition, T.A., M.M.A. and M.A.; writing—original draft, S., T.G. and M.M.S.C.-P.; writing—review and editing, S., T.G., K.K.Y., A.G., T.A., M.M.A. and M.M.S.C.-P. All authors have read and agreed to the published version of the manuscript.
Funding
This research work was funded by the Deanship of Research, King Khalid University, Saudi Arabia, for the Small Research Group under grant number R. G. P. 1/339/1443. The authors gratefully acknowledge Taif University Researchers Supporting Project, number (TURSP-2020/242), Taif University, Taif, Saudi Arabia. The first author is thankful to the University Grants Commission, India (UGC), for granting a fellowship during the completion of the present work as she is a UGC-NET-JRF student.
Institutional Review Board Statement
Not applicable.
Informed Consent Statement
Not applicable.
Data Availability Statement
Not applicable.
Conflicts of Interest
The authors declare no conflict of interest.
References
- Tudi, M.; Daniel Ruan, H.; Wang, L.; Lyu, J.; Sadler, R.; Connell, D.; Phung, D.T. Agriculture development, pesticide application and its impact on the environment. Int. J. Environ. Res. Public Health 2021, 18, 1112. [Google Scholar] [CrossRef] [PubMed]
- Kozak, M.; Pudełko, R. Impact assessment of the long-term fallowed land on agricultural soils and the possibility of their return to agriculture. Agriculture 2021, 11, 148. [Google Scholar] [CrossRef]
- Gupta, M.; Abdelsalam, M.; Khorsandroo, S.; Mittal, S. Security and privacy in smart farming: Challenges and opportunities. IEEE Access 2020, 8, 34564–34584. [Google Scholar] [CrossRef]
- Sanghera, G.S.; Malhotra, P.K.; Singh, H.; Bhatt, R. Climate change impact in sugarcane agriculture and mitigation strategies. Harnessing Plant Biotechnol. Physiol. Stimul. Agric. Growth 2019, 99–115. [Google Scholar]
- Girip, M.; Mărăcine, D.; Dracea, L. Environmental impact of conventional agriculture. Ovidius Univ. Ann. Econ. Sci. Ser. 2020, 20, 372–381. [Google Scholar]
- Farooq, M.; Rehman, A.; Pisante, M. Sustainable Agriculture and Food Security. In Innovations in Sustainable Agriculture; Springer: Cham, Switzerland, 2019; pp. 3–24. [Google Scholar]
- Wang, S.; Hu, Y.; Yuan, R.; Feng, W.; Pan, Y.; Yang, Y. Ensuring water security, food security, and clean water in the North China Plain–conflicting strategies. Curr. Opin. Environ. Sustain. 2019, 40, 63–71. [Google Scholar] [CrossRef]
- Abraham, M.; Pingali, P. Climate Change and Food Security. In Population, Agriculture, and Biodiversity: Problems and Prospects; Gustafson, J.P., Raven, P.H., Ehrlich, P.R., Eds.; University of Missouri Press: Columbia, MO, USA, 2020; p. 97. [Google Scholar]
- Singh, S.K.; Laari, P.B.; Mustak, S.K.; Srivastava, P.K.; Szabó, S. Modelling of land use land cover change using earth observation data-sets of Tons River Basin, Madhya Pradesh, India. Geocarto Int. 2018, 33, 1202–1222. [Google Scholar] [CrossRef]
- Talukdar, S.; Eibek, K.U.; Akhter, S.; Ziaul, S.K.; Islam, A.R.M.T.; Mallick, J. Modeling fragmentation probability of land-use and land-cover using the bagging, random forest and random subspace in the Teesta River Basin, Bangladesh. Ecol. Indic. 2021, 126, 107612. [Google Scholar] [CrossRef]
- Waha, K.; Dietrich, J.P.; Portmann, F.T.; Siebert, S.; Thornton, P.K.; Bondeau, A.; Herrero, M. Multiple cropping systems of the world and the potential for increasing cropping intensity. Glob. Environ. Chang. 2020, 64, 102131. [Google Scholar] [CrossRef]
- Liu, L.; Xiao, X.; Qin, Y.; Wang, J.; Xu, X.; Hu, Y.; Qiao, Z. Mapping cropping intensity in China using time series Landsat and Sentinel-2 images and Google Earth Engine. Remote Sens. Environ. 2020, 239, 111624. [Google Scholar] [CrossRef]
- Hu, Q.; Xiang, M.; Chen, D.; Zhou, J.; Wu, W.; Song, Q. Global cropland intensification surpassed expansion between 2000 and 2010: A spatio-temporal analysis based on GlobeLand30. Sci. Total Environ. 2020, 746, 141035. [Google Scholar] [CrossRef]
- Panigrahy, S.; Sharma, S.A. Crop rotation mapping using multidate IRS digital data. ISPRS J. Photogramm. Remote Sens. 1997, 52, 85–91. [Google Scholar] [CrossRef]
- Xu, Y.; Yu, L.; Peng, D.; Zhao, J.; Cheng, Y.; Liu, X.; Gong, P. Annual 30-m land use/land cover maps of China for 1980–2015 from the integration of AVHRR, MODIS and Landsat data using the BFAST algorithm. Sci. China Earth Sci. 2020, 63, 1390–1407. [Google Scholar] [CrossRef]
- Giordano, S.; Bailly, S.; Landrieu, L.; Chehata, N. Improved crop classification with rotation knowledge using sentinel-1 and-2 time series. Photogramm. Eng. Remote Sens. 2020, 86, 431–441. [Google Scholar] [CrossRef]
- Som-ard, J.; Immitzer, M.; Vuolo, F.; Ninsawat, S.; Atzberger, C. Mapping of crop types in 1989, 1999, 2009 and 2019 to assess major land cover trends of the Udon Thani Province, Thailand. Comput. Electron. Agric. 2022, 198, 107083. [Google Scholar] [CrossRef]
- Bharathkumar, L.; Mohammed-Aslam, M.A. Crop pattern mapping of Tumkur Taluk using NDVI technique: A remote sensing and GIS approach. Aquat. Procedia 2015, 4, 1397–1404. [Google Scholar] [CrossRef]
- Bisht, P.; Kumar, P.; Yadav, M.; Rawat, J.S.; Sharma, M.P.; Hooda, R.S. Spatial dynamics for relative contribution of cropping pattern analysis on environment by integrating remote sensing and GIS. Int. J. Plant Prod. 2014, 8, 1–17. [Google Scholar]
- Guo, Y.; Xia, H.; Pan, L.; Zhao, X.; Li, R. Mapping the northern limit of double cropping using a phenology-based algorithm and Google Earth Engine. Remote Sens. 2022, 14, 1004. [Google Scholar] [CrossRef]
- Mirelva, P.R.; Nagasawa, R. Application of Sentinel-1 Data for Classifying Croplands Using Google Earth Engine. Int. J. Geoinform. 2019, 15, 21–31. [Google Scholar]
- Minasny, B.; Shah, R.M.; Che Soh, N.; Arif, C.; Indra Setiawan, B. Automated near-real-time mapping and monitoring of rice extent, cropping patterns, and growth stages in Southeast Asia using Sentinel-1 time series on a Google Earth Engine platform. Remote Sens. 2019, 11, 1666. [Google Scholar]
- Magidi, J.; Nhamo, L.; Mpandeli, S.; Mabhaudhi, T. Application of the random forest classifier to map irrigated areas using google earth engine. Remote Sens. 2021, 13, 876. [Google Scholar] [CrossRef]
- Adrian, J.; Sagan, V.; Maimaitijiang, M. Sentinel SAR-optical fusion for crop type mapping using deep learning and Google Earth Engine. ISPRS J. Photogramm. Remote Sens. 2021, 175, 215–235. [Google Scholar] [CrossRef]
- Amani, M.; Kakooei, M.; Moghimi, A.; Ghorbanian, A.; Ranjgar, B.; Mahdavi, S.; Mohammadzadeh, A. Application of google earth engine cloud computing platform, sentinel imagery, and neural networks for crop mapping in Canada. Remote Sens. 2020, 12, 3561. [Google Scholar] [CrossRef]
- Xiong, J.; Thenkabail, P.S.; Gumma, M.K.; Teluguntla, P.; Poehnelt, J.; Congalton, R.G.; Thau, D. Automated cropland mapping of continental Africa using Google Earth Engine cloud computing. ISPRS J. Photogramm. Remote Sens. 2017, 126, 225–244. [Google Scholar] [CrossRef]
- Ding, Y.; Zhao, K.; Zheng, X.; Jiang, T. Temporal dynamics of spatial heterogeneity over cropland quantified by time-series NDVI, near infrared and red reflectance of Landsat 8 OLI imagery. Int. J. Appl. Earth Obs. Geoinf. 2014, 30, 139–145. [Google Scholar] [CrossRef]
- Kumar, P.; Prasad, R.; Mishra, V.N.; Gupta, D.K.; Singh, S.K. Artificial neural network for crop classification using C-band RISAT-1 satellite datasets. Russ. Agric. Sci. 2016, 42, 281–284. [Google Scholar] [CrossRef]
- Sitokonstantinou, V.; Papoutsis, I.; Kontoes, C.; Lafarga Arnal, A.; Armesto Andrés, A.P.; Garraza Zurbano, J.A. Scalable parcel-based crop identification scheme using Sentinel-2 data time-series for the monitoring of the common agricultural policy. Remote Sens. 2018, 10, 911. [Google Scholar] [CrossRef]
- Orusa, T.; Borgogno Mondino, E. Exploring Short-term climate change effects on rangelands and broad-leaved forests by free satellite data in Aosta Valley (Northwest Italy). Climate 2021, 9, 47. [Google Scholar] [CrossRef]
- Orusa, T.; Mondino, E.B. Landsat 8 thermal data to support urban management and planning in the climate change era: A case study in Torino area, NW Italy. In Remote Sensing Technologies and Applications in Urban Environments IV; SPIE: Bellingham, WA, USA, 2019; Volume 11157, pp. 133–149. [Google Scholar]
- Carella, E.; Orusa, T.; Viani, A.; Meloni, D.; Borgogno-Mondino, E.; Orusa, R. An Integrated, Tentative Remote-Sensing Approach Based on NDVI Entropy to Model Canine Distemper Virus in Wildlife and to Prompt Science-Based Management Policies. Animals 2022, 12, 1049. [Google Scholar] [CrossRef]
- De Marinis, P.; De Petris, S.; Sarvia, F.; Manfron, G.; Momo, E.J.; Orusa, T.; Borgogno, E.M. Supporting Pro-Poor Reforms of Agricultural Systems in Eastern DRC (Africa) with Remotely Sensed Data: A Possible Contribution of Spatial Entropy to Interpret Land Management Practices. Land 2021, 10, 1368. [Google Scholar] [CrossRef]
- District Census Handbook. Village and Town Directory; Part XII-A & B, Series-9; Directorate of Census Operations: Churu, India, 2016.
- Moharana, P.C.; Santra, P.; Singh, D.V.; Kumar, S.; Goyal, R.K.; Machiwal, D.; Yadav, O.P. ICAR-Central Arid Zone Research Institute, Jodhpur: Erosion Processes and Desertification in the Thar Desert of India. Proc. Indian Natl. Sci. Acad. 2016, 82, 1117–1140. [Google Scholar] [CrossRef]
- Survey of India: State Map of Rajasthan. Available online: https://surveyofindia.gov.in/files/Raj_State_Map.pdf (accessed on 12 October 2022).
- Earth Engine Data Catalog: Harmonized Sentinel-2 MSI: MultiSpectral Instrument, Level-2A. Available online: https://developers.google.com/earth-engine/datasets/catalog/COPERNICUS_S2_SR_HARMONIZED#bands (accessed on 15 October 2022).
- Wang, R.; Cherkauer, K.; Bowling, L. Corn response to climate stress detected with satellite-based NDVI time series. Remote Sens. 2016, 8, 269. [Google Scholar] [CrossRef]
- Zheng, H.; Cheng, T.; Yao, X.; Deng, X.; Tian, Y.; Cao, W.; Zhu, Y. Detection of rice phenology through time series analysis of ground-based spectral index data. Field Crops Res. 2016, 198, 131–139. [Google Scholar] [CrossRef]
- Savitzky, A.; Golay, M.J. Smoothing and differentiation of data by simplified least squares procedures. Anal. Chem. 1964, 36, 1627–1639. [Google Scholar] [CrossRef]
- Zhang, D.; Pan, Y.; Zhang, J.; Hu, T.; Zhao, J.; Li, N.; Chen, Q. A generalized approach based on convolutional neural networks for large area cropland mapping at very high resolution. Remote Sens. Environ. 2020, 247, 111912. [Google Scholar] [CrossRef]
- Razali, S.M.; Marin, A.; Nuruddin, A.A.; Shafri, H.Z.M.; Hamid, H.A. Capability of integrated MODIS imagery and ALOS for oil palm, rubber and forest areas mapping in tropical forest regions. Sensors 2014, 14, 8259–8282. [Google Scholar] [CrossRef]
- Kwak, G.H.; Park, C.W.; Lee, K.D.; Na, S.I.; Ahn, H.Y.; Park, N.W. Potential of hybrid CNN-RF model for early crop mapping with limited input data. Remote Sens. 2021, 13, 1629. [Google Scholar] [CrossRef]
- Pan, L.; Xia, H.; Yang, J.; Niu, W.; Wang, R.; Song, H.; Qin, Y. Mapping cropping intensity in Huaihe basin using phenology algorithm, all Sentinel-2 and Landsat images in Google Earth Engine. Int. J. Appl. Earth Obs. Geoinf. 2021, 102, 102376. [Google Scholar] [CrossRef]
Publisher’s Note: MDPI stays neutral with regard to jurisdictional claims in published maps and institutional affiliations. |
© 2022 by the authors. Licensee MDPI, Basel, Switzerland. This article is an open access article distributed under the terms and conditions of the Creative Commons Attribution (CC BY) license (https://creativecommons.org/licenses/by/4.0/).